
Quarterly Financial Report for the Quarter Ended
December 31, 2024
About this publication
Publication author: Canada Economic Development for Quebec Regions
ISSN: 2368-6545
ISBN/Catalogue : Iu90-1/19E-PDF
Publish date: February 25, 2025
Table of contents
- Introduction
- Highlights of Fiscal Quarter and Fiscal Year-to-Date Results
- Risks and Uncertainties
- Significant Changes to Operations, Personnel and Programs
- Approval by Senior Officials
- Appendices
1. Introduction
This quarterly financial report has been prepared by Canada Economic Development for Quebec Regions (CED) as required under section 65.1 of the Financial Administration Act and in the form and manner prescribed by the Treasury Board.
This report should be read in conjunction with the 2024–2025 Estimates and the 2024–2025 Departmental Plan.
This document has not been subject to external audit or review.
1.1 Authorities, mandate and programs
The mission of Canada Economic Development for Quebec Regions (CED) is to promote the long-term economic development of the regions of Quebec by giving special attention to those where slow economic growth is prevalent or opportunities for productive employment are inadequate.
CED is the key federal player in Quebec for the promotion of economic development in the regions and among small and medium-sized businesses (SMEs). To achieve its core responsibility, which consists of developing the Quebec economy, CED fosters business startups and performance. It helps businesses become more innovative and enhance their productivity and competitiveness. It also supports community engagement efforts in the various regions of Quebec and helps attract investments designed to boost the economic prosperity of Quebec and Canada.
CED contributes to the economic vitality of all regions of Quebec by leveraging their regional competitive advantages . It supports the transition and diversification of communities that remain dependent on a limited number of sectors, or that have been affected by an economic shock, such as the closure of the chrysotile mines.
CED achieves its results by supporting businesses —primarily SMEs —and non-profit organizations (NPOs) through strategic investments. With the help of its 12 business offices located in the various regions of Quebec, and relying on the ties it has developed with the other economic development players, CED stays abreast of the needs of the regions and businesses and is able to provide funding for projects that support the development of businesses and communities .
CED has three categories of programs that support its core responsibility:
- Regional Innovation
- Community Vitality
- Targeted or Temporary Support
Additional information about CED’s authority, mandate and programs can be found in the 2024–2025 Estimates and the 2024–2025 Departmental Plan.
1.2 Basis of presentation
This quarterly report was prepared by CED using an expenditure basis of accounting. The accompanying Statement of Authorities includes CED’s spending authorities granted by Parliament and used by CED, consistent with the 2024–2025 Main Estimates. This quarterly report was prepared using a special-purpose financial reporting framework designed to meet financial information needs regarding the use of spending authorities.
Prior authority from Parliament is required before funds can be spent by the Government. Authorities available for use are given in the form of annually approved limits through appropriation acts or through legislation in the form of statutory authority for specific purposes.
When Parliament is dissolved for the purposes of a general election, section 30 of the Financial Administration Act gives the Governor General the power, under certain conditions, to issue a special warrant authorizing the government to withdraw funds from the Consolidated Revenue Fund. A special warrant is deemed to be an appropriation for the fiscal year in which it is issued.
CED uses the full accrual method of accounting to prepare and present its annual financial statements that make up part of the departmental results reporting process. However, the spending authorities voted by Parliament remain on an expenditure basis of accounting.
1.3 Financial structure of Canada Economic Development for Quebec Regions (CED)
CED manages its expenditures under two annual votes:
- Vote 1 – Net operating expenditures, which includes CED authorities related to personnel costs and operating and maintenance expenditures
- Vote 5 – Grants and contributions, which includes all authorities related to transfer payments
Expenses under budgetary statutory authorities, for which payments are made under legislation previously approved by Parliament and which are not part of the annual appropriations bills, include items such as the employer’s share of the employee benefit plan.
2. Highlights of fiscal quarter and fiscal year-to-date results
This section presents a variety of financial information as at December 31, 2024, including the authorities available for the year and expenditures incurred during the third quarter, as compared with the previous fiscal year.
The explanation of variances is based on the premise that discrepancies of less than 5% have a minimal impact on the interpretation of results.
The details of this financial information are provided in sections 2.1, 2.2 and in the tables in the Appendix.
2.1 Analysis of authorities
Authorities as at December 31, 2024, totalled $337.3M, compared with $590.8M as at December 31, 2023.
This year’s variance of $253.5M (-42.9%) is due to the following changes:
- Vote 1 – Net operating expenditures: -$2.9M
- Vote 5 – Grants and contributions: -$250.3M
- Budgetary statutory authorities: -$0.3M
NB: Totals in the report may not add up due to rounding.
The chart below shows the annual budgetary appropriation authorities as at December 31, 2024, compared with the previous fiscal year.
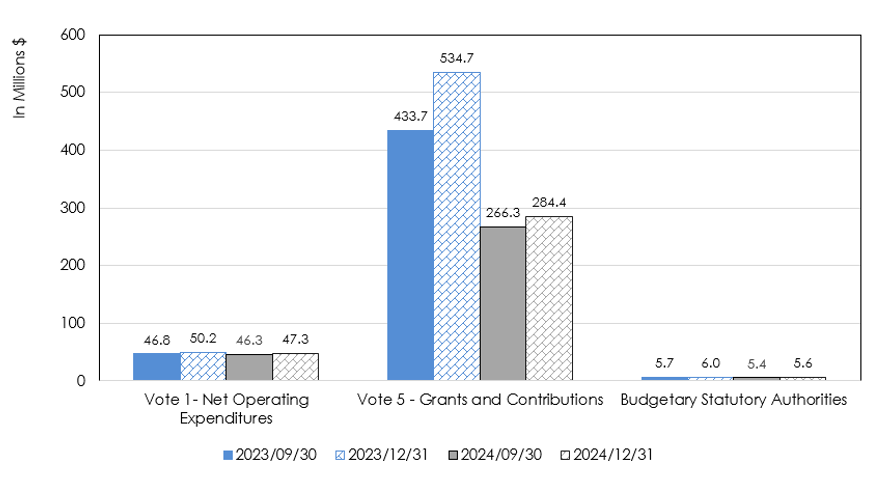
Image 1 - Text Version:
Analysis of annual budgetary appropriation authorities: subdivided into three sections, this graph provides an overview of net available budgetary authorities (Vote 1 – Net Operating Expenditures; Vote 5 – Grants and Contributions; and Budgetary Statutory Authorities) as at September 30 and as at December 31st, 2024, including a comparison as at September 30 and as at December 31st, 2023.
As at December 31st, 2024, annual authorities under Vote 1 – Net Operating Expenditures, Vote 5 – Grants and Contributions, and Budgetary Statutory Authorities, totalled $47.3M ($50.2M in 2023–2024); $284.4M ($534.7M in 2023–2024); and $5.6M ($6.0M in 2023–2024), respectively.
As at September 30, 2024, annual authorities under Vote 1 – Net Operating Expenditures, Vote 5 – Grants and Contributions, and Budgetary Statutory Authorities, totalled $46.3M ($46.8M in 2023–2024); $266.3M ($433.7M in 2023–2024); and $5.4M ($5.7M in 2023–2024), respectively.
Vote 1 authorities (Net operating expenditures)
As at December 31, 2024, authorities totalled $47.3M, compared with $50.2M as at December 31, 2023. This represents a decrease of $2.9M (-5.8%) this year.
This decrease in available operating credits can be attributed to the end of funding for the economic recovery initiatives. In order to stabilize the workforce and ensure monitoring and other essential activities required to complete the emergency and recovery initiatives, a grant and contribution credit transfer was authorized in 2023–2024 to cover operational requirements. This year’s credit associated with the transfer are lower than in the previous year.Vote 5 authorities (Grants and contributions)
As at December 31, 2024, authorities totalled $284.4M, compared with $534.7M as at December 31, 2023. This represents a decrease of $250.3M (-46.8%) this year.
This variance stems from a number of items, some of which varied upward, others downward, amounting in a net decrease of $250.3M:
- Increase in funding (+$15.9M)
- End of the transfer for the Quebec Fisheries Fund to Fisheries and Oceans Canada: +$6.0M
- Tourism Growth Program: +$4.7M
- Support for Regional Quantum Innovation: +$3.5M
- Miscellaneous items: +$1.7M
- Decrease in or end of funding for various initiatives (-$266.2M)
- Aerospace Regional Recovery Initiative: -$58.9M
- Jobs and Growth Fund: -$57.9M
- Canada Community Revitalization Fund: -$57.5M
- Major Festivals and Events Support Initiative: -$42.6M
- Tourism Relief Fund: -$22.5M
- Initiative for the development of regional economic infrastructure in Quebec: -$21.5M
- Hurricane Fiona Recovery Fund: -$5.3M
Budgetary statutory authorities
As at December 31, 2024, authorities totalled $5.6M, compared with $6.0M as at December 31, 2023. The decrease of $0.4M (-6.7%) can be attributed to the reduction in credits for the employee benefit plan as a result of the reduction in the salary envelope.
2.2 Analysis of expenditures
CED expenditures in the third quarter of 2024–2025 totalled $88.8M, compared with $121.3M for the same period last year. This represents a net year-over-year decrease of $32.5M (-26.8%).
This variance can be broken down as follows:
- Vote 1 – Net operating expenditures: -$1.4M
- Vote 5 – Grants and contributions: -$31.5M
- Budgetary statutory authorities: +$0.4M
On a cumulative basis as at December 31, 2024, expenditures amounted to $195.3M, compared with $238.7M for the same period a year ago. This represents a decrease of $43.4M (-18.2%) this year.
This variance can be broken down as follows:
- Vote 5 – Grants and contributions: -$43.6M
- Budgetary statutory authorities: +$0.2M
The chart below shows expenditures in the third quarter of 2024–2025 by budgetary appropriation, compared with the previous fiscal year.
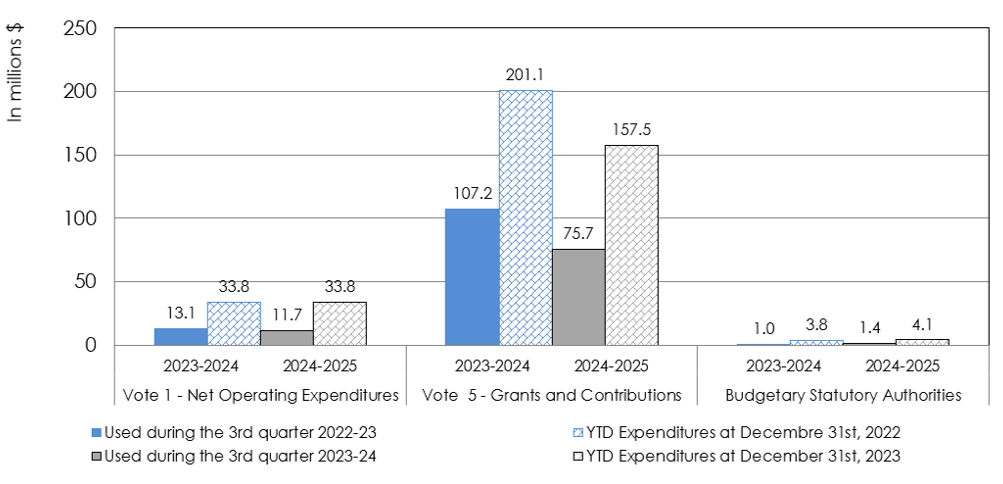
Image 2 - Text Version
Analysis of third quarter expenditures and presentation of year-to-date expenditures by budgetary appropriation as at December 31st, fiscal year 2024–2025, compared with 2023 2024: subdivided into three sections, namely Vote 1 – Net Operating Expenditures, Vote 5 – Grants and Contributions, and Budgetary Statutory Authorities. This graph shows expenditures incurred during the third quarter of 2024–2025, as well as year-to-date expenditures as at September 30, 2024, and includes a comparison with fiscal year 2023–2024.
In the third quarter of 2024–2025, expenditures under Vote 1 (Net Operating Expenditures), Vote 5 (Grants and Contributions), and Budgetary Statutory Authorities, amounted to $11.7M ($13.1M in 2023–2024); $75.7M ($107.2M in 2023–2024); and $1.4M ($1.0M in 2023–2024), respectively.
Year-to-date expenditures as at December 31st, 2024, under Vote 1 (Net Operating Expenditures), Vote 5 (Grants and Contributions), and Budgetary Statutory Authorities, totalled $33.8M ($33.8M in 2023–2024); $157.5M ($201.1M in 2023–2024); and $4.1M ($3.8M in 2023–2024), respectively.
Vote 1 expenditures (Net operating expenditures)
CED’s net operating expenditures for the third quarter of 2024–2025 totalled $11.7M, compared with $13.1M in 2023–2024. This represents a decrease of $1.4M (-10.7%) this year.
The ratification of a number of collective agreements in the third quarter of 2023–2024 led to increased operating expenditures. The decrease in net operating expenses in the third quarter of this year can also be explained by savings in expenditures for professional services resulting from the repatriation of in-house expertise for the business information service in mid–2023-2024.
Cumulative expenditures totalled $33.8M as at December 31, 2024, the same as in the previous year.
(For further details on these expenditures, see the table entitled “Departmental budgetary expenditures by standard object” in Appendix 6.2.)
Vote 5 expenditures (Grants and contributions)
Grant and contribution expenditures for the third quarter of 2024–2025 totalled $75.7M, compared with $107.2M in 2023–2024, for a net year-over-year decrease of $31.5M (-29.4%).
In the third quarter, spending on CED’s regular programs and temporary targeted initiatives increased, but was offset by a decrease in spending associated with the end, on March 31, 2024, of the economic recovery programs, resulting in a net decrease of $31.5M:
- Regular programs (+$6.8M):
- Community Futures Program (CFP): +$5.6M
- Regional Economic Growth through Innovation (REGI): +$2.4M
- Quebec Economic Development Program (QEDP): -$1.2M
- Temporary targeted initiatives (+$2.0M):
- Tourism Growth Program: +$2.2M
- Support for Regional Quantum Innovation: +$1.3M
- Black Entrepreneurship Program: -$1.0M
- Hurricane Fiona Recovery Fund: -$0.5M
- End of economic recovery programs on March 31, 2024 (-$40.3M):
- Jobs and Growth Fund: -$13.2M
- Aerospace Regional Recovery Initiative: -$11.3M
- Canada Community Revitalization Fund: -$8.6M
- Major Festivals and Events Support Initiative: -$4.4M
- Initiative for the development of regional economic infrastructure in Quebec: -$1.6M
- Tourism Relief Fund: -$1.2M
On a cumulative basis as at December 31, 2024, expenditures totalled $157.5M, compared with $201.1M as at December 31, 2023, for a year-over-year decrease of a $43.6M (-21.7%). As previously indicated, the marked decrease in cumulative spending for 2024–2025 is explained by the end of the economic recovery initiatives on March 31, 2024. However, this decline was offset to a certain extent by an increase in spending on regular programs.
Expenditures under budgetary statutory authorities
Spending on statutory authorities in the third quarter of 2024–2025 totalled $1.4M, compared with $1.0M as at December 31, 2023, a year-over-year increase of $0.4M (40.0%).
This variance is mainly a result of differences in the demarcation of periods between the two years. An employee benefit remittance for the third quarter of 2023–2024 was made in January of that year, whereas in the current year it was made in December. Putting aside the variance with respect to the demarcation of periods, a decrease in spending on statutory authorities (-5.1%) is observed, both for the quarter ending December 31, 2024, as well as cumulatively, as a result of the decrease in employee benefit plan expenditures further to the decrease in the salary envelope.
Cumulative expenditures as at December 31, 2024, stood at $4.1M and consisted solely of employee benefit plan remittances. As at December 31, 2023, expenditures totalled $3.8M, for a variance of $0.3M (7.9%), the reason for which has been explained above.
(For further details on these expenditures, see the table entitled “Departmental budgetary expenditures by standard object” in Appendix 6.2.)
3. Risks and uncertainties
In the current context, particularly the global economic situation and changes in federal and provincial programs for SMEs, the challenges facing CED's clientele are intensifying. This situation could exceed CED's capacity to intervene effectively across the entire projects’ continuum.
To meet these challenges, CED will continue to adopt strategies adapted to regional realities, while maintaining agile implementation of its regular programs to meet emerging needs. CED will also continue to work closely with its partners and other levels of government to strengthen their capacity to identify and carry out strategic projects. Finally, through its 12 regional business offices and its integrated approach to information, support and follow-up of investments, CED will support businesses and communities in the development and diversification of Quebec's regional economies.
Information technology security
With the number and sophistication of cyberthreats on the rise in Canada, public organizations remain prime targets. Consequently, there is a risk that an information technology security incident could disrupt CED's operations and damage its reputation.
In order to mitigate these risks, CED will continue to use active cybersecurity measures, including raising awareness and reinforcing training among personnel to better equip and prepare them to adopt the right reflexes when faced with situations presenting cybersecurity issues, as well as the deployment of technical controls to prevent and detect incidents.
4. Significant changes to operations, personnel, and programs
The most noteworthy change for CED in 2024–2025 stems from the end, on March 31, 2024, of the economic recovery initiatives announced in Budget 2021. These initiatives made up the bulk of temporary and targeted initiative budgets and spending. CED is now returning to pre-pandemic budget levels as it deals with a significant reduction in these grant and contribution budgets.
In addition, CED is continuing its efforts as part of the Refocusing Government Spending exercise, announced in Budget 2023, by reducing its spending on travel and professional services.
Following the departure of Minister Soraya Martinez Ferrada, Prime Minister Justin Trudeau named Pascale St-Onge as acting Minister of Tourism and Minister responsible for the Economic Development Agency of Canada for the Regions of Quebec starting February 6, 2025.
5. Approval by Senior Officials
The purpose of this section is to provide the approval of senior officials, as required by the Policy on Financial Management, as follows:
Approved by :
_____________________________________
Sony Perron
Deputy Minister / President
Montréal, Canada
__________________________________
Maxime Garon
Chief Financial Officer
Montréal, Canada
6. Appendices
6.1 Statement of authorities (unaudited)
| Total available for use for the year ended March 31, 2025* | Used during the quarter ended December 31, 2024 | Year-to-date used at quarter-end | |
|---|---|---|---|
| Vote 1 – Net Operating expenditures | 47,249 | 11,740 | 33,801 |
| Vote 5 – Grants and contributions | 284,428 | 75,684 | 157,455 |
| Total budgetary statutory authorities | 5,616 | 1,360 | 4,080 |
| Total authorities | 337,293 | 88,784 | 195,336 |
| Total available for use for the year ended March 31, 2024* | Used during the quarter ended December 31, 2023 | Year-to-date used at quarter-end | |
|---|---|---|---|
| Vote 1 – Net Operating expenditures | 50,152 | 13,105 | 33,805 |
| Vote 5 – Grants and contributions | 534,745 | 107,218 | 201,059 |
| Total budgetary statutory authorities | 5,967 | 956 | 3,823 |
| Total authorities | 590,864 | 121,279 | 238,687 |
| * Includes only authorities available for use and granted by Parliament at quarter-end. | |||
6.2 Departmental budgetary expenditures by standard object (unaudited)
| Planned expenditures for the year ended March 31, 2025 | Expenditures during the quarter ended December 31, 2024 | Year-to-date used at quarter-end | |
|---|---|---|---|
| Expenses: | |||
| Personnel* | 47,771 | 11,511 | 34,257 |
| Transport and communications | 345 | 174 | 633 |
| Information | 221 | 25 | 131 |
| Professional and special services | 3,029 | 627 | 1,211 |
| Leasing | 773 | 552 | 1,034 |
| Repairs and maintenance | 19 | 89 | 116 |
| Public utilities, materials and supplies | 59 | 24 | 64 |
| Acquisition of land and buildings, and works | 0 | 0 | 0 |
| Acquisition of machinery and equipment | 648 | 112 | 391 |
| Transfer payments | 284,428 | 75,684 | 157,455 |
| Other grants and payments | 0 | -14 | 44 |
| Total net budgetary expenditures | 337,293 | 88,784 | 195,336 |
| * Includes employee benefit plans (EBPs). | |||
| Planned expenditures for the year ended March 31, 2024 | Expenditures during the quarter ended December 31, 2023 | Year-to-date used at quarter-end | |
|---|---|---|---|
| Expenses: | |||
| Personnel* | 48,834 | 12,341 | 33,150 |
| Transport and communications | 354 | 201 | 598 |
| Information | 307 | 110 | 202 |
| Professional and special services | 4,603 | 772 | 2,360 |
| Rentals | 884 | 432 | 1,007 |
| Repairs and maintenance | 28 | 18 | 49 |
| Public utilities, materials and supplies | 102 | 38 | 64 |
| Acquisition of land and buildings, and works | 0 | 0 | 0 |
| Acquisition of machinery and equipment | 1,007 | 55 | 124 |
| Transfer payments | 534,745 | 107,218 | 201,059 |
| Other grants and payments | 0 | 94 | 74 |
| Total net budgetary expenditures | 590,864 | 121,279 | 238,687 |
| * Includes employee benefit plans (EBPs). | |||