
Briefing materials for the Minister of Jobs and Families, May 2025
Information supplied to the Minister of Jobs and Families, as of May 2025.
On this page
1. Letter from DM to Minister Patty Hajdu
Dear Minister:
Congratulations on your appointment as Minister of Jobs and Families and Minister responsible for the Federal Economic Development Agency for Northern Ontario and welcome back to the Employment and Social Development Canada (ESDC) portfolio. I look forward to working with you to advance the Government's priorities.
The ESDC portfolio, including Service Canada and the Labour Program, plays a pivotal role in shaping policies and programs that impact Canadians throughout their lives. From early childhood education and care, post-secondary education, youth transitioning into the workforce, fair and safe workplaces, navigating job loss and re-training, and living well in retirement, ESDC provides essential programs and services that help Canadians achieve their full potential and support the economy.
With its broad mandate, the Department is at the forefront of a number of public policy challenges impacting Canadians, now and in the future. Most recently, the Employment Insurance program in particular has been central to the federal government's response to United States tariffs on Canadian imports and will continue to help Canada weather this and any other economic disruptions. Looking forward, continued geopolitical tensions, an aging population, the emergence of new technologies and artificial intelligence, tensions in the federation, potential labour disruptions, and Canadians' expectations for modern and accessible services will continue to present challenges and opportunities for the Department and the Government of Canada more broadly.
The Labour Program, in particular, oversees ongoing labour matters that touch on labour relations, occupational health and safety, labour standards, employment equity, pay equity, the Wage Earner Protection Program, workers' compensation for government employees, and intergovernmental and international labour affairs. These areas are governed by legislation and associated regulations, applying to employers and employees within federally regulated sectors such as railways, airlines and airports, ports, banks, telecommunications, broadcasting, and postal services.
ESDC's Associate Deputy Ministers and I will be your primary source of non-partisan advice and professional expertise to help you navigate these and other issues that fall under your portfolio. We are your principal point of contact, providing a gateway into the Department and supporting you on policy development and program administration, and delivery of benefits and services.
Early briefings and priorities
In the coming days, departmental officials and I will be offering briefings to you on topics relevant to the ESDC portfolio and your mandate. These briefings will include a mix of program-specific briefs along with broader cross-cutting briefs. In addition to familiarizing you with the work of the Department, these briefings will be designed to help facilitate some early decisions that will be needed and engagement of key stakeholders. I would also be pleased to offer you any briefings that reflect your interests and priorities.
In the coming days and weeks, the Department would also be pleased to provide you with advice on the implementation of Government and election commitments that are specific to your portfolio, which could serve to help prepare for the submission of your proposals for Budget 2025.
The Department also looks forward to supporting you in discussions on commitments led by your ministerial colleagues but which could implicate your portfolio.
Operating context
ESDC's operating context is complex. During the COVID-19 pandemic, the Department's programs and services rapidly expanded to ensure Canadians' needs were met. Beyond the pandemic, in recent years, ESDC has also added many new programs and responsibilities such as Early Learning and Child Care, the Canada Disability Benefit, delivery of the Canadian Dental Care Plan, the Canada Digital Service, and the Anti-Racism Secretariat. In response to this unprecedented growth, ESDC is currently transforming its business practices to ensure it has a sustainable business model that continues to meet the needs of Canadians, including by increasing the adoption of new technologies such as artificial intelligence. This transformation will also position ESDC to effectively contribute to the platform commitment to review government spending.
ESDC is actively working to replace the aging IT infrastructure that underpins the delivery of financial support to millions of Canadians through programs such as Old Age Security (OAS), Employment Insurance (EI) and the Canadian Pension Plan (CPP).
As part of the solution to modernize its systems, ESDC launched a new benefits payment system for OAS on April 28, 2025. This system streamlines the entire benefit process, from client intake to payment, for both OAS and the Guaranteed Income Supplement. This accomplishment positions the program very well to drive considerable service improvements and productivity gains.
The next phase of work to modernize the EI system has already begun financed from the EI Operating Account with considerable potential to streamline and improve the delivery of the EI program, ensuring it meets the evolving needs of Canadians. In parallel to the iterative introduction of EI benefits on the new platform, we will begin the planning work to onboard CPP funded out of the CPP Operating Account.
While the Department continues to implement the new IT system to deliver these benefits, the legacy systems for EI, and CPP will remain operational to ensure an important failsafe.
Ongoing ministerial support and investment to maintain the legacy systems through the transition with sustainable funding for operations, maintenance and cyber security risk mitigation in a rapidly intensifying threat landscape across the portfolio is important to the preservation of the social security safety net that so many Canadians rely on.
Departmental officials and I are available to brief you on ESDC's financial situation and operational risks in greater detail and to support you in navigating this operational environment to effectively and efficiently advance your priorities.
Once again, congratulations on your appointment, and welcome back to ESDC.
Paul Thompson
Deputy Minister of Employment and Social Development
2. Infographics
ESDC 101
Alternate formats

ESDC 101 [PDF - 834 KB]
Large print, braille, MP3 (audio), e-text and DAISY formats are available on demand by ordering online or calling 1 800 O-Canada (1-800-622-6232). If you use a teletypewriter (TTY), call 1-800-926-9105.
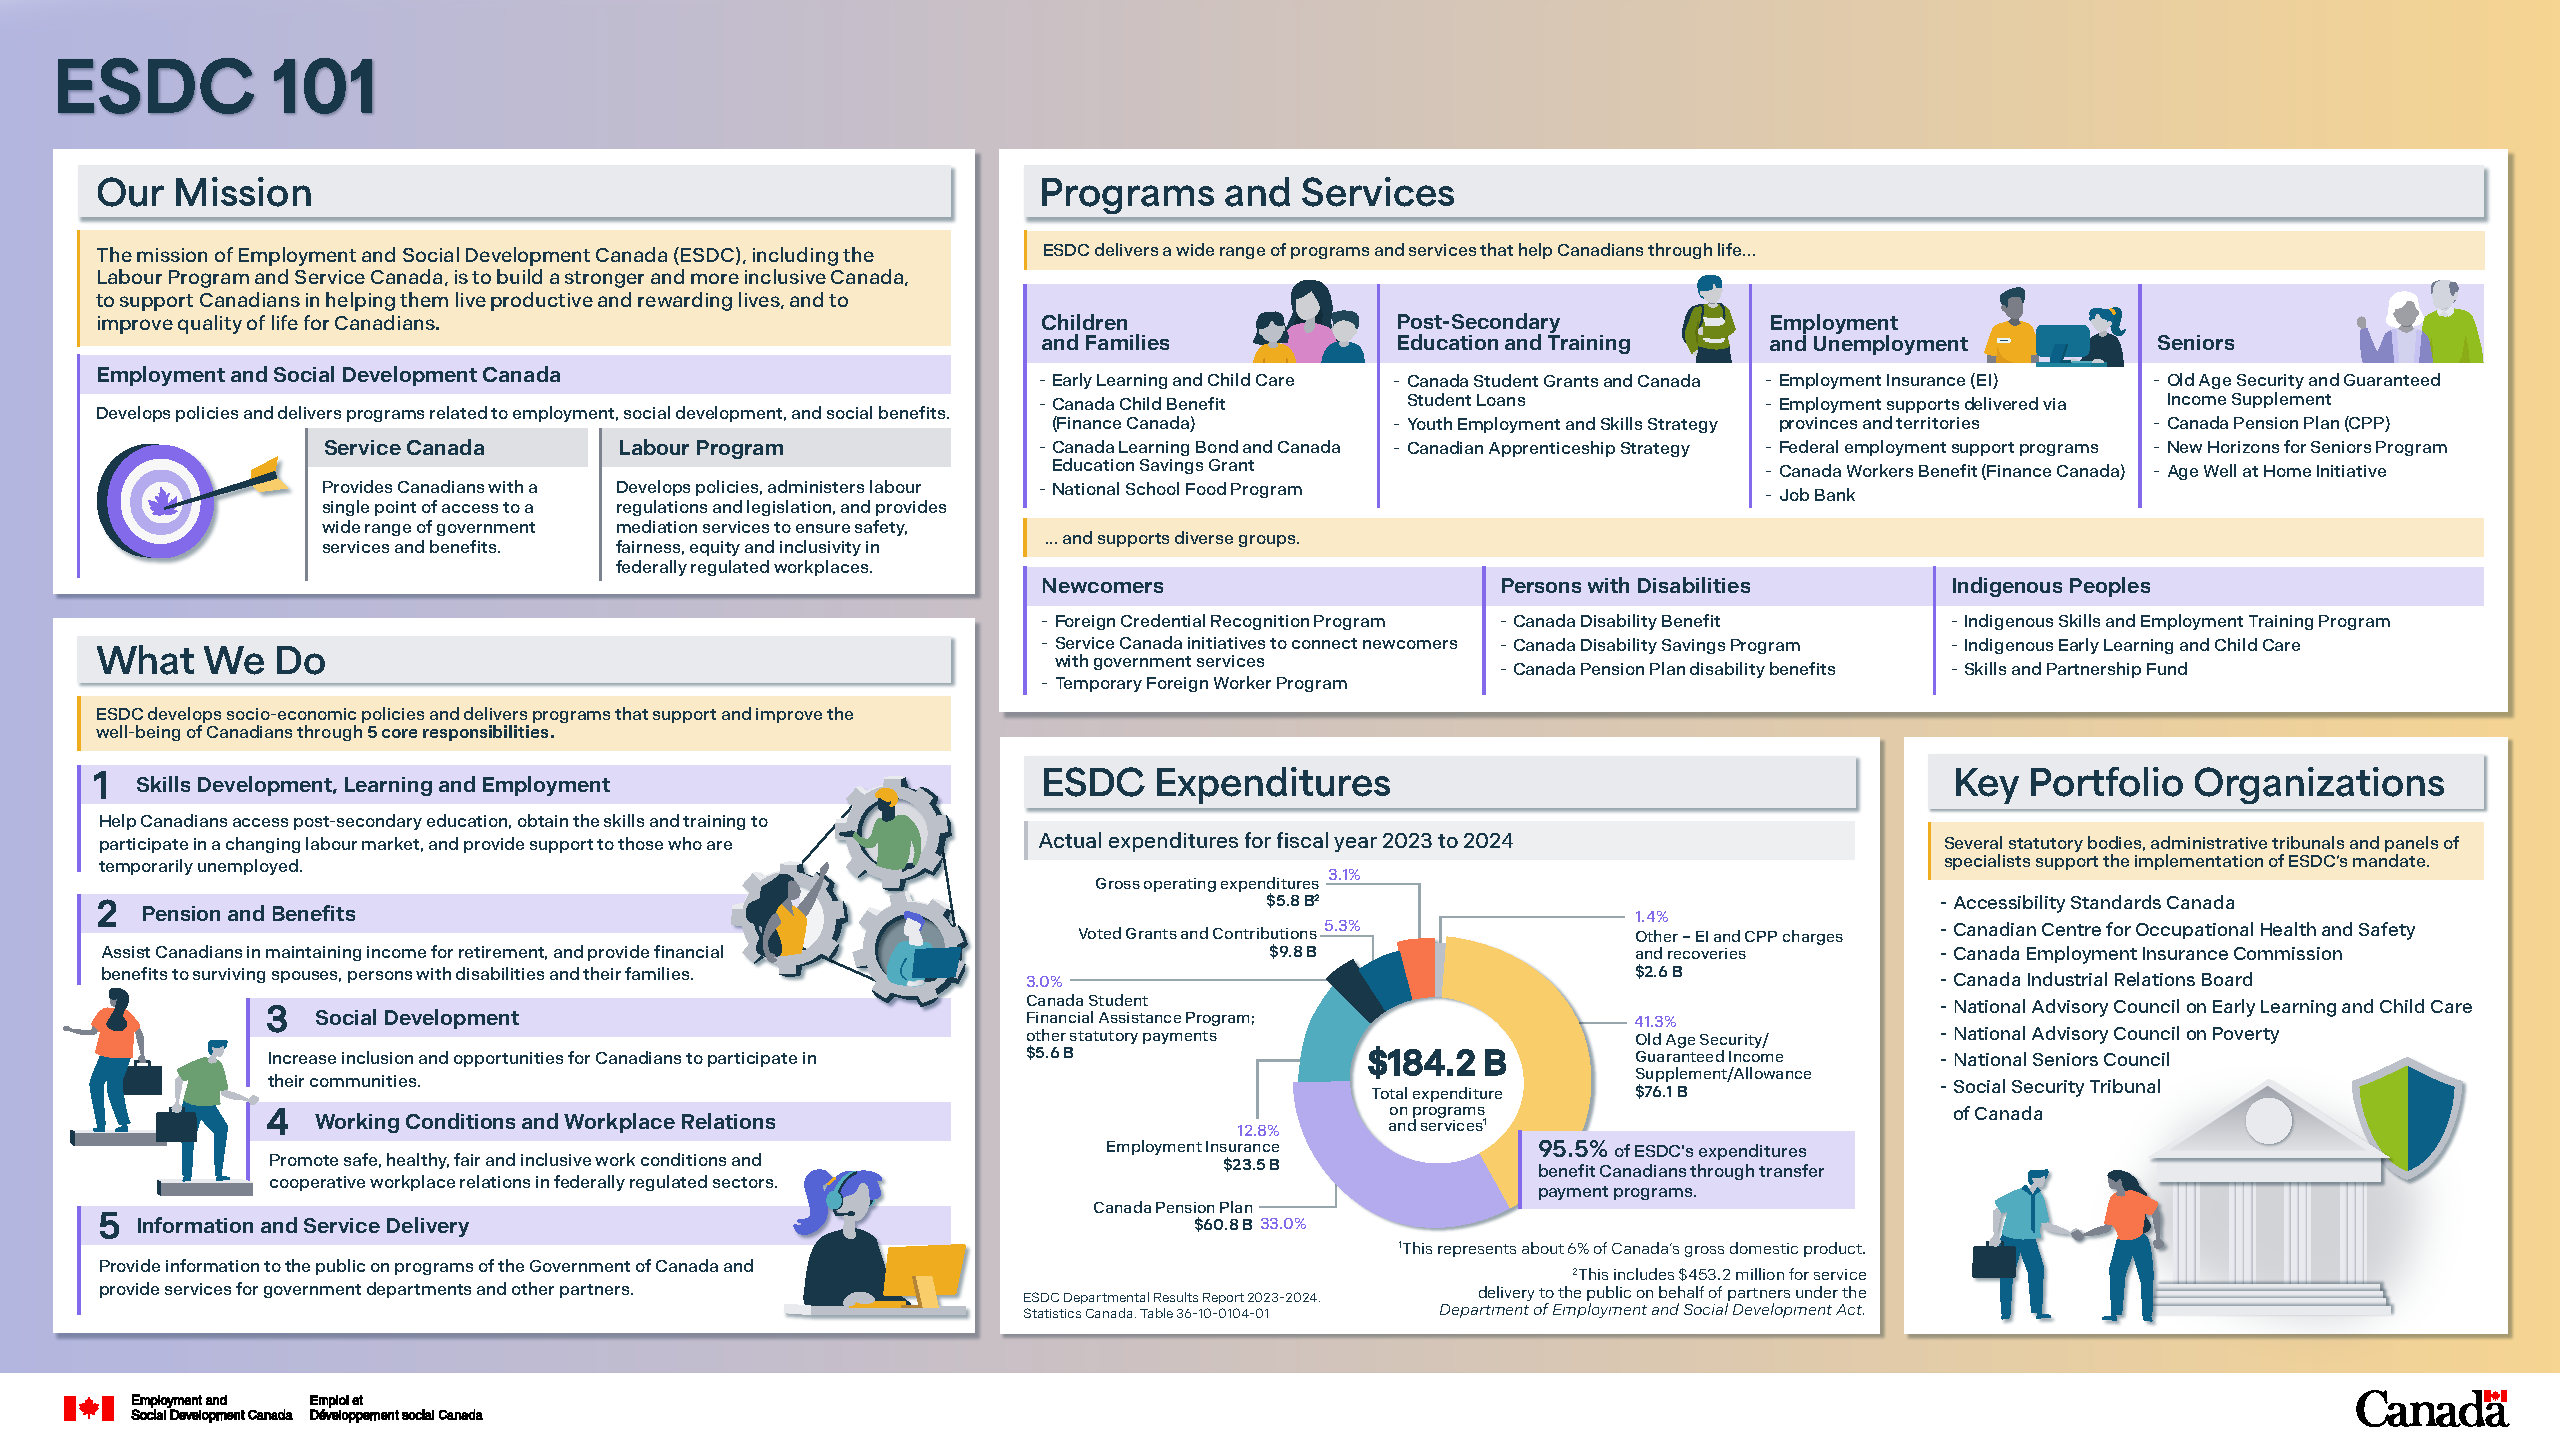
Figure 2.1 Text description
Our mission
The mission of Employment and Social Development Canada (ESDC), including the Labour Program and Service Canada, is to build a stronger and more inclusive Canada, to support Canadians in helping them live productive and rewarding lives, and to improve quality of life for Canadians.
- Employment and Social Development Canada develops policies and delivers programs related to employment, social development, and social benefits
- Service Canada provides Canadians with a single point of access to a wide range of government services and benefits
- Labour Program develops policies, administers labour regulations and legislation, and provides mediation services to ensure safety, fairness, equity and inclusivity in federally regulated workplaces
What we do
ESDC develops socio-economic policies and delivers programs that support and improve the well-being of Canadians through 5 core responsibilities:
- skills development, learning, and employment: help Canadians access post-secondary education, obtain the skills and training to participate in a changing labour market, and provide supports to those who are temporarily unemployed
- pension and benefits: assist Canadians in maintaining income for retirement, and provide financial benefits to surviving spouses, persons with disabilities and their families
- social development: increase inclusion and opportunities for Canadians to participate in their communities
- working conditions and workplace relations: promote safe, healthy, fair, and inclusive working conditions and cooperative workplace relations in federally regulated sectors
- information and service delivery: provide information to the public on programs of the Government of Canada and provide services for government departments and other partners
Programs and services
ESDC delivers a wide range of programs and services that help Canadians through life…
Children and families:
- Early Learning and Child Care
- Canada Child Benefit (Finance Canada)
- Canada Learning Bond and Canada Education Savings Grant
- National School Food Program
Post-secondary education and training:
- Canada Student Grants and Canada Student Loans
- Youth Employment and Skills Strategy
- Canadian Apprenticeship Strategy
Employment and unemployment:
- Employment Insurance (EI)
- Employment supports delivered via provinces and territories
- Federal employment support programs
- Canada Workers Benefit (Finance Canada)
- Job Bank
Seniors:
- Old Age Security and Guaranteed Income Supplement
- Canada Pension Plan (CPP)
- New Horizons for Seniors Program
- Age Well at Home Initiative
…and supports diverse groups:
Newcomers:
- Foreign Credential Recognition Program
- Service Canada initiatives to connect newcomers with government service
- Temporary Foreign Worker Program
People with disabilities:
- Canada Disability Benefit
- Canada Disability Savings Program
- Canada Pension Plan disability benefits
Indigenous peoples:
- Indigenous Skills and Employment Training Program
- Indigenous Early Learning and Child Care
- Skills and Partnership Fund
ESDC expenditures
- In the fiscal year 2023 to 2024, ESDC spent $184.2 billion on its programs and services. Of that amount, 95.5% were to provide direct benefits to Canadians through transfer payment programs. This represents about 6% of Canada's GDP and includes $453.2 million of expenditures for partnership with other government organizations under the Department of Employment and Social Development Act
- ESDC's gross operating budget represented 3.1% ($5.8 billion) of the Department's overall spending. 3.0% ($5.6 billion) was dedicated to Canada Student Financial Assistance Program and other statutory payments, 12.8 % ($23.5 billion) for Employment Insurance, 33% ($60.8 billion) for Canada Pension Plan and 41.3% ($76.1 billion) for Old Age Security and the Guaranteed Income Supplement Allowance. In addition, 1.4% ($2.6 billion) was provided to EI and CPP Charges and Recoveries
(Sources: ESDC Departmental Results Report 2023 to 2024, Statistics Canada. Table 36-10-0104-01)
Key portfolio organizations
Several statutory bodies, administrative tribunals and panels of specialists support the implementation of ESDC's mandate.
- Accessibility Standards Canada
- Canadian Centre for Occupational Health and Safety
- Canada Employment Insurance Commission
- Canada Industrial Relations Board
- National Advisory Council on Early Learning and Child Care
- National Advisory Council on Poverty
- National Seniors Council
- Social Security Tribunal of Canada
ESDC Programs throughout life
Alternate formats
ESDC Programs throughout life [PDF - 5,18 KB]
Large print, braille, MP3 (audio), e-text and DAISY formats are available on demand by ordering online or calling 1 800 O-Canada (1-800-622-6232). If you use a teletypewriter (TTY), call 1-800-926-9105.
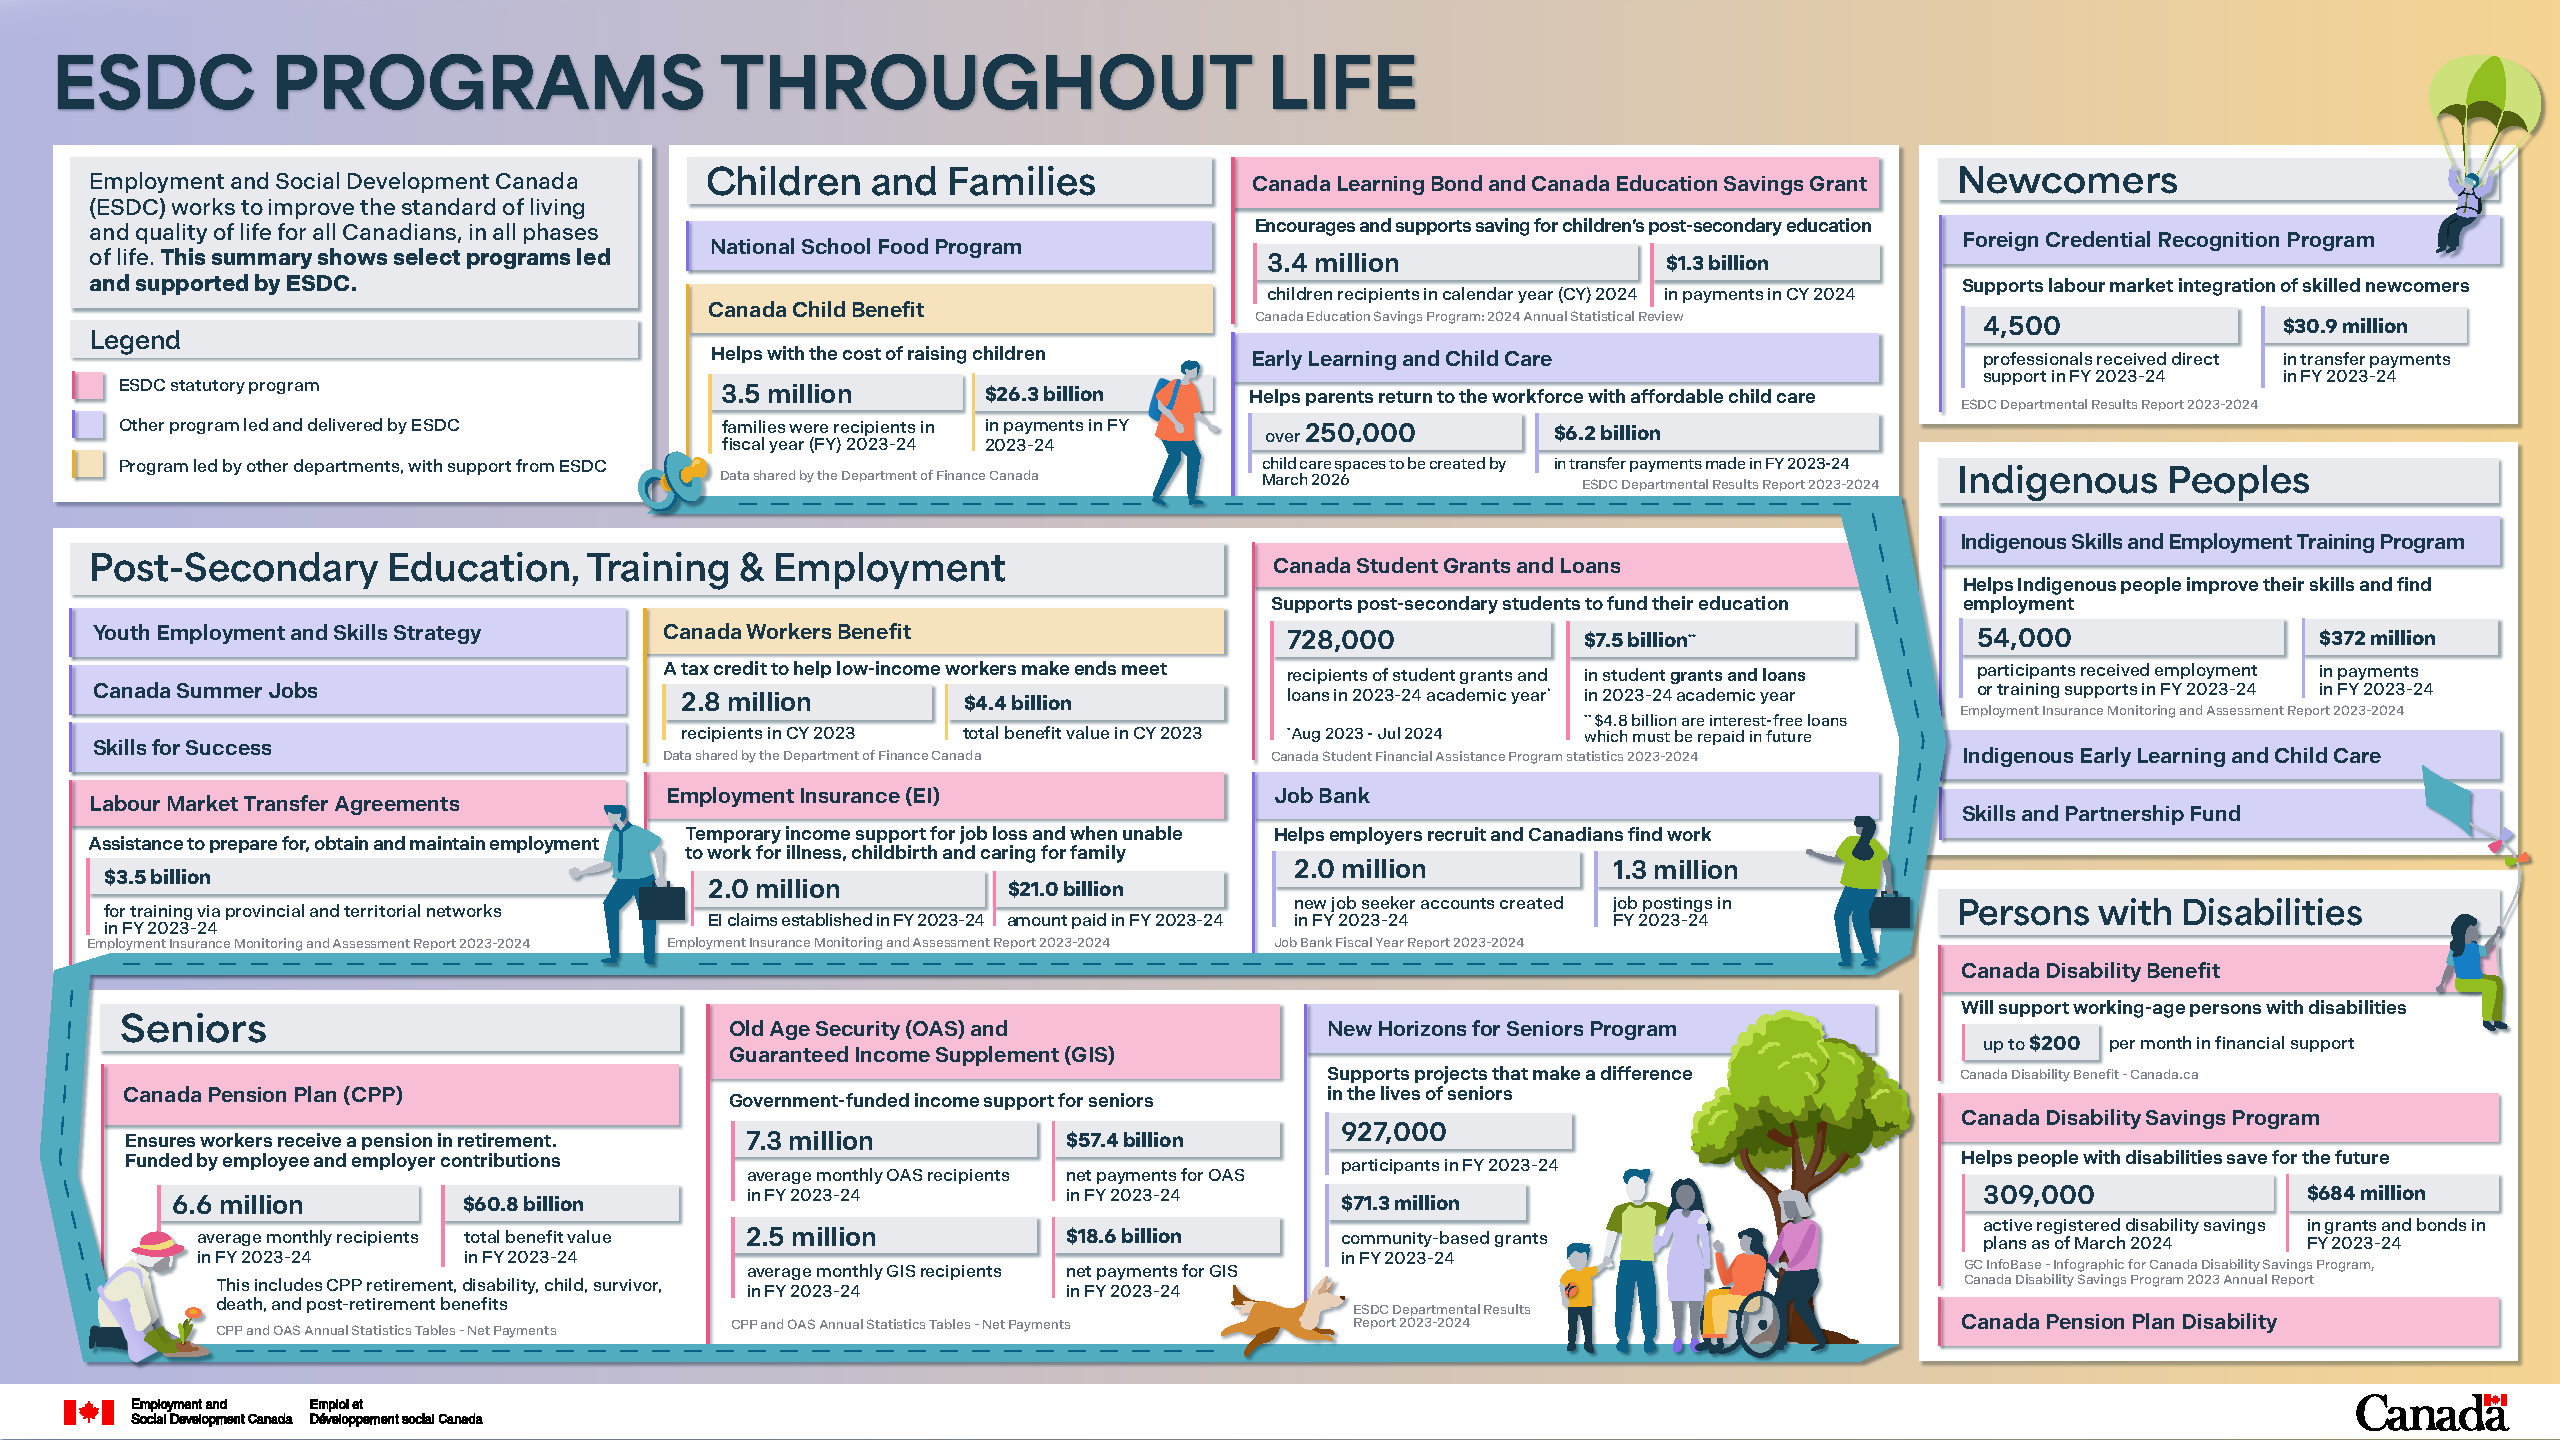
Figure 2.2 Text description
ESDC works to improve the standard of living and quality of life for all Canadians, in all phases of life. This summary shows select programs led and supported by ESDC.
Children and families
National School Food Program
The National School Food Program is a non-statutory program led by ESDC.
Canada Child Benefit
The Canada Child Benefit is a program led by other federal departments, with support from ESDC, to help with the cost of raising children. In fiscal year 2023 to 2024, 3.5 million families received this benefit and $26.3 billion in payments were issued.
(Source: Data shared by the Department of Finance Canada.)
Canada Learning Bond and Canada Education Savings Grant
The Canada Learning Bond and Canada Education Savings Grant are ESDC statutory programs, to encourage and support saving for children's post-secondary education. In the 2024 calendar year, 3.4 million children received $1.3 billion in payments for the Canada Learning Bond and Canada Education Savings Grant.
(Source: Canada Education Savings Program 2024 Annual Statistical Review.)
Early Learning and Child Care
The Early Learning and Child Care program is a non-statutory program led by ESDC, to help parents return to the workforce by providing affordable child care. Over 250,000 child care spaces will be created by March 2026. In the 2023 to 2024 fiscal year, $6.2 billion in transfer payments were made.
(Source: ESDC Departmental Results Report for fiscal year 2023 to 2024.)
National School Food Program
The National School Food Program is a non-statutory program led by ESDC to improve access to nutritious food and help children learn. Up to 400,000 more children will receive meals every year. There will be a $1 billion investment over five 5 years, starting in the 2024 to 2025 fiscal year.
(Source: Healthy Meals for up to 400,000 more kids - Canada.ca.)
Post-secondary education, training & employment
Youth Employment and Skills Strategy
The Youth Employment and Skills Strategy is a non-statutory program led by ESDC.
Canada Summer Jobs
Canada Summer Jobs is a non-statutory program led by ESDC.
Skills for Success
Skills for Success is a non-statutory program led by ESDC.
Labour Market Transfer Agreements
Labour Market Transfer Agreements are an ESDC statutory program which provide assistance to prepare for, obtain and maintain employment. $3.5 billion were transferred to provinces and territories for training in the 2023 to 2024 fiscal year.
(Source: Employment Insurance Monitoring and Assessment Report 2023 to 2024.)
Canada Workers Benefit
The Canada Workers Benefit is a tax credit to help low-income workers make ends meet. It is led by other federal departments, with support from ESDC. In the 2023 calendar year, there were 2.8 million recipients of the Canada Workers Benefit, who received $4.4 billion.
(Source: Data shared by the Department of Finance Canada.)
Employment Insurance
Employment Insurance is a statutory program of ESDC, providing a safety net for job loss and when unable to work for illness, childbirth and caring for family. In the 2023 to 2024 fiscal year, 2.0 million Employment Insurance claims were established and $21.0 billion was paid.
(Source: Employment Insurance Monitoring and Assessment Report 2023 to 2024.)
Canada Student Grants and Loans
Canada Student Grants and Loans are ESDC statutory programs to support post-secondary students to fund their education. In the academic year of August 2023 to July 2024, over 728,000 students received Canada student grants and loans, totalling $7.5 billion, of which $4.8 billion in interest-free loans must be repaid in the future.
(Source: Canada Student Financial Assistance Program statistics 2023 to 2024.)
Job Bank
Job Bank is a non-statutory program led by ESDC, which helps employers recruit and helps Canadians find work. In the 2023 to 2024 fiscal year, 2.0 million new job seeker accounts were created, and there were 1.3 million job postings.
Seniors
Canada Pension Plan
The Canada Pension Plan is an ESDC statutory program to ensure that workers receive a pension in retirement. This program is funded by employee and employer contributions. In the 2023 to 2024 fiscal year, 6.6 million average monthly Canada Pension Plan recipients received $60.8 billion in benefits, including Canada Pension Plan retirement, disability, child, survivor, death, and post-retirement benefits.
(Source: Canada Pension Plan and Old Age Security: Annual Statistics Tables - Net Payments.)
Old Age Security and Guaranteed Income Supplement
Old Age Security and the Guaranteed Income Supplement are ESDC statutory programs, which provide government-funded income support to seniors. In the 2023 to 2024 fiscal year, there were 7.3 million average monthly Old Age Security beneficiaries, who received $57.4 billion in net payments, and 2.5 million average monthly Guaranteed Income Supplement beneficiaries who received $18.6 billion in net payments and allowance.
(Source: Canada Pension Plan and Old Age Security: Annual Statistics Tables - Net Payments.)
New Horizons for Seniors Program
The New Horizons for Seniors Program is a non-statutory program led by ESDC, which supports projects that make a difference in the lives of seniors. In the 2023 to 2024 fiscal year, there were $71.3 million in community-based grants, and 927,000 participants in funded projects.
(Source: ESDC Departmental Results Report 2023 to 2024.)
Newcomers
Foreign Credential Recognition Program
The Foreign Credential Recognition Program is a non-statutory program led by ESDC, which supports labour market integration of skilled newcomers. In the 2023 to 2024 fiscal year, 4,500 professionals received direct support and there were $30.9 million in transfer payments.
(Source: ESDC Departmental Results Report 2023 to 2024.)
Indigenous Peoples
Indigenous Skills and Employment Training Program
The Indigenous Skills and Employment Training Program is a non-statutory program led by ESDC which helps Indigenous people improve their skills and find employment. In the 2023 to 2024 fiscal year, there were $372 million in payments which supported 54,000 participants with employment or training supports.
(Source: Employment Insurance Monitoring and Assessment Report 2023 to 2024.)
Indigenous Early Learning and Child Care
Indigenous Early Learning and Child Care is a non-statutory program led by ESDC.
Skills and Partnership Fund
Skills and Partnership Fund is a non-statutory program led by ESDC.
Persons with disabilities
Canada Disability Benefit
The Canada Disability Benefit is an ESDC statutory program to support working-age persons with disabilities. The program will provide up to $200 per month in financial support.
(Source: Canada Disability Benefit - Canada.ca.)
Canada Disability Savings Program
The Canada Disability Savings Program is an ESDC statutory program, which helps people with disabilities save for the future. As of March 2024, there were 309,000 active registered disability savings plans. There were $684 million in grants and bonds provided in the 2023 to 2024 fiscal year.
(Sources: Government of Canada InfoBase - Infographic for Canada Disability Savings Program; Canada Disability Savings Program 2023 Annual Report.)
Canada Pension Plan Disability
Canada Pension Plan Disability is an ESDC statutory program.
Service Canada at a Glance
Alternate formats
Service Canada at a Glance [PDF - 5,31 KB]
Large print, braille, MP3 (audio), e-text and DAISY formats are available on demand by ordering online or calling 1 800 O-Canada (1-800-622-6232). If you use a teletypewriter (TTY), call 1-800-926-9105.
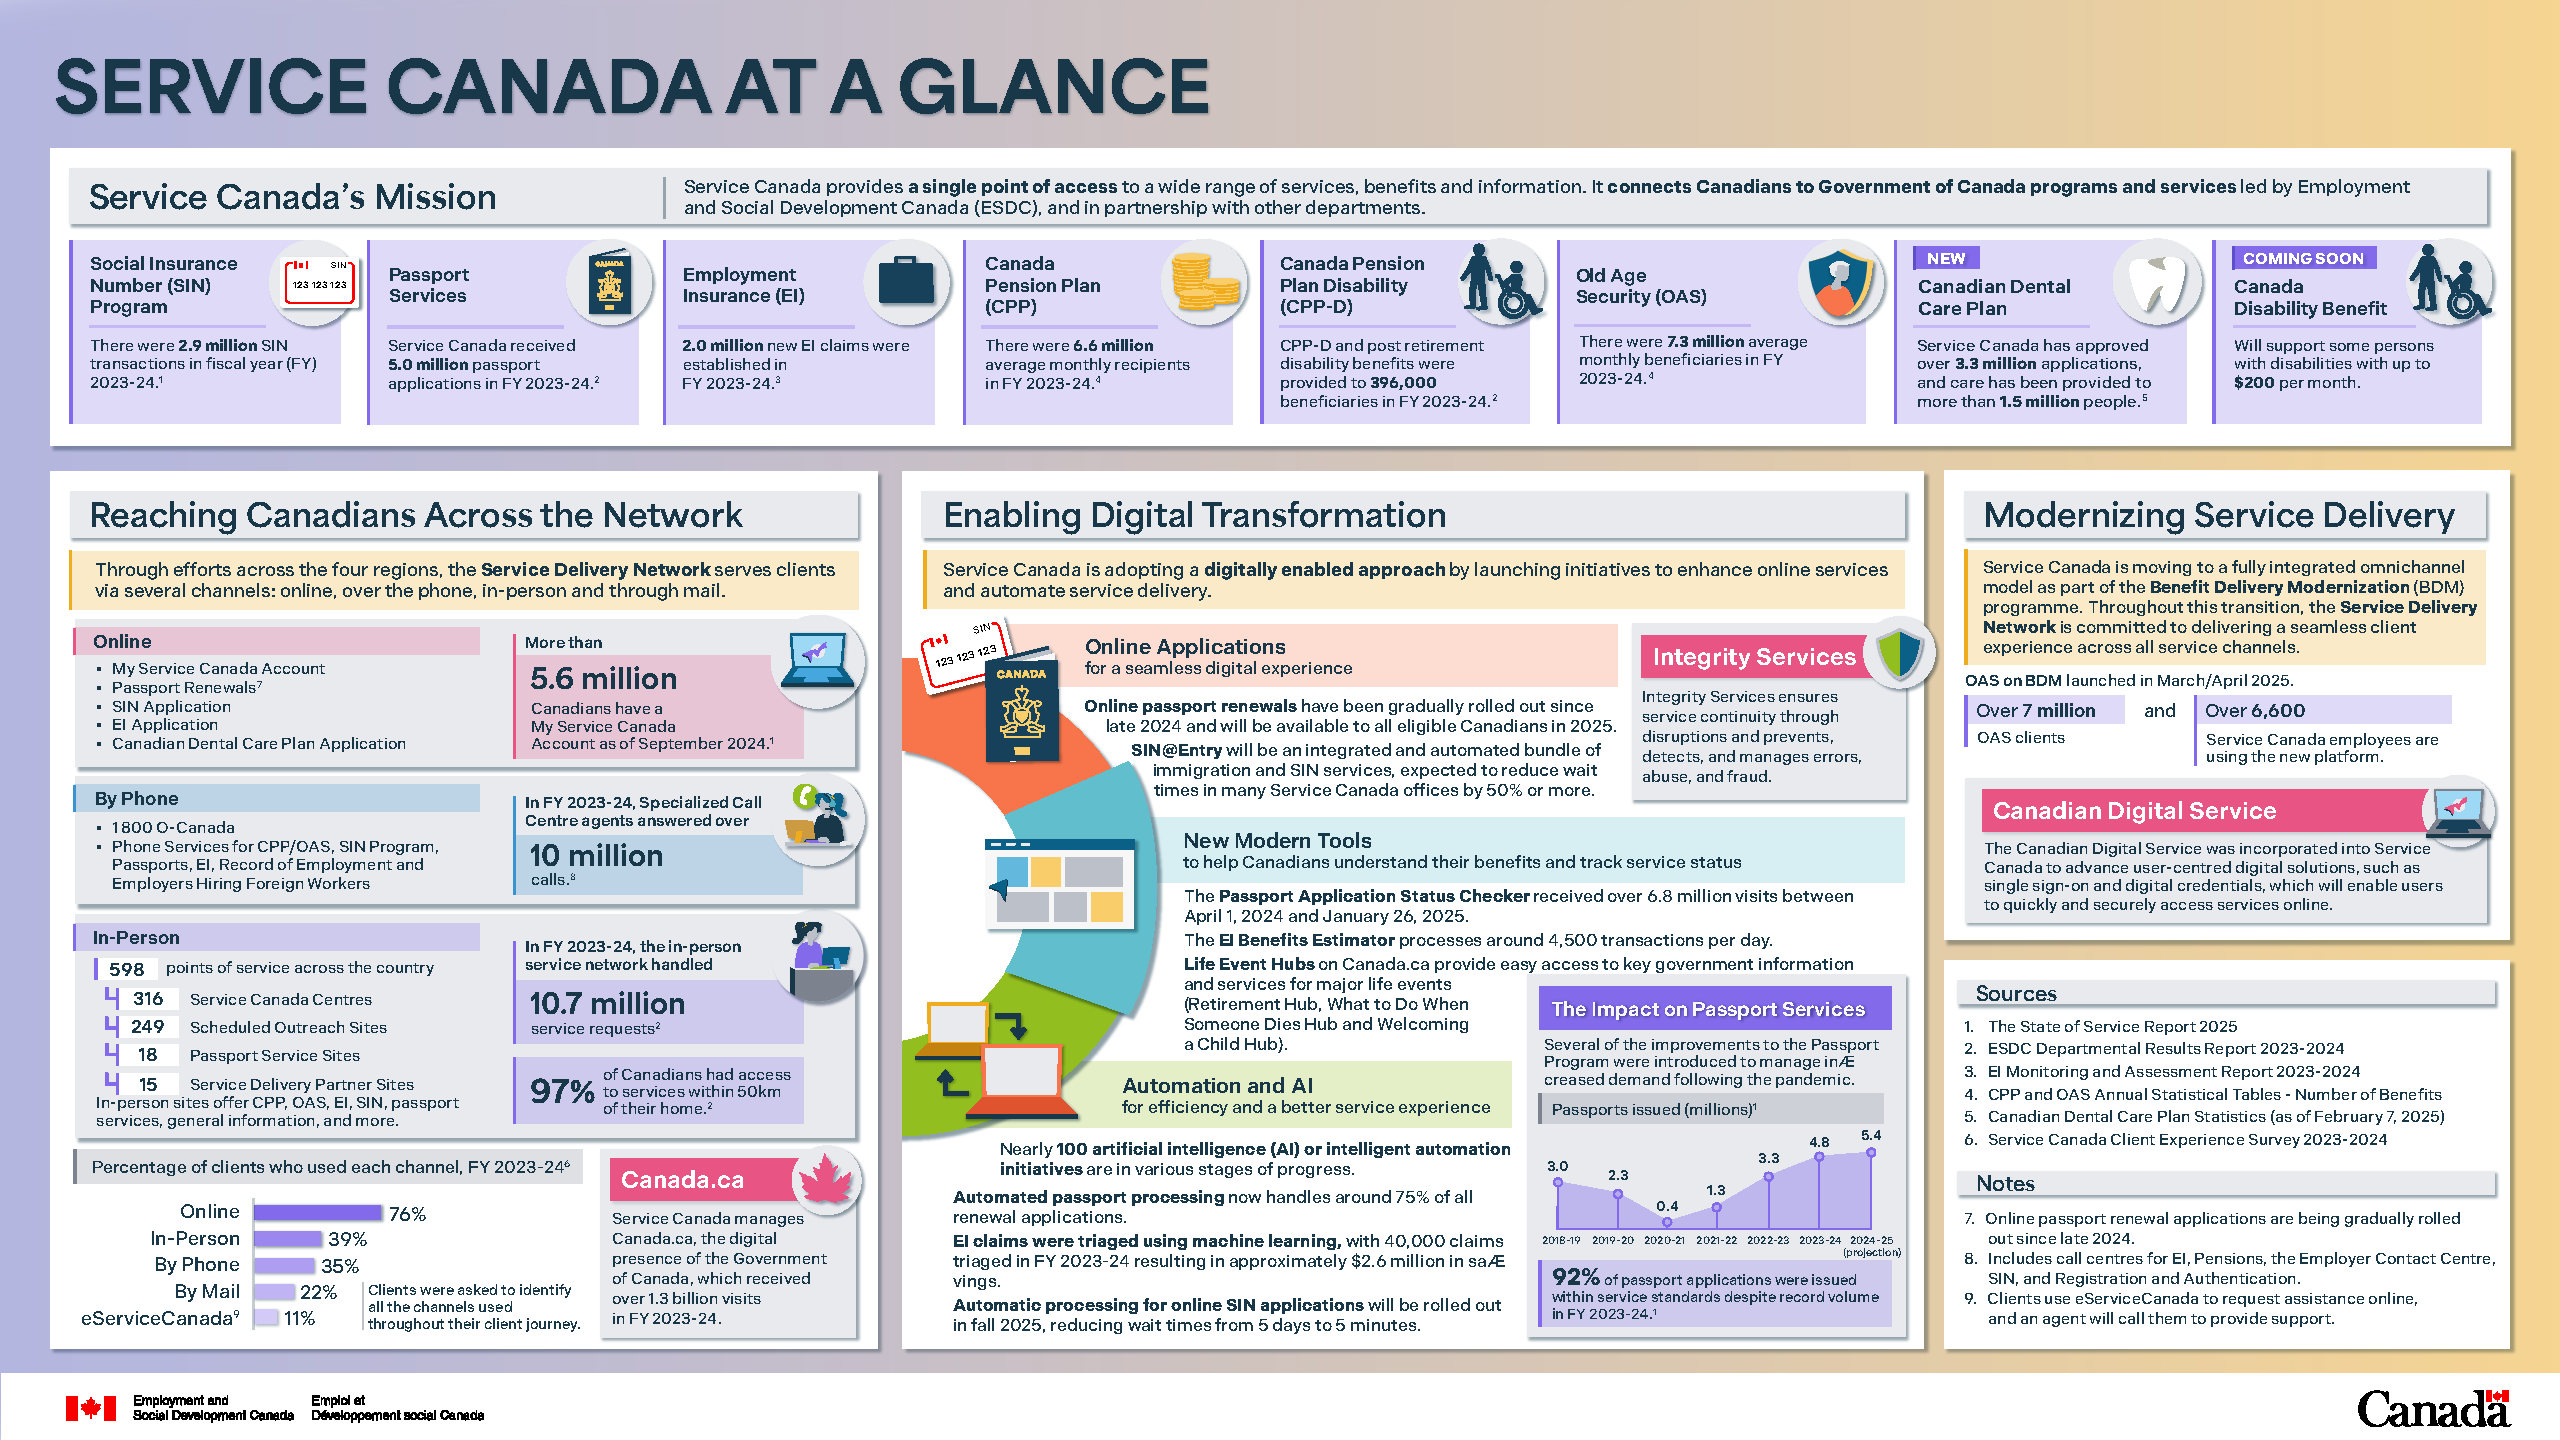
Figure 2.3 Text description
Service Canada's mission
Service Canada provides a single point of access to a wide range of services, benefits and information. It connects Canadians to Government of Canada programs and services led by Employment and Social Development Canada (ESDC), and in partnership with other departments.
List of programs under Service Canada:
- Social Insurance Number program: There were 2.9 million Social Insurance Number transactions in fiscal year 2023 to 2024
- Passport services: Service Canada received 5.0 million passport applications in fiscal year 2023 to 2024
- Employment Insurance: 2.0 million new Employment Insurance claims were established in fiscal year 2023 to 2024
- Canada Pension Plan: There were 6.6 million average monthly recipients in fiscal year 2023 to 2024
- Canada Pension Plan Disability: Canada Pension Plan Disability and post-retirement disability benefits were provided to 396,000 beneficiaries in fiscal year 2023 to 2024
- Old Age Security: There were 7.3 million average monthly beneficiaries in fiscal year 2023 to 2024
- (New) Canadian Dental Care Program: Service Canada has approved over 3.3 million applications, and care has been provided to more than 1.5 million people
- (Coming soon) Canada Disability Benefit: It will support some persons with disabilities with up to $200 per month
(Sources: The State of Service Report 2025, ESDC Departmental Results Report 2023 to 2024, Employment Insurance Monitoring and Assessment Report 2023 to 2024; Canada Pension Plan and Old Age Security Annual Statistical Tables - Number of Benefits; Canadian Dental Care Plan Statistics (as of February 7, 2025).)
Reaching Canadians across the network
Through efforts across the 4 regions, the Service Delivery Network serves clients via several channels: online, over the phone, in-person and through mail.
Online
Services offered online include:
- My Service Canada Account
- Passport renewals
- Social Insurance Number application
- Employment Insurance application
- Canadian Dental Care Plan application
Note: Online passport renewal applications are being gradually rolled out since late 2024.
More than 5.6 million Canadians have a My Service Canada Account as of September 2024.
(Source: The State of Service Report 2025.)
By phone
Services offered by phone include:
- 1 800 O-Canada
- Phone services for Canada Pension Plan, Old Age Security, Social Insurance Number Program, Passports, Employment Insurance, Record of Employment and Employers Hiring Foreign Workers.
In fiscal year 2023 to 2024, Specialized call centre agents answered over 10 million calls.
Note: Specialized call centers include call centres for Employment Insurance, pensions, the Employer Contact Centre, Social Insurance Number, and Registration and Authentication.
In-person
There are 598 points of service across the country:
- 316 Service Canada centres
- 249 Scheduled outreach sites
- 18 Passport service sites
- 15 Service delivery partner sites
In-person sites offer Canada Pension Plan, Old Age Security, Employment Insurance, Social Insurance Number, passport services, general information, and more.
In fiscal year 2023 to 2024, the in-person service network handled 10.7 million service requests, and 97% of Canadians had access to services within 50km of their home.
(Source: ESDC Departmental Results Report 2023 to 2024.)
Diagram 1: A Bar chart of the percentage of clients who used each channel in fiscal year 2023 to 2024.
| Channel | Percentage of clients |
|---|---|
| Online | 76% |
| In-person | 39% |
| By phone | 35% |
| By mail | 22% |
| eService Canada | 11% |
Notes Diagram 1:
- clients were asked to identify all the channels used throughout their client journey
- clients use eService Canada to request assistance online, and an agent will call them to provide support
(Source Diagram 1: Service Canada Client Experience Survey 2023 to 2024.)
Canada.ca
Service Canada manages Canada.ca, the digital presence of the Government of Canada, which received over 1.3 billion visits in fiscal year 2023 to 2024.
Enabling digital transformation
Service Canada is adopting a digitally enabled approach by launching initiatives to enhance online services and automate service delivery.
Online applications for a seamless digital experience
- Online passport renewals have been gradually rolled out since late 2024 and will be available to all eligible Canadians in 2025
- Social Insurance Number at entry will be an integrated and automated bundle of immigration and Social Insurance Number services, expected to reduce wait times in many Service Canada offices by 50 % or more
New modern tools to help Canadians understand their benefits and track service status
- The Passport application status checker received over 6.8 million visits between April 1, 2024 and January 26, 2025
- The Employment Insurance Benefits Estimator processes around 4,500 transactions per day
- Life Event Hubs on Canada.ca provide easy access to key government information and services for major life events (Retirement Hub, What to Do When Someone Dies Hub and Welcoming a Child Hub)
Automation and Artificial Intelligence for efficiency and a better service experience
- Nearly 100 artificial intelligence or intelligent automation initiatives are in various stages of progress
- Automated passport processing now handles around 75% of all renewal applications
- Employment Insurance claims were triaged using machine learning, with 40,000 claims triaged in fiscal year 2023 to 2024 resulting in approximately $2.6 million in savings
- Automatic processing for online Social Insurance Number applications will be rolled out in fall 2025, reducing wait times from 5 days to 5 minutes
The impact on Passport services
Several of the improvements to the Passport Program were introduced to manage increased demand following the pandemic.
Diagram 2: Line chart of the number of issued passports by fiscal year, from fiscal year 2018 to 2019 to fiscal year 2024 to 2025. The chart shows a reduction in the number of passports issued from 2018 to 2019 to 2020 to 2021, reaching the lowest level at 400,000 passports in 2020 to 2021. This is followed by an increase in the number of passports issued each subsequent year, leading to surpassing pre-pandemic volumes starting from the 2022 to 2023 fiscal year.
| Fiscal year | Passports issued (millions) |
|---|---|
| 2018 to 2019 | 3.0 |
| 2019 to 2020 | 2.3 |
| 2020 to 2021 | 0.4 |
| 2021 to 2022 | 1.3 |
| 2022 to 2023 | 3.3 |
| 2023 to 2024 | 4.8 |
| 2024 to 2025 (projection) | 5.4 |
92 % of passport applications were issued within service standards despite record volume in fiscal year 2023 to 2024.
- (Source: The State of Service Report 2025.)
Integrity services
Integrity services ensures service continuity through disruptions and prevents, detects, and manages errors, abuse, and fraud.
Modernizing service delivery
Service Canada is moving to a fully integrated omnichannel model as part of the Benefit Delivery Modernization programme. Throughout this transition, the Service Delivery Network is committed to delivering a seamless client experience across all service channels.
Old Age Security on Benefit Delivery Modernization launched in March and April 2025. Over 7 million Old Age Security clients and over 6,600 Service Canada employees are using the new platform.
Canadian Digital Service
The Canadian Digital Service was incorporated into Service Canada to advance user-centred digital solutions, such as single sign-on and digital credentials, which will enable users to quickly and securely access services online.
Benefits Delivery Modernization and Transformation
Alternate formats
Benefits Delivery Modernization and Transformation [PDF - 5,42 KB]
Large print, braille, MP3 (audio), e-text and DAISY formats are available on demand by ordering online or calling 1 800 O-Canada (1-800-622-6232). If you use a teletypewriter (TTY), call 1-800-926-9105.
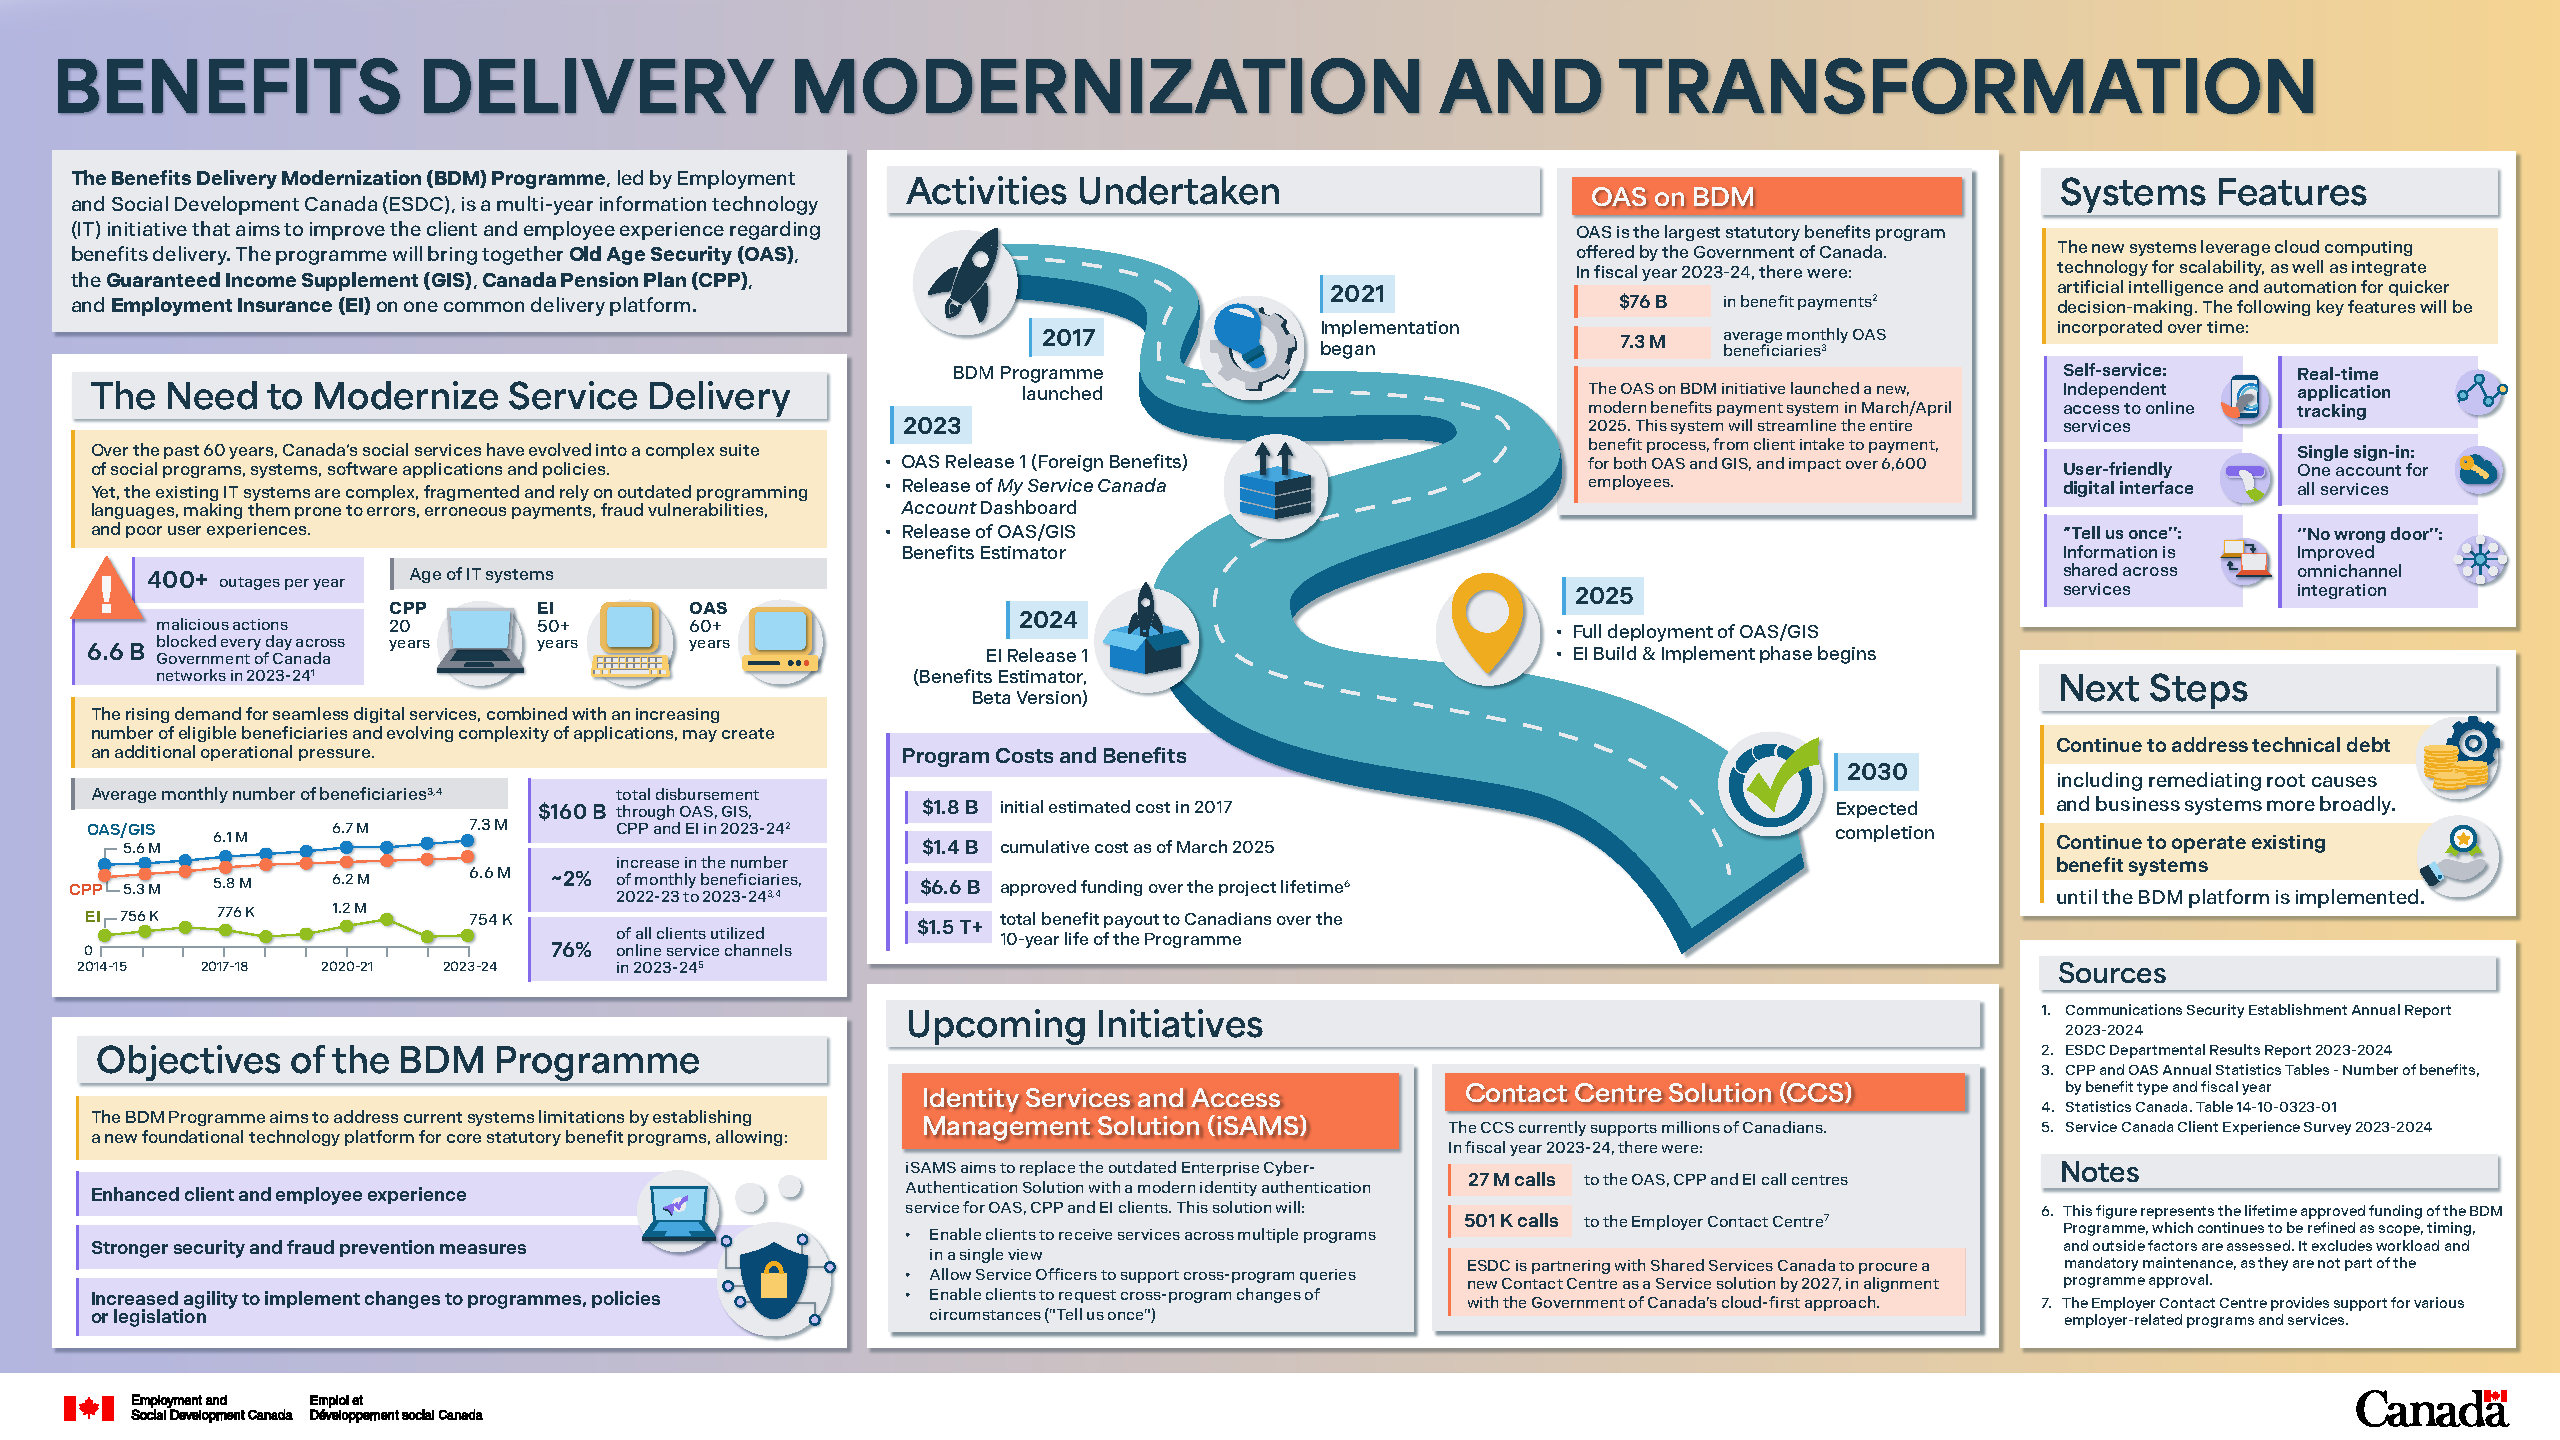
Figure 2.4 Text description
The Benefits Delivery Modernization Programme, led by Employment and Social Development Canada (ESDC), is a multi-year information technology initiative that aims to improve the client and employee experience regarding benefits delivery. The Programme will bring together Old Age Security, the Guaranteed Income Supplement, Canada Pension Plan, and Employment Insurance on one common delivery platform.
The need to modernize service delivery
Over the past 60 years, Canada's social services have evolved into a complex suite of social programs, systems, software applications and policies.
Yet, the existing information technology systems are complex, fragmented and rely on outdated programming languages, making them prone to errors, erroneous payments, fraud vulnerabilities, and poor user experiences.
- The current Canada Pension Plan, Employment Insurance and Old Age Security information technology systems are 20, 50 and 60 years old, respectively
- There are now more than 400 outages per year; and in fiscal year 2023 to 2024, 6.6 billion malicious actions were blocked every day across Government of Canada networks
(Source: Communications Security Establishment Annual Report for fiscal year 2023 to 2024.)
The rising demand for seamless digital services, combined with an increasing number of eligible beneficiaries and evolving complexity of applications, may create an additional operational pressure.
Diagram 1: A line chart of the average monthly number of beneficiaries of Old Age Security and Guaranteed Income Supplement, Canada Pension Plan, and Employment Insurance from fiscal years 2014 to 2015 through 2023 to 2024. The chart shows an overall increase in the number of beneficiaries for Old Age Security and Canada Pension Plan over the years. The number of Employment Insurance beneficiaries has been constant on average, with an increase between fiscal years 2019 to 2020 and 2021 to 2022, followed by a decrease in 2022 to 2023.
| Benefit type | 2014 to 2015 | 2017 to 2018 | 2020 to 2021 | 2023 to 2024 |
|---|---|---|---|---|
| Old Age Security and Guaranteed Income Supplement (millions) | 5.6 | 6.1 | 6.7 | 7.3 |
| Canada Pension Plan (millions) | 5.3 | 5.8 | 6.2 | 6.6 |
| Employment Insurance (thousands) | 756 | 776 | 1,200 | 754 |
- (Sources: Canada Pension Plan and Old Age Security: Annual Statistics Tables, Number of benefits, by benefit type and fiscal year; Statistics Canada Table 14-10-0323-01.)
In total, $160 billion in Old Age Security, Guaranteed Income Supplement, Canada Pension Plan and Employment Insurance benefits were disbursed in fiscal year 2023 to 2024. Between fiscal years 2022 to 2023 and 2023 to 2024, the number of monthly beneficiaries increased by approximately 2%. In fiscal year 2023 to 2024, 76% of all clients utilized online service channels.
(Sources: ESDC Departmental Results Report for fiscal year 2023 to 2024; Canada Pension Plan and Old Age Security: Annual Statistics Tables, Number of benefits, by benefit type and fiscal year; Statistics Canada Table 14-10-0323-01; Service Canada Customer Experience Survey, for fiscal year 2023 to 2024.)
Objectives of the Benefits Delivery Modernization Programme
The Benefits Delivery Modernization Programme aims to address current systems limitations by establishing a new foundational technology platform for core statutory benefit programs, allowing:
- enhanced client and employee experience
- stronger security and fraud prevention measures
- increased agility to implement changes to programs, policies or legislation
Activities undertaken
- In 2017, the Benefits Delivery Modernization Programme was launched
- In 2021, implementation began
- In 2023, the first Old Age Security release (Foreign Benefits), the My Service Canada Account dashboard, and the Old Age Security and Guaranteed Income Supplement Benefits Estimator were launched
- In 2024, the beta version of the first Employment Insurance release (Benefits Estimator) was launched
- In 2025, the Old Age Security and Guaranteed Income Supplement will be fully deployed, and the Build and Implement phase of Employment Insurance will begin
- The programme is expected to be completed in 2030
Old Age Security on Benefits Delivery Modernization
Old Age Security is the largest statutory benefits program offered by the Government of Canada. In fiscal year 2023 to 2024, there were:
- $76 billion in benefit payments
- 7.3 million average monthly Old Age Security beneficiaries
The Old Age Security on Benefits Delivery Modernization initiative launched a new, modern benefits payment system in March and April 2025. This system will streamline the entire benefit process, from client intake to payment, for both Old Age Security and Guaranteed Income Supplement, and impact over 6,600 employees.
(Sources: ESDC Departmental Results Report for fiscal year 2023- to 2024; Canada Pension Plan and Old Age Security: Annual Statistics Tables, Number of benefits, by benefit type and fiscal year.)
Programme costs and benefits
- The initial estimated cost in 2017 was $1.8 billion
- The cumulative cost, as of March 2025, is $1.4 billion
- The approved funding over the project lifetime is $6.6 billion. Note that this figure represents the lifetime approved funding of the Benefits Delivery Modernization Programme, which continues to be refined as scope, timing, and outside factors are assessed. It excludes workload and mandatory maintenance, as they are not part of the programme approval
- The estimated total benefit payout to Canadians over the 10-year life of the Programme is over $1.5 trillion
Upcoming initiatives
Identity Services and Access Management solution
The Identity Services and Access Management solution aims to replace the outdated Enterprise Cyber-Authentication solution with a modern identity authentication service for Old Age Security, Canada Pension Plan and Employment Insurance clients. This solution will:
- enable clients to receive services across multiple programs in a single view
- allow service officers to support cross-program queries
- enable clients to request cross-program changes of circumstances ("Tell us once")
Contact Centre solution
The Contact Centre solution currently supports millions of Canadians. In fiscal year 2023 to 2024, there were:
- 27 million calls to the Old Age Security, Canada Pension Plan and Employment Insurance call centres
- 501 thousand calls to the Employer Contact Centre. Note that the Employer Contact Centre provides support for various employer-related programs and services
ESDC is partnering with Shared Services Canada to procure a new Contact Centre as a Service solution by 2027, in alignment with the Government of Canada's cloud-first approach.
Systems features
The new systems leverage cloud computing technology for scalability, as well as integrate artificial intelligence and automation for quicker decision-making. The following key features will be incorporated over time:
- Self-service: Independent access to online services
- User-friendly digital interface
- "Tell us once": Information is shared across services
- Real-time application tracking
- Single sign-in: One account for all services
- "No wrong door": Improved omnichannel integration
Next steps
- Continue to address technical debt including remediating root causes and business systems more broadly
- Continue to operate existing benefit systems until the Benefits Delivery Modernization platform is implemented
The Labour Program in brief
Alternate formats
The Labour Program in brief [PDF - 4,70 KB]
Large print, braille, MP3 (audio), e-text and DAISY formats are available on demand by ordering online or calling 1 800 O-Canada (1-800-622-6232). If you use a teletypewriter (TTY), call 1-800-926-9105.
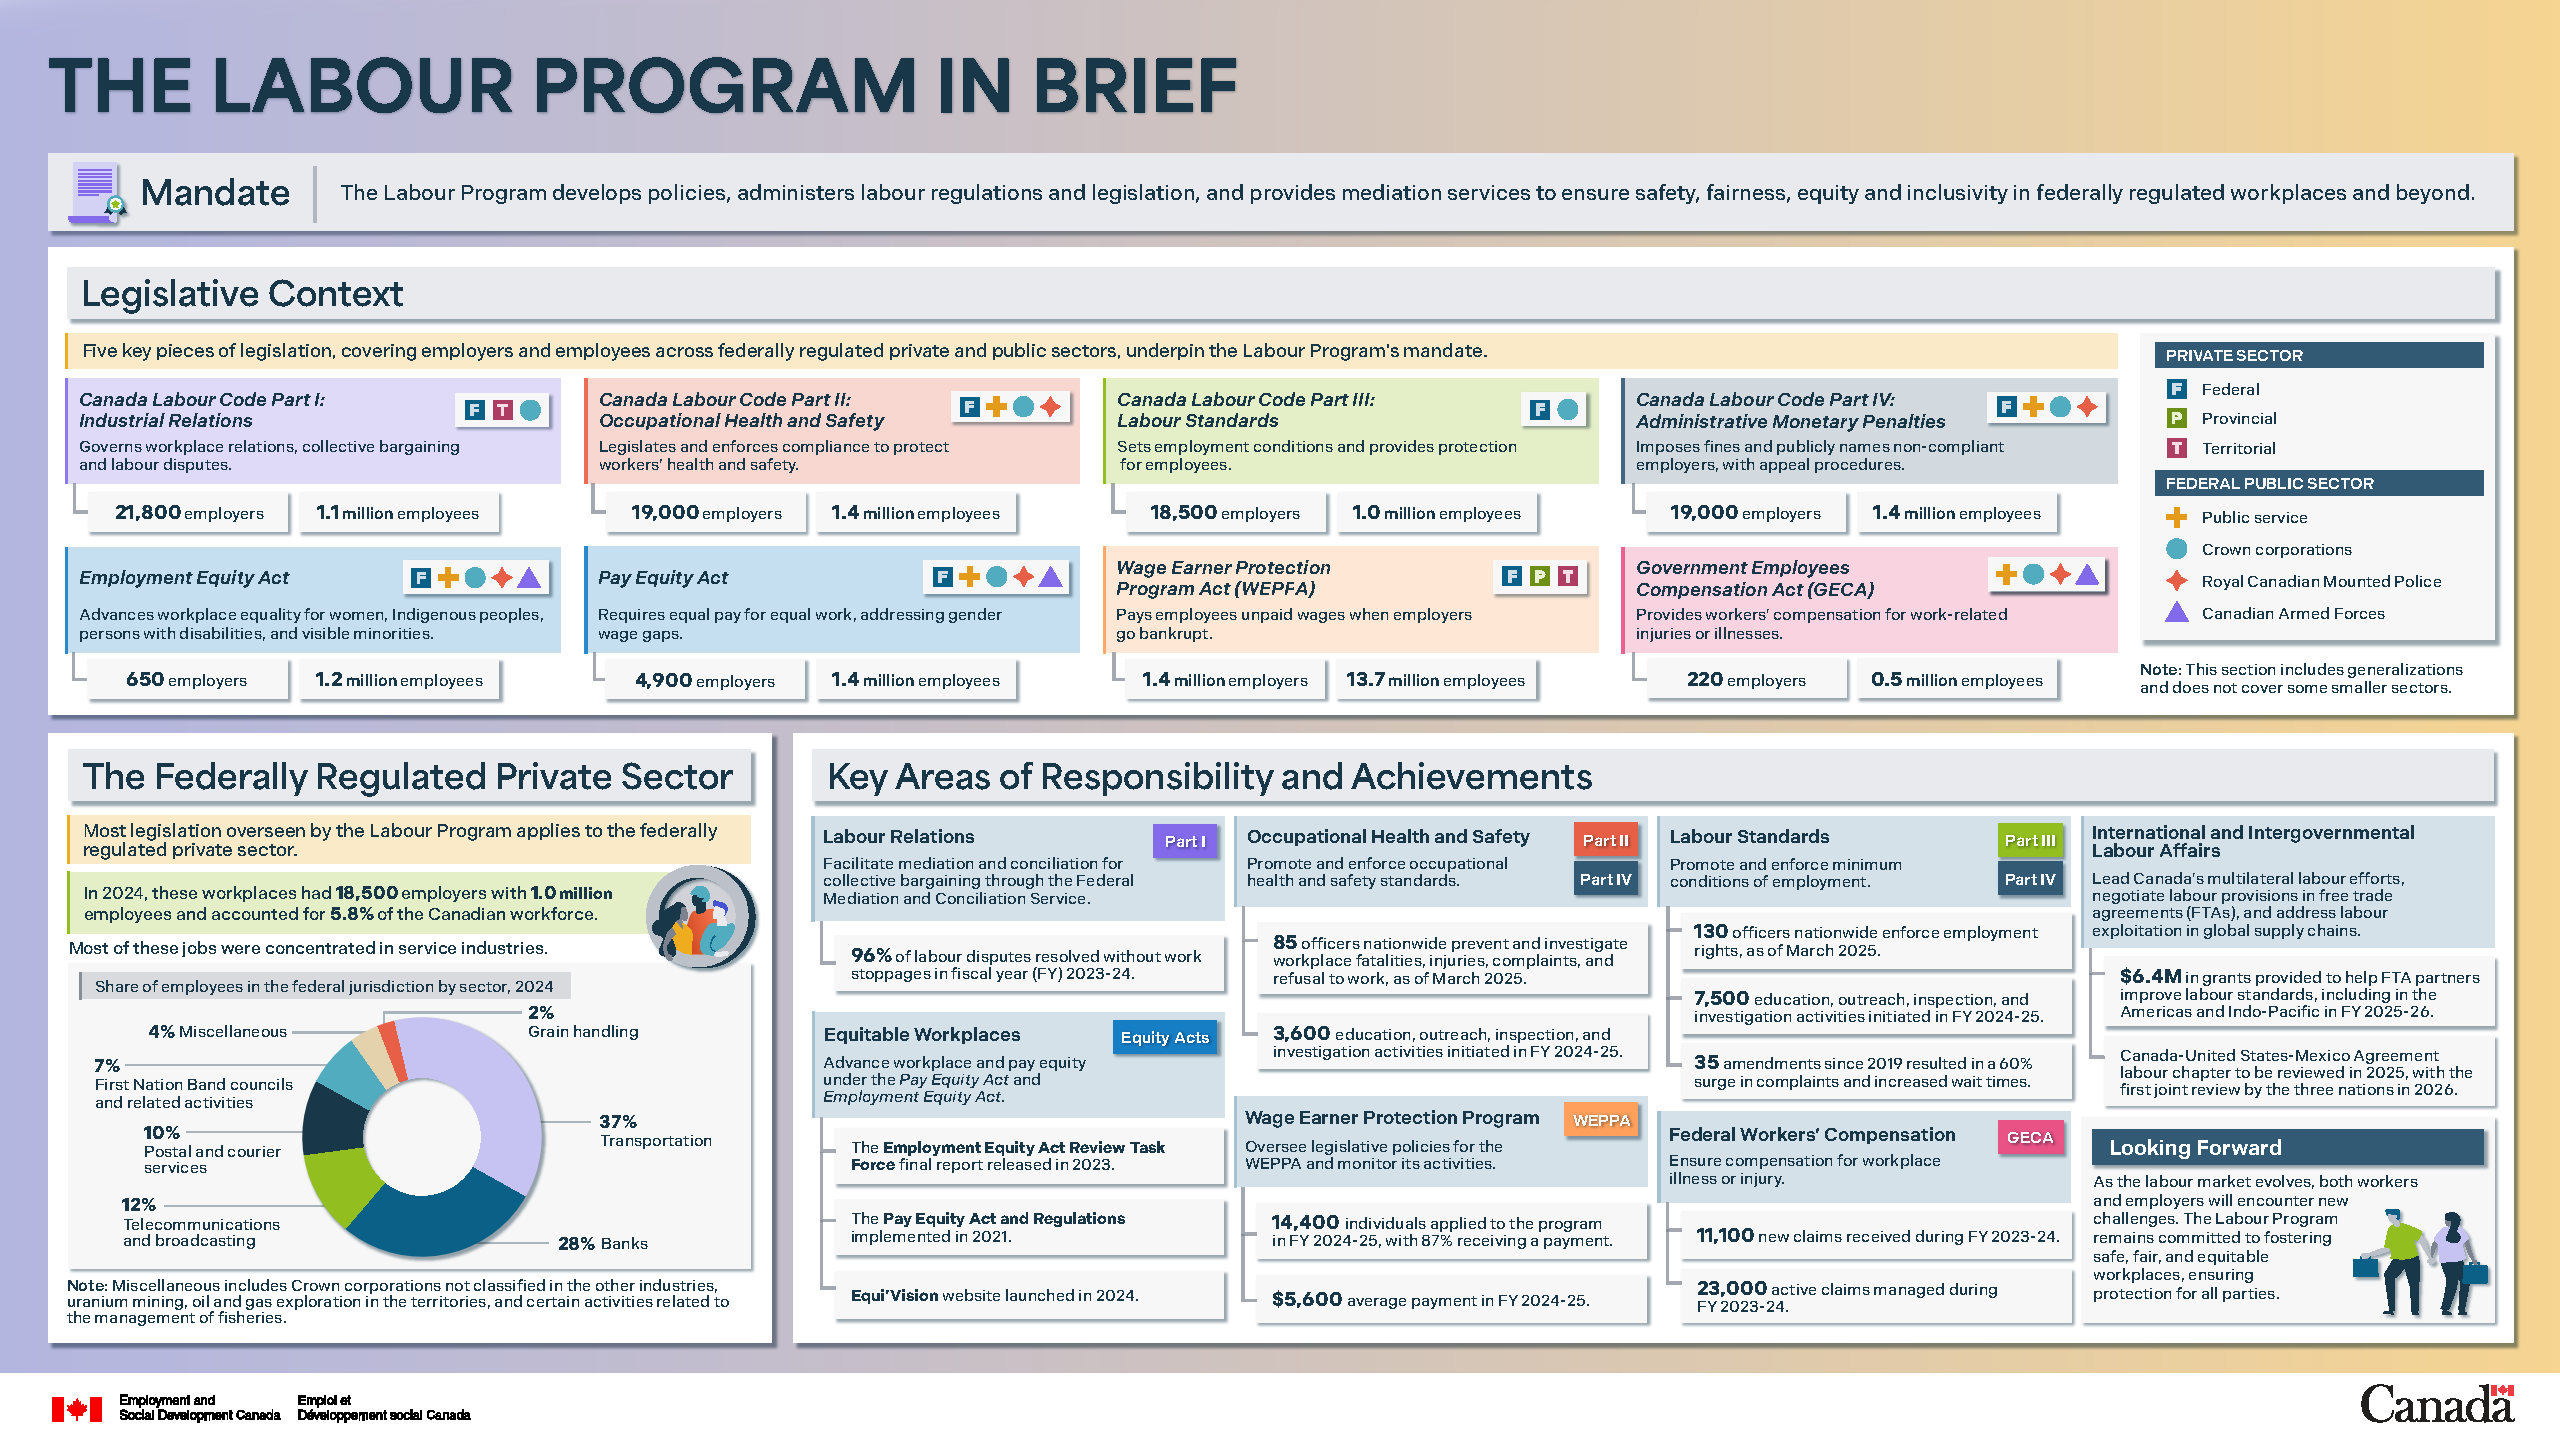
Figure 2.5 Text description
Mandate
The Labour Program develops policies, administers labour regulations and legislation, and provides mediation services to ensure safety, fairness, equity and inclusivity in federally regulated workplaces and beyond.
Legislative context
5 key pieces of legislation, covering employers and employees across federally regulated private and public sectors, underpin the Labour Program's mandate.
- Canada Labour Code Part I: Industrial Relations
- Governs workplace relations, collective bargaining and labour disputes
- Covers federal and territorial private sector, and Crown corporations
- Applies to 21,800 employers and 1.1 million employees
- Canada Labour Code Part II: Occupational Health & Safety
- Legislates and enforces compliance to protect workers' health and safety
- Covers the federal private sector, public service, Crown corporations and the Royal Canadian Mounted Police
- Applies to 19,000 employers and 1.4 million employees
- Canada Labour Code Part III: Labour Standards
- Sets employment conditions and provides protection for employees
- Covers the federal private sector and Crown corporations
- Applies to 18,500 employers and 1.0 million employees
- Canada Labour Code Part IV: Administrative Monetary Penalties
- Imposes fines and publicly names non-compliant employers, with appeal procedures
- Covers the federal private sector, public service, Crown corporations and Royal Canadian Mounted Police
- Applies to 19,000 employers and 1.4 million employees
- Employment Equity Act
- Advances workplace equality for women, Indigenous peoples, persons with disabilities, and visible minorities.
- Covers the federal private sector, public service, Crown corporations, Royal Canadian Mounted Police and Canadian Armed Forces
- Applies to 650 employers and 1.2 million employees
- Pay Equity Act
- Requires equal pay for equal work, addressing gender wage gaps
- Covers the federal private sector, public service, Crown corporations, Royal Canadian Mounted Police and Canadian Armed Forces
- Applies to 4,900 employers and 1.4 million employees
- Wage Earner Protection Program Act
- Pays employees unpaid wages when employers go bankrupt
- Covers the federal, provincial and territorial private sector
- Applies to 1.4 million employers and 13.7 million employees
- Government Employees Compensation Act
- Provides workers' compensation for work-related injuries or illnesses
- Covers the public service, Crown corporations, Royal Canadian Mounted Police and Canadian Armed Forces
- Applies to 220 employers and 0.5 million employees
Note: This section includes generalizations and does not cover some smaller sectors.
The federally regulated private sector
Most legislation overseen by the Labour Program applies to the federally regulated private sector. In 2024, these workplaces had 18,500 employers with 1.0 million employees and accounted for 5.8% of the Canadian workforce.
Most of these jobs were concentrated in service industries.
Diagram 1: A pie chart showing the share of employees in the federal jurisdiction by sector in 2024.
| Sector | Share |
|---|---|
| Transportation | 37% |
| Banks | 28% |
| Telecommunications and broadcasting | 12% |
| Postal and courier services | 10% |
| First Nation Band councils and related activities | 7% |
| Miscellaneous | 4% |
| Grain handling | 2% |
- Note: Miscellaneous includes Crown corporations not classified in the other industries, uranium mining, oil and gas exploration in the territories, and certain activities related to the management of fisheries.
Key areas of responsibility and achievements
- Labour Relations (Canada Labour Code Part I)
- Facilitate mediation and conciliation for collective bargaining through the Federal Mediation and Conciliation Service
- 96% of labour disputes were resolved without work stoppages in fiscal year 2023 to 2024
- Occupational Health and Safety (Canada Labour Code Parts II and IV)
- Promote and enforce occupational health and safety standards
- 85 officers nationwide prevent and investigate workplace fatalities, injuries, complaints, and refusal to work, as of March 2025
- 3,600 education, outreach, inspection, and investigation activities were initiated in fiscal year 2024 to 2025
- Labour Standards (Canada Labour Code Parts III and IV)
- Promote and enforce minimum conditions of employment
- 130 officers nationwide enforce employment rights, as of March 2025
- 7,500 education, outreach, inspection, and investigation activities were initiated in fiscal year 2024 to 2025
- 35 amendments since 2019 have resulted in a 60% surge in complaints and increased wait times
- Equitable Workplaces (Equity Acts)
- Advance workplace and pay equity under the Pay Equity Act and Employment Equity Act
- The Employment Equity Act Review Task Force final report was released in 2023
- The Pay Equity Act and Regulations were implemented in 2021
- The Equi'Vision website was launched in 2024
- Wage Earner Protection Program (Wage Earner Protection Program Act)
- Oversee legislative policies for the Wage Earner Protection Program Act and monitor its activities
- 14,400 individuals applied to the program in fiscal year 2024 to 2025, with 87% receiving a payment
- $5,600 was the average payment in fiscal year 2024 to 2025
- Federal Workers' Compensation (Government Employees Compensation Act)
- Ensure compensation for workplace illness or injury
- 11,100 new claims were received during fiscal year 2023 to 2024
- 23,000 active claims were managed during fiscal year 2023 to 2024
- International and Intergovernmental Labour Affairs
- Lead Canada's multilateral labour efforts, negotiate labour provisions in free trade agreements, and address labour exploitation in global supply chains
- $6.4M in grants is being provided to help free trade agreements partners improve labour standards, including in the Americas and Indo-Pacific in fiscal year 2025 to 2026
- The Canada-United-States-Mexico Agreement labour chapter will be reviewed in 2025, with the first joint review by the 3 nations in 2026
Looking forward
As the labour market evolves, both workers and employers will encounter new challenges. The Labour Program remains committed to fostering safe, fair, and equitable workplaces, ensuring protection for all parties.
Supporting quality of life in Canada
Alternate formats
Supporting quality of life in Canada [PDF - 10,00 KB]
Large print, braille, MP3 (audio), e-text and DAISY formats are available on demand by ordering online or calling 1 800 O-Canada (1-800-622-6232). If you use a teletypewriter (TTY), call 1-800-926-9105.
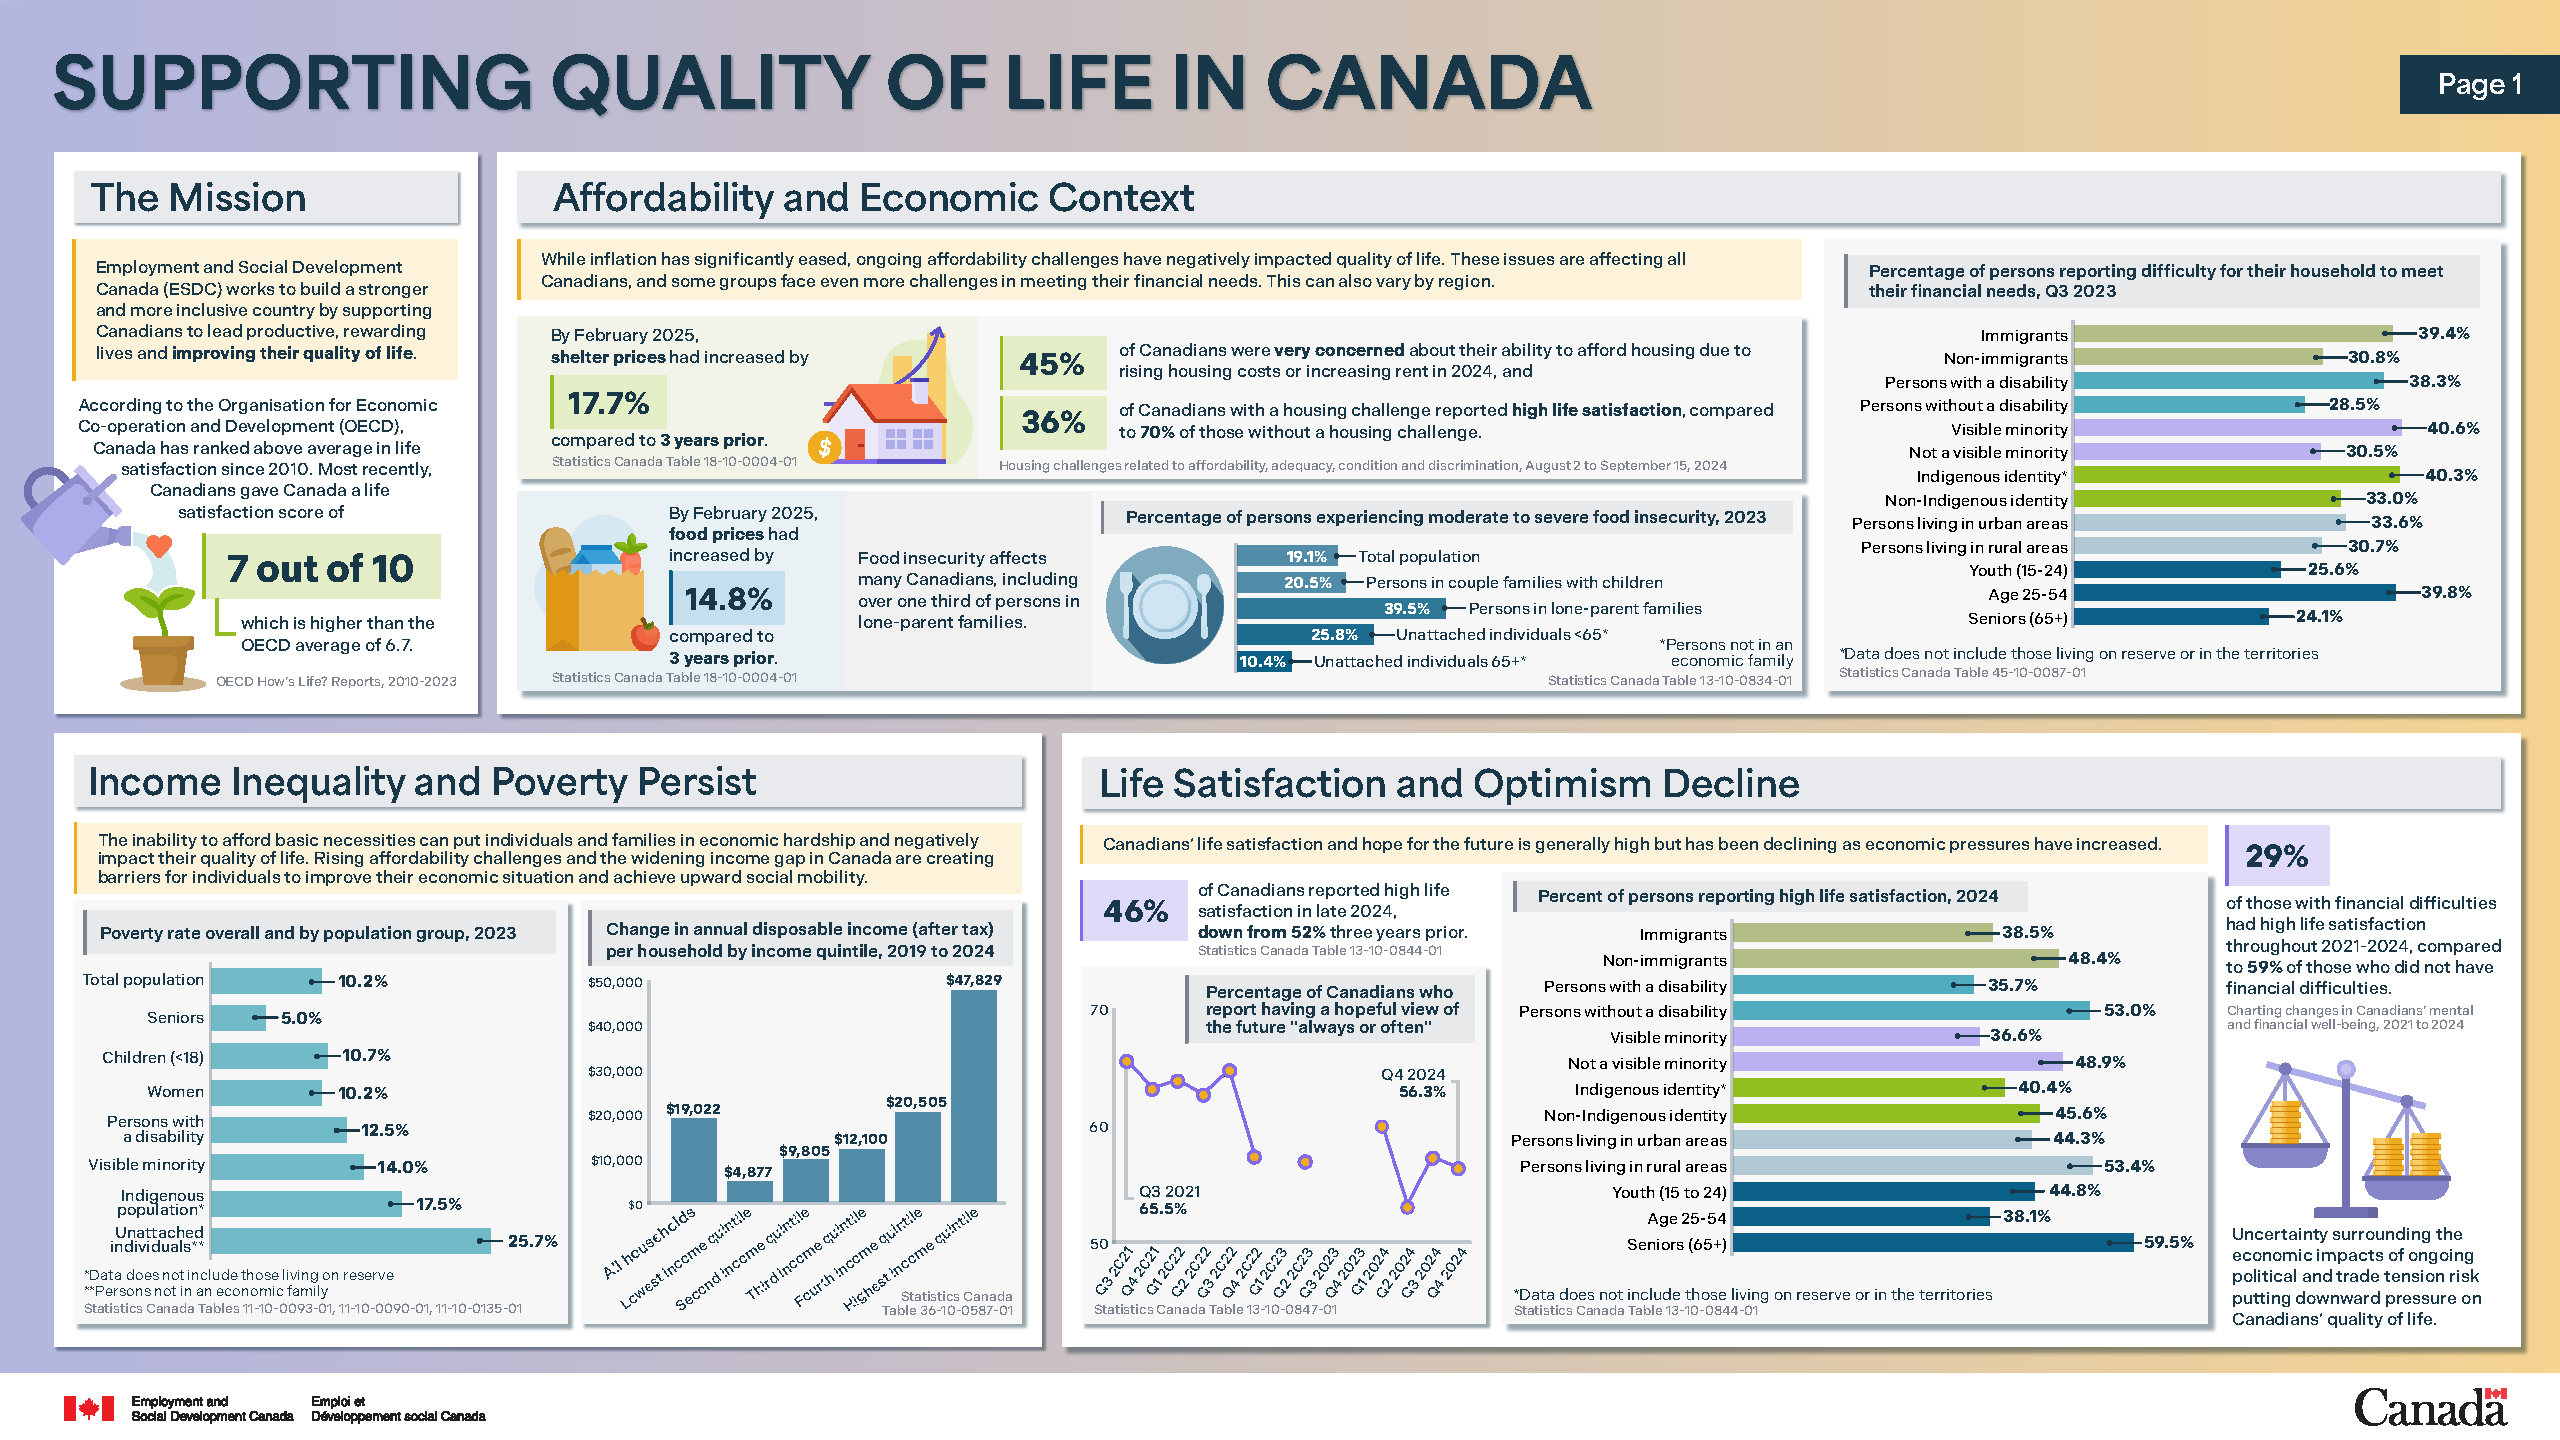
Figure 2.6 (page 1) Text description
The mission
Employment and Social Development Canada (ESDC) works to build a stronger and more inclusive country by supporting Canadians to lead productive, rewarding lives and improving their quality of life.
According to the Organisation for Economic Co-operation and Development (OECD), Canada has ranked above average in life satisfaction since 2010. Most recently, Canadians gave Canada a life satisfaction score of 7 out of 10 which is higher than the OECD average of 6.7.
(Sources: OECD How's Life? Reports, 2010-2023.)
Affordability and economic context
While inflation has significantly eased, ongoing affordability challenges have negatively impacted quality of life. These issues are affecting all Canadians, and some groups face even more challenges in meeting their financial needs. This can also vary by region.
By February 2025, shelter prices had increased by 17.7% compared to 3 years prior.
(Source: Statistics Canada Table 18-10-0004-01.)
45% of Canadians were very concerned about their ability to afford housing due to rising housing costs or increasing rent in 2024, and 36% of Canadians with a housing challenge reported high life satisfaction, compared to 70% of those without a housing challenge.
(Source: Housing challenges related to affordability, adequacy, condition and discrimination, August 2 to September 15, 2024.)
By February 2025, food prices had increased by 14.8% compared to 3 years prior.
(Source: Statistics Canada Table 18-10-0004-01.)
Food insecurity affects many Canadians, including over one third of persons in lone-parent families.
Diagram 1: A bar chart showing the percentage of persons who experienced moderate to severe food insecurity in 2023, among specific groups including persons in couple families with children, persons in lone-parent families, unattached individuals aged 65 and over, unattached individuals under 65, and the overall Canadian population. The group with the highest rate was persons in lone-parent families at 39.5%, and the group with the lowest rate was unattached individuals aged 65+ at 10.4%.
| Group | Percentage |
|---|---|
| All persons | 19.1% |
| Persons in couple families with children | 20.5% |
| Persons in lone-parent families | 39.5% |
| Unattached individuals (<65) (Note: Person not in an economic family) | 25.8% |
| Unattached individuals (65+) (Note: Person not in an economic family) | 10.4% |
-
(Source Diagram 1: Statistics Canada Table 13-10-0834-01.)
Diagram 2: A bar chart showing the percentage of persons reporting difficulty for their household to meet their financial needs in the third quarter of 2023, broken down by demographic groups. The chart compares each group - immigrants, persons with disabilities, visible minorities, Indigenous peoples, and urban residents, with their respective comparison groups (for example, non-immigrants). In all cases, the reported group shows a higher percentage of financial difficulty. For instance, 39.4% of immigrants reported difficulty, compared to 30.8% of non-immigrants. The chart also includes age-based data: youth (15 to 24), adults (25 to 54), and seniors (65+), with the highest rate among adults aged 25 to 54 at 39.8%.
| Group | Percentage |
|---|---|
| Immigrants | 39.4% |
| Non-immigrants | 30.8% |
| Persons with a disability | 38.3% |
| Persons without a disability | 28.5% |
| Visible minority | 40.6% |
| Not a visible minority | 30.5% |
| Indigenous identity (Note: Data does not include those living on reserve or in the territories) | 40.3% |
| Non-indigenous identity | 33.0% |
| Persons living in urban areas | 33.6% |
| Persons living in rural areas | 30.7% |
| Youth (15 to 24) | 25.6% |
| Age 25 to 54 | 39.8% |
| Seniors (65+) | 24.1% |
-
(Source Diagram 2: Statistics Canada Table 45-10-0087-01.)
Income inequality and poverty persist
The inability to afford basic necessities can put individuals and families in economic hardship and negatively impact their quality of life. Rising affordability challenges and the widening income gap in Canada are creating barriers for individuals to improve their economic situation and achieve upward social mobility.
Diagram 3: A bar chart showing the poverty rate in 2023, overall and by population group - including seniors aged 65 and older, children under age 18, women, persons with a disability, visible minorities, Indigenous people, and unattached individuals. The poverty rate was lowest for seniors at 5.0%, and highest for unattached individuals at 25.7%.
| Group | Poverty Rrate |
|---|---|
| Total population | 10.2% |
| Seniors | 5.0% |
| Children (< 18) | 10.7% |
| Women | 10.2% |
| Persons with a disability | 12.5% |
| Visible minority | 14.0% |
| Indigenous population (Note: Data does not include those living on reserve) | 17.5% |
| Unattached individuals (Note: Persons not in an economic family) | 25.7% |
-
(Sources Diagram 3: Statistics Canada Tables 11-10-0093-01, 11-10-0090-01, 11-10-0135-01.)
Diagram 4: A bar chart showing the change in annual disposable income after tax per household from 2019 to 2024, broken down by household income quintile. It shows the those in the highest income quintile had an average increase in disposable income of $47,829 from 2019 to 2024, and those in the lowest income quintile had an increase of $4,877.
| Income quintile | Change in annual disposable income from 2019 to 2024 |
|---|---|
| All households | $19,022 |
| Lowest income quintile | $4,877 |
| Second income quintile | $9,805 |
| Third income quintile | $12,100 |
| Fourth income quintile | $20,505 |
| Highest income quintile | $47,829 |
-
(Source Diagram 4: Statistics Canada Table 36-10-0587-01.)
Life satisfaction and optimism decline
Canadians' life satisfaction and hope for the future is generally high but has been declining as economic pressures have increased.
46% of Canadians reported high life satisfaction in late 2024, down from 52% 3 years prior.
(Source: Statistics Canada Table 13-10-0844-01.)
Diagram 5: A line plot showing the percentage of Canadians who report having a hopeful view of the future "always" or "often", from the third quarter of 2021 to the fourth quarter of 2024. The rate is fairly steady around 65% from the third quarter of 2021 to the third quarter of 2022, when it sharply falls to 57.3%. There is missing data from then until the first quarter of 2024 with the exception of the second quarter of 2023, when the percentage was 56.8%. Throughout 2024, the rate declines from 59.9% in the first quarter to 56.3% in the fourth quarter.
| Quarter | Percentage |
|---|---|
| Q3 2021 | 65.5 |
| Q4 2021 | 63.1 |
| Q1 2022 | 63.8 |
| Q2 2022 | 62.6 |
| Q3 2022 | 64.6 |
| Q4 2022 | 57.3 |
| Q1 2023 | n/a |
| Q2 2023 | 56.8 |
| Q3 2024 | n/a |
| Q4 2024 | n/a |
| Q1 2024 | 59.9 |
| Q2 2024 | 53 |
| Q3 2024 | 57.2 |
| Q4 2024 | 56.3 |
-
(Source Diagram 5: Statistics Canada Table 13-10-0847-01.)
Diagram 6: A bar chart showing the percentage of people who reported high life satisfaction in 2024, among demographic groups. The chart compares each group - immigrants, persons with disabilities, visible minorities, Indigenous people, and urban residents, with their respective comparison groups (for example, non-immigrants). In all cases, the reported group shows a lower percentage of life satisfaction. For instance, 35.7% of persons with a disability reported high life satisfaction, compared to 53.0% of persons who do not have a disability. The chart also includes age-based data: youth (15 to 24), adults (25 to 54), and seniors (65+), with the highest rate among seniors at 59.5%.
| Group | Percentage |
|---|---|
| Immigrants | 38.5% |
| Non-immigrants | 48.4% |
| Persons with a disability | 35.7% |
| Persons without a disability | 53.0% |
| Visible minority | 36.6% |
| Not a visible minority | 48.9% |
| Indigenous identity (Note: Data does not include those living on reserve or in the territories) | 40.4% |
| Non-indigenous identity | 45.6% |
| Persons living in urban areas | 44.3% |
| Persons living in rural areas | 53.4% |
| Youth (15 to 24) | 44.8% |
| Age 25 to 54 | 38.1% |
| Seniors (65+) | 59.5% |
-
(Source Diagram 6: Statistics Canada Table 13-10-0844-01)
29% of those with financial difficulties had high life satisfaction throughout 2021 to 2024, compared to 59% of those who did not have financial difficulties.
(Source: Charting changes in Canadians' mental and financial well-being, 2021 to 2024)
Uncertainty surrounding the economic impacts of ongoing political and trade tension risk putting downward pressure on Canadians' quality of life.
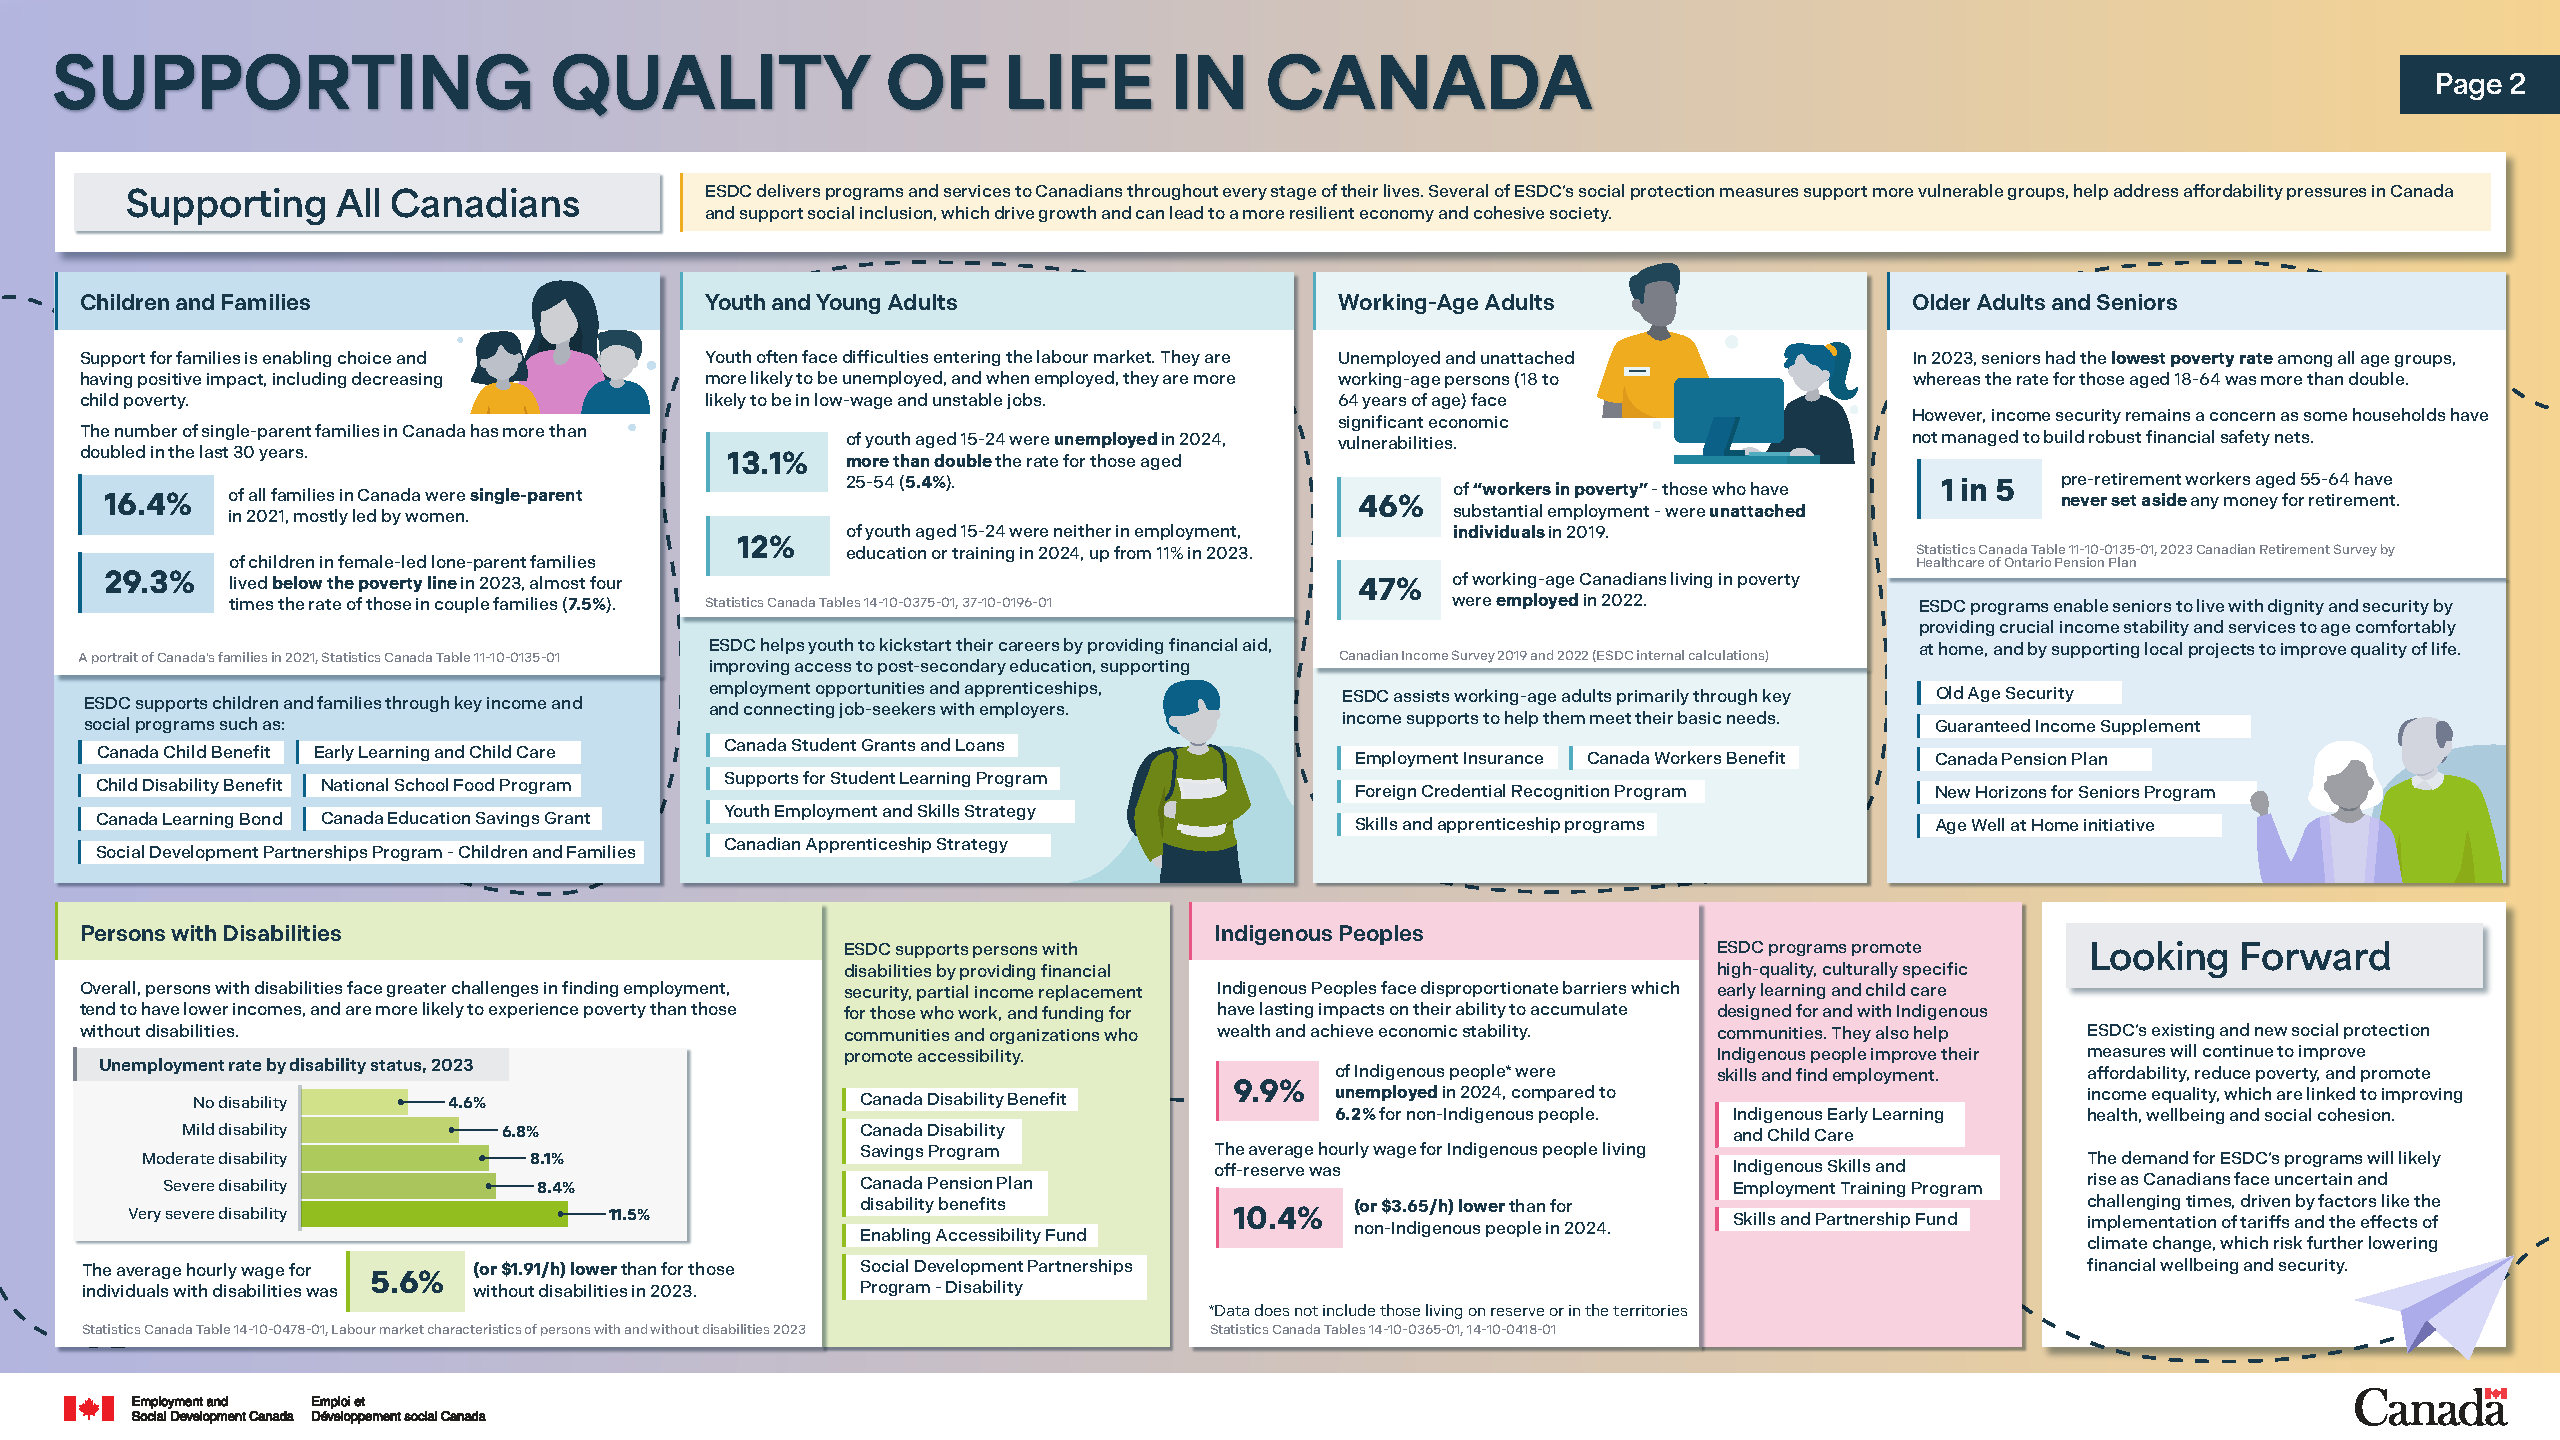
Figure 2.6 (page 2) Text description
Supporting all Canadians
ESDC delivers programs and services to Canadians throughout every stage of their lives. Several of ESDC's social protection measures support more vulnerable groups, help address affordability pressures in Canada and support social inclusion, which drive growth and can lead to a more resilient economy and cohesive society.
Children and families
Support for families is enabling choice and having positive impact, including decreasing child poverty.
The number of single-parent families in Canada has more than doubled in the last 30 years.
16.4% of all families in Canada were single-parent in 2021, mostly led by women.
29.3% of children in female-led lone-parent families lived below the poverty line in 2023, almost four times the rate of those in couple families (7.5%).
(Sources: A portrait of Canada's families in 2021, Statistics Canada Table 11-10-0135-01.)
ESDC supports children and families through key income and social programs such as:
- Canada Child Benefit
- Early Learning and Child Care
- Child Disability Benefit
- National School Food Program
- Canada Learning Bond
- Canada Education Savings Grant
- Social Development Partnerships Program - Children and Families
Youth and young adults
Youth often face difficulties entering the labour market. They are more likely to be unemployed, and when employed, they are more likely to be in low-wage and unstable jobs.
13.1% of youth aged 15 to 24 were unemployed in 2024, more than double the rate for those aged 25 to 54 (5.4%).
12% of youth aged 15 to 24 were neither in employment, education or training in 2024, up from 11% in 2023.
(Sources: Statistics Canada Tables 14-10-0375-01, 37-10-0196-01.)
ESDC helps youth to kickstart their careers by providing financial aid, improving access to post-secondary education, supporting employment opportunities and apprenticeships, and connecting job-seekers with employers.
List of ESDC programs supporting youth and young adults:
- Canada Student Grants and Loans
- Supports for Student Learning Program
- Youth Employment and Skills Strategy
- Canadian Apprenticeship Strategy
Working-age adults
Unemployed and unattached working-age (18 to 64 years of age) persons face significant economic vulnerabilities.
46% of "workers in poverty" -those who have substantial employment -were unattached individuals in 2019.
47% of working-age Canadians living in poverty were employed in 2022.
(Sources: CIS 2019 and 2022 internal calculations.)
ESDC assists working-age adults primarily through key income supports to help them meet their basic needs.
List of ESDC programs supporting working-age adults:
- Employment Insurance
- Canada Workers Benefit
- Foreign Credential Recognition Program
- Skills and apprenticeship programs
Older adults and seniors
In 2023, seniors had the lowest poverty rate among all age groups, whereas the rate for those aged 18-64 was more than double. This is partly due to ESDC's public pension programs.
However, income security remains a concern as some households have not managed to build robust financial safety nets.
1 in 5 pre-retirement workers aged 55 to 64 have never set aside any money for retirement.
(Sources: Statistics Canada Table 11-10-0135-01, 2023 Canadian Retirement Survey by Healthcare of Ontario Pension Plan.)
ESDC programs enable seniors to live with dignity and security by providing crucial income stability and services to age comfortably at home, and by supporting local projects to improve quality of life.
List of ESDC programs supporting older adults and seniors:
- Old Age Security
- Guaranteed Income Supplement
- Canada Pension Plan
- New Horizons for Seniors Program
- Age Well at Home Initiative
Persons with disabilities
Overall, persons with disabilities face greater challenges in finding employment, tend to have lower incomes, and are more likely to experience poverty than those without disabilities.
Diagram 7: A bar chart shows the unemployment rate in 2023, broken down by disability status including no disability and mild, moderate, severe, and very severe disability. The unemployment rate was lowest for those without a disability at 4.6%, and gradually increases with increasing severity of disability, to the highest rate for those with very severe disability at 11.5%.
| Disability status | Unemployment rate |
|---|---|
| No disability | 4.6% |
| Mild disability | 6.8% |
| Moderate disability | 8.1% |
| Severe disability | 8.4% |
| Very severe disability | 11.5% |
-
(Source Diagram 7: Statistics Canada Table 14-10-0478-01.)
The average hourly wage for individuals with disabilities was 5.6% (or $1.91 per hour) lower than for those without disabilities in 2023.
(Source: Labour market characteristics of persons with and without disabilities 2023.)
ESDC supports persons with disabilities by providing financial security, partial income replacement for those who work, and funding for communities and organizations who promote accessibility.
List of ESDC programs supporting persons with disability:
- Canada Disability Benefit
- Canada Disability Savings Program
- Canada Pension Plan disability benefits
- Enabling Accessibility Fund
- Social Development Partnerships Program - Disability
Indigenous Peoples
Indigenous Peoples face disproportionate barriers which have lasting impacts on their ability to accumulate wealth and achieve economic stability.
9.9% of Indigenous people were unemployed in 2024, compared to 6.2% for non-Indigenous people. (Note: data does not include those living on reserve or in the territories).
The average hourly wage for Indigenous people living off-reserve was 10.4% (or $3.65 per hour) lower than for non-Indigenous people in 2024.
(Sources: Statistics Canada Tables 14-10-0365-01, 14-10-0418-01.)
ESDC programs promote high-quality, culturally specific early learning and child care designed for and with Indigenous communities. They also help Indigenous people improve their skills and find employment.
List of ESDC programs supporting Indigenous people:
- Indigenous Early Learning and Child Care
- Indigenous Skills and Employment Training Program
- Skills and Partnership Fund
Looking forward
ESDC's existing and new social protection measures will continue to improve affordability, reduce poverty, and promote income equality, which are linked to improving health, wellbeing and social cohesion.
The demand for ESDC's programs will likely rise as Canadians face uncertain and challenging times, driven by factors like the implementation of tariffs and the effects of climate change, which risk further lowering financial wellbeing and security.
Canada's Labour Market: Navigating uncertainty
Alternate formats
Canada’s Labour Market: Navigating uncertainty [PDF - 10,08 KB]
Large print, braille, MP3 (audio), e-text and DAISY formats are available on demand by ordering online or calling 1 800 O-Canada (1-800-622-6232). If you use a teletypewriter (TTY), call 1-800-926-9105.
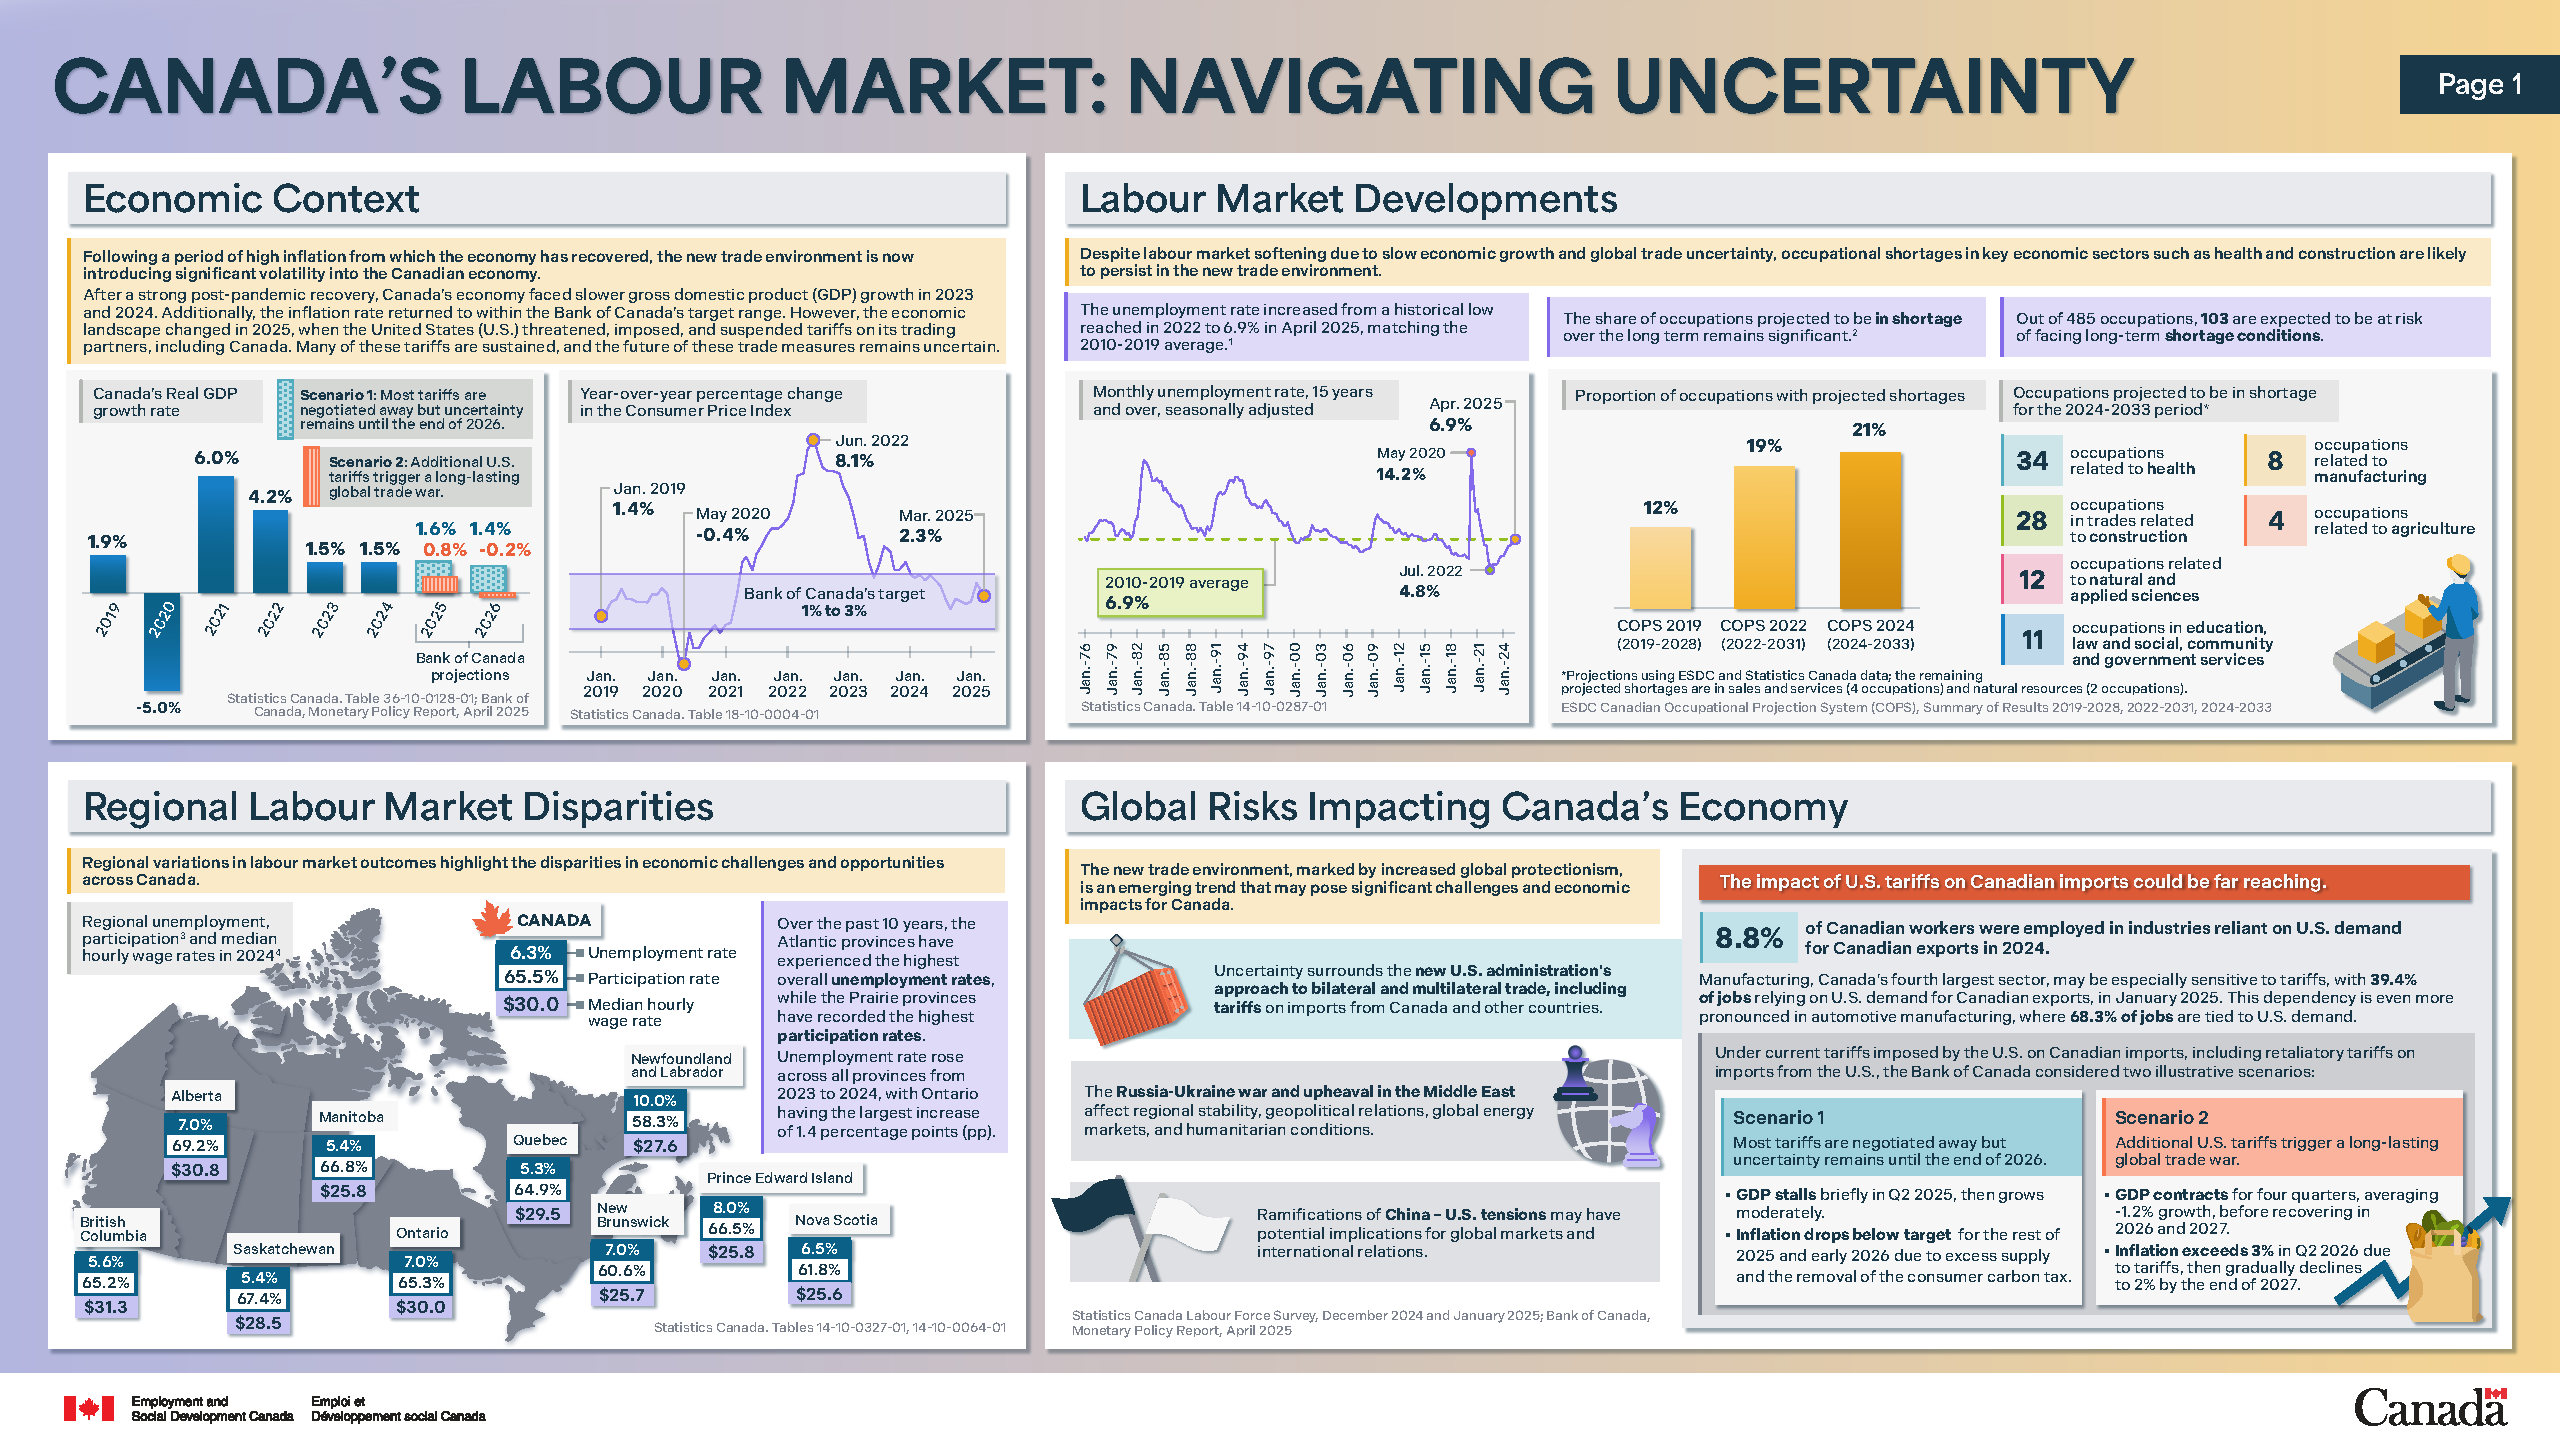
Figure 2.7 (page 1) Text description
Economic context
Following a period of high inflation from which the economy has recovered, the new trade environment is now introducing significant volatility into the Canadian economy.
After a strong post-pandemic recovery, Canada's economy faced slower gross domestic product (GDP) growth in 2023 and 2024. Additionally, the inflation rate returned to within the Bank of Canada's target range. However, the economic landscape changed in 2025, when the United States (U.S.) threatened, imposed, and suspended tariffs on its trading partners, including Canada. Many of these tariffs are sustained, and the future of these trade measures remains uncertain.
Diagram 1: A bar chart showing Canada's real GDP growth rate between 2019 and 2024. The chart shows positive growth during the period, except for a decline in 2020. The chart also depicts two 2 scenarios projected by the Bank of Canada for 2025 and 2026. In scenario 1, most tariffs are negotiated away but uncertainty remains until the end of 2026. Under this setting, the GDP growth experiences a marginal increase in 2025, followed by a light decline in 2026. In scenario 2, additional U.S. tariffs trigger a long-lasting global trade war with negative growth in 2026. Under this setting, the GDP growth slows down significantly in 2025, nearly halving year over year, and eventually reaches negative growth in 2026.
| Year | Scenario 1 | Scenario 2 |
|---|---|---|
| 2019 | 1.9% | 1.9% |
| 2020 | -5.0% | -5.0% |
| 2021 | 6.0% | 6.0% |
| 2022 | 4.2% | 4.2% |
| 2023 | 1.5% | 1.5% |
| 2024 | 1.5% | 1.5% |
| 2025 | 1.6% (projection) | 0.8% (projection) |
| 2026 | 1.4% (projection) | -0.2% (projection) |
-
(Sources: Statistics Canada Table 36-10-0128-01; Bank of Canada, Monetary Policy Report, April 2025.)
Diagram 2: A line graph showing year-over-year percentage change in the Consumer Price Index from January 2019 to March 2025, with the Bank of Canada's target range of 1% to 3%. The chart shows a consumer price index of 1.4% in January 2019, which remains within the target range until April 2020. It reaches its lowest rate of -0.4% in May 2020, followed by a steady increase to its peak of 8.1% in June 2022. It then declines to 2.3% by March 2025, sitting within the Bank of Canada's target range.
Diagram 2 data: Monthly inflation rate from January 2019 to March 2025, not seasonally adjusted
| Period | Inflation rate |
|---|---|
| January 2019 | 1.4% |
| February 2019 | 1.5% |
| March 2019 | 1.9% |
| April 2019 | 2.0% |
| May 2019 | 2.4% |
| June 2019 | 2.0% |
| July 2019 | 2.0% |
| August 2019 | 1.9% |
| September 2019 | 1.9% |
| October 2019 | 1.9% |
| November 2019 | 2.2% |
| December 2019 | 2.2% |
| January 2020 | 2.4% |
| February 2020 | 2.2% |
| March 2020 | 0.9% |
| April 2020 | -0.2% |
| May 2020 | -0.4% |
| June 2020 | 0.7% |
| July 2020 | 0.1% |
| August 2020 | 0.1% |
| September 2020 | 0.5% |
| October 2020 | 0.7% |
| November 2020 | 1.0% |
| December 2020 | 0.7% |
| January 2021 | 1.0% |
| February 2021 | 1.1% |
| March 2021 | 2.2% |
| April 2021 | 3.4% |
| May 2021 | 3.6% |
| June 2021 | 3.1% |
| July 2021 | 3.7% |
| August 2021 | 4.1% |
| September 2021 | 4.4% |
| October 2021 | 4.7% |
| November 2021 | 4.7% |
| December 2021 | 4.8% |
| January 2022 | 5.1% |
| February 2022 | 5.7% |
| March 2022 | 6.7% |
| April 2022 | 6.8% |
| May 2022 | 7.7% |
| June 2022 | 8.1% |
| July 2022 | 7.6% |
| August 2022 | 7.0% |
| September 2022 | 6.9% |
| October 2022 | 6.9% |
| November 2022 | 6.8% |
| December 2022 | 6.3% |
| January 2023 | 5.9% |
| February 2023 | 5.2% |
| March 2023 | 4.3% |
| April 2023 | 4.4% |
| May 2023 | 3.4% |
| June 2023 | 2.8% |
| July 2023 | 3.3% |
| August 2023 | 4.0% |
| September 2023 | 3.8% |
| October 2023 | 3.1% |
| November 2023 | 3.1% |
| December 2023 | 3.4% |
| January 2024 | 2.9% |
| February 2024 | 2.8% |
| March 2024 | 2.9% |
| April 2024 | 2.7% |
| May 2024 | 2.9% |
| June 2024 | 2.7% |
| July 2024 | 2.5% |
| August 2024 | 2.0% |
| September 2024 | 1.6% |
| October 2024 | 2.0% |
| November 2024 | 1.9% |
| December 2024 | 1.8% |
| January 2025 | 1.9% |
| February 2025 | 2.6% |
| March 2025 | 2.3% |
- (Source: Statistics Canada Table 18-10-0004-01.)
Labour market developments
Despite labour market softening due to slow economic growth and global trade uncertainty, occupational shortages in key economic sectors such as health and construction are likely to persist in the new trade environment.
The unemployment rate increased from a historical low reached in 2022 to 6.9% in April 2025, matching the 2010 to 2019 average.
Note: According to the Bank of Canada, the increase in unemployment reflects a rising share of the unemployed continuing to be unable to find work and a growing share of new workers joining the labour force without a job, rather than layoffs.
Diagram 3: A line chart depicting the seasonally adjusted monthly unemployment rate for individuals 15 years and over, from January 1976 to April 2025. The chart shows a general downward trend in the unemployment rate, though it has predominantly remained above the 2010 to 2019 average of 6.9%. Unemployment reached its peak at 14.2% in May 2020, followed by a gradual decline to a historical low of 4.8% in July 2022. It has since increased, reaching 6.9% in April 2025.
Diagram 3 data: Monthly unemployment rate for individuals 15 years and over, from January 1976 to April 2025, seasonally adjusted
| Period | Unemployment rate |
|---|---|
| January 1976 | 7.1% |
| February 1976 | 7.0% |
| March 1976 | 6.7% |
| April 1976 | 6.8% |
| May 1976 | 6.9% |
| June 1976 | 6.9% |
| July 1976 | 7.4% |
| August 1976 | 7.1% |
| September 1976 | 7.0% |
| October 1976 | 7.4% |
| November 1976 | 7.4% |
| December 1976 | 7.5% |
| January 1977 | 7.6% |
| February 1977 | 7.9% |
| March 1977 | 7.8% |
| April 1977 | 7.9% |
| May 1977 | 7.8% |
| June 1977 | 7.8% |
| July 1977 | 8.1% |
| August 1977 | 8.2% |
| September 1977 | 8.3% |
| October 1977 | 8.4% |
| November 1977 | 8.5% |
| December 1977 | 8.5% |
| January 1978 | 8.3% |
| February 1978 | 8.3% |
| March 1978 | 8.5% |
| April 1978 | 8.4% |
| May 1978 | 8.6% |
| June 1978 | 8.4% |
| July 1978 | 8.3% |
| August 1978 | 8.4% |
| September 1978 | 8.4% |
| October 1978 | 8.2% |
| November 1978 | 8.3% |
| December 1978 | 8.3% |
| January 1979 | 8.2% |
| February 1979 | 8.0% |
| March 1979 | 7.9% |
| April 1979 | 8.0% |
| May 1979 | 7.6% |
| June 1979 | 7.4% |
| July 1979 | 7.2% |
| August 1979 | 7.1% |
| September 1979 | 7.0% |
| October 1979 | 7.2% |
| November 1979 | 7.2% |
| December 1979 | 7.2% |
| January 1980 | 7.5% |
| February 1980 | 7.6% |
| March 1980 | 7.6% |
| April 1980 | 7.7% |
| May 1980 | 7.8% |
| June 1980 | 7.7% |
| July 1980 | 7.6% |
| August 1980 | 7.6% |
| September 1980 | 7.3% |
| October 1980 | 7.3% |
| November 1980 | 7.2% |
| December 1980 | 7.3% |
| January 1981 | 7.4% |
| February 1981 | 7.4% |
| March 1981 | 7.4% |
| April 1981 | 7.1% |
| May 1981 | 7.2% |
| June 1981 | 7.2% |
| July 1981 | 7.2% |
| August 1981 | 7.1% |
| September 1981 | 8.1% |
| October 1981 | 8.3% |
| November 1981 | 8.3% |
| December 1981 | 8.7% |
| January 1982 | 8.6% |
| February 1982 | 8.9% |
| March 1982 | 9.3% |
| April 1982 | 9.8% |
| May 1982 | 10.3% |
| June 1982 | 11.1% |
| July 1982 | 11.9% |
| August 1982 | 12.0% |
| September 1982 | 12.4% |
| October 1982 | 12.9% |
| November 1982 | 12.9% |
| December 1982 | 13.1% |
| January 1983 | 12.7% |
| February 1983 | 12.7% |
| March 1983 | 12.5% |
| April 1983 | 12.4% |
| May 1983 | 12.4% |
| June 1983 | 12.4% |
| July 1983 | 11.9% |
| August 1983 | 11.7% |
| September 1983 | 11.4% |
| October 1983 | 11.3% |
| November 1983 | 11.3% |
| December 1983 | 11.3% |
| January 1984 | 11.3% |
| February 1984 | 11.3% |
| March 1984 | 11.3% |
| April 1984 | 11.5% |
| May 1984 | 11.7% |
| June 1984 | 11.3% |
| July 1984 | 11.2% |
| August 1984 | 11.3% |
| September 1984 | 11.8% |
| October 1984 | 11.3% |
| November 1984 | 11.4% |
| December 1984 | 11.1% |
| January 1985 | 10.6% |
| February 1985 | 10.8% |
| March 1985 | 11.0% |
| April 1985 | 10.8% |
| May 1985 | 10.6% |
| June 1985 | 10.7% |
| July 1985 | 10.4% |
| August 1985 | 10.3% |
| September 1985 | 10.2% |
| October 1985 | 10.3% |
| November 1985 | 10.3% |
| December 1985 | 10.1% |
| January 1986 | 9.8% |
| February 1986 | 9.9% |
| March 1986 | 9.8% |
| April 1986 | 9.7% |
| May 1986 | 9.5% |
| June 1986 | 9.6% |
| July 1986 | 9.6% |
| August 1986 | 9.6% |
| September 1986 | 9.5% |
| October 1986 | 9.4% |
| November 1986 | 9.4% |
| December 1986 | 9.5% |
| January 1987 | 9.5% |
| February 1987 | 9.5% |
| March 1987 | 9.4% |
| April 1987 | 9.2% |
| May 1987 | 8.9% |
| June 1987 | 8.9% |
| July 1987 | 8.7% |
| August 1987 | 8.6% |
| September 1987 | 8.4% |
| October 1987 | 8.3% |
| November 1987 | 8.2% |
| December 1987 | 8.0% |
| January 1988 | 8.1% |
| February 1988 | 7.8% |
| March 1988 | 7.8% |
| April 1988 | 7.7% |
| May 1988 | 7.8% |
| June 1988 | 7.6% |
| July 1988 | 7.8% |
| August 1988 | 7.8% |
| September 1988 | 7.8% |
| October 1988 | 7.8% |
| November 1988 | 7.8% |
| December 1988 | 7.5% |
| January 1989 | 7.5% |
| February 1989 | 7.6% |
| March 1989 | 7.5% |
| April 1989 | 7.8% |
| May 1989 | 7.7% |
| June 1989 | 7.5% |
| July 1989 | 7.5% |
| August 1989 | 7.3% |
| September 1989 | 7.3% |
| October 1989 | 7.2% |
| November 1989 | 7.5% |
| December 1989 | 7.7% |
| January 1990 | 7.9% |
| February 1990 | 7.7% |
| March 1990 | 7.3% |
| April 1990 | 7.6% |
| May 1990 | 7.8% |
| June 1990 | 7.6% |
| July 1990 | 7.9% |
| August 1990 | 8.1% |
| September 1990 | 8.5% |
| October 1990 | 8.8% |
| November 1990 | 9.1% |
| December 1990 | 9.5% |
| January 1991 | 9.8% |
| February 1991 | 10.2% |
| March 1991 | 10.5% |
| April 1991 | 10.3% |
| May 1991 | 10.2% |
| June 1991 | 10.5% |
| July 1991 | 10.5% |
| August 1991 | 10.5% |
| September 1991 | 10.3% |
| October 1991 | 10.3% |
| November 1991 | 10.4% |
| December 1991 | 10.3% |
| January 1992 | 10.4% |
| February 1992 | 10.5% |
| March 1992 | 10.9% |
| April 1992 | 10.7% |
| May 1992 | 10.9% |
| June 1992 | 11.4% |
| July 1992 | 11.3% |
| August 1992 | 11.7% |
| September 1992 | 11.6% |
| October 1992 | 11.4% |
| November 1992 | 12.1% |
| December 1992 | 11.7% |
| January 1993 | 11.2% |
| February 1993 | 11.0% |
| March 1993 | 11.2% |
| April 1993 | 11.6% |
| May 1993 | 11.6% |
| June 1993 | 11.7% |
| July 1993 | 11.6% |
| August 1993 | 11.2% |
| September 1993 | 11.5% |
| October 1993 | 11.3% |
| November 1993 | 11.2% |
| December 1993 | 11.4% |
| January 1994 | 11.4% |
| February 1994 | 11.1% |
| March 1994 | 10.6% |
| April 1994 | 10.9% |
| May 1994 | 10.7% |
| June 1994 | 10.3% |
| July 1994 | 10.1% |
| August 1994 | 10.2% |
| September 1994 | 10.1% |
| October 1994 | 10.0% |
| November 1994 | 9.7% |
| December 1994 | 9.6% |
| January 1995 | 9.6% |
| February 1995 | 9.6% |
| March 1995 | 9.7% |
| April 1995 | 9.5% |
| May 1995 | 9.5% |
| June 1995 | 9.5% |
| July 1995 | 9.6% |
| August 1995 | 9.5% |
| September 1995 | 9.2% |
| October 1995 | 9.3% |
| November 1995 | 9.2% |
| December 1995 | 9.4% |
| January 1996 | 9.4% |
| February 1996 | 9.5% |
| March 1996 | 9.6% |
| April 1996 | 9.3% |
| May 1996 | 9.2% |
| June 1996 | 9.8% |
| July 1996 | 9.7% |
| August 1996 | 9.4% |
| September 1996 | 9.9% |
| October 1996 | 9.9% |
| November 1996 | 9.9% |
| December 1996 | 9.7% |
| January 1997 | 9.5% |
| February 1997 | 9.5% |
| March 1997 | 9.3% |
| April 1997 | 9.4% |
| May 1997 | 9.4% |
| June 1997 | 9.1% |
| July 1997 | 8.9% |
| August 1997 | 8.9% |
| September 1997 | 8.8% |
| October 1997 | 8.9% |
| November 1997 | 8.9% |
| December 1997 | 8.5% |
| January 1998 | 8.8% |
| February 1998 | 8.6% |
| March 1998 | 8.4% |
| April 1998 | 8.3% |
| May 1998 | 8.3% |
| June 1998 | 8.4% |
| July 1998 | 8.3% |
| August 1998 | 8.1% |
| September 1998 | 8.2% |
| October 1998 | 8.0% |
| November 1998 | 8.0% |
| December 1998 | 8.1% |
| January 1999 | 7.9% |
| February 1999 | 7.9% |
| March 1999 | 7.9% |
| April 1999 | 8.2% |
| May 1999 | 7.9% |
| June 1999 | 7.6% |
| July 1999 | 7.6% |
| August 1999 | 7.4% |
| September 1999 | 7.5% |
| October 1999 | 7.2% |
| November 1999 | 6.9% |
| December 1999 | 6.8% |
| January 2000 | 6.8% |
| February 2000 | 6.9% |
| March 2000 | 6.9% |
| April 2000 | 6.7% |
| May 2000 | 6.6% |
| June 2000 | 6.7% |
| July 2000 | 6.8% |
| August 2000 | 7.0% |
| September 2000 | 6.9% |
| October 2000 | 7.0% |
| November 2000 | 6.9% |
| December 2000 | 6.8% |
| January 2001 | 6.9% |
| February 2001 | 7.0% |
| March 2001 | 7.1% |
| April 2001 | 7.1% |
| May 2001 | 7.0% |
| June 2001 | 7.2% |
| July 2001 | 7.1% |
| August 2001 | 7.2% |
| September 2001 | 7.2% |
| October 2001 | 7.3% |
| November 2001 | 7.5% |
| December 2001 | 8.1% |
| January 2002 | 8.0% |
| February 2002 | 7.9% |
| March 2002 | 7.9% |
| April 2002 | 7.7% |
| May 2002 | 7.8% |
| June 2002 | 7.6% |
| July 2002 | 7.6% |
| August 2002 | 7.4% |
| September 2002 | 7.6% |
| October 2002 | 7.6% |
| November 2002 | 7.5% |
| December 2002 | 7.6% |
| January 2003 | 7.5% |
| February 2003 | 7.5% |
| March 2003 | 7.4% |
| April 2003 | 7.6% |
| May 2003 | 7.8% |
| June 2003 | 7.6% |
| July 2003 | 7.7% |
| August 2003 | 7.8% |
| September 2003 | 7.9% |
| October 2003 | 7.6% |
| November 2003 | 7.4% |
| December 2003 | 7.3% |
| January 2004 | 7.3% |
| February 2004 | 7.3% |
| March 2004 | 7.3% |
| April 2004 | 7.2% |
| May 2004 | 7.1% |
| June 2004 | 7.2% |
| July 2004 | 7.1% |
| August 2004 | 7.0% |
| September 2004 | 6.9% |
| October 2004 | 7.1% |
| November 2004 | 7.2% |
| December 2004 | 7.1% |
| January 2005 | 6.9% |
| February 2005 | 7.0% |
| March 2005 | 6.9% |
| April 2005 | 6.7% |
| May 2005 | 7.0% |
| June 2005 | 6.8% |
| July 2005 | 6.7% |
| August 2005 | 6.7% |
| September 2005 | 6.7% |
| October 2005 | 6.7% |
| November 2005 | 6.3% |
| December 2005 | 6.6% |
| January 2006 | 6.7% |
| February 2006 | 6.6% |
| March 2006 | 6.5% |
| April 2006 | 6.5% |
| May 2006 | 6.2% |
| June 2006 | 6.3% |
| July 2006 | 6.5% |
| August 2006 | 6.5% |
| September 2006 | 6.5% |
| October 2006 | 6.3% |
| November 2006 | 6.5% |
| December 2006 | 6.3% |
| January 2007 | 6.4% |
| February 2007 | 6.3% |
| March 2007 | 6.3% |
| April 2007 | 6.3% |
| May 2007 | 6.2% |
| June 2007 | 6.1% |
| July 2007 | 6.0% |
| August 2007 | 6.0% |
| September 2007 | 6.0% |
| October 2007 | 6.0% |
| November 2007 | 6.1% |
| December 2007 | 6.2% |
| January 2008 | 6.1% |
| February 2008 | 6.1% |
| March 2008 | 6.2% |
| April 2008 | 6.2% |
| May 2008 | 6.2% |
| June 2008 | 6.1% |
| July 2008 | 6.2% |
| August 2008 | 6.2% |
| September 2008 | 6.3% |
| October 2008 | 6.4% |
| November 2008 | 6.7% |
| December 2008 | 7.0% |
| January 2009 | 7.5% |
| February 2009 | 8.1% |
| March 2009 | 8.4% |
| April 2009 | 8.4% |
| May 2009 | 8.7% |
| June 2009 | 8.8% |
| July 2009 | 8.8% |
| August 2009 | 8.7% |
| September 2009 | 8.5% |
| October 2009 | 8.6% |
| November 2009 | 8.6% |
| December 2009 | 8.6% |
| January 2010 | 8.4% |
| February 2010 | 8.4% |
| March 2010 | 8.3% |
| April 2010 | 8.2% |
| May 2010 | 8.2% |
| June 2010 | 8.0% |
| July 2010 | 8.2% |
| August 2010 | 8.2% |
| September 2010 | 8.2% |
| October 2010 | 8.1% |
| November 2010 | 7.9% |
| December 2010 | 7.8% |
| January 2011 | 7.8% |
| February 2011 | 7.8% |
| March 2011 | 7.8% |
| April 2011 | 7.8% |
| May 2011 | 7.7% |
| June 2011 | 7.7% |
| July 2011 | 7.4% |
| August 2011 | 7.4% |
| September 2011 | 7.5% |
| October 2011 | 7.5% |
| November 2011 | 7.6% |
| December 2011 | 7.5% |
| January 2012 | 7.7% |
| February 2012 | 7.6% |
| March 2012 | 7.4% |
| April 2012 | 7.4% |
| May 2012 | 7.6% |
| June 2012 | 7.4% |
| July 2012 | 7.3% |
| August 2012 | 7.4% |
| September 2012 | 7.4% |
| October 2012 | 7.4% |
| November 2012 | 7.4% |
| December 2012 | 7.3% |
| January 2013 | 7.1% |
| February 2013 | 7.1% |
| March 2013 | 7.3% |
| April 2013 | 7.2% |
| May 2013 | 7.1% |
| June 2013 | 7.2% |
| July 2013 | 7.3% |
| August 2013 | 7.3% |
| September 2013 | 7.1% |
| October 2013 | 7.3% |
| November 2013 | 7.1% |
| December 2013 | 7.4% |
| January 2014 | 7.3% |
| February 2014 | 7.3% |
| March 2014 | 7.1% |
| April 2014 | 7.1% |
| May 2014 | 7.3% |
| June 2014 | 7.2% |
| July 2014 | 7.1% |
| August 2014 | 7.0% |
| September 2014 | 7.0% |
| October 2014 | 6.8% |
| November 2014 | 6.8% |
| December 2014 | 6.7% |
| January 2015 | 6.8% |
| February 2015 | 6.9% |
| March 2015 | 6.9% |
| April 2015 | 7.0% |
| May 2015 | 6.9% |
| June 2015 | 6.9% |
| July 2015 | 7.0% |
| August 2015 | 7.1% |
| September 2015 | 7.1% |
| October 2015 | 7.0% |
| November 2015 | 7.1% |
| December 2015 | 7.3% |
| January 2016 | 7.2% |
| February 2016 | 7.3% |
| March 2016 | 7.2% |
| April 2016 | 7.3% |
| May 2016 | 7.1% |
| June 2016 | 7.0% |
| July 2016 | 7.0% |
| August 2016 | 6.9% |
| September 2016 | 7.0% |
| October 2016 | 6.9% |
| November 2016 | 6.8% |
| December 2016 | 6.9% |
| January 2017 | 6.9% |
| February 2017 | 6.6% |
| March 2017 | 6.7% |
| April 2017 | 6.5% |
| May 2017 | 6.6% |
| June 2017 | 6.5% |
| July 2017 | 6.3% |
| August 2017 | 6.2% |
| September 2017 | 6.2% |
| October 2017 | 6.3% |
| November 2017 | 6.2% |
| December 2017 | 6.0% |
| January 2018 | 5.9% |
| February 2018 | 6.0% |
| March 2018 | 5.8% |
| April 2018 | 5.8% |
| May 2018 | 5.9% |
| June 2018 | 6.0% |
| July 2018 | 5.9% |
| August 2018 | 6.0% |
| September 2018 | 5.8% |
| October 2018 | 5.6% |
| November 2018 | 5.7% |
| December 2018 | 5.6% |
| January 2019 | 5.7% |
| February 2019 | 5.8% |
| March 2019 | 5.8% |
| April 2019 | 5.7% |
| May 2019 | 5.5% |
| June 2019 | 5.6% |
| July 2019 | 5.7% |
| August 2019 | 5.7% |
| September 2019 | 5.6% |
| October 2019 | 5.6% |
| November 2019 | 5.9% |
| December 2019 | 5.6% |
| January 2020 | 5.5% |
| February 2020 | 5.8% |
| March 2020 | 8.5% |
| April 2020 | 13.7% |
| May 2020 | 14.2% |
| June 2020 | 12.6% |
| July 2020 | 10.9% |
| August 2020 | 10.1% |
| September 2020 | 9.1% |
| October 2020 | 9.0% |
| November 2020 | 8.6% |
| December 2020 | 8.9% |
| January 2021 | 9.2% |
| February 2021 | 8.5% |
| March 2021 | 7.7% |
| April 2021 | 8.2% |
| May 2021 | 8.3% |
| June 2021 | 7.9% |
| July 2021 | 7.4% |
| August 2021 | 7.1% |
| September 2021 | 7.0% |
| October 2021 | 6.5% |
| November 2021 | 6.1% |
| December 2021 | 5.9% |
| January 2022 | 6.4% |
| February 2022 | 5.5% |
| March 2022 | 5.4% |
| April 2022 | 5.4% |
| May 2022 | 5.2% |
| June 2022 | 4.9% |
| July 2022 | 4.8% |
| August 2022 | 5.2% |
| September 2022 | 5.1% |
| October 2022 | 5.1% |
| November 2022 | 5.0% |
| December 2022 | 5.0% |
| January 2023 | 5.1% |
| February 2023 | 5.1% |
| March 2023 | 5.0% |
| April 2023 | 5.1% |
| May 2023 | 5.2% |
| June 2023 | 5.4% |
| July 2023 | 5.5% |
| August 2023 | 5.5% |
| September 2023 | 5.5% |
| October 2023 | 5.7% |
| November 2023 | 5.7% |
| December 2023 | 5.8% |
| January 2024 | 5.7% |
| February 2024 | 5.9% |
| March 2024 | 6.1% |
| April 2024 | 6.2% |
| May 2024 | 6.3% |
| June 2024 | 6.4% |
| July 2024 | 6.4% |
| August 2024 | 6.7% |
| September 2024 | 6.6% |
| October 2024 | 6.6% |
| November 2024 | 6.9% |
| December 2024 | 6.7% |
| January 2025 | 6.6% |
| February 2025 | 6.6% |
| March 2025 | 6.7% |
| April 2025 | 6.9% |
- (Source: Statistics Canada Table 14-10-0287-01.)
The share of occupations projected to be in shortage over the long term remains significant.
Diagram 4: A bar chart showing the proportion of occupations with projected shortages for 2019 to 2028, 2022 to 2031 and 2024 to 2033.
| Period | Proportion |
|---|---|
| 2019 to 2028 (COPS 2019) | 12% |
| 2022 to 2031 (COPS 2022) | 19% |
| 2024 to 2033 (COPS 2024) | 21% |
-
Note: Direct comparisons between COPS 2024 and previous COPS exercises should be made with caution given changes to the methodology as well as the redesigned National Occupation Classification (NOC) system (2021 version).
(Sources: ESDC Canadian Occupational Projection System (COPS), Summary of Results, 2019 to 2028, 2022 to 2031, 2024 to 2033.)
Out of 485 occupations, 103 are expected to be at risk of facing long-term shortage conditions. Over the 2024 to 2033 period, the following number of occupations are projected to be in shortage:
- 34 occupations related to health
- 28 occupations in trades related to construction
- 12 occupations related to natural and applied sciences
- 11 occupations in education, law and social, community and government services
- 8 occupations related to manufacturing
- 4 occupations related to agriculture
Note: The projections use ESDC and Statistics Canada data; the remaining projected shortages are in sales and services (4 occupations) and natural resources (2 occupations).
(Sources: ESDC Canadian Occupational Projection System (COPS), Summary of Results, 2019 to 2028, 2022 to 2031, 2024 to 2033.)
Regional labour market disparities
Regional variations in labour market outcomes highlight the disparities in economic challenges and opportunities across Canada. Over the past 10 years, the Atlantic provinces have experienced the highest overall unemployment rates, while the Prairie provinces have recorded the highest participation rates. Unemployment rates rose across all provinces from 2023 to 2024, with Ontario having the largest increase of 1.4 percentage points.
Diagram 5: A map of Canada showing regional unemployment, participation and median hourly wage rates in 2024. The participation rate is the number of labour force participants expressed as a percentage of the population aged 15 and over. Data are for the population aged 15 and over, and exclude territories.
| Region | Unemployment rate | Participation rate | Median hourly wage rate |
|---|---|---|---|
| Canada | 6.3% | 65.5% | $30.0 |
| Newfoundland and Labrador | 10.0% | 58.3% | $27.6 |
| Prince Edward Island | 8.0% | 66.5% | $25.8 |
| Nova Scotia | 6.5% | 61.8% | $25.6 |
| New Brunswick | 7.0% | 60.6% | $25.7 |
| Quebec | 5.3% | 64.9% | $29.5 |
| Ontario | 7.0% | 65.3% | $30.0 |
| Manitoba | 5.4% | 66.8% | $25.8 |
| Saskatchewan | 5.4% | 67.4% | $28.5 |
| Alberta | 7.0% | 69.2% | $30.8 |
| British Columbia | 5.6% | 65.2% | $31.3 |
-
(Sources: Statistics Canada Tables 14-10-0327-01, 14-10-0064-01.)
Global risks impacting Canada's economy
The new trade environment, marked by increased global protectionism, is an emerging trend that may pose significant challenges and economic impacts for Canada.
- Uncertainty surrounds the new U.S. administration's approach to bilateral and multilateral trade, including tariffs on imports from Canada and other countries.
- The Russia-Ukraine war and upheaval in the Middle East affects regional stability, geopolitical relations, global energy markets, and humanitarian conditions.
- Ramifications of China - U.S. tensions may have potential implications for global markets and international relations.
The impact of U.S. tariffs on Canadian imports could be far reaching.
8.8% of Canadian workers were employed in industries reliant on U.S. demand for Canadian exports in 2024.
(Source: Statistics Canada Labour Force Survey, December 2024.)
Manufacturing, Canada's fourth largest sector, may be especially sensitive to tariffs, with 39.4% of jobs relying on U.S. demand for Canadian exports, in January 2025. This dependency is even more pronounced in automotive manufacturing, where 68.3% of jobs are tied to U.S. demand.
(Source: Statistics Canada Labour Force Survey January 2025.)
Under current tariffs imposed by the U.S. on Canadian imports, including retaliatory tariffs on imports from the U.S., the Bank of Canada considered 2 illustrative scenarios.
- Scenario 1: Most tariffs are negotiated away but uncertainty remains until the end of 2026
- GDP stalls briefly in Q2 2025, then grows moderately
- Inflation drops below target for the rest of 2025 and early 2026 due to excess supply and the removal of the consumer carbon tax
- Scenario 2: Additional U.S. tariffs trigger a long-lasting global trade war
- GDP contracts for four 4 quarters, averaging -1.2% growth, before recovering in 2026 and 2027
- Inflation exceeds 3% in Q2 2026 due to tariffs, then gradually declines to 2% by the end of 2027
(Source: Bank of Canada, Monetary Policy Report, April 2025.)
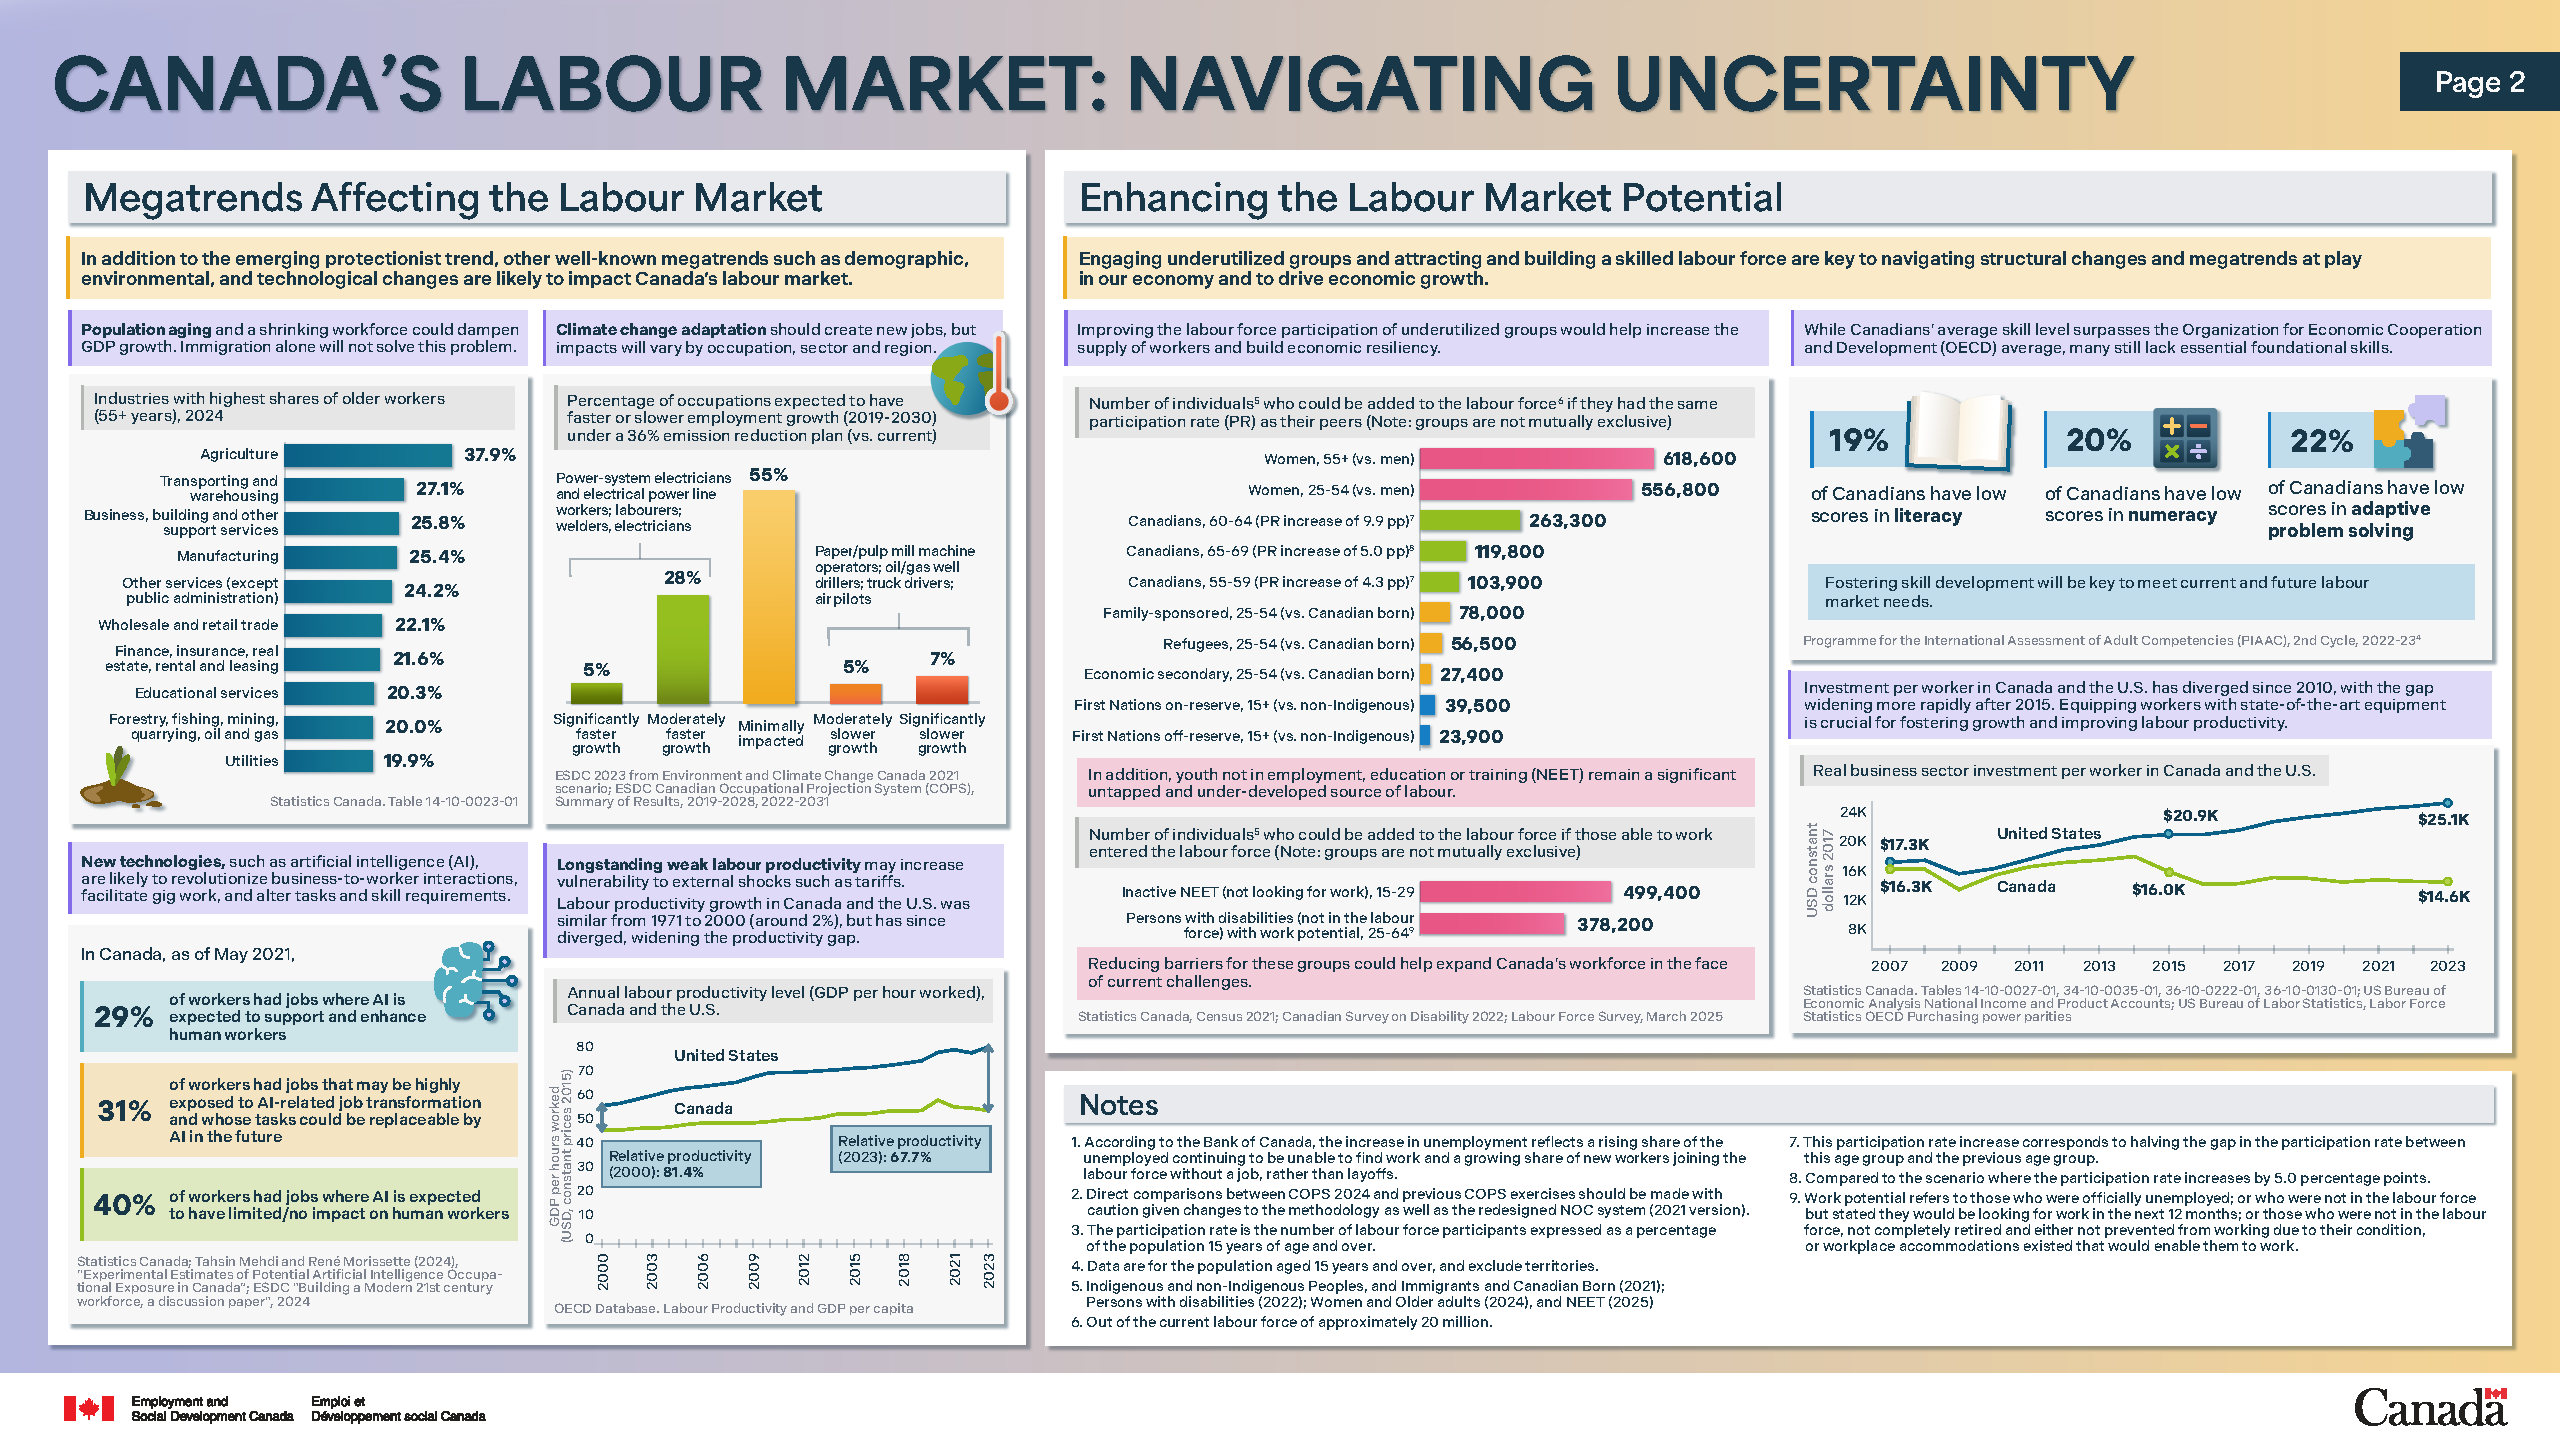
Figure 2.7 (page 2) Text description
Megatrends affecting the labour market
In addition to the emerging protectionist trend, other well-known megatrends such as demographic, environmental, and technological changes are likely to impact Canada's Labour Market.
Population aging and a shrinking workforce could dampen GDP growth. Immigration alone cannot solve this problem.
Diagram 6: A bar chart showing industries with the highest shares of older workers (55 years and over) in 2024. The chart indicates that the agriculture industry had the highest share at 37.9% while utilities had the lowest, at 19.9%.
| North American industry classification system | Proportion |
|---|---|
| Agriculture | 37.9% |
| Transportation and warehousing | 27.1% |
| Business, building and other support services | 25.8% |
| Manufacturing | 25.4% |
| Other services (except public administration) | 24.2% |
| Wholesale and retail trade | 22.1% |
| Finance, insurance, real estate, rental and leasing | 21.6% |
| Educational services | 20.3% |
| Forestry, fishing, mining, quarrying, oil and gas | 20.0% |
| Utilities | 19.9% |
- (Source: Statistics Canada Table 14-10-0023-01.)
Climate change adaptation should create new jobs, but impacts will vary by occupation, sector and region.
Diagram 7: A bar chart showing the percentage of occupations expected to have faster or slower employment growth in 2019 to 2030, under a 36% emission reduction plan (vs. current). The chart indicates that power-system electricians and electrical power line workers, labourers, welders and electricians are expected to experience faster growth, while paper/pulp mill machine operators, oil and gas well drillers, truck drivers and air pilots are expected to experience slower growth.
| Employment growth rate | Percentage of occupations |
|---|---|
| Significantly faster growth | 5% |
| Moderately faster growth | 28% |
| Minimally impacted | 55% |
| Moderately slower growth | 5% |
| Significantly slower growth | 7% |
-
(Sources: ESDC 2023 from Environment and Climate Change Canada 2021 scenario; ESDC Canadian Occupational Projection System (COPS), Summary of Results, 2019 to 2028, 2022 to 2031.)
New technologies, such as artificial intelligence (AI), are likely to revolutionize business-to-worker interactions, facilitate gig work, and alter tasks and skill requirements.
In Canada, as of May 2021:
- 29% of workers had jobs where AI is expected to support and enhance human workers
- 31% of workers had jobs that may be highly exposed to AI-related job transformation and whose tasks could be replaceable by AI in the future
- 40% of workers had jobs where AI is expected to have limited or no impact on human workers
(Sources: Statistics Canada; Tahsin Mehdi and René Morissette (2024), "Experimental Estimates of Potential Artificial Intelligence Occupational Exposure in Canada"; ESDC "Building a Modern 21st century workforce, a discussion paper", 2024.)
Longstanding weak labour productivity may increase vulnerability to external shocks such as tariffs. Labour productivity growth in Canada and the U.S. was similar from 1971 to 2000 (around 2%), but has since diverged, widening the productivity gap.
Diagram 8: A line chart showing annual labour productivity levels (GDP per hour worked) in Canada and the U.S. The chart indicates that Canada's annual labour productivity relative to the U.S. was 81.4% in 2000 and 67.7% in 2023.
| Year | Canada | U.S. |
|---|---|---|
| 2000 | 44.23 | 54.35 |
| 2001 | 44.98 | 55.55 |
| 2002 | 45.70 | 57.10 |
| 2003 | 45.80 | 58.83 |
| 2004 | 46.18 | 60.36 |
| 2005 | 47.20 | 61.63 |
| 2006 | 47.80 | 62.20 |
| 2007 | 47.81 | 63.09 |
| 2008 | 47.70 | 63.89 |
| 2009 | 47.87 | 65.93 |
| 2010 | 48.39 | 67.67 |
| 2011 | 49.23 | 67.71 |
| 2012 | 49.22 | 67.96 |
| 2013 | 49.92 | 68.44 |
| 2014 | 51.35 | 68.82 |
| 2015 | 51.24 | 69.46 |
| 2016 | 51.61 | 69.71 |
| 2017 | 52.42 | 70.49 |
| 2018 | 52.47 | 71.40 |
| 2019 | 52.71 | 72.37 |
| 2020 | 56.89 | 75.67 |
| 2021 | 54.10 | 76.71 |
| 2022 | 53.69 | 75.48 |
| 2023 | 52.71 | 77.85 |
-
(Source: OECD Database, Labour Productivity and GDP per capita.)
Enhancing the labour market potential
Engaging underutilized groups and attracting and building a skilled labour force are key to navigating structural changes and megatrends at play in our economy and to drive economic growth.
Improving the labour force participation of underutilized groups would help increase the supply of workers and build economic resiliency.
Diagram 9: A bar chart showing the number of individuals who could be added to the labour force if they had the same participation rate as their peers.
| Group | Additional participants |
|---|---|
| Women, aged 55 and over (compared to men) | 618,600 |
| Women, aged 25 to 54 (compared to men) | 556,800 |
| Canadians, aged 60 to 64 (compared to a scenario where the participation rate increases by 9.9 percentage points, which corresponds to halving the gap in the participation rate between this age group and the preceding age group) | 263,300 |
| Canadians, aged 65 to 69 (compared to scenario where the participation rate increases by 5.0 percentage points) | 119,800 |
| Canadians, aged 55 to 59 (compared to a scenario where the participation rate increases by 4.3 percentage points, which corresponds to halving the gap in the participation rate between this age group and the preceding age group) | 103,900 |
| Family-sponsored, aged 25 to 54 (compared to Canadian born) | 78,000 |
| Refugees, aged 25 to 54 (compared to Canadian born) | 56,500 |
| Economic secondary, aged 25 to 54 (compared to Canadian born) | 27,400 |
| First Nations on-reserve, aged 15 and over (compared to non-Indigenous) | 39,500 |
| First Nations off-reserve, aged 15 and over (compared to non-Indigenous) | 23,900 |
In addition, youth not in employment, education or training (NEET) remain a significant untapped and under-developed source of labour.
Diagram 10: A bar chart showing the number of individuals who could be added to the labour force if those able to work entered the labour force.
| Group | Additional participants |
|---|---|
| Inactive NEET (not looking for work), aged 15 to 29 | 499,400 |
| Persons with disabilities (not in the labour force) with work potential, aged 25 to 64 | 378,200 |
Notes:
- The individuals considered include Indigenous and non-Indigenous peoples, and immigrants and Canadian born (2021); persons with disabilities (2022); women and older adults (2024), and youth not in employment, education or training (2025).
- The current labour force size is approximately 20 million.
- Work potential refers to those who were officially unemployed; or those who were not in the labour force but stated they would be looking for work in the next 12 months; or those who were not in the labour force, not completely retired and either not prevented from working due to their condition, or workplace accommodations existed that would enable them to work.
Reducing barriers for these groups could help expand Canada's workforce in the face of current challenges.
(Sources: Statistics Canada, Census 2021; Canadian Survey on Disability 2022; Labour Force Survey, March 2025.)
While Canadians' average skill level surpasses the Organization for Economic Cooperation and Development (OECD) average, many still lack essential foundational skills.
- 19% of Canadians have low scores in literacy
- 20% of Canadians have low scores in numeracy
- 22 % of Canadians have low scores in adaptive problem solving
Note: Data are for the population aged 15 years and over, and exclude territories.
Fostering skill development will be key to meet current and future labour market needs.
(Source: Programme for the International Assessment of Adult Competencies (PIAAC), 2nd Cycle, 2022 to 2023.)
Investment per worker in Canada and the U.S. has diverged since 2010, with the gap widening more rapidly after 2015. Equipping workers with state-of-the-art equipment is crucial for fostering growth and improving labour productivity.
Diagram 11: A line chart showing real business sector investment per worker in Canada and the U.S. between 2007 and 2023, in U.S. constant dollars (2017). In 2007, annual investment per worker in Canada stood at $16,300, compared to $17,300 in the U.S., reflecting a gap of $1,000. By 2015, this gap had widened to nearly $5,000, as Canada's investment declined to $16,000 while U.S. investment rose to $20,900. The gap expanded further in 2023, with Canadian investment falling to $14,600 while U.S. investment increased to $25,100, a difference of $10,500.
| Year | U.S. | Canada |
|---|---|---|
| 2007 | 17,300 | 16,300 |
| 2008 | 17,500 | 16,300 |
| 2009 | 15,700 | 13,600 |
| 2010 | 16,400 | 15,500 |
| 2011 | 17,600 | 16,600 |
| 2012 | 18,900 | 17,200 |
| 2013 | 19,500 | 17,500 |
| 2014 | 20,600 | 18,000 |
| 2015 | 20,900 | 16,000 |
| 2016 | 20,900 | 14,300 |
| 2017 | 21,500 | 14,400 |
| 2018 | 22,600 | 15,200 |
| 2019 | 23,100 | 15,100 |
| 2020 | 23,700 | 14,600 |
| 2021 | 24,300 | 14,900 |
| 2022 | 24,500 | 14,700 |
| 2023 | 25,100 | 14,600 |
- (Sources: Statistics Canada Tables 14-10-0027-01, 34-10-0035-01, 36-10-0222-01, 36-10-0130-01; U.S. Bureau of Economic Analysis National Income and Product Accounts; U.S. Bureau of Labor Statistics, Labor Force Statistics OECD Purchasing power parities.)
3. ESDC Organizational chart
Alternate formats
Organizational chart [PDF - 539 KB]
Large print, braille, MP3 (audio), e-text and DAISY formats are available on demand by ordering online or calling 1 800 O-Canada (1-800-622-6232). If you use a teletypewriter (TTY), call 1-800-926-9105.
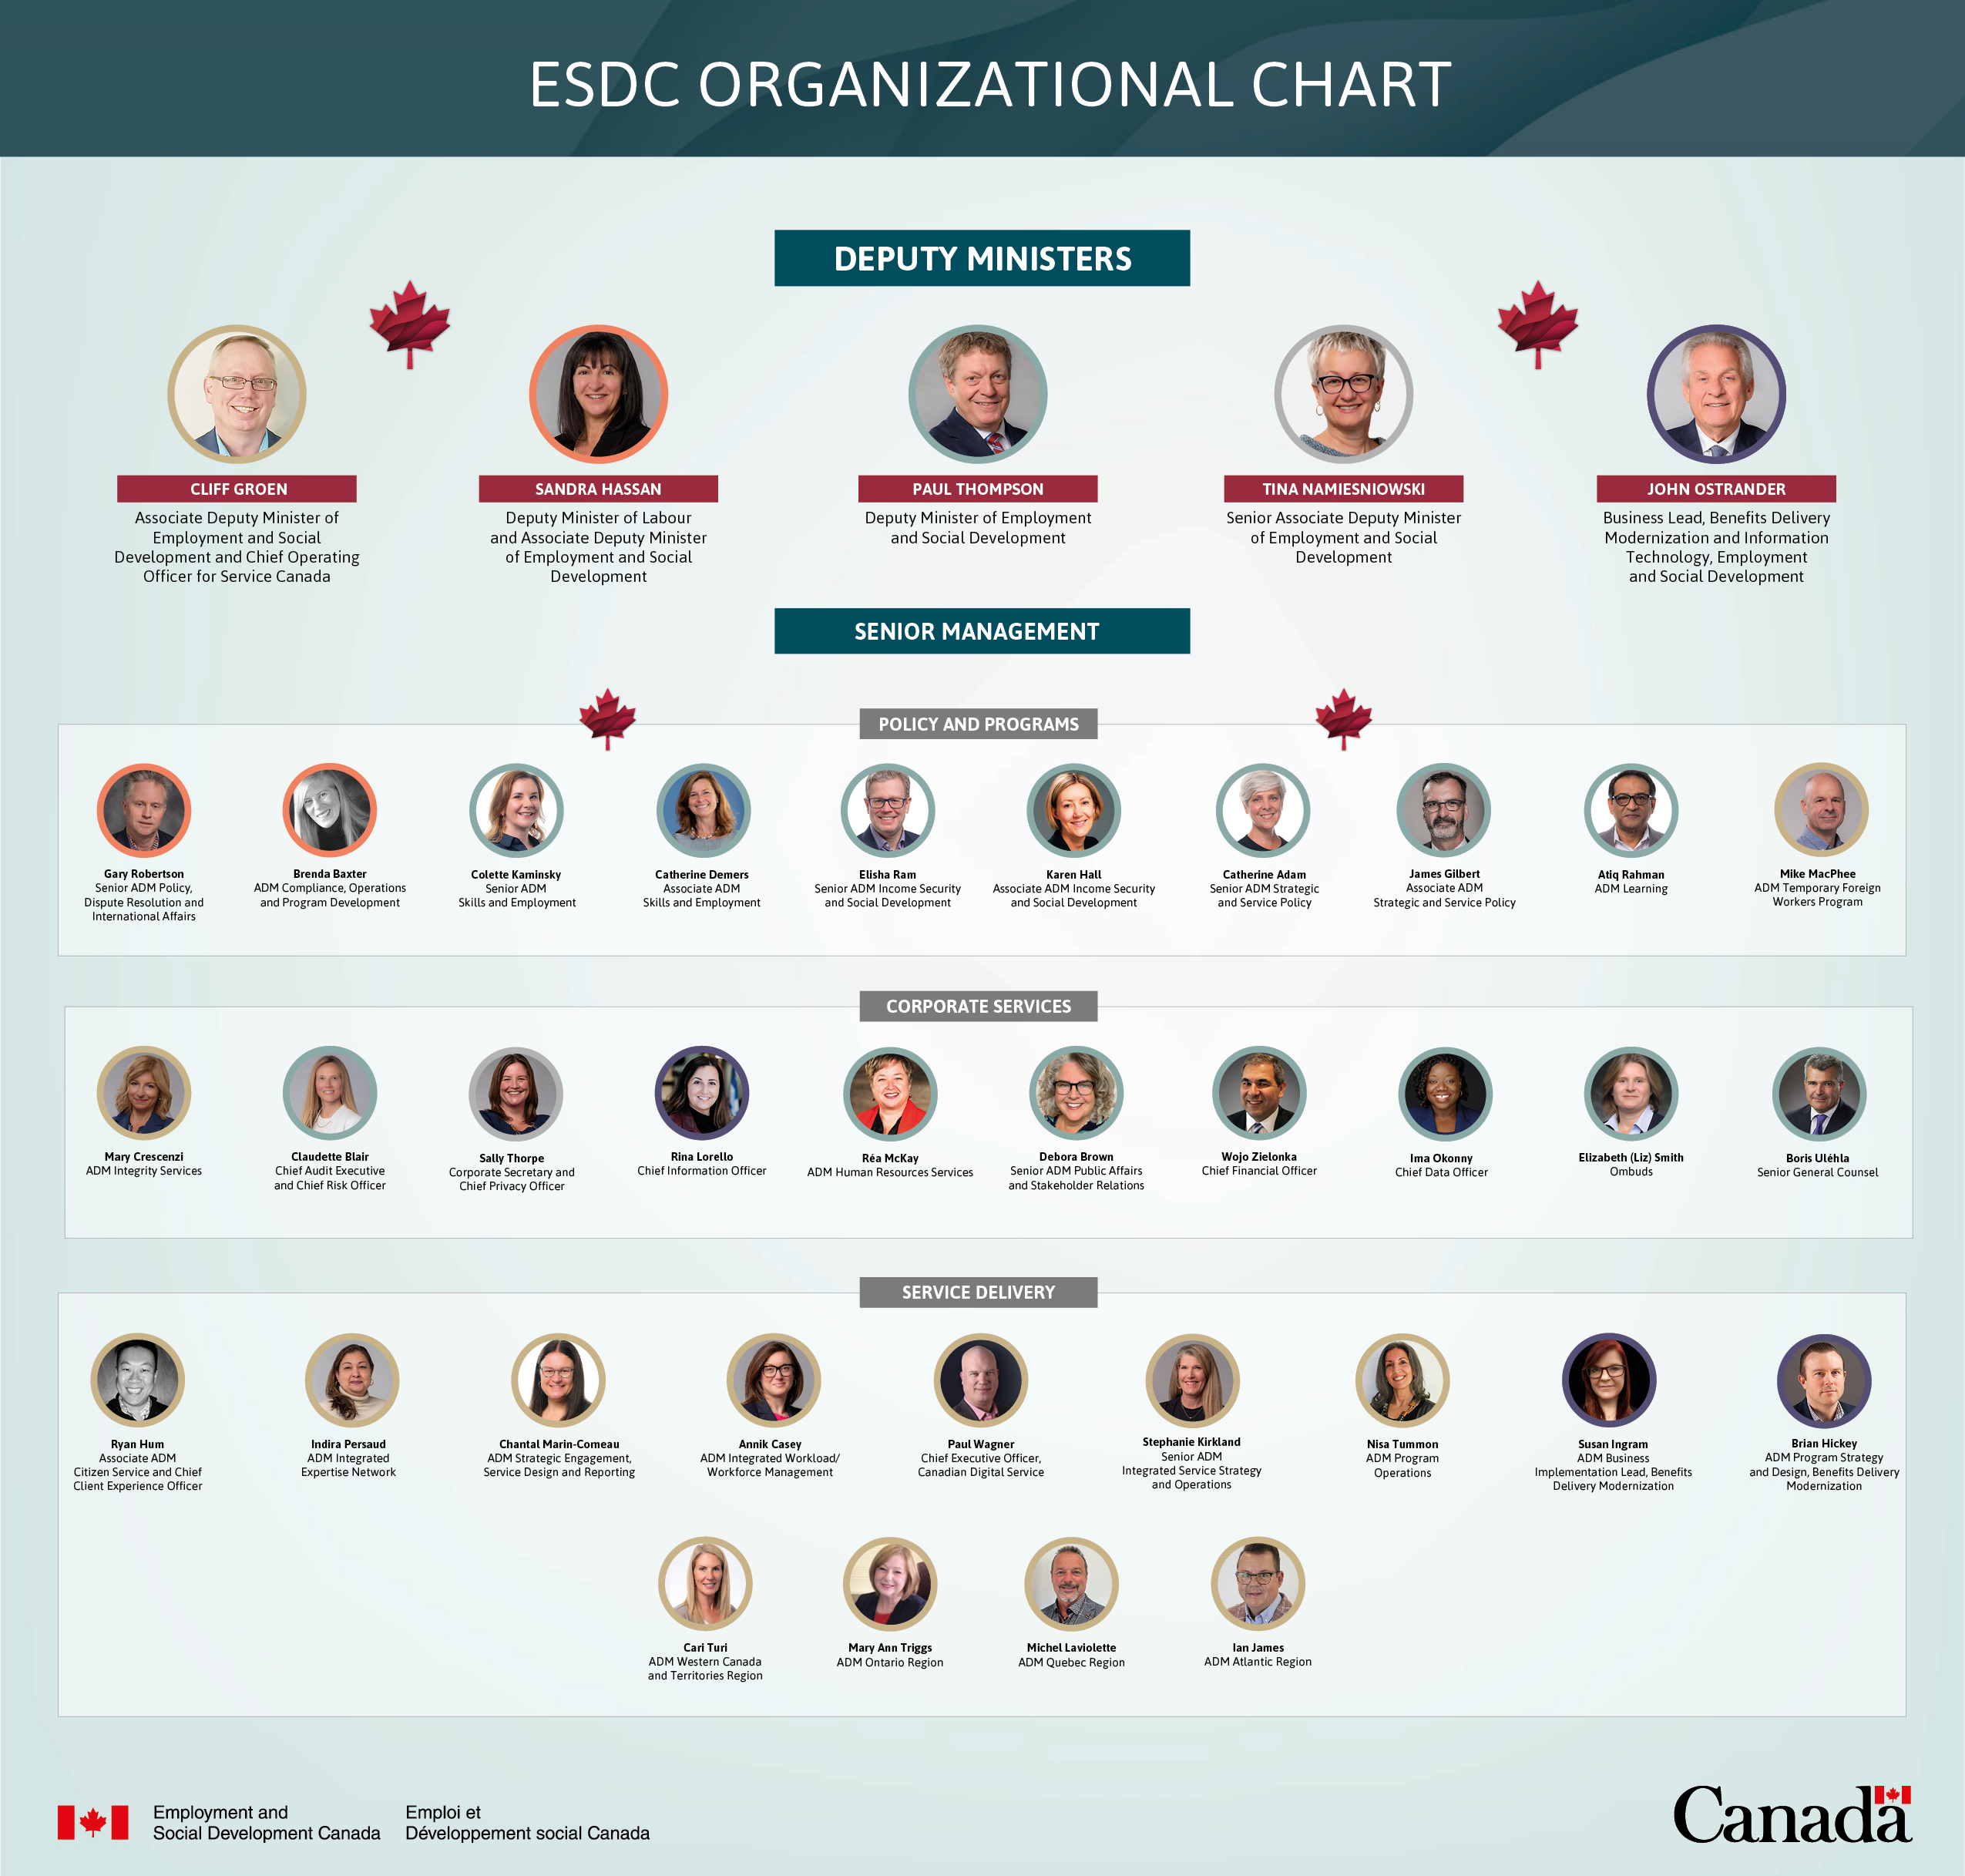
Figure 3. Text description
Deputy Ministers
- Cliff Groen, Associate Deputy Minister of Employment and Social Development and Chief Operating Officer for Service Canada
- Sandra Hassan, Deputy Minister of Labour and Associate Deputy Minister of Employment and Social Development
- Paul Thompson, Deputy Minister of Employment and Social Development
- Tina Namiesniowski, Senior Associate Deputy Minister of Employment and Social Development
- John Ostrander, Business Lead, Benefits Delivery Modernization, Employment and Social Development
Senior management
Policy and programs
- Gary Robertson, Senior ADM Policy, Dispute Resolution and International Affairs
- Brenda Baxter, ADM Compliance, Operations and Program Development
- Colette Kaminsky, Senior ADM Skills and Employment
- Catherine Demers, Associate ADM Skills and Employment
- Elisha Ram, Senior ADM Income Security and Social Development
- Karen Hall, Associate ADM Income Security and Social Development
- Catherine Adam, Senior ADM Strategic and Service Policy
- James Gilbert, Associate ADM Strategic and Service Policy
- Atiq Rahman, ADM Learning
- Mike MacPhee, ADM Temporary Foreign Workers Program
Corporate services
- Mary Crescenzi, ADM Integrity Services
- Claudette Blair, Chief Audit Executive and Chief Risk Officer
- Sally Thorpe, Corporate Secretary and Chief Privacy Officer
- Rina Lorello, Chief Information Officer
- Réa McKay, ADM Human Resources Services
- Debora Brown, Senior ADM Public Affairs and Stakeholder Relations
- Wojo Zielonka, Chief Financial Officer
- Ima Okonny, Chief Data Officer
- Elizabeth (Liz) Smith, Ombuds
- Boris Uléhla, Senior General Counsel
Service delivery
- Ryan Hum, Associate ADM Citizen Service and Chief Client Experience Officer
- Indira Persaud, ADM Integrated Expertise Network
- Chantal Marin-Comeau, ADM Strategic Engagement, Service Design and Reporting
- Annik Casey, ADM Integrated Workload/Workforce Management
- Paul Wagner, Chief Executive Officer, Canadian Digital Service
- Stéphanie Kirkland, Senior ADM Integrated Service Strategy and Operations
- Nisa Tummon, ADM Program Operations
- Susan Ingram, ADM Business Implementation Lead, Benefits Delivery Modernization
- Brian Hickey, ADM Program Strategy and Design, Benefits Delivery Modernization
- Cari Turi, ADM Western Canada and Territories Region
- Mary Ann Triggs, ADM Ontario Region
- Michel Laviolette, ADM Quebec Region
- Ian James, ADM Atlantic Region
4. Priority briefings plan
The following is a list of recommended early briefings with significant policy or operational impacts that could be arranged at the Minister's discretion and convenience.
A list of priority decisions related to some of these areas will be provided separately in the coming days.
- Hot issues
- Potential Canada Post strike
- Response to United States' tariffs
- Labour mobility
- Passport operations
- Cross-cutting issues
- Treasury Board business
- International engagement
- Provincial/territorial relations
- Grants and contributions
- Budget 2025
- Financial sustainability
- Programs and services
- Labour Program issues
- Early Learning and Child Care
- Canada Dental Care Plan
- National School Food Program
- Service Agenda
- Youth Employment and Skills
- Workforce Resiliency Strategy
- Temporary Foreign Worker Program
- Persons with disabilities
- Seniors
- Benefits Delivery Modernization Programme
- Employment Insurance Board of Appeal