
Disability Inclusion and Accessibility infographic – 2021
From: Employment and Social Development Canada
Alternate formats

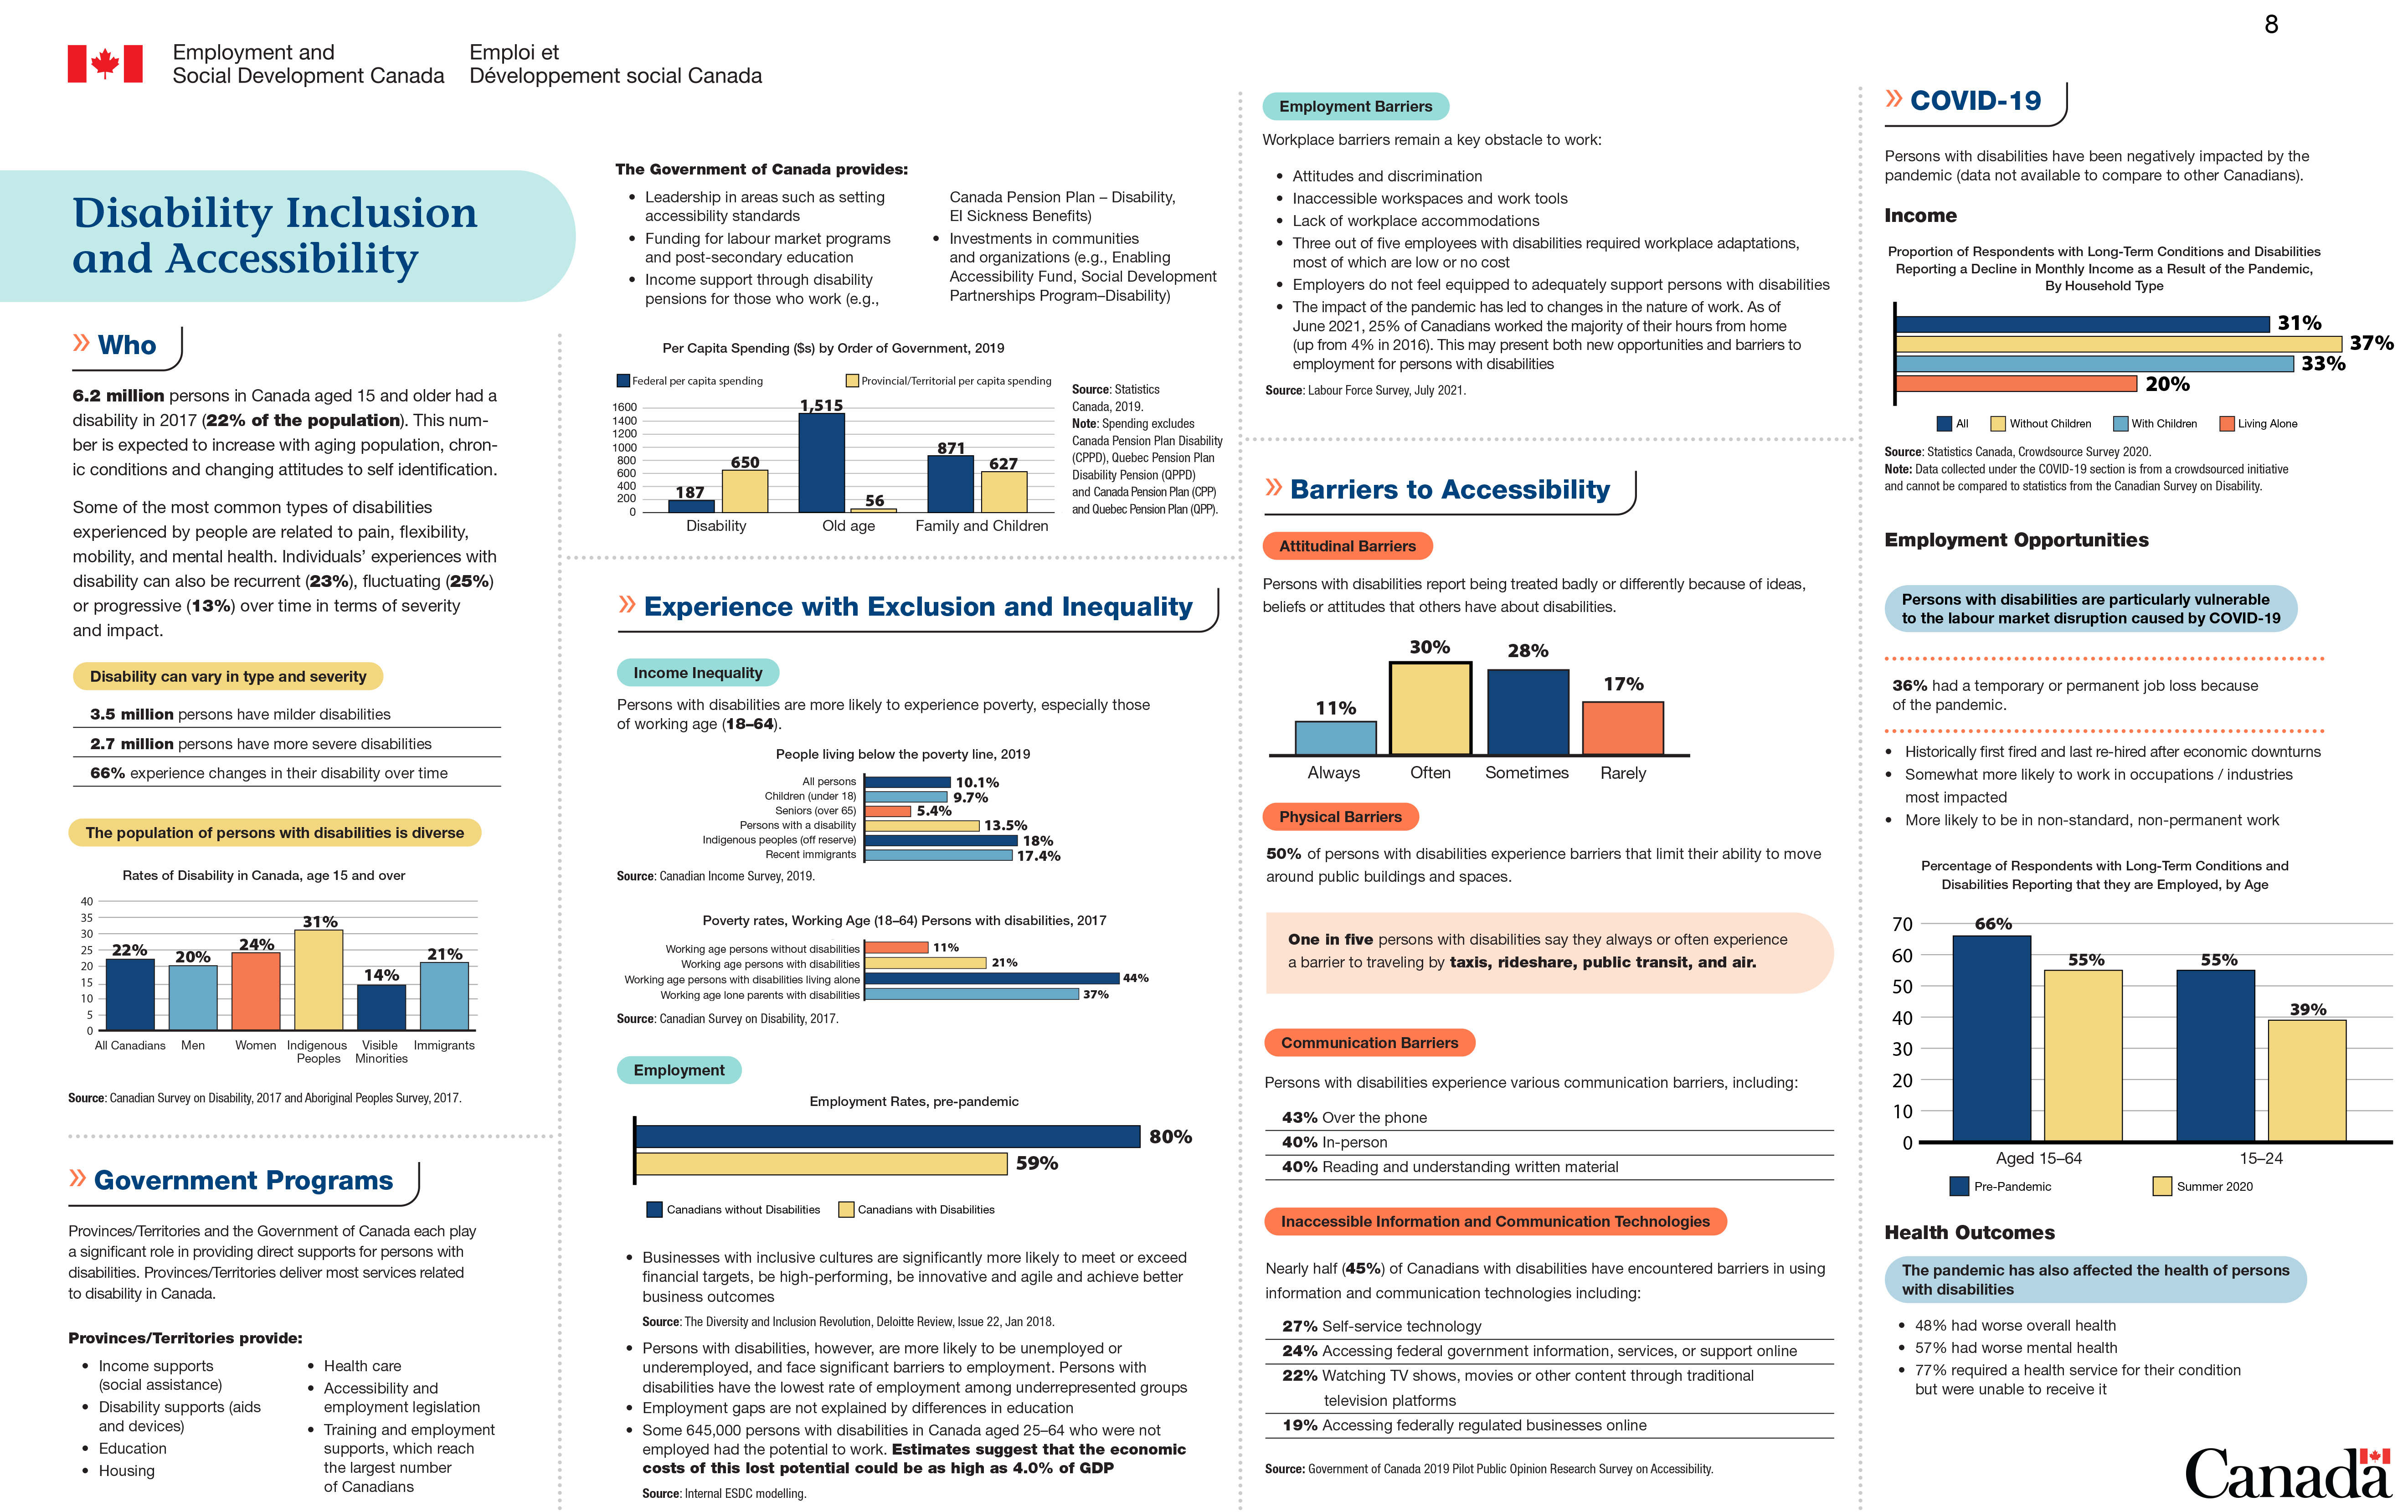
Figure 1: Text Version
Disability Inclusion and Accessibility
Who
6.2 million persons in Canada aged 15 and older had a disability in 2017 (22% of the population). This number is expected to increase with aging population, chronic conditions and changing attitudes to self-identification.
Some of the most common types of disabilities experienced by people are related to pain, flexibility, mobility, and mental health. Individuals’ experiences with disability can also be recurrent (23%), fluctuating (25%) or progressive (13%) over time in terms of severity and impact.
Disability can vary in type and severity
- 3.5 million persons have milder disabilities
- 2.7 million persons have more severe disabilities
- 66% experience changes in their disability over time
The population of persons with disabilities is diverse
- Bar graph is included that displays Rates of Disability in Canada, age 15 and over. The numbers on the graph are:
- 22% All Canadians
- 20% Men
- 24% Women
- 31% Indigenous Peoples
- 14% Visible minorities
- 21% Immigrants
Source: Canadian Survey on Disability, 2017 and Aboriginal Peoples Survey, 2017.
Government Programs
Provinces and territories and the Government of Canada each play a significant role in providing direct supports for persons with disabilities. Provinces and territories deliver most services related to disability in Canada.
Provinces and territories provide:
- income supports (social assistance)
- disability supports (aids and devices)
- education
- housing
- health care
- accessibility and employment legislation
- training and employment supports, which reach the largest number of Canadians
The Government of Canada provides:
- leadership in areas such as setting accessibility standards
- funding labour market programs and post-secondary education
- income support through disability pensions for those who work (for example, Canada Pension Plan – Disability, EI Sickness Benefits)
- investments in communities and organizations (for example, Enabling Accessibility Fund, Social Development Partnerships Program – Disability)
Bar graph is included that displays Per Capita Spending ($s) in 2019, by level of Government in 2019. The numbers on the graph are:
- spending per capita on disability: Federal - $187, Provincial/Territorial - $650
- spending per capita on Old Age: Federal - $1,515 Old Age, Provincial/Territorial - $56
- spending per capita on Families and Children: Federal - $871, Provincial/Territorial - $627
- Source: Statistics Canada, 2019.
- Note: Spending excludes Canada Pension Plan Disability (CPPD), Quebec Pension Plan Disability Pension (QPPD) and Canada Pension Plan (CPP) and Quebec Pension Plan (QPP).
Experience with Exclusion and Inequality
Income Inequality
Persons with disabilities are more likely to experience poverty; especially those of working age (18 to 64)
Bar graph is included that displays data for people living below the poverty line in 2019. The numbers on the graph are:
- 10.1% All persons
- 9.7% Children (under 18)
- 5.4% Seniors (over 65)
- 13.5% Persons with a disability
- 18% Indigenous Peoples (off reserve)
- 17.4% Recent immigrants
Source: Canadian Income Survey, 2019.
Bar graph is included that provides the poverty rates of working-age (18 to 64) persons with disabilities in 2017. The numbers on the graph are:
- 11% Working-age Persons without disabilities
- 21% Working-age Persons with disabilities
- 44% Working-age Persons with disabilities living alone
- 37% Working-age lone parents with disabilities
Source: Canadian Survey on Disability, 2017.
Employment
Bar graph is included that displays pre-pandemic employment rates, Canadians aged 25 to 64, 2017. The numbers on the graph are:
- 80% Canadians without Disabilities
- 59% Canadians with Disabilities
Businesses with inclusive cultures are significantly more likely to meet or exceed financial targets, be high-performing, be innovative and agile and achieve better business outcomes.
Source: The Diversity and Inclusion Revolution, Deloitte Review, Issue 22, Jan 2018.
Persons with disabilities, however, are more likely to be unemployed or underemployed, and face significant barriers to employment. Persons with disabilities have the lowest rate of employment among underrepresented groups.
Employment gaps are not explained by differences in education.
Some 645,000 persons with disabilities in Canada aged 25 to 64 who were not employed had the potential to work, which represents an untapped pool of labour. Estimates suggest that the economic costs of this lost potential could be as high as 4.0% of GDP.
Source: Internal ESDC modelling.
Employment Barriers
Workplace barriers remain a key obstacle to work:
- Attitudes and discrimination
- Inaccessible workspaces and work tools
- Lack of workplace accommodations
- To be able to work, three out of five employees with disabilities required workplace adaptations, most of which are low or no cost
- Employers do not feel equipped to adequately support persons with disabilities
- The impact of the pandemic has led to changes in the nature of work. As of June 2021, 25% of Canadians worked the majority of their hours from home (up from 4% in 2016). This may present both new opportunities and barriers to employment for persons with disabilities
Source: Labour Force Survey, July 2021
Barriers to Accessibility
Attitudinal Barriers
Persons with disabilities report being treated badly or differently because of ideas, beliefs or attitudes that others have about disabilities.
Bar graph is included that displays the rates of persons with disabilities who experience treatment that is bad or different because of ideas, beliefs or attitudes. The numbers on the graph are:
- 11% always
- 30% often
- 28% sometimes
- 17% rarely
Physical Barriers
50% of persons with disabilities experience barriers that limit their ability to move around public buildings and spaces.
One in 5 persons with disabilities say they always or often experience a barrier to traveling by:
- taxis
- rideshare
- municipal public transit, and
- air
Communication Barriers
Persons with disabilities experience various communication barriers, including:
- 43% Over the phone
- 40% In-person
- 40% Reading and understanding written material
Inaccessible Information and Communications Technologies
Nearly half (45%) of Canadians with disabilities have encountered barriers related to information and communications technologies including:
- 27% Self-service technology
- 24% Accessing federal government information, services, or support online
- 22% Watching TV shows, movies or other content through traditional television platforms
- 19% Accessing federally regulated businesses online
Source: Government of Canada 2019 Pilot Public Opinion Research Survey on Accessibility.
COVID-19
While data is not available to compare experiences other Canadians, persons with disabilities do report a myriad of negative impacts during the pandemic – and saw existing gaps across a number of key indicators widen further.
Income
Bar graph is included that displays the Proportion of Respondents with Long-Term Conditions and Disabilities Reporting a Decline in Monthly Income as a Result of the Pandemic, By Household Type. The numbers on the graph are:
- 31% All
- 37% Without Children
- 33% With Children
- 20% Living Alone
- Source: Statistics Canada, Crowdsource Survey 2020.
- Note: Data collected under the COVID-19 section is from a crowdsourced initiative and cannot be compared to statistics from the Canadian Survey on Disability.
Employment opportunities
Persons with disabilities are particularly vulnerable to the labour market disruption caused by COVID-19:
- 36% had a temporary or permanent job loss or reduced hours
Persons with disabilities are:
- Historically first fired and last re-hired after economic downturns
- Somewhat more likely to work in occupations / industries most impacted
- More likely to be in non-standard, non-permanent work
Bar graph included displays the Percentage of Respondents with Long-Term Conditions and Disabilities Reporting that they are Employed, by Age. The numbers on the graph are:
- Aged 15 to 64: 66% Pre-Pandemic; 55% Summer 2020
- Aged 15 to 24: 55% Pre-Pandemic; 39% Summer 2020
Health Outcomes
The pandemic has also affected the health of persons with disabilities
- 48% had worse overall health
- 57% had worse mental health
- 77% required a health service for their condition but were unable to receive it