
Employment and Social Development Canada – Programs and services - 2021
From: Employment and Social Development Canada
Overall summary
Employment and Social Development Canada (ESDC) plays a key role in providing and supporting programs and services focused on the social and economic well-being of Canadians, as do the provinces and territories.
The provinces have primary responsibility and authority for social programming, including health, education and social services. Training is a shared responsibility between the federal and provincial/territorial governments.
The chart shows total expenditures paid to recipients for selected key programs and services that support the well-being of Canadians, with a focus on areas of responsibility for Employment and Social Development Canada. Each bubble represents a single program or initiative (or in some cases a grouping of similar or related programs and initiatives) where the colours and shapes represent the department leads and funding structures. The size represents the magnitude of expenditures relative to the other programs and services (not done to accurate scale). Amounts for expenditures and benefits are rounded, and are generally based on last publicly available data by program. For example, programs such as Canada Pension Plan, Employment Insurance and Old Age Security are for fiscal year 2019 to 2020.
Alternate formats

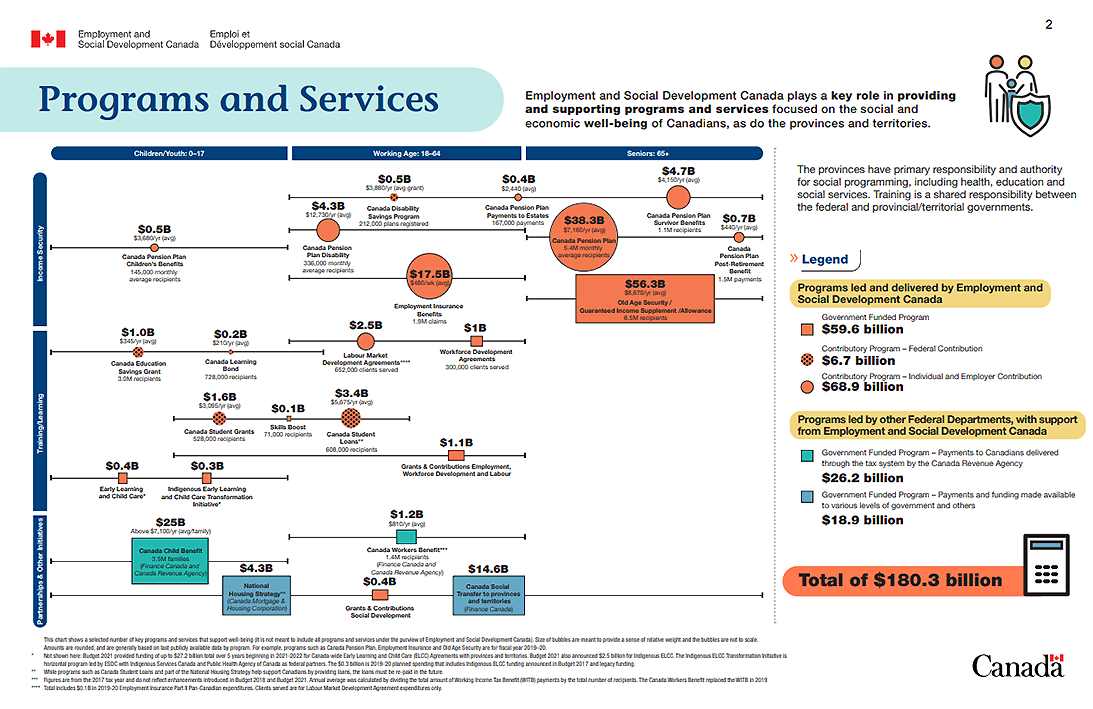
Figure 1: Text version
Programs and services
Each program or initiative is presented on a grid. The vertical axis shows whether it is a form of:
- income security
- training/learning, or
- partnerships and other initiatives
The horizontal axis shows which age demographic(s) it supports:
- children/youth (0 to 17)
- working age (18 to 64), or
- seniors (65+)
Some programs and services support more than one age demographic and this is shown by a line through the program and/or service bubble that spans the range of age demographics being supported. For programs and services where it is possible/relevant, the number of recipients (whether individuals or families) and average benefits (for example, per recipient) are also shown.
The listed programs and services are either led by ESDC or led by another department and supported by ESDC. Some of these programs and services are fully funded by the federal government, while other programs and services are contributory and funded either fully or partially by individual and employer contributions. In cases where programs and services are partially funded by individuals (Canada Disability Savings Program, Canada Education Savings Grant, Canada Learning Bond, Canada Student Grants, and Canada Student Loans), they are also partially funded by the federal government and the expenditure figures presented are only the federal portion of the funding. For the other contributory programs listed, the full amount of spending is shown.
The programs listed can be categorized as follows:
Programs led and delivered by Employment and Social Development Canada:
- Government Funded Programs: $59.6 billion
- Contributory Programs – Federal contribution: $6.7 billion
- Contributory Programs – Individual and Employer contribution: $68.9 billion
Programs led by other federal departments, with support from Employment and Social Development Canada
- Government Funded Programs – Payments to Canadians delivered through the tax system by the Canada Revenue Agency: $26.2 billion
- Government Funded Programs – Payments and funding made available to various levels of government and others: $18.9 billion
Total value for programs presented: $180.3 billion
The following is a description of selected key programs and services appearing in the graphic:
- Income security:
- Canada Pension Plan – Children’s Benefits
- Department lead: Employment and Social Development Canada
- Age demographic: Children/Youth (0 to 17)
- Funding structure: contributory, funded by contributions
- Total expenditures: $0.5B
- Recipients: 145,000 monthly average recipients
- Average benefits: $3,680 per year
- Canada Pension Plan Disability
- Department lead: Employment and Social Development Canada
- Age demographic: Working Age (18 to 64)
- Funding structure: contributory, funded by contributions
- Total expenses: $4.3B
- Recipients: 336,000 monthly average recipients
- Average benefits: $12,730 per year
- Canada Disability Savings Program
- Department lead: Employment and Social Development Canada
- Age demographic: Working Age (18 to 64) and Seniors (65+)
- Funding structure: contributory, federal contributions
- Total expenses: $0.5B
- Recipients: 212,000 plans registered
- Average grants: $3,880 per year
- Canada Pension Plan – Payments to Estates
- Department lead: Employment and Social Development Canada
- Age demographic: Working Age (18 to 64) and Seniors (65+)
- Funding structure: contributory, funded by contributions
- Total expenses: $0.4B
- Recipients: 167,000 payments
- Average payments: $2,440
- Canada Pension Plan
- Department lead: Employment and Social Development Canada
- Age demographic: Seniors (65+)
- Funding structure: contributory, funded by contributions
- Total expenses: $38.3B
- Recipients: 5.4M monthly average recipients
- Average benefits: $7,160 per year
- Canada Pension Plan – Survivor Benefits
- Department lead: Employment and Social Development Canada
- Age demographic: Working Age (18 to 64) and Seniors (65+)
- Funding structure: contributory, funded by contributions
- Total expenses: $4.7B
- Recipients: 1.1M recipients
- Average benefits: $4,150 per year
- Canada Pension Plan – Post-Retirement Benefits
- Department lead: Employment and Social Development Canada
- Age demographic: Seniors (65+)
- Funding structure: contributory, funded by contributions
- Total expenses: $0.7B
- Recipients: 1.5M payments
- Average payments: $440 per year
- Employment Insurance Benefits
- Departmentlead: Employment and Social Development Canada
- Age demographic: Working Age (18 to 64)
- Funding structure: contributory, funded by contributions
- Total expenses: $17.5B
- Recipients: 1.9M claims
- Average benefits: $480 per week
- Old Age Security / Guaranteed Income supplement / Allowance
- Department lead: Employment and Social Development Canada
- Age demographic: Seniors (65+)
- Funding structure: government funded
- Total expenses: $56.3B
- Recipients: 6.5M recipients
- Average benefits: $8,670 per year
- Canada Pension Plan – Children’s Benefits
- Training/Learning:
- Labour Market Development Agreements
- Department lead: Employment and Social Development Canada
- Age demographic: Working Age (18 to 64)
- Funding structure: contributory, funded by contributions
- Total expenses: $2.5B
- Recipients: 652,000 clients served
- Note: Total includes $0.1B in 2019 to 2020 EI Part II Pan-Canadian expenditures. Clients served are for Labour Market Development Agreement expenditures only.
- Workforce Development Agreements
- Department lead: Employment and Social Development Canada
- Age demographic: Working Age (18 to 64)
- Funding structure: government funding
- Total expenditures: $1.0B
- 300,000 clients served
- Canada Education Savings Grant
- Department lead: Employment and Social Development Canada
- Age demographic: Children/Youth (0-to 17) and Working Age (18 to 64)
- Funding structure: contributory, federal contributions
- Total expenses: $1.0B
- Recipients: 3.0M recipients
- Average grants: $345 per year
- Canada Learning Bond
- Department lead: Employment and Social Development Canada
- Age demographic: Children/Youth (0 to 17) and Working Age (18 to 64)
- Funding structure: contributory, federal contributions
- Total expenses: $0.2B
- Recipients: 728,000 recipients
- Average bonds: $210 per year
- Canada Student Grants
- Department lead: Employment and Social Development Canada
- Age demographic: Children/Youth (0 to 17) and Working Age (18 to 64)
- Funding structure: contributory, federal contributions
- Total expenses: $1.6B
- Recipients: 528,000 recipients
- Average grants: $3,095 per year
- Skills Boost
- Department lead: Employment and Social Development Canada
- Age demographic: Children/Youth (0 to 17) and Working Age (18 to 64)
- Funding structure: government funding
- Total expenses: $0.1B
- Recipients: 71,000 recipients
- Canada Student Loans
- Department lead: Employment and Social Development Canada
- Age demographic: Children/Youth (0 to 17) and Working Age (18 to 64)
- Funding structure: contributory, federal contributions
- Total expenses: $3.4B
- Recipients: 608,000 recipients
- Average loans: $5,675 per year
- Note: While Canada Student Loans helps support Canadians by providing loans, the loans must be re-paid in the future.
- Grants and Contributions – Employment, Workforce Development and Labour
- Department lead: Employment and Social Development Canada
- Age demographic: Children/Youth (0 to 17) and Working Age (18 to 64)
- Funding structure: government funding
- Total grants and contributions: $1.1B
- Early Learning and Child Care
- Department lead: Employment and Social Development Canada
- Age demographic: Children/Youth (0 to 17)
- Funding structure: government funding
- Total investment: $0.4B
- Note: Not shown here: Budget 2021 provided funding of up to $27.2 billion over 5 years beginning in 2021 to 2022 for Canada-wide Early Learning and Child Care (ELCC) Agreements with provinces and territories. Budget 2021 also announced $2.5 billion for Indigenous ELCC. The Indigenous ELCC Transformation Initiative is a horizontal program led by ESDC with Indigenous Services Canada and Public Health Agency of Canada as federal partners. The $0.3 billion is 2019 to 2020 planned spending that includes Indigenous ELCC funding announces in Budget 2017 and legacy funding.
- Indigenous Early Learning and Child Care Transformation Initiative
- Department lead: Employment and Social Development Canada
- Age demographic: children/youth (0 to 17)
- Funding structure: government funding
- Total investment: $0.3B
- Note: Not shown here: Budget 2021 provided funding of up to $27.2 billion over 5 years beginning in 2021 to 2022 for Canada-wide Early Learning and Child Care (ELCC) Agreements with provinces and territories. Budget 2021 also announced $2.5 billion for Indigenous ELCC. The Indigenous ELCC Transformation Initiative is a horizontal program led by ESDC with Indigenous Services Canada and Public Health Agency of Canada as federal partners. The $0.3 billion is 2019 to 2020 planned spending that includes Indigenous ELCC funding announces in Budget 2017 and legacy funding.
- Labour Market Development Agreements
- Partnerships and other Initiatives:
- Canada Child Benefit
- Department lead: Finance Canada and Canada Revenue Agency
- Age demographic: Children/Youth (0 to 17)
- Funding structure: Government Funded Program – Payments to Canadians delivered through the tax system by the Canada Revenue Agency.
- Total expenses: $25B
- Recipients: 3.5 million families
- Average benefit: Above $7,100 per year (per family)
- Canada Workers Benefit
- Department lead: Finance Canada and Canada Revenue Agency
- Age demographic: Working Age (19 to 64)
- Funding structure: Government Funded Program – Payments to Canadians delivered through the tax system by the Canada Revenue Agency
- Total expenses: $1.2B
- Recipients: 1.4M recipients
- Average benefit: $810 per year
- Note: Figures are from the 2017 tax year and do not reflect enhancements introduced in Budget 2018 and Budget 2021. Annual average was calculated by dividing the total amount of Working Income Tax Benefit (WITB) payments by the total number of recipients. The Canada Workers Benefit replaced the WITB in 2019.
- National Housing Strategy
- Department lead: Canada Mortgage and Housing Corporation
- Age demographic: Children/Youth (0 to 17), Working Age (18 to 64) and Seniors (65+)
- Funding structure: Government Funded Program – Payments to various levels of government and others through transfer payments
- Total investment: $4.3B
- Note: While part of the National Housing Strategy helps support Canadians by providing loans, the loans must be re-paid in the future.
- Canada Social Transfer to provinces and territories
- Department lead: Department of Finance Canada
- Age demographic: Children/Youth (0 to 17), Working Age (18 to 64) and Seniors (65+)
- Funding structure: Government Funded Program – Payments to provinces and territories through transfer payments
- Total transfers: $14.6B
- Grants and Contributions – Social Development
- Department lead: Employment and Social Development Canada
- Age demographic: children/youth (0 to 17), Working Age (18 to 64) and seniors (65+)
- Funding structure: government funding
- Total grants and contributions: $0.4B
- Canada Child Benefit