
Summative evaluation of the Horizontal Youth Employment Strategy
Executive summary
This report presents the findings and conclusions of the Horizontal Summative Evaluation of the Youth Employment Strategy (YES or the Strategy). The Strategy consists of three streams: Career Focus (CF), Skills Link (SL), and Summer Work Experience (SWE). Due to the unique characteristics of their participants, each stream was approached differently with a unique set of evaluation questions and lines of evidence. This report presents a summary of the findings of all three streams (covering the program years 2008-2012).
Relevance
Evidence from this evaluation shows that there is a demonstrable need to assist Canadian youth in finding and maintaining employment and that YES fulfills Government of Canada and departmental priorities and aligns with federal government roles and responsibilities.
Performance by stream
Career Focus (CF) - Key incremental impact (program attribution) findings
- CF participants experienced a six-year cumulative gain of $40,488 in annual employment earnings versus the comparison group.
- CF participants used modest amounts of Employment Insurance (EI) benefits and did not rely heavily on Social Assistance (SA) benefits.
- The cost-benefit analysis shows that overall gains in employment earnings were 4.74 times the average cost Footnote 1 per CF participant.
Skills Link (SL) - Key outcome and incremental impact (program attribution) findings
- Following their participation in SL, one-quarter of the participants returned to school.
- Eighty-eight percent of SL participants reported finding employment after the program.
- Participants experienced a steady increase in earnings from one year prior to their SL program start year to five years after (from $3,651 to $14,009).
- Approximately 24% of SL participants were in receipt of SA benefits after participating in SL, an increase of 4 percentage points from the year prior to the program start year.
- SL participants spent comparatively less time in programming (on average 3.6 months) than CF participants who spent on average 6.4 months.
- SL participants were more likely to be employed than the limited treatment comparison group members.
- In the five years after SL, participants’ average earnings were $875 less per year than the comparison group. The importance of educational attainment is clear in the findings; subgroup analysis found that those with post-secondary education earned on average $1400 more per year than their comparison group members.
- A cost-benefit analysis could only be conducted for participants who had some or had completed their university education. The analysis demonstrated that overall gains in employment earnings were equivalent to the average cost per SL participant.
Summer Work Experience (SWE) – Key SWE outcome findings
- SWE survey respondents reported that their work experience was related to the occupation for which they were studying or hoped to study, allowing them to make decisions regarding whether or not to continue in a given career path.
- Participation in SWE also allowed participants to generate income to fund their education. On average, SWE participants were able to save enough for one-third of their educational expenses for the following school year.
Please refer to Section 3. Findings, conclusions, and recommendations for the key recommendations issued by this evaluation.
Management response
Management acknowledges the contribution of those who participated in the summative evaluation of the Youth Employment Strategy (YES). Management agrees with the evaluation findings and recommendations and proposes the following Management Response.
The Government of Canada (GoC) recognizes the importance of labour market opportunities for young Canadians and is taking action to address the needs of today’s youth by helping them prepare for, find and maintain meaningful employment. Through the Youth Employment Strategy (YES), the GoC invests over $330 million annually to help youth between the ages of 15 and 30 get the information and gain the skills, job experience and abilities they need to make a successful transition to the workplace.
In order to help youth transition from school to their first job, Economic Action Plan (EAP) 2013 proposed an additional investment of $70 million to support 5,000 new paid internships for recent post-secondary graduates through Career Focus. EAP 2014 further announced a reallocation of $40 million toward supporting up to 3,000 full-time internships for post-secondary graduates in high-demand fields for 2014-2015 and 2015-2016, and a reallocation of $15 million annually towards supporting up to 1,000 youth internships in small and medium sized enterprises.
In addition, EAP 2014 announced that the Government would review the YES to better align it with the evolving realities of the job market and to ensure federal investments in youth employment provide young Canadians with real-life work experience in high-demand fields of employment such as science, technology, engineering, mathematics and the skilled trades.
Key findings
Overall, the findings of the summative evaluation demonstrate that the YES remains relevant in the current context and that it continues to make a difference in the lives of Canadian youth. While the evaluation demonstrates that the YES is meeting its program objectives, it also recommends some areas for improvement which the Management commits to examine.
Recommendation #1
It is recommended that all YES partner departments/agencies continue to monitor funding recipients and to ensure adherence to the Career Focus eligibility criteria.
Actions taken
ESDC takes numerous steps to ensure adherence to program eligibility criteria for its YES program streams. For example, ESDC ensures client eligibility for Career Focus by using a Participant Information Form (PIF) where information on participant’s profile and situation is collected and carefully reviewed against requirements specified in the Career Focus Operational Directives. Social Insurance Numbers are also requested and verifications are conducted to ensure that participants have not been in receipt of Employment Insurance or prior Career Focus funding. In addition, ESDC subjects each of its contribution agreements to activity, financial and results monitoring.
Actions proposed
Compliance with YES Terms and Conditions is important in order to maintain the integrity and quality of YES programs. Management commits to continue monitoring ESDC’s programs to ensure adherence to eligibility criteria. As the lead department for the YES, ESDC commits to meeting with all YES partner departments/agencies in the next 12 months to reinforce the importance of adhering to program eligibility criteria as set out in the Terms and Conditions of the YES.
Recommendation #2
It is recommended that ESDC and where warranted YES partner departments/agencies undertake an examination of the Skills Link program and incorporate where possible design elements intended to achieve stronger results and improve the program’s cost-effectiveness.
Actions taken
ESDC’s SL programming has been progressively realigned since 2010 toward a greater emphasis on direct work experiences and advanced skills development interventions.
Actions proposed
As part of the broader review of the YES, Management commits to examine the different components of the SL program and how they can be further improved upon in order to achieve stronger results and greater cost-effectiveness. The process will be informed by international best practices and will include a review of the program’s design for all YES partner departments/agencies who deliver SL.
Recommendation #3
In order to ensure high quality evaluations going forward, it is recommended that the following areas concerning the collection and quality of data should be addressed:
- 1. The data required to conduct incremental data analyses (e.g. Social Insurance Numbers) should continue to be collected by ESDC, and additional avenues for incremental impact analysis should be pursued, where feasible, by YES partner departments and agencies.
Actions taken
Management is pleased that this evaluation was able to conduct incremental impact analysis using ESDC’s data.
Actions proposed
ESDC will continue to collect information that can allow for incremental impact analysis as part of its data collection strategy. Within the next 12 months, Management will engage YES partner departments/agencies to explore options to improve data collection across all YES programs.
- 2. The Performance Measurement Strategy should be revised by ESDC to include a corresponding data collection strategy. Information on the content of YES programming should be detailed and robust and be reported uniformly in the Common System for Grants and Contributions and in the Data Collection System. The strategy should be shared with YES partner departments/agencies.
Actions taken
A Performance Measurement Strategy (PM) for ESDC delivered programs is currently being prepared in collaboration with the Evaluation Directorate (along with a corresponding data collection strategy). Management is also in the process of improving online services for ESDC’s YES recipients to report results electronically.
Actions proposed
Once the PM Strategy and corresponding data collection strategy have been finalized, Management will share strategies with YES partner departments/agencies and invite them to adapt their own data collection and reporting based on ESDC’s strategy. Management will also encourage YES partner departments/agencies to undertake routine program monitoring.
Over the next 12 months, Management will engage YES partner department/agencies to examine and implement changes where feasible, which will improve the overall quality of data collection for YES program administration, operations, analysis and evaluations.
Options in data collection for SL and CF programs will be explored and will include the possibility for tracking additional participant profiles and more detailed data on interventions as well as being able to link these data to participants’ outcomes.
Other improvements for all program streams could also include the examination of more effective means for capturing administrative data such as transitioning to electronically captured data.
Recommendation #4
It is recommended that ESDC review the application process and bring about improvements regarding the timely release of funding as well as alternative funding delivery models.
Actions taken
ESDC has already begun to review and investigate/implement opportunities for enhancement in the application process. As part of the Gs and Cs Modernization, ESDC has introduced several standardized processes and tools to improve the application process, such as the Funding Portal, the standard Application for Funding form and the standard Contribution Agreement.
ESDC is also exploring alternative funding delivery models including longer term contribution agreements. Multi-year agreements are now permitted under the 2013 revised YES Terms and Conditions (up to five years). These improvements are important as they will allow for an increase in operational efficiencies as well as a decrease in program cost and administrative burden.
Actions proposed
ESDC will continue to monitor the application process with these alternative delivery models.
Recommendation #5
It is recommended that ESDC and YES partner departments/agencies work to improve the distribution of relevant labour market and career information to youth.
Actions taken
Every year through Skills Canada, ESDC funds trades-focused skills competitions which provide secondary and post-secondary students with valuable hands-on exposure to in-demand fields. Through these skills competitions, secondary and post-secondary students are also exposed to careers in science, technology, engineering, mathematics and in the skilled trades as well.
In addition, EAP 2013 announced that the GoC would “reallocate $19 million over two years to inform young people about fields of study that are relevant to existing and forecasted demand for labour in particular occupations”. Management is currently in the process of implementing this commitment with the YES.
Actions proposed
In 2013, the YES served over 55,000 Canadian youth. In the context of the YES review, there is an opportunity for Management to explore ways in which labour market and career-related information could be better integrated into YES programming for the benefit of all these youth. Over the next 12 months, Management will engage YES partner departments/agencies to explore potential means for distributing labour market and career information to YES participants.
1. Introduction
This report presents the findings and conclusions of the Horizontal Summative Evaluation of the Youth Employment Strategy (YES or the Strategy). The Strategy consists of three streams, Career Focus (CF), Skills Link (SL), and Summer Work Experience (SWE). The evaluation reports on the core issues of relevance and performance, which include achievement of outcomes; an incremental impact analysis allowing attribution of effects on participation in the Strategy; and an analysis of the program costing in relation to participation and outcomes. Due to the unique characteristics of their participants, each stream was subjected to their own separate approach, with unique sets of evaluation questions and lines of evidence. This report presents a summary of the findings of all three streams (covering the program years of 2008-2012 Footnote 2 ), covering program activities in all eleven YES departments/agencies as described in Annex A.
Program description
The objectives of YES are to enhance employability skills, encourage educational attainment, increase the number of skilled young Canadians aged 15 to 30 years, facilitate youth transition to the labour market and provide labour market/employment information to youth.
The YES is designed to respond to a range of labour market challenges facing young Canadians by emphasizing client-centred employment services and interventions. At the same time, the YES utilizes a partnership-based delivery system with business, labour, industry, Aboriginal communities, voluntary and not-for-profit organizations, rural and remote communities and other levels of government that enables community needs and priorities to be met.
In 2010 the Government of Canada announced a one-time increase of $60 million for YES ($30 million for CF and $30 million for SL). The goal of this additional funding was to assist new youth as they faced difficulties entering the labour market, in part because of the economic downturn. Economic Action Plan 2012 added $50 million over two years to enhance the Youth Employment Strategy. This additional funding was geared toward assisting young people in gaining tangible skills and experience and focused more specifically on connecting young Canadians with jobs in fields that are in high demand.
As of 2012-2013, YES was a $312.3M ESDC-led horizontal initiative funded through the Consolidated Revenue Fund. ESDC works in collaboration with 10 other departments/agencies in the delivery of YES, with ESDC’s programming representing approximately 81% of all YES funding.
YES is divided into the three following program streams, each having specific objectives:
Career Focus (CF) – The CF stream of YES is designed to increase the supply of highly qualified people by promoting the benefits of advanced studies, demonstrating federal leadership by investing in the skills required to meet the needs of the knowledge economy and facilitating the transition of highly skilled young people to a rapidly evolving labour market.
Ultimate outcome: youth are employed or in education.
Career Focus activities are designed to:
- Enable youth to acquire and enhance skills, which include but are not limited to employability skills and advanced employability skills;
- Provide work experiences, mentoring and coaching;
- Support youth entrepreneurs gain self-employment;
- Help youth obtain skills acquired while participating in exchanges between post-secondary institutions, including higher education institutions in other countries where reciprocal exchange of people, knowledge and expertise will occur;
- Support youth in making informed career decisions, promote the value of education, and promote youth as the labour force of the future.
Skills Link (SL) – SL is designed to help youth overcome barriers to employment and develop a broad range of skills and knowledge in order to participate in the current and future labour market, and to promote education and skills as key to labour market participation.
Barriers for youth include but are not limited to, challenges which are faced by recent immigrant youth, youth with disabilities, lone parent youth, youth who have not completed high school, Aboriginal youth, and youth living in rural or remote areas.
Ultimate outcome: youth are employed or in education.
Skills Link activities are designed to:
- Enable youth to acquire and enhance skills, which include but are not limited to pre-employability skills, employability skills and advanced employability skills;
- Provide work experiences, mentoring and coaching;
- Support youth entrepreneurs gain self-employment;
- Support youth in making informed career decisions, promote the value of education, and promote youth as the labour force of the future.
Summer Work Experience (SWE) – The objectives of SWE are to help students acquire employment and/or career-related skills, to support them in financing and furthering their education and to provide students with career, learning and labour market information and assistance in finding summer employment.
Ultimate outcome: youth are in education.
Summer Work Experience activities are designed to:
- Assist employers in hiring students to work in occupations that help students develop employability skills and aid their educational and career development;
- Providing labour market information to students including but not limited to wage rates, employment and health and safety standards, human rights, government programs and services and the benefits of returning to school;
- Providing job search services to students, including but not limited to résumé writing, job placement support and interview advice.
2. Methodology
The methodologies used in this evaluation incorporated multiple lines of enquiry consisting of surveys, a document review, literature review and key informant interviews. In addition, two separate non-experimental incremental impact studies were carried out that compared ESDC CF and SL participants who participated in either CF or SL in 2003 to 2006 with individuals aged 15 to 30 who had received a limited treatment consisting of an Employment Assistance Service (EAS) intervention as part of the Labour Market Development Agreements (LMDA). This allowed for the assessment of the average treatment effect of participation in CF or SL compared to participation in a limited treatment (identified throughout this report as the limited treatment comparison group or comparison group). Technical reports were developed which included the findings for each line of enquiry; these reports formed the basis for the findings and conclusions contained in this report. All technical reports are listed in Annex B.
Constraints and limitations: Data and methodology
It is important to note the particularities of Employment Assistance Services (EAS), CF and SL programming that will help to contextualize the results of the incremental impact analysis. Through EAS, individual clients may receive a wide range of one-on-one interventions to support their return to work. These include computer training, career advice and employment counselling, job preparation and job search supports, job finding clubs, and short-term training such as first aid certification or food safety. To pursue more intensive training, EAS participants must present a Return to Work Action Plan and be approved for training through programs other than EAS, including provincial/territorial programs. Footnote 3
In contrast to EAS, SL is designed to offer a broad suite of interventions to clients who face particular challenges integrating into employment. In other words, individuals are directed towards the SL program if they face certain barriers that would require numerous and more intense interventions in order to help them enter the labour market. CF interventions, however, are essentially wage-subsidized internships for post-secondary graduates.
The incremental impacts of the YES program Footnote 4 should be considered as being at the lower end of a range of results. The incremental impact analysis approach used is based on the difference between participating in YES programs (i.e., SL or CF) compared to participating in low intensity services rather than being compared to not receiving any programs or services.
3. Findings, conclusions, and recommendations
3.1 Relevance
Results of this evaluation confirm that there is a demonstrable need to assist Canadian youth in finding and maintaining employment. The 2013 Canadian youth unemployment rate (13.7%) was more than double that of the adult population (5.9%). Footnote 5 As a point of comparison, five years after their SL program start year, SL participants’ average annual earnings were approximately $14,009, Footnote 6 which is well below that of the average Canadian youth (aged 15 to 24), who earned approximately $21,112 in 2012. Footnote 7 This reaffirms the difficulties that this clientele encounters in the labour market. YES fulfills a Government of Canada priority, as highlighted for example, in the Federal Budgets of 1997-2001, 2003-2005, 2007, and 2009-2014. In addition, the Strategy aligns with the roles and responsibilities of the Federal Government, and ESDC in particular, as it falls under the mandate of the Department of Human Resources and Skills Development Footnote 8 Act (S.C. 2005, c. 34).
3.2 Performance (effectiveness, efficiency, and economy)
3.2.1 Career Focus stream
Client outcome findings
Since completing their Career Focus (CF) internship, 97% of survey respondents reported that they had been employed at some point since their CF internship ended. Approximately one in five (22%) CF participants reported returning to school or attending training of at least three months in length following their participation in the CF program. The decision to return to school was identified by over half of survey respondents (59%) as being influenced by participating in CF. Overall, employers interviewed indicated that they were satisfied with their CF experience, while the majority of CF participants (88%) indicated that they were satisfied with the quality of their work experience.
Table 1 presents the average annual employment earnings, as well as Employment Insurance (EI) and Social Assistance (SA) benefits received by CF participants in the 2003-2006 cohort (n=2,994), one year prior to program participation, in the program start year, and up to five years after program participation.
| CF participants overall | 1 Year prior | Start year | 1 Year post | 2 Years post | 3 Years post | 4 Years post | 5 Years post | N |
|---|---|---|---|---|---|---|---|---|
| Annual earnings | $10,121 | $17,071 | $23,915 | $27,165 | $30,725 | $34,359 | $36,314 | 2,994 |
| Percent with earnings | 84% | 96% | 93% | 89% | 87% | 86% | 84% | 2,994 |
| Annual EI use | $271 | $302 | $458 | $451 | $460 | $516 | $475 | 2,994 |
| Percent using EI | 8% | 11% | 13% | 11% | 10% | 10% | 9% | 2,994 |
| Annual SA use | $159 | $171 | $170 | $174 | $190 | $189 | $224 | 2,994 |
| Percent using SA | 4% | 4% | 3% | 3% | 3% | 3% | 4% | 2,994 |
Source: Administrative data – ESDC CF participants only
As demonstrated in Table 1, the average annual employment earnings of participants steadily increased by a total of $26,193 since the year before the program start year, from $10,121 to $36,314 in the fifth year after program participation. In addition, when EI benefits and participation are examined from the year prior to program start, to the fifth year after program participation, there was a small increase in the average amount of EI benefits received, by $204, as well as EI participation, by 1%. It is worth noting that EI participation gradually declined from a high of 13% in the year immediately after program participation, to 9% in the fifth year of program participation, suggesting that improvements in participants’ labour market outcomes were most likely to occur in the year following program participation. In addition, average SA benefit use remained limited, with only a slight increase in the fifth year after program participation, by $65, in comparison to the year prior to program participation. Overall, SA benefit use remained relatively steady in all years examined in Table 1.
Incremental impact and program attribution findings
Table 2 details the results of the incremental impact analysis, which compared CF participants who participated in program interventions between 2003 to 2006 with individuals aged 15 to 30 who had received a limited treatment consisting of an Employment Assistance Service (EAS) intervention as part of the Labour Market Development Agreements (LMDAs).
| 1 Year prior | Start year | 1 Year post | 2 Years post | 3 Years post | 4 Years post | 5 Years post | |
|---|---|---|---|---|---|---|---|
| CF participants | |||||||
| Incremental impact | --- | $6,050*** | $6,268*** | $5,933*** | $6,892*** | $7,877*** | $7,468*** |
| Cumulative incremental impact | --- | $6,050*** | $12,318*** | $18,251*** | $25,143*** | $33,020*** | $40,488*** |
| Male participants | |||||||
| Incremental impact | --- | $6,522*** | $6,505*** | $6,433*** | $8,229*** | $10,387*** | $10,576*** |
| Cumulative incremental impact | --- | $6,522*** | $13,027*** | $19,459*** | $27,688*** | $38,075*** | $48,651*** |
| Female participants | |||||||
| Incremental impact | --- | $5,537*** | $5,813*** | $5,235*** | $5,792*** | $6,005*** | $5,189*** |
| Cumulative incremental impact | --- | $5,537*** | $11,350*** | $16,584*** | $22,376*** | $28,381*** | $33,570*** |
Source: Administrative data note: * p< .05, **p < .01, *** p < .001– ESDC CF clients only
As Table 2 illustrates, CF participants experienced significantly higher cumulative employment earnings over this six year period ($40,488). These earnings gains ranged from $5.9K to $7.9K annually when compared to the limited treatment group. When examined by gender, both male and female CF participants experienced statistically significant cumulative gains over this six year period versus their respective comparison groups ($48,651 for males; $33,570 for females). It is worth noting that, in terms of the difference in annual employment earnings between the CF participants and the comparison group, male CF participants trended upwards at a faster rate over this six year period, from an annual difference of $6,522 in the program start year, to $10,576 five years post-program, by 62%. Meanwhile, the annual difference in employment earnings between female CF participants and the comparison group remained relatively constant over the course of this six year period.
In terms of EI and SA benefits, while usage overall was modest, CF participants claimed $1.7K and $0.8K less respectively than the comparison group during the six year period after their participation in the program.
Table 3 below summarises the results of the cost-benefit analysis of CF participation for the 2003-2006 and 2008-2009 cohorts. According to this analysis, CF participation for the 2003-2006 cohort demonstrated significant net gains in employment earnings when compared to program costs. As noted previously in Table 2, the overall net cumulative gain in CF participant employment earnings was $40.5K five years after program participation. When a 5% annual discount rate was applied, this was equivalent to an average increase of $35.7K in employment earnings, which is 4.8 times the average program cost per CF participant ($7.5K) over this same period.
| Average cost | cumulative gain in earnings | Benefit (ratio) | |
|---|---|---|---|
| Five-year post-program Analysis – CF | |||
| 2003-2006 cohort | $7,534 | $35,686 | 4.74 |
| Two-year post-program analysis – CF | |||
| 2003-2006 cohort | $7,534 | $17,401 | 2.31 |
| 2008-2009 cohort | $12,407 | $20,574 | 1.66 |
Source: Administrative data – ESDC CF participants only
Similar positive cost-benefit impacts were observed amongst CF participants only two years after program participation. As demonstrated in Table 3, the overall discounted earnings for the 2003-2006 cohort two years after program participation was $17.4K, 2.3 times higher than the average program costs per participant of $7.5K. This positive trend continued amongst CF participants in the 2008-2009 cohort. Although the average cost per program participant was higher ($12.4K), this cohort saw a higher gain in cumulative earnings ($20.6K) two years after program participation, which was 1.7 times higher than the average costs per program participant.
CF reached its target age eligibility criteria (those 15 to 30 years of age). However, CF’s client eligibility criteria in the YES Horizontal Terms and Conditions (2008) states that participants must have “demonstrated achievement at the post-secondary level” at the time of CF program intake. The evaluation found that 89% of participants met this criterion. Approximately 11% of CF participants had not completed high school (5%) or only had a high school diploma (6%).
Recommendation #1
It is recommended that all YES partner departments/agencies continue to monitor funding recipients and to ensure adherence to the Career Focus eligibility criteria.
3.2.2 Skills Link stream
Key SL outcome findings – Comparing pre- and post-program participation
Overall, the findings for the Skills Link (SL) program stream indicate that the program is serving its targeted age population. A large majority of SL participants surveyed (88%) reported finding employment after the program. A majority of participants (70%) who had found employment attributed it to their participation in the program. One-quarter (25%) of SL participants returned to school after participating in the SL program. The majority of those who had returned to school (79%) stated that SL had impacted their decision to return to school. Seventy-four percent of SL participants reported that they had obtained assistance with a job search either during or just prior to their SL program, and 43% obtained specific career or local labour market information. The evaluation results demonstrated that most SL participants (86%) were satisfied with the quality of the programming received.
Table 4 presents the average annual employment earnings, as well as EI and SA benefits received by SL participants in the 2003-2006 cohort (n=50,726), one year prior to program participation, in the program start year, and up to five years after program participation.
| SL participants overall | 1 Year prior | SL program start year | 1 Year post | 2 Years post | 3 Years post | 4 Years post | 5 Years post | N |
|---|---|---|---|---|---|---|---|---|
| Annual earnings | $3,651 | $5,564 | $8,936 | $10,693 | $11,780 | $12,867 | $14,009 | 50,726 |
| Percent with earnings | 63% | 82% | 82% | 78% | 75% | 72% | 70% | 50,726 |
| Annual EI use | $133 | $151 | $301 | $399 | $513 | $590 | $666 | 50,726 |
| Percent using EI | 4% | 5% | 9% | 11% | 12% | 12% | 13% | 50,726 |
| Annual SA use | $1,028 | $1,109 | $1,224 | $1,385 | $1,528 | $1,645 | $1,703 | 50,726 |
| Percent using SA | 20% | 24% | 24% | 24% | 24% | 25% | 24% | 50,726 |
Source: Administrative data – ESDC SL participants only
As demonstrated in Table 4, the average annual earnings of SL participants steadily increased from $3,651 one year prior to program start, to $14,009 five years after program participation, for a total increase of $10,358 over this six year period. In addition, when EI benefits and participation are examined from the year prior to program start, to the fifth year after program participation, there was an increase in the amount of EI benefits received, by $533, as well as EI participation, by 9%, suggesting an improvement in labour market participation over time. In addition, the percentage of SL participants receiving SA rose from one in five (20%) one year prior to the program start year, to one in four (24%) five years after the program start year. The findings suggest that a proportion of the SL clients continue to experience difficulties with labour market attachment following their participation in SL programming.
Incremental impact and program attribution findings
The examination of incremental impacts showed that SL participants were more likely than the comparison group members to have employment earnings (ranging between five percentage points higher in the program start year to one percentage point higher in the fourth year after the program start year). However, this result was not statistically significant.
Increasing employment earnings, while not necessarily an objective of SL, can be used as an indicator of employment or labour market attachment. The results show that SL participants had lower cumulative earnings five years after the program start year than the comparison group members. Five years after the program start year, the SL participants averaged $875 less in employment earnings per year than the comparison group.
Further analysis found that the SL had more of an influence on employment earnings of certain subgroups notably by age, education level and disability status when compared to their respective comparison groups. For example, older age groups performed better than the youngest age groups, where SL participants 25 and over averaged $437 less in employment earnings per year than their comparison group members. Similarly, SL participants with some or having completed college earned on average $123 less per year than their comparison group members. Results were more positive for persons with disabilities where they earned on average $123 more per year than their comparison group members. Finally, SL participants who reported having completed some or all of their university education earned on average $1400 more per year than their comparison group members. Footnote 9
International literature points to basic education and literacy as an important foundation for participants to be able to benefit from subsequent training programs. The lack of such a foundation appears to be a contributing factor to the (often) ineffectiveness of training for youth facing multiple barriers to employment, as this population often does not have basic education and literacy skills. The importance of basic education is further highlighted by the evidence that the economic returns to individuals are highest for those with basic education and next highest for higher education, followed by vocational education. The correlation between employment earnings and education of SL participants is consistent with the international literature. SL participants, 80% of which had low education levels (52% hadn’t completed high school and 28% had completed high school), earned significantly less average earnings per year (-$875 per year) than those who had completed some or all of their university education (+$1400 per year).
The higher percentage of SL participants with employment, but lower amounts of employment income, suggests that SL clients are finding work in lower paying positions than comparison group members. Also, according to the survey, as many as 25% of SL clients reported attending some training or educational program following their SL participation. Unlike SL, returning to school is not an intended outcome for the comparison group participants, whose interventions are strictly limited to finding employment. As such, the lower earnings of SL clients in the years immediately following their SL participation may be explained by their return to school.
With regard to using financial support measures, cumulative EI and SA use was slightly greater among SL clients compared to the comparison group. These results, combined with the lower employment earnings suggest that SL participants are continuing to experience difficulty in increasing their labour market participation.
As there were no positive earnings gains for SL participants, with the exception of SF participants with some or completed university prior to program participation, Table 5 presents the results of the cost-benefit analysis for this sub-group, for the 2003-2006 and 2008-2009 cohorts.
| Average cost | Cumulative gain in earnings | Benefit (ratio) | |
|---|---|---|---|
| Five-year post-program analysis – SL | |||
| 2003-2006 cohort | $7,233 | $7,669 | 1.06 |
| Two-year post-program analysis – SL | |||
| 2003-2006 cohort | $7,233 | $5,288 | 0.70 |
| 2008-2009 cohort | $8,442 | $974 | 0.12 |
Source: Administrative data – ESDC SL participants only
Overall, SF participants in the 2003-2006 cohort experienced a relatively large net cumulative gain in employment earnings of $8.4K over this six year period (program start year to 5 years after the program start year). Applying a 5% annual discount rate, this was equivalent to a $7.7K net increase in employment earnings. The average program cost per participant was $7.2K. Thus the overall gains in employment earnings for the 2003-2006 cohort study participants five years post-program were equivalent to the average cost per SL participant.
The same analysis of the 2003-2006 cohort and the 2008-2009 cohort, two years post-program participation, found that the cumulative earnings gains for this sub-group were less than the average program cost. In the case of the 2003-2006 cohort, participants with some or completed university prior to program participation earned the net equivalent of $5.3K or 0.7 times the average program cost per participant of $7.2K. Similarly, the 2008-2009 cohort earned the net equivalent of $1K or 0.1 times the average cost per participant of $8.4K.
It should also be noted that SL participants spent comparatively less time in SL interventions (on average 3.6 months) than CF participants who spent on average 6.4 months. This is important as it may be that the amount of time spent in programming is an important factor influencing participants’ success. For example, both CF and SL served participants who had some university/college education. When compared to their respective comparison groups, the CF participants earned significantly more average annual earnings five years after the program than the SL participants. The SL participants might have improved their earnings performance if they had spent more than 3.6 months in program.
The international literature indicates that labour market interventions offering more intensive programming yield better results overall for youth with employment barriers than interventions offering programming of a less intensive nature. Brodaty (2007) reported that youth who participated in programming that offered intensive on-the-job training leading to a professional certification led to important positive impacts. This corroborated the findings from Bonnal, Fougère et Sérandon (1997) and Brodaty, Crépon et Fougère (2001). However, limited training interventions, such as EAS, yielded positive impacts to the youngest youth with no previous labour market experience. In short, age and previous labour market experience seemed to be important variables in determining which interventions best suited participants.
The incremental impact analysis provides a partial story of SL effectiveness. First, this evaluation shows that, within the limitations of the data available and the methodology used, the results cannot speak to the difference participating in the SL program would make compared to not participating in any program. Second, the analysis could not take into consideration the number and types of barriers to employability of SL participants. The lack of data gathered on the number and types of barriers to employability may have introduced a selection bias to the study, i.e. SL and comparison group participants may have been different on unobservable characteristics. Footnote 10
Notwithstanding these limitations, the results from the examination of incremental impacts of SL are similar to findings reported in the international literature, which indicates that labour market programs often yield benefits in terms of improved labour market outcomes (employment more than wages). That said, because they are costly, the benefits do not always exceed the costs. Their effectiveness is generally lowest for disadvantaged workers and especially out-of-school youth. However, there is considerable variation in those results Footnote 11 as illustrated by the positive results achieved by youth who had some or completed their university education prior to their participation in the program.
Recommendation #2
It is recommended that ESDC and where warranted YES partner departments and agencies undertake an examination of the Skills Link program and incorporate where possible design elements which are intended to achieve stronger results and improve the program’s cost-effectiveness.
3.2.3 Summer Work Experience stream
Key SWE outcome findings
Overall, Summer Work Experience (SWE) reached its targeted population. Almost all (99%) SWE participants were in the target age range of 15 to 30 years of age (inclusive) at the time of program participation. Footnote 12
The majority of SWE survey respondents indicated that they would not have found an equivalent work experience opportunity without the SWE program. They also reported that their work experience was related to the occupation for which they were studying or hoped to study, allowing them to make decisions regarding whether or not to continue in a given career path. Participation in SWE also allowed participants to generate income to fund their education. On average, SWE participants were able to save enough for one-third of their educational expenses for the following school year. Both participants and employers were satisfied with their SWE experience.
During their work placement, most SWE participants generally worked full-time hours over an average of 12 weeks; however placement length ranged from as short as two weeks to as long as 28 weeks. These variations are important to note as program officials interviewed indicated that the duration of the work experience is an important factor in facilitating acquisition of skills by participants.
SWE participants indicated that they learned technical (occupation specific), employability, and life skills during their SWE placement. These skills were most commonly acquired through mentoring and coaching. Numeracy skills and written communication skills were less frequently mentioned as being improved through SWE participation, thus suggesting room for improvement in acquiring these competencies. SWE programming is restricted to providing a wage subsidy over a fairly short period of time and is thus a relatively low-cost intervention. The average cost per SWE participant during the 2008-2011 reference period was approximately $3,000 per work placement.
3.3 Recommendations – Across the horizontal strategy
Findings and conclusions from the evaluation point to a number of considerations for future development and adjustments to YES. In addition to the two stream-specific recommendations made for the Career Focus and Skills Link, the following across the Horizontal Strategy recommendations are offered by the Evaluation Directorate for action by the YES program officials.
As recommended in the 2009 YES Summative Evaluation Footnote 13 , there is a need to access relevant administrative data, including the collection of Social Insurance Numbers (SINs). The latter enables evaluators to build comparison groups, improve evaluation results through incremental impact analysis and to reduce evaluation costs. Evaluators were unable to effectively evaluate the incremental impacts of the horizontal YES due to the unavailability of SINs from partner YES government departments and agencies. The absence of SINs poses challenges in producing comparable results and as such, evaluators were only able to do the more rigorous analysis with ESDC’s SL and CF participants.
There is currently no ongoing post-program monitoring of performance of YES participants. A regular performance monitoring system would provide performance information to better support future evaluation work. This information would be valuable, as program officials would not rely solely on evaluation findings every five years to have up-to-date post-program performance information. Given the gaps in performance information at the program stream level, participant surveys had to be used to collect performance information for the current evaluation, which are costly and suffer from low response rates. Footnote 14 Using this approach also introduces biases due to considerable recall burden for participants.
For this evaluation, it was not possible to examine types, combinations or order of interventions received, as well as types of barriers (especially for SL participants), as this information is not collected consistently or fully. Given that this information is not being collected by program management, the Summative Evaluation of YES was unable to identify which types or order of interventions could be most beneficial and effective to participants.
Data for the ESDC CF and SL participants were entered into ESDC’s Common System for Grants and Contributions (CSGC) database, while the partner YES departments and agencies entered participant data into the Data Collection Systems (DCS) database. Although the variables used in the two databases were often the same, there were gaps and inconsistencies specifically with respect to the CSGC database. For example, four data elements collected on the ESDC Participant Intake Form (PIF) were not included in the CSGC database. In other cases, the CSGC data were collected from sources other than the PIF. This led to inconsistencies between data collected by ESDC and the other departments and agencies. Departments are encouraged to more diligently collect participant contact information such as email addresses and to closely monitor underreported fields.
Recommendation #3
In order to ensure high quality evaluations going forward, it is recommended that the following areas concerning the collection and quality of data be addressed:
- 1. The data required to conduct incremental data analyses (e.g. Social Insurance Numbers) should continue to be collected by ESDC and additional avenues for incremental impact analysis should be pursued, where feasible, by YES partner departments and agencies.
- 2. The Performance Measurement Strategy should be revised by ESDC to include a corresponding data collection strategy. Information on the content of YES programming should be detailed and robust and be reported uniformly in the Common System for Grants and Contributions and in the Data Collection System. The strategy should be shared with YES partner departments and agencies.
Employers and/or project sponsors of CF and SWE program streams raised the issue of timing of funding as an area of improvement. It was suggested that they be given earlier notification of successful funding applications as well as decisions made on funding for longer terms or for multi-year contracts. Earlier notification of approved funding would enable employers and/or project sponsors to adequately prepare for and advertise the program and positions in a timely manner.
Recommendation #4
It is recommended that ESDC review the application process and bring about improvements regarding the more timely release of funding as well as alternative funding delivery models.
The evaluation results showed that few participants in SWE and CF had accessed labour market information or career related information from any source, including through their participation in YES. The majority of the participants who did receive these employment services considered them useful in their search for a job. These findings would indicate that there is an opportunity to better incorporate such employment services in all three YES streams.
Recommendation #5
It is recommended that ESDC and YES partner departments/agencies work to improve the distribution of relevant labour market and career information to youth.
4. Annex A – List of participating departments
Flow chart description
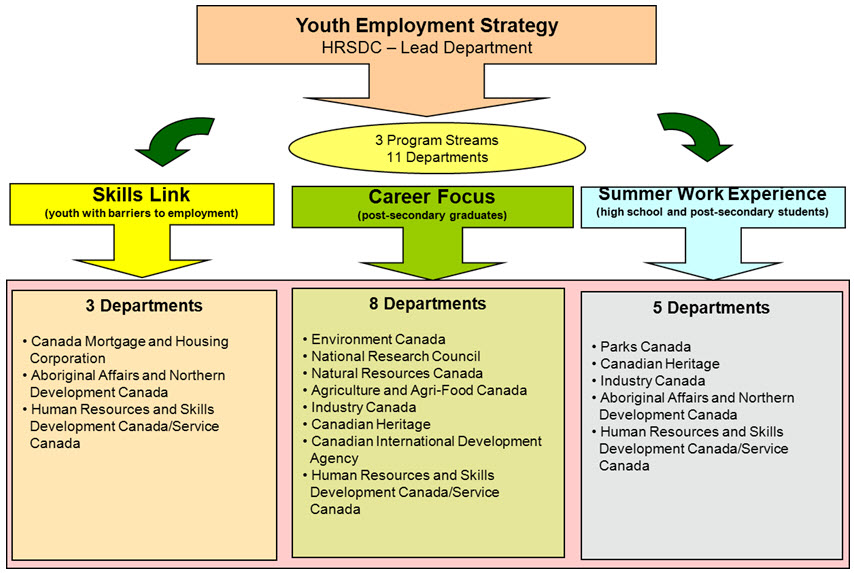
Annex A – List of participant departments
- The lead department for the Youth Employment Strategy is Human Resources and Skills Development Canada (now known as Employment and Social Development Canada).
- The Youth Employment Strategy supports three program streams, delivered by a total of eleven distinct Federal Departments. These program streams and their respective target populations include Skills Link (youth with barriers); Career Focus (post-secondary graduates); and Summer Work Experience (high school and post-secondary students).
- Three Departments deliver Skills Link: Canada Mortgage and Housing Corporation; Aboriginal Affairs and Northern Development Canada; and Human Resources and Skills Development Canada/Service Canada.
- Eight Departments deliver Career Focus: Environment Canada; the National Research Council; Natural Resources Canada; Agriculture and Ari-Food Canada; Industry Canada; Canadian Heritage; Canadian International Development Agency; and Human Resources and Skills Development Canada/Service Canada.
- Five Departments deliver Summer Work Experience: Parks Canada; Canadian Heritage; Industry Canada; Aboriginal Affairs and Northern Development Canada; and Human Resources and Skills Development Canada/Service Canada.
5. Annex B – List of technical reports
Phase 1 Technical/interim reports
- Summative Evaluation of the Youth Employment Strategy: Phase 1 Interim Report on Summer Work Experience Evaluation Findings
- Summative Evaluation of the Youth Employment Strategy: Phase 1 Summer Work Experience Stream – Methodology Report
- Summative Evaluation of the Youth Employment Strategy: Summer Work Experience Stream Evaluation - Qualitative Technical Report
- Summative Evaluation of the Youth Employment Strategy: Summer Work Experience Stream Evaluation - Quantitative Technical Report
Phase 2 Technical reports
- Summative Evaluation of the Youth Employment Strategy: Final Document Review Technical Report
- Summative Evaluation of the Youth Employment Strategy: Net Impact Analysis Final Report
- Summative Evaluation of the Youth Employment Strategy: Phase 2 Career Focus Key Informant Interview Analysis Technical Report
- Summative Evaluation of the Youth Employment Strategy: Phase 2 Skills Link Key Informant Interview Analysis Technical Report
- Summative Evaluation of the Youth Employment Strategy: Technical Report - Literature Review
- Summative Evaluation of the Youth Employment Strategy: Final Methodology Report
- Summative Evaluation of the Youth Employment Strategy: Preliminary Report on the Completion of the CF Survey
- Summative Evaluation of the Youth Employment Strategy: Preliminary Report on the Completion of the SL Survey
- Summative Evaluation of the Youth Employment Strategy: Career Focus Survey and Administrative Data Report
- Summative Evaluation of the Youth Employment Strategy: Skills Link Survey and Administrative Data Draft Report
List of abbreviations
CF: Career Focus
CSGC: Common System for Grants and Contributions
EAP: Economic Action Plan
EAS: Employment Assistance Service
EI: Employment Insurance
ESDC: Employment and Social Development Canada
SA: Social Assistance
SIN: Social Insurance Number
SL: Skills Link
SWE: Summer Work Experience
YES: Youth Employment Strategy