
Evaluation of the Employment Insurance Seasonal Claimant Pilot Project (Pilot Project No.21)
On this page
Alternate formats

Large print, braille, MP3 (audio), e-text and DAISY formats are available on demand by ordering online or calling 1 800 O-Canada (1-800-622-6232). If you use a teletypewriter (TTY), call 1-800-926-9105.
-
List of figures
- Figure 1: Temporary employment in Canada, 2010 to 2019 (in thousands)
- Figure 2: Timeline of seasonal workers and the EI program, 1940 to 1995
- Figure 3: Timeline of seasonal workers and the EI program, 1996 to 2018
- Figure 4: Average income for seasonal and non-seasonal claimants, 2019
- Figure 5: Share of seasonal and non-seasonal claimants by their average weekly hours worked, 2019
- Figure 6: Share of seasonal claimants by selected industries of employment, 2019
- Figure 7: Identified seasonal claimants by simulated parameters, 2019
- Figure 8: EI regional targeting mechanism
- Figure 9: Seasonal claimants in commodity-based measure regions, 2005 to 2019
- Figure 10: Share of 2013 seasonal gappers by number of income gaps from 2008 to 2012
- Figure 11: Share of seasonal claimants who used additional weeks by entitlement and standard weeks worked (35 hour week)
- Figure 12: Effect of the pilot project on the incidence of having an income gap by entitlement
- Figure 13: Claiming and employment effects of the pilot project
-
List of tables
- Table 1: Seasonal claimants by demographic characteristics, 2019
- Table 2: Identified fishing claims as seasonal, 2019
- Table 3: Income of seasonal gappers, 2013
- Table 4: Machine learning results
- Table 5: Impact estimates for new seasonal claimants compared to 2017
- Table 6: Impact on the incidence of an income gap and usage of additional weeks
- Table 7: Estimated cost per seasonal claimant of the pilot project (dollars)
-
List of abbreviations
- CRA
- Canada Revenue Agency
- EI
- Employment Insurance
- ESDC
- Employment and Social Development Canada
- DiD
- Difference-in-Difference
- MAR
- Monitoring and Assessment Report
- US
- United States
Summary of key findings and lessons learned
This evaluation assesses the impact of the Employment Insurance (EI) Seasonal Claimant Pilot Project (Pilot Project No. 21Footnote 1). The pilot project provided 5 additional weeks of EI regular benefit, up to a maximum entitlement of 45 weeks, to eligible seasonal claimants residing in 1 of 13 targeted EI economic regions. The pilot project was available to eligible claimants who established a benefit period between August 5, 2018 and September 25, 2021. The rules of the pilot project have been replicated through amendments to the Employment Insurance Act due to end October 29, 2022.
The evaluation findings and lessons learned are based on the analysis of multiple lines of quantitative and qualitative evidence. For the purpose of this report, the term “claims” and “claimants” are used interchangeably.
Key findings
There are 7 main findings from the evaluation:
- Canada’s EI program is unique in its targeting of seasonal claimants compared to other countries
- by relying on the timing of a claim, the targeting mechanism shows some effectiveness in identifying claimants with a frequent pattern of seasonal work. However, the mechanism was sensitive to other non-seasonal measures that affect the start or end date of a claim
- approximately 10% of all seasonal claimants have a period without income following their claim (seasonal gappers) and the risk of this event to reoccur year-over-year is low
- in 2018, among those seasonal claimants eligible for 5 additional weeks of entitlement, a little over one-third used at least one of these weeks and only 10% had an income gap in the previous year
- for seasonal claimants, an impact analysis found that the pilot project reduced the incidence of having a period without income by over 7 percentage points. This impact steadily decreased as the number of EI regular benefit weeks claimants were entitled to increased
- analysis points to the pilot project influencing subsequent work patterns of seasonal claimants who were eligible to additional weeks. Specifically, employment income decreased and benefit duration increased following the introduction of the pilot project, while total income remained unchanged
- relative to previous pilot projects, Pilot Project No. 21 was more efficient at targeting seasonal gappers. Still, most of the additional weeks of benefits were paid to seasonal non-gappers
Lessons learned
Based on these findings, the evaluation notes the following lessons learned to the Department:
- as evidence shows, any future permanent measure should take into account how sensitive the claiming pattern of an individual is to other temporary measures that affect the start and end date of a claim. As eligibility is based on the timing of when a claim is established, consideration could be given to other indicators which might better reflect seasonality than the timing of claim establishment
- as Pilot Project No. 21 showed, a more targeted mechanism for identifying seasonal claimants can reduce the cost of the measure while supporting seasonal claimants who experience an income gap. However, evidence suggest that even with the more targeted approach of Pilot Project No. 21, it is difficult to ensure that additional entitlement weeks are only being used by those who would otherwise face income gaps
- most seasonal claimants do not experience an income gap. In addition, findings suggest that a measure similar to Pilot Project No. 21 may influence the subsequent work and benefit claiming patterns of seasonal claimants by substituting earned income for EI benefits
Introduction
Seasonal workers and other workers in temporary employment
Due to Canada’s vast geographical territory and latitude, the majority of its provinces experience fluctuating weather patterns year over year. These fluctuations create challenges for workers in industries such as construction, accommodation and tourism to carry out their work year-round. In these situations, individuals work for a specific time of year followed by a period when they are unable to perform their work. Depending on the local labour market, there may be fewer opportunities to find jobs in the offseason.
Seasonal workers are an important component of the labour market in Canada, accounting for about 20% of workers in temporary employment. However, they make up the smallest share of temporary work compared to term or contract (about 50%), and casual (25%). In fact, the number of seasonal workers has decreased from 439,000 in 2010 to 415,000 by 2019 (-5.5%). This is in contrast to the other types of temporary employment. Both term or contract, and casual experienced an increase over the same period (+8.4% and +12.2%, respectively).
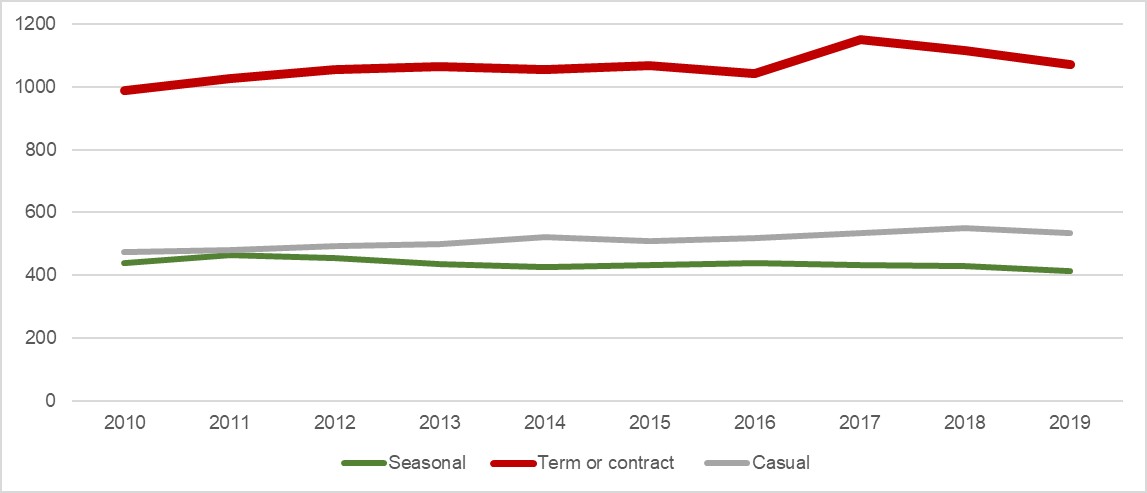
Text description of figure 1
| Year of employment | Seasonal | Term or contract | Casual |
|---|---|---|---|
| 2010 | 438.5 | 989.0 | 475.1 |
| 2011 | 463.4 | 1,025.8 | 479.9 |
| 2012 | 455.7 | 1,053.8 | 492.6 |
| 2013 | 434.8 | 1,063.3 | 499.6 |
| 2014 | 425.1 | 1,053.9 | 520.0 |
| 2015 | 433.7 | 1,068.4 | 509.7 |
| 2016 | 438.8 | 1,041.7 | 518.3 |
| 2017 | 433.4 | 1,149.5 | 534.0 |
| 2018 | 428.8 | 1,115.5 | 550.1 |
| 2019 | 414.5 | 1,072.2 | 533.1 |
- Source: Statistics Canada. Table 14-10-0072-01. Job permanency (permanent and temporary) by industry, annual (x 1,000).
Although seasonal work tends be thought of as its own unique classification of employment, there is no consensus in Canadian literature regarding what constitutes a seasonal worker. For example, Statistics Canada’s Labour Force Survey does not define what “seasonal employment” is. Instead, it asks respondents to self-identify between “seasonal job”, “temporary, term or contract job”, or “casual job” without providing any definitions for them. Even outside of Canada, seasonal work is often grouped in with precarious and non-standard work, with little to no reporting on the prevalence of seasonal work.
This is a challenge when trying to identify a ‘true’ seasonal claimant. It is not always easy to differentiate a seasonal worker from an individual who works in other types of non-permanent employment.
Program description
Seasonal workers and the Employment Insurance program
Many seasonal workers rely on the EI program to help them get through recurring periods of unemployment. EI regular benefits provide temporary income replacement to eligible unemployed workers while they look for employment. Eligible individuals can receive a maximum entitlement varying between 14 and 45 weeks of EI regular benefits. The number of entitlement weeks depend on the regional rate of unemployment and the number of hours of insurable employment worked in the qualifying period.
Outside of Pilot Project No. 21, the only benefits targeted to workers affected by seasonality are those for self-employed fishers. Fishers are eligible to receive up to 26 weeks of entitlement per claim.
Since its introduction, Canada’s EI program has evolved in its support of seasonal workers. Figure 2 provides a timeline of the key program changes that affected seasonal workers from 1940 to 1995. Figure 3 examines those changes from 1996 to 2018.
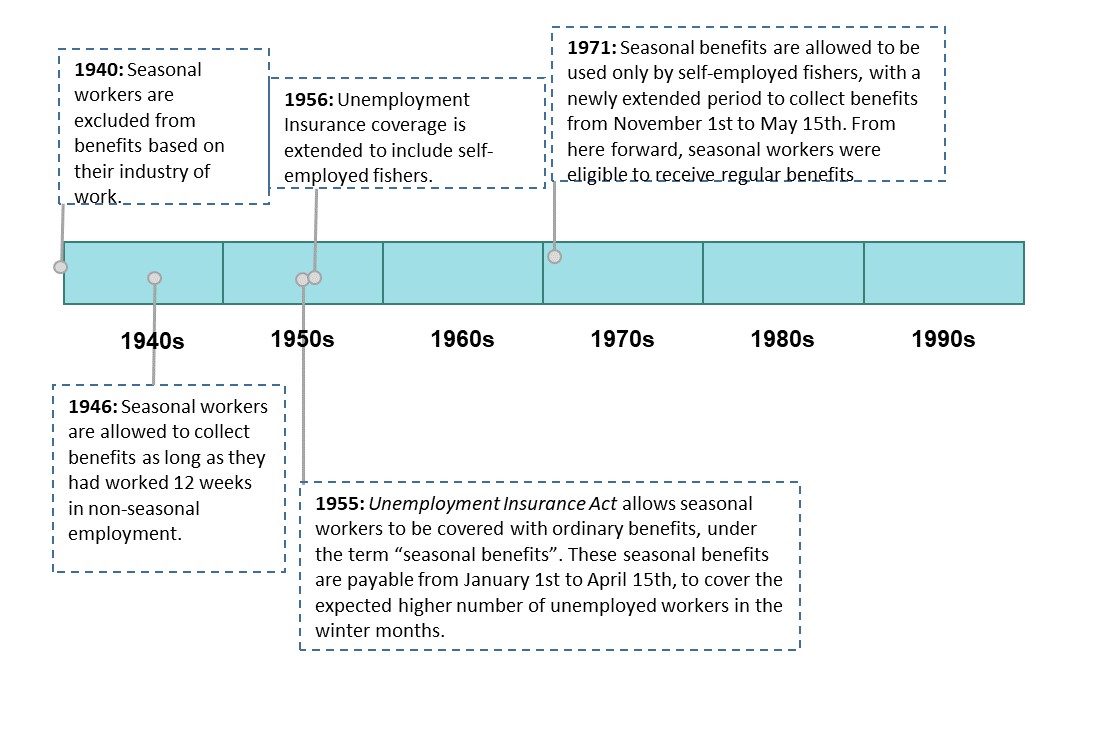
Text description of figure 2
| Year of change | Description of change |
|---|---|
| 1940 | Seasonal workers are excluded from benefits based on their industry of work. |
| 1946 | Seasonal workers are allowed to collect benefits as long as they had worked 12 weeks in non-seasonal employment. |
| 1955 | Unemployment Insurance Act allows seasonal workers to be covered with ordinary benefits, under the term “seasonal benefits”. These seasonal benefits are payable from January 1st to April 15th, to cover the expected higher number of unemployed workers in the winter months. |
| 1956 | Unemployment Insurance coverage is extended to include self-employed fishers. |
| 1971 | Seasonal benefits are allowed to be used only by self-employed fishers, with a newly extended period to collect benefits from November 1st to May 15th. From here forward, seasonal workers were eligible to receive regular benefits. |
- Source: ESDC (2021). Annex A, Literature Review.
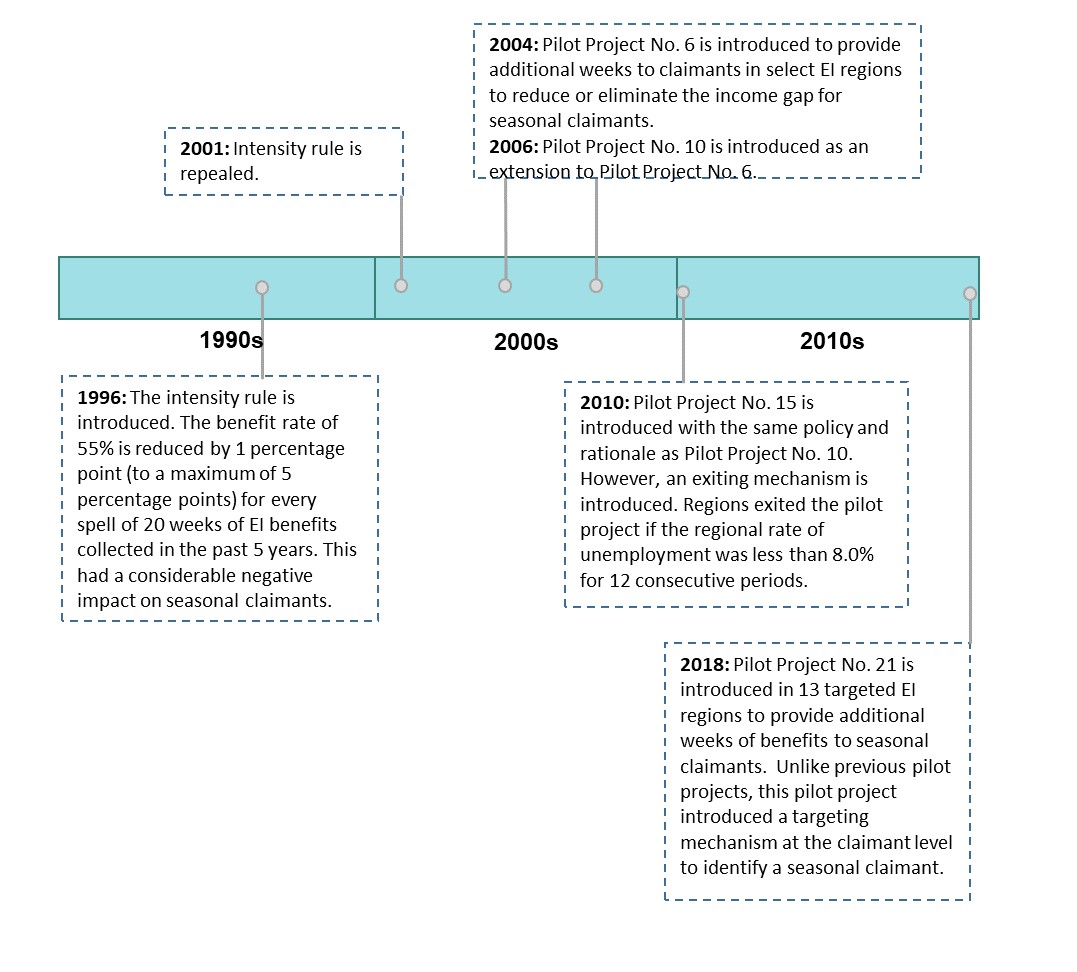
Text description of figure 3
| Year of change | Description of change |
|---|---|
| 1996 | The intensity rule is introduced. The benefit rate of 55% is reduced by 1 percentage point (to a maximum of 5 percentage points) for every spell of 20 weeks of EI benefits collected in the past 5 years. This had a considerable negative impact on seasonal claimants. |
| 2001 | The intensity rule is repealed. |
| 2004 | Pilot Project No. 6 is introduced to provide additional weeks to claimants in select EI regions to reduce or eliminate the income gap for seasonal claimants |
| 2006 | Pilot Project No. 10 is introduced as an extension to Pilot Project No. 6. |
| 2010 | Pilot Project No. 15 is introduced with the same policy and rationale as Pilot Project No. 10. However, an exiting mechanism is introduced. Regions exited the pilot project if the regional rate of unemployment was less than 8.0% for 12 consecutive periods. |
| 2018 | Pilot Project No. 21 is introduced in 13 targeted EI regions to provide additional weeks of benefits to seasonal claimants. Unlike previous pilot projects, this pilot project introduced a targeting mechanism at the claimant level to identify a seasonal claimant. |
- Source: ESDC (2021). Annex A, Literature Review.
Seasonal gappers and the Employment Insurance program
Since the Employment Insurance reform in 1996, an often raised issue has been the incidence of a claimant experiencing an income gap. An income gap refers to a period of weeks during which the claimant receives neither employment insurance benefits nor employment income after completing a claim and before their subsequent employment. Since 2004, 3 other pilots have been introduced with the primary focus to reduce or eliminate the income gap faced by seasonal claimants.
For all of these past pilot projects, the targeting mechanism was at the EI regional level only. None of these pilots attempted to distinguish between seasonal and non-seasonal claimants. As a result, all EI regular claimants were eligible to additional weeks.
Pilot Project No. 6
- Date: June 2004 to June 2006
- Rationale: Assessing the cost and impacts of providing additional entitlement weeks in high unemployment rate regions, (24 EI regions). In particular, a focus was on reducing or eliminating the income gap for seasonal claimants.
Pilot Project No. 10
- Date: June 2006 to March 2009
- Rationale: Further assessment of increasing entitlement weeks to claimants in high unemployment rate regions. The pilot project ended on February 28, 2009 and was replaced by a temporary legislative measure to provide additional support to all workers during the recession.
Pilot Project No. 15
- Date: September 2010 to September 2012
- Rationale: Same as Pilot 10. However, an exit mechanism was added. Regions could exit the pilot if their regional unemployment rate was less than 8.0% for 12 consecutive months.
Two evaluations examined these 3 pilot projects (Evaluation of Initiatives to Extend EI Regular Benefits, and Evaluation of the Pilot Project to Extend Employment Insurance Benefits by 5 Weeks: 2004 to 2009). Among key findings, it was found that while the additional weeks provided through these pilot projects helped reduce or eliminate the income gap, the targeting mechanism was too broad. As a result, the program costs were high considering the objective of these pilot projects—with less than 5% of additional benefits paid going towards seasonal gappers.
A recent paper titled Mind the Gap: Running Out of Employment Insurance Benefits (Gray and Leonard 2020) highlighted that these evaluations revealed challenges in the allocation of these benefits. They indicate that the majority of beneficiaries under these pilots were not seasonal gappers. They point to the fact that the more narrow targeting mechanism introduced through Pilot Project No. 21 should significantly limit the cost of the pilot.
Objective of Pilot Project No. 21 and its targeting mechanisms
In August 2018, a new pilot project was implemented to provide 5 additional weeks of EI regular benefits, up to a maximum entitlement of 45 weeks, to workers that were identified as seasonal claimants within 13 targeted EI regions. The pilot project ended on September 25, 2021. However, the parameters of the pilot project have been replicated until October 29, 2022 through amendments to the Employment Insurance Act. Unlike previous pilot projects that solely relied on the regional unemployment rate to establish eligibility, this pilot project used 2 criteria to target eligible EI regions:
- the EI region’s respective share of seasonal EI claims among all labour force participants had to be 4.0% or higher in the 2016 to 2017 fiscal year
- the average regional unemployment rate had to be higher than 6.3% in 2017 (the national average)
On this basis, 13 regions were selected as part of the pilot project:
- Newfoundland/Labrador (excluding the capital)
- Eastern Nova Scotia
- Western Nova Scotia
- Madawaska─Charlotte
- Restigouche─Albert
- Gaspésie-Îles-de-la-Madeleine
- Central Quebec
- North Western Quebec
- Lower Saint Lawrence and North Shore
- Chicoutimi─Jonquière
- Yukon (excluding the capital)
- Charlottetown
- Prince Edward Island (excluding the capital)
For the first time, the EI program sought to distinguish seasonal claimants from other EI regular claimants for the purpose of providing additional benefits by relying on their historical claiming pattern. Those seasonal criteria were:
- established an EI regular claim during the pilot project period (reference claim) within 1 of the 13 targeted regions
- had at least 3 EI claims in the previous 5 years in which they received regular or fishing benefits, and
- at least 2 of those EI claims started around the same time of year as the reference claim. The same time of year is the period that begins 8 weeks before and ends 8 weeks after the week in which the reference claim was established
It should be noted that the annual EI Monitoring and Assessment report has been using the same definition to report on seasonal claimants since the early 2000s. In addition, the share of seasonal EI claims among all labour force participants is estimated according to the same seasonal definition. For the remainder of this report, when “targeting mechanism” is used, it is referring to either the regional criteria, seasonal claimant criteria, or both under Pilot Project No. 21.
Evaluation approach
For the purpose of this evaluation report, 5 evaluation questions were identified.
- How does the literature describe the following aspects:
- seasonal workers in Canada
- seasonal workers in other countries and the relationship between seasonal workers and Employment Insurance or other types of income replacement, where possible
- methods to identify and target seasonal workers
- considerations associated with targeting mechanisms in relation to income replacement
- How effective was the mechanism to target seasonal claimants including:
- the set of criteria to target the 13 regions, and
- the set of criteria to identify eligible claimants within these regions
- What are the characteristics of seasonal claimants and gappers?
- To what extent has the pilot reduced the incidence and duration of income gaps faced by seasonal claimants in targeted regions?
- Impacts in terms of exhaustion rate, and in terms of the duration of work in the following year
- What are the lessons learned?
Evaluation scope
The evaluation focuses on EI claimant data within the first 16 months of the pilot project —August 2018 to December 2019.
The period from January 2019 to December 2019 is used to analyse the effectiveness of the targeting mechanism. It is the only full year of data available before the COVID-19 pandemic.
For the impact analysis, the time period is restricted to claims established within the first 5 months of the pilot project—from August 2018 to December 2018. This is the only cohort of claims for which the start of their subsequent seasonal employment was not impacted by COVID-19.
See Annex B for a full list of the data sources.
Emergency COVID-19 measures, recovery benefits, and EI transitional measures
The Canada Emergency Response Benefit provided up to 28 weeks of benefits between March 15, 2020 and October 3, 2020.
The Canada Recovery Benefits provided an additional 54 weeks (maximum) from September 27, 2020 to October 23, 2021 to those not eligible for EI benefits.
EI transition measures provided 50 weeks (maximum) of benefits from September 27, 2020 to September 25, 2021 to those who were eligible for benefits.
Pilot Project No. 21 was not modified as a result of any of these measures.
Seasonal claimant profile
In 2019, when applying the seasonal claimant criteria for all EI regions, about 412,500 claims were identified as seasonal, or approximately 30% of all EI regular claims.
Compared to non-seasonal claimants, seasonal claimants tended to be, on average:
- older (48 versus 41 years old)
- worked fewer hours of insurable employment prior to their claim (1,290 versus 1,430 hours), and
- had a higher weekly benefit rate ($497 versus $473)
On the other hand, the gender profile of both seasonal and non-seasonal claimants predominantly consisted of men (just over 60%). In addition, both had the same average number of weeks of regular benefits they were entitled to (30 weeks).
Seasonal claimants were more likely than non-seasonal claimants to be working in:
- construction (27% versus 20%)
- educational services (21% versus 9%), and
- agriculture, forestry, fishing and hunting (7% versus 3%)
Seasonal claimants had higher total income than non-seasonal claimants and were more likely to work a higher number of hours per week
Examining annual income of EI regular claimants in 2019 shows that seasonal claimants had, on average, similar employment income as non-seasonal claimants (-$500), but a higher total income (+$4,900). Higher total income was due solely to receiving a higher amount of EI benefits (+$4,900).
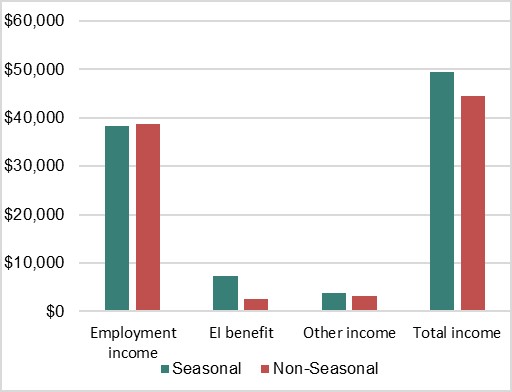
Text description of figure 4
| Source of income | Amount of income (in dollars) for seasonal claimants | Amount of income (in dollars) for non-seasonal claimants |
|---|---|---|
| Employment income | 38,236 | 38,815 |
| EI benefit | 7,371 | 2,495 |
| Other income | 3,853 | 3,228 |
| Total income | 49,461 | 44,538 |
- Source: EI Administrative Data and CRA Tax Files.
Seasonal claimants and non-seasonal claimants were similar in how likely they were to work 40 hours a week or more (about 40%). However, seasonal claimants were twice as likely to work 50 hours a week or more (15%) compared to non-seasonal claimants (8%).
Due to variable best weeks (see Annex C for description of variable best weeks), a higher share of seasonal claimants working intensive work weeks over a shorter period of time (50 hours or more) is 1 reason why they have a higher average weekly benefit rate.
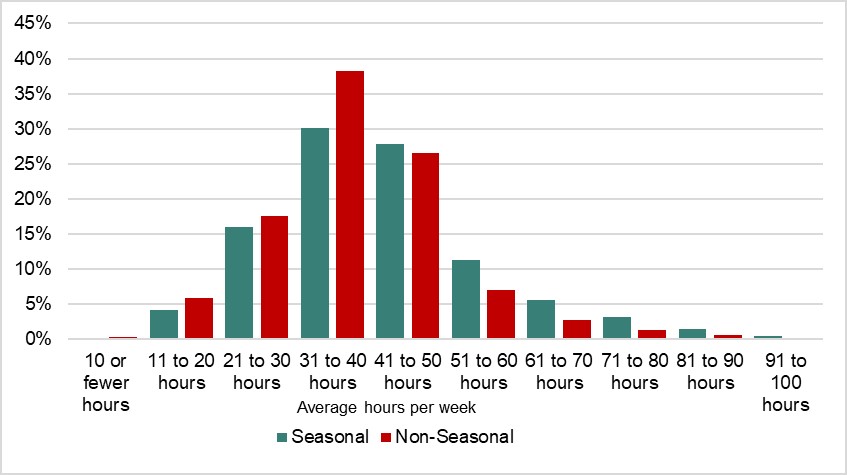
Text description of figure 5
| Average weekly hours worked | Share of seasonal claimants | Share of non-seasonal claimants |
|---|---|---|
| 10 or fewer hours | 0.2% | 0.3% |
| 11 to 20 hours | 4.2% | 5.9% |
| 21 to 30 hours | 16.0% | 17.5% |
| 31 to 40 hours | 30.1% | 38.2% |
| 41 to 50 hours | 27.8% | 26.6% |
| 51 to 60 hours | 11.3% | 7.0% |
| 61 to 70 hours | 5.6% | 2.7% |
| 71 to 80 hours | 3.1% | 1.2% |
| 81 to 90 hours | 1.4% | 0.5% |
| 91 to 100 hours | 0.4% | 0.2% |
- Source: EI Administrative Data.
Seasonal claimants tend to differ between targeted and non-targeted regions
Due to the regional targeting mechanism, which targeted 13 EI regions, the majority of seasonal claimants are not included within the pilot project. Overall, only 154,900 (38%) seasonal claimants resided in targeted regions in 2019, while 257,600 (62%) were in non-targeted regions.
Within the targeted regions, about half of all EI regular claimants were seasonal, compared to about a quarter within non-targeted regions. This reflects that the pilot project targeted those regions with a higher incidence of seasonal claims.
When seasonal claimants in targeted and non-targeted regions were broken down by their demographic characteristics (Table 1), 3 key differences were found. In particular, when compared to those in non-targeted regions, seasonal claimants in targeted regions:
- were more likely to have been male (69% versus 58%)
- were more likely to have worked 50 hours or more per week on average (22% versus 11%), and
- were entitled, on average, to a higher maximum number of weeks of regular benefits (35 versus 26 weeks)
Higher entitlement for regular benefits among seasonal claimants in targeted regions is a function of the EI program. For example, in a region where the unemployment rate is 11.3%, 800 hours of insurable employment equates to 27 weeks of maximum entitlement. This compares to 15 weeks in a region with an unemployment rate of less than 6.1% (see Annex C for the Variable Entrance Requirement and Entitlement table).
| Demographic characteristics | Targeted regions | Non-targeted regions |
|---|---|---|
| Average age | 49.1 | 47.5 |
| Gender (share that were male) | 68.5% | 58.4% |
| Average hours of insurable employment | 1,212 | 1,343 |
| Share that worked 50 hours or more a week | 21.7% | 10.8% |
| Average entitlement (including extra weeks) | 35.3 weeks | 26.0 weeks |
| Average benefit rate (in dollars) | 487 | 502 |
- Source: EI Administrative Data.
From an income perspective, seasonal claimants within targeted regions have lower employment income but tend to use more weeks of benefits than those seasonal claimants in non-targeted regions. On average, seasonal claimants in targeted regions earned about $8,400 less in employment income than those in non-targeted regions ($33,000 versus $41,400). However, they received $3,500 more in EI benefits ($9,500 versus $6,000).
The distribution of seasonal claimants across selected industries varies considerably between those residing in targeted and those residing in non-targeted regions (Figure 6). While the share of claimants within the Construction industry are comparable, seasonal claimants in non-targeted regions were about 21 percentage points (28.7% versus 7.3%) more likely to be in Educational Services.
Furthermore, seasonal claimants in targeted regions are more likely to work in industries that operate during a shorter season due to limitations in operating during colder weather. This includes industries such as:
- accommodation and food services (more than likely related to tourism), and
- agriculture, fishing, forestry and hunting
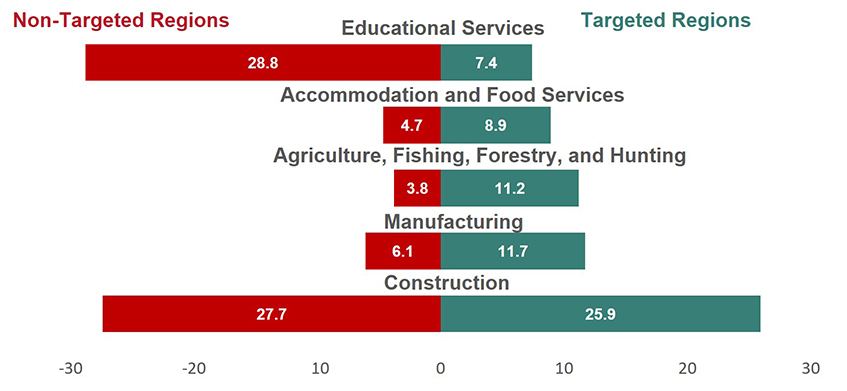
Text description of figure 6
| Industry of employment | Targeted regions | Non-targeted regions |
|---|---|---|
| Educational services | 7.3% | 28.7% |
| Accommodation and food services | 5.6% | 2.9% |
| Agriculture, fishing, forestry, and hunting | 11.1% | 3.7% |
| Manufacturing | 12.4% | 6.0% |
| Construction | 26.0% | 27.7% |
- Source: EI Administrative Data.
Key findings
Finding 1: Canada’s EI program is unique in its targeting of seasonal claimants compared to other countries
Earnings-replacement benefit programs (employment insurance benefits in Canada or unemployment benefits as it is most commonly referred to outside of Canada) for those who have become unemployed vary significantly across countries. While Canada relies on an hour based system that varies regionally to deliver its program, most countries use a days/weeks or earnings based system—for example, Netherlands, Finland, Denmark, Spain, and Ireland. Sweden is the most notable exception where they require an individual to have worked around 480 hours in the past 6 months.
A review of the literature (ESDC 2021, Literature Review) found that formally targeting seasonal workers is uncommon in most other countries. Even from a national statistics perspective, reporting on seasonal workers is not a common practice in other countries. As Gunderson (2006) pointed out “Finding discussions of seasonal employment and EI in the existing literature is like finding a needle in a haystack”.
Overall, so long as the unemployed individual meets the eligibility criteria, most countries do not distinguish between those who are in seasonal or non-seasonal employment. An exception to this are specific states within the United States (US), which identify seasonal workers with the purpose of excluding them from unemployment benefits.
While the Canadian EI system relies on the claim pattern of individuals to define a seasonal claimant, in the US, seasonal workers/claimants are identified through the employer. For example, Michigan, North Carolina, and Pennsylvania exclude seasonal workers from benefit payments if a specific amount of their wages or employment is associated with seasonal work.
Description of how selected US states treat seasonal workers
Michigan
Employers are identified as seasonal if they employ individuals during regularly recurring periods of 26 weeks or less within any 52-week period. Employees hired by a seasonal employer do not have access to unemployment benefits.
North Carolina
Any employee with at least 25% of their wages coming from seasonal employment are excluded from unemployment benefits. Seasonal employment is defined as employment where the seasonal conditions make it impracticable or impossible to otherwise customarily carry out production operations within a regularly recurring active period. This active period is considered as less than an aggregate of 36 weeks in a calendar year.
Pennsylvania
A seasonal worker is excluded from unemployment benefits if they work within recreational services (golf course, ski slope, campground) or commercial canning or freezing services for a fruit or vegetable food processing operation for less than 180 days of work or the equivalent of 36 weeks on full time basis.
Finding 2: By relying on the timing of a claim, the targeting mechanism shows some effectiveness in identifying claimants with a frequent pattern of seasonal work. However, the mechanism was sensitive to other non-seasonal measures that affect the start or end date of a claim
One of the primary objectives of the pilot project was to test the effectiveness of the new targeting mechanism based on historical claiming patterns to identify seasonal claimants. As previously indicated, this is the first time the EI program has defined what constitutes a seasonal claimant for the purpose of providing additional benefits via a set of 4 criteria.
For the purpose of this evaluation, a simulation was conducted whereby each seasonal criterion was modified—that is, to be more lenient or stringent. Each of the 4 parameters were modified in isolation from one another. This provided for an analysis of how many claimants were on the margin of eligibility. The following simulations were conducted:
- the number of years in the reference period is reduced from 5 to 4 years and then increased to 6 years
- the number of EI regular and fishing claims within the reference period is reduced from 3 to 2 claims and then increased to 4 claims
- the number of EI regular and fishing claims that occur around the same time of year as the reference claim (within the period that begins 8 weeks before and ends 8 weeks after the week in which the reference claim was established) is reduced from 2 to 1 claim and then increased to 3 claims
- the same time of year window is increased to 12 weeks before and after the claim, and then decreased to 4 weeks before and after
Simulation considerations
There are a few things to consider when simulating a criterion to be more lenient or stringent. First, the identification of claimants as seasonal may depend on changing more than 1 parameter at a time. Thus, the impact of combining 2 or more changes in parameters would not equate to the sum of the impacts of each simulated individual change.
Second, a key issue to consider is that modifying parameters to be more lenient or stringent can capture different types of work that may resemble seasonal work patterns in a variety of ways. In particular, work that is precarious and/or non-standard could meet the criteria of the seasonal definition, especially at the margin. Therefore, making the parameters more lenient would result in more claims correctly identified as seasonal (workers in seasonal employment). However, it would also increase the proportion of claims ‘incorrectly’ identified as seasonal (workers not in seasonal employment). On the other hand, a more stringent definition would decrease the number of claims correctly identified as seasonal, but it would also decrease the proportion of incorrectly identified claims.
Simulated modifications to the targeting mechanism demonstrates that claimants were less ‘on the margin’ of being identified as seasonal within targeted regions compared to non-targeted regions
On average, making one criterion more lenient/stringent increased/decreased the number of identified seasonal claimants by 5% to 17% within targeted regions. More significant shifts were observed in non-targeted regions which ranged from about 7% to 26%.
Within targeted regions, the largest increase in the number of identified seasonal claimants would occur if the number of claims starting around the same time of the year was reduced from 2 to 1 claim. This would result in roughly an additional 24,000 claimants or an increase of 15.3%.
On the other hand, within non-targeted regions, the largest increase in the total number of identified claims would occur if the number of claims made in the previous 5 years was reduced from 3 to 2 claims. This would result in roughly an additional 59,000 claimants or an increase of 22.9%.
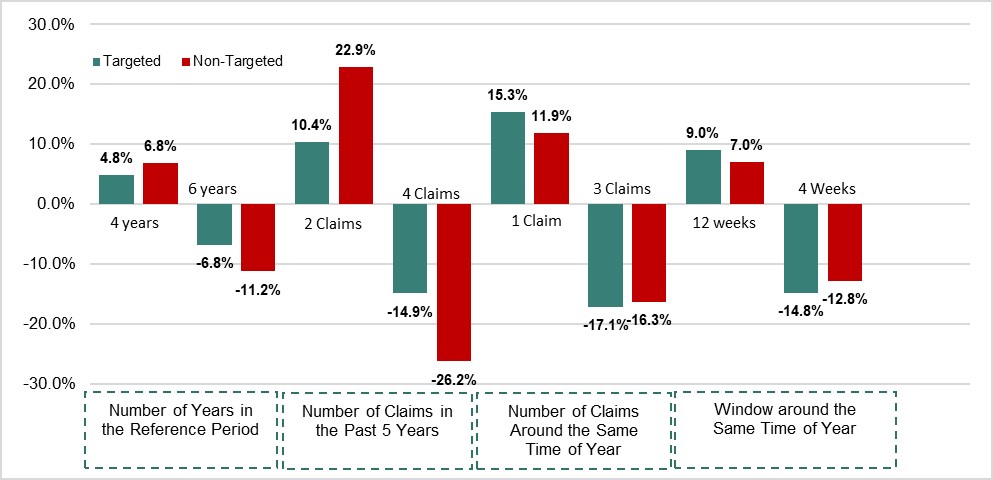
Text description of figure 7
| Simulated parameters | Percentage change in seasonal claimants within targeted regions | Percentage change in seasonal claimants within non-targeted regions |
|---|---|---|
| Number of years in the reference period (4 years) | 4.8% | 6.8% |
| Number of years in the reference period (6 years) | -6.8% | -11.2% |
| Number of claims in the past 5 years (2 claims) | 10.4% | 22.9% |
| Number of claims in the past 5 years (4 claims) | -14.9% | -26.2% |
| Number of claims around the same time of year (1 claim) | 15.3% | 11.9% |
| Number of claims around the same time period (3 claims) | -17.1% | -16.3 |
| Window around the same time of year (12 weeks) | 9.0% | 7.0% |
| Window around the same time of year (4 weeks) | -14.8% | -12.8% |
- Source: ESDC (2021). Annex A. Technical Report 1.
Men and younger claimants would benefit relatively more from relaxing the seasonal criteria. In almost all cases, making the parameters more lenient would increase the share of men who would be identified as seasonal by a higher rate than women.
Younger claimants—30 years and under—would benefit the most from more lenient parameters. In particular, the number of young claimants identified as seasonal increased by almost 30% when the number of previous claims required in the past 5 years was reduced from 3 to 2. This is to be expected as those under 30 would have had less of an opportunity to have the sufficient labour market attachment and claim pattern to be eligible for the pilot project.
Simulating modifications to the EI regional criteria
Pilot Project 21 used a combination of criteria whereby a region needed to have a relatively higher unemployment rate (higher than 6.3%) and a relatively higher proportion of its labour force participants that were seasonal claimants (4% and higher).
The following figure plots the EI regions against the 2 criteria (dashed lines). The targeted regions are located in the upper right portion of the figure.
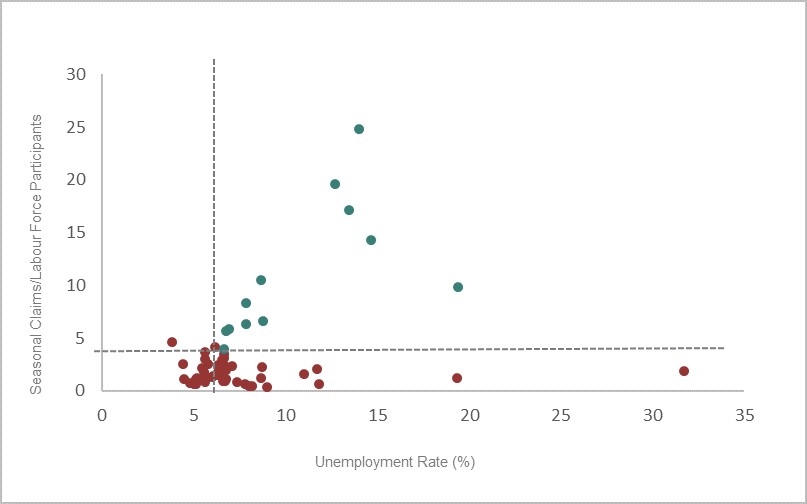
Text description of figure 8
| EI regions | Regional unemployment rate | Share of labour force that were seasonal claimants |
|---|---|---|
| Targeted region 1 | 19.4% | 9.8% |
| Targeted region 2 | 14.7% | 14.2% |
| Targeted region 3 | 14.1% | 24.8% |
| Targeted region 4 | 13.5% | 17.1% |
| Targeted region 5 | 12.8% | 19.6% |
| Targeted region 6 | 8.8% | 6.6% |
| Targeted region 7 | 8.7% | 10.5% |
| Targeted region 8 | 7.9% | 8.3% |
| Targeted region 9 | 7.9% | 6.3% |
| Targeted region 10 | 6.9% | 5.8% |
| Targeted region 11 | 6.8% | 5.6% |
| Targeted region 12 | 6.7% | 4.0% |
| Non-targeted region 1 | 31.7% | 1.8% |
| Non-targeted region 2 | 19.4% | 1.1% |
| Non-targeted region 3 | 11.9% | 0.6% |
| Non-targeted region 4 | 11.8% | 2.0% |
| Non-targeted region 5 | 11.1% | 1.5% |
| Non-targeted region 6 | 9.0% | 0.3% |
| Non-targeted region 7 | 8.7% | 2.2% |
| Non-targeted region 8 | 8.7% | 1.2% |
| Non-targeted region 9 | 8.2% | 0.4% |
| Non-targeted region 10 | 8.0% | 0.4% |
| Non-targeted region 11 | 7.8% | 0.5% |
| Non-targeted region 12 | 7.4% | 0.8% |
| Non-targeted region 13 | 7.1% | 2.3% |
| Non-targeted region 14 | 6.8% | 1.1% |
| Non-targeted region 15 | 6.8% | 1.9% |
| Non-targeted region 16 | 6.7% | 0.8% |
| Non-targeted region 17 | 6.7% | 2.3% |
| Non-targeted region 18 | 6.7% | 3.4% |
| Non-targeted region 19 | 6.7% | 3.1% |
| Non-targeted region 20 | 6.7% | 0.8% |
| Non-targeted region 21 | 6.6% | 2.9% |
| Non-targeted region 22 | 6.4% | 1.6% |
| Non-targeted region 23 | 6.3% | 2.4% |
| Non-targeted region 24 | 6.3% | 1.8% |
| Non-targeted region 25 | 6.3% | 1.4% |
| Non-targeted region 26 | 6.2% | 4.1% |
| Non-targeted region 27 | 6.1% | 1.4% |
| Non-targeted region 28 | 6.0% | 1.2% |
| Non-targeted region 29 | 5.8% | 2.5% |
| Non-targeted region 30 | 5.7% | 0.8% |
| Non-targeted region 31 | 5.7% | 3.6% |
| Non-targeted region 32 | 5.7% | 1.4% |
| Non-targeted region 33 | 5.6% | 2.9% |
| Non-targeted region 34 | 5.6% | 1.2% |
| Non-targeted region 35 | 5.6% | 1.7% |
| Non-targeted region 36 | 5.5% | 2.1% |
| Non-targeted region 37 | 5.2% | 1.2% |
| Non-targeted region 38 | 5.2% | 0.6% |
| Non-targeted region 39 | 5.2% | 1.1% |
| Non-targeted region 40 | 5.0% | 0.6% |
| Non-targeted region 41 | 4.8% | 0.6% |
| Non-targeted region 42 | 4.5% | 1.1% |
| Non-targeted region 43 | 4.5% | 2.5% |
| Non-targeted region 44 | 3.8% | 4.5% |
- Source: ESDC (2021). Annex A. Technical Report 1.
If both criteria were decreased by 1 percentage point—unemployment rate of 5.3% or higher, and 3% or higher of its labour force that were seasonal claimants—4 new EI regions would have been selected into the pilot:
- Trois-Rivières
- Montérégie
- Eastern Ontario, and
- Huron
In total, this would have increased the number of identified seasonal claims by 24,500 in targeted regions in 2019 (or 15.8%). The main reason why these regions were not selected is a result of the regional proportion of seasonal claims to labour force participants.
Alternatively, if both requirements were made more stringent by 1 percentage point, the region of Charlottetown would have been excluded. This would have decreased the number of targeted regions to 12 and the number of identified seasonal claims in targeted regions would have decreased by 1,300 (or 1.0%).
The same analysis was undertaken but used 2019 unemployment rates and 2018-2019 fiscal year for the labor force numbers and the number of seasonal claims. In this case, 3 of the targeted regions would not have been targeted if 2019 data were used—Chicoutimi-Jonquiere, Central Quebec and Charlottetown—while no new regions would have been targeted. In total, this would have decreased the number of identified seasonal claims by 35,400 in targeted regions in 2019 (or 22.8%).
Using EI fishing benefits as a benchmark suggests that the targeting mechanism identifies the majority of fishing claimants as seasonal
The drawback of a sensitivity analysis is that it does not inform whether identified claimants are effectively 'true' seasonal claimants—that is, working in a seasonal industry. This is exacerbated by the fact that there is no definition of what constitutes a claimant working in seasonal employment. To address this shortcoming, this evaluation uses EI fishing claimants to examine, in part, the effectiveness of the targeting mechanism.
While fishing claimants may not exactly represent each type of seasonal claimant, this strategy allows for the assessment of the targeting mechanism and the setting of a benchmark that would not have been available otherwise.
It should be noted that this analysis only identifies fishing claimants that were correctly identified as seasonal. It does not assess the overall effectiveness of the mechanism in terms of incorrectly identifying non-seasonal claimants as seasonal.
For the purpose of this report and based on available data, summer fishing claimants are used as a representative group of traditional seasonal claimants. In theory, if one of the key objectives of the pilot project is to test a mechanism that targets claimants who are in seasonal employment, then the pilot project criteria should be able to accurately identify the majority of fishing claims as seasonal.
Table 2 shows that 17,750 summer fishing claims were established across all regions in 2019. When applying the pilot project selection criteria for identifying seasonal claimants, 13,962 fishing claims were identified as seasonal—or about 79%.
| EI Regions | Total summer fishing claims | Summer fishing claims identified as seasonal | Share of fishing claims identified as seasonal |
|---|---|---|---|
| All regions | 17,750 | 13,962 | 78.7% |
| Targeted regions | 14,415 | 11,765 | 81.6% |
| Non-targeted regions | 3,335 | 2,197 | 65.9% |
Source: ESDC (2021). Annex A. Technical Report 1.
The majority of the non-identified fishing claims was due to not having 3 claims in the past 5 years. This appears to be a function of being new to the fishing industry and not solely linked to age.
Overall, the results suggest that when considering fishing benefits as a benchmark for a seasonal claimant, the current mechanism appears to identify a relatively high proportion of seasonal workers that have a frequent work pattern of seasonal work.
Effects of temporary non-seasonal measures
A targeting mechanism that relies on historical EI claiming pattern anchored around the date when the reference claim is made, is susceptible to measures that may temporarily modify the timing of future reference claims.
Between January 2015 and July 2017, the Canadian government introduced a temporary legislative measure to extend the duration of EI regular benefits in regions that experienced a sharp and sustained increase in the unemployment rate (Canada Gazette, 2018). Under this temporary measure, 15 commodity-based regions experiencing sharp unemployment shocks were targeted. In these regions, claimants were eligible for 5 additional weeks of benefits and up to an additional 20 weeks of benefits for long-tenured workers.
The Newfoundland/Labrador region is the only region where claimants could qualify for additional benefits under both the temporary legislative change as well as Pilot Project 21.
As Figure 9 shows, there is a noticeable decrease in the number of seasonal claimants identified in the Newfoundland/Labrador region between 2015 and 2017—a 60% decrease (or about 17,000 claims). In fact, if the seasonal criteria is extended to the other 14 regions included in the commodity price measure, a similar decrease is also observed—about a 54% decrease.
Interestingly, all other 12 Pilot Project 21 regions saw less than a 1% decline in seasonal claimants between 2015 and 2017.
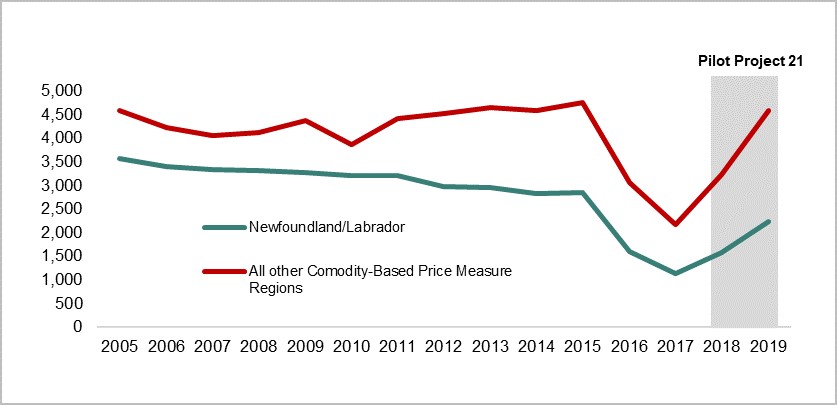
Text description of figure 9
| Year | Newfoundland/Labrador | All other commodity-based price measure regions |
|---|---|---|
| 2005 | 35,650 | 45,810 |
| 2006 | 34,010 | 42,300 |
| 2007 | 33,440 | 40,660 |
| 2008 | 33,170 | 41,160 |
| 2009 | 32,770 | 43,730 |
| 2010 | 32,120 | 38,740 |
| 2011 | 32,070 | 44,090 |
| 2012 | 29,800 | 45,210 |
| 2013 | 29,460 | 46,470 |
| 2014 | 28,310 | 45,950 |
| 2015 | 28,550 | 47,600 |
| 2016 | 15,940 | 30,620 |
| 2017 | 11,350 | 21,690 |
| 2018 | 15,800 | 32,360 |
| 2019 | 22,440 | 45,880 |
- Source: ESDC (2021). Annex A. Technical Report 1.
Certain seasonal workers that qualified for additional weeks due to the temporary commodity-price measure likely saw their reference claim move outside of their normal claiming pattern between 2015 and 2017. As a result, all of their previous seasonal claims would not have occurred around the same time of year as their reference claim.
In addition, by the time the pilot project was in place in 2018 and 2019, a number of claimants were not identified as seasonal due to 2015 to 2017 claims not occurring around the same time of year as their 2018 or 2019 reference claim. When simulations were run to decrease from 2 to 1 the number of claims occurring around the same time of year as the reference claim, a 40% increase in identified seasonal claimants (or about 9,000 claimants) was observed in Newfoundland/Labrador.
Eligibility for the pilot project and the potential impacts of the Canada Emergency Response Benefits (CERB) and EI transitional measures
Under Pilot Project No.21, eligibility for the additional 5 weeks of entitlement is partly based on claimants starting their claim around the same time every year. As evidence in this evaluation has shown, any temporary measure that affects when a claimant ends their previous claim and starts their subsequent claim can impact whether they are identified as a seasonal EI claimant. As such, it is likely that, due to the CERB and subsequent EI transitional measures, the timing of when some seasonal claimants started their 2021 claim has been impacted, which resulted in ineligibility for the temporary legislated measure in place until October 29, 2022 (which replicated the rules of the now ended Pilot Project No. 21). Below is a description of how this may affect a number of seasonal claimants.
It is common for certain seasonal claimants to keep their claim “open” for the full 52 week benefit period—that is, when they return to work their claim is still active and they report working full-time. This allows them to immediately start claiming benefits when they experience an interruption of earnings and not have to serve a second waiting period. After their 52 week benefit period is over they establish a new claim. All claimants who were on CERB were auto-transitioned into an EI transitional claim at the end of September 2020. As such, seasonal claimants who typically leave their claim open all year would see their claim end in September 2021 and a new one start at the beginning of October 2021. For seasonal claimants who typically have a claim that starts between March and August, their 2021 claim would now be outside of the 17 week reference window (8 weeks before and 8 weeks after the reference claim). This would mean that all past claims would not be within the new reference window making them ineligible for the temporary legislated measure.
It is anticipated that this issue could be a significant concern for some seasonal claimants.
Finding 3: Approximately 10% of all seasonal claimants have a period without income following their claim (seasonal gappers) and the risk of this event to reoccur year-over-year is low
As previously mentioned, a subset of all seasonal claimants exhaust their benefits and have a period without income before their subsequent employment (seasonal gapper). One methodological issue with identifying a seasonal gapper is that the risk of experiencing weeks of no income is closely related to the duration of EI benefits. Therefore, the incidence of being a seasonal gapper is sensitive to any measure providing additional weeks of entitlement.
For this reason, data from 2013 is used—a year when no additional measures were in place—to provide an overview of seasonal gappers and their characteristics. While 2013 is 5 years before the introduction of the pilot project, it provides for the most complete examination of the risk of experiencing an income gap by seasonal claimants. This is important when considering those seasonal claimants that would make use of additional weeks to reduce an income gap.
Following the Employment Insurance Monitoring and Assessment Report definition of an income gap, 39,650 claimants were identified as seasonal gappers across all EI regions in 2013, representing 9.2% of all seasonal claimants. Relative to all seasonal claimants, seasonal gappers were more likely to:
- be male (67% versus 62%)
- have worked fewer hours of insurable employment (900 versus 1,250 hours)
- have lower entitlement (25 versus 31 weeks), and
- received lower weekly benefit rates($392 versus $430)
In addition, among seasonal claimants, seasonal gappers were more likely to be
working in:
- agriculture, fishing, forestry and hunting (12% versus 7%)
- accommodation and food services (11% versus 6%), and
- arts, entertainment and recreation (6% versus 3%)
Seasonal gappers
A seasonal gapper is defined in the 2019-2020 Employment Insurance (EI) Monitoring and Assessment Report (EI MAR) as a claimant who exhausts their entitlement weeks without receiving employment income or EI benefits for at least 1 week but no more than 15 consecutive weeks after their claim. This is the definition that is used for this evaluation. For example, a seasonal gapper in 2013 is an individual who established their claim in 2013 and had an income gap at the end of their claim.
While 2013 provides for the most complete picture of a seasonal gapper, the share of seasonal claimants that were seasonal gappers in 2017 was analyzed within the 12 targeted regions (the region of Newfoundland/Labrador was excluded due to the commodity-based price measure). Analysis found that seasonal gappers represented around 10% of seasonal claimants within these regions. As such, it is expected that the share of seasonal claimants that have an income gap is relatively stable over time.
In 2013, the majority (58%) of seasonal gappers were located in non-targeted regions, whereas 42% were located in targeted regions
In targeted regions, 16,700 seasonal gappers were identified (9.8% of seasonal claimants in those regions) compared to 22,900 in non-targeted regions (8.8% of seasonal claimants in those regions).
Seasonal gappers in targeted regions were entitled to a higher maximum number of weeks of regular benefits than gappers in non-targeted regions (29 versus 21 weeks). Some of this observed difference in entitlement is due to the variable entrance and entitlement table (Annex C). However, they earned considerably less (-$6,700) than gappers in non-targeted regions.
| Type of income (Average) | Targeted regions | Non-targeted regions |
|---|---|---|
| Employment income | $15,652 | $22,315 |
| EI benefit | $10,815 | $8,185 |
| Other income | $4,178 | $4,200 |
| Total income | $30,645 | $34,699 |
| Number of jobs | 1.4 | 1.5 |
- Source: EI Administrative Data and CRA Tax Files.
To provide a more complete picture of the risk faced by seasonal gappers, the persistence of the risk from one year to the next is examined. Analysis found that about 60% of seasonal gappers in 2013 did not have any income gaps in the previous 5 years between 2008 and 2012.
Figure 10 shows that among seasonal gappers in 2013 less than 9% (about 3,500 claimants) experienced 3 or more income gaps from 2008 to 2012. Among seasonal gappers in 2013, only 1% had a gap in every single year from 2008 to 2012 (410 claimants). Overall, this suggests that for the majority of seasonal gappers, an income gap is not a recurring or persistent event.
Pilot Project No. 15 was active from September 2010 to 2012 in 15 regions (which included all 13 regions in Pilot Project No. 21). It is possible that the additional weeks are underestimating income gaps in these years for seasonal gappers in targeted regions. However, since the incidence of having an income gap over the period of analysis is relatively similar in non-targeted and targeted regions, the potential estimation bias is deemed small.
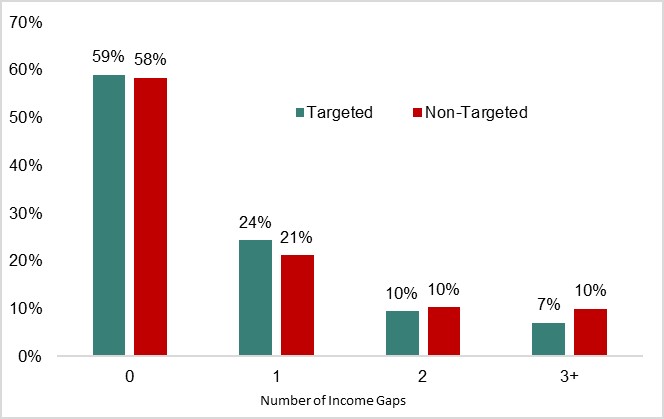
Text description of figure 10
| Number of income gaps in past 5 years | Targeted regions | Non-targeted regions |
|---|---|---|
| 0 | 59% | 58% |
| 1 | 24% | 21% |
| 2 | 10% | 10% |
| 3 or more | 7% | 10% |
- Source: EI Administrative Data.
Exploratory analysis: machine learning to identify seasonal gappers
To test whether the risk for a seasonal claimant to experience an income gap could be predicted, an exploratory analysis using machine learning was implemented. The model used the population of seasonal claimants to identify seasonal claimants with a high probability of experiencing weeks with no income based on explanatory variables observed before the claim (see Annex F for more information). As previously indicated, 2013 is used to provide the most accurate representation of seasonal gappers. The table below shows the main results. While the model is based on 2013 data, results are shown for claimants in 2014. The accuracy of the model in 2014 indicates that some components associated with experiencing an income gap span across years.
| Variables | All regions in 2013 | Targeted regions in 2013 | All regions in 2014 | Targeted regions in 2014 |
|---|---|---|---|---|
| Accuracy of the model | 79.0% | 76.4% | 79.0% | 76.4% |
| Test data (proportion of gappers) | 11.3% | 12.0% | 9.3% | 9.9% |
| Correctly identified gappers | 75.6% | 86.4% | 76.8% | 86.5% |
| Incorrectly identified gappers | 24.4% | 13.6% | 23.2% | 13.5% |
| Correctly identified non gappers | 82.9% | 69.7% | 81.7% | 49.2% |
| Incorrectly identified non gappers | 17.1% | 30.3% | 18.3% | 50.8% |
| Test observations | 70,509 | 27,887 | 421,952 | 165,513 |
| Model observations | 63,458 | 26,748 | 63,458 | 26,748 |
- Source: EI Administrative Data.
Overall, the model found that having a previous income gap, establishing a claim between July and October, and working within the Agriculture, Fishing, Forestry and Hunting industry were the most important predictors of a seasonal gapper. The machine learning model correctly identified 86% of seasonal gappers within targeted regions. In other words, if a model like this was used to identify seasonal gappers when they established their claim, only 14% of seasonal non-gappers would have access to additional weeks.
This is considerably lower than the current mechanism, whereby about 90% of seasonal non-gappers have access to additional weeks. A mechanism like this would be more targeted and reduce the amount of benefits going to seasonal claimants without an income gap who just increase their benefit usage.
Finding 4: In 2018, among those seasonal claimants eligible for 5 additional weeks of entitlement, a little over one-third used at least 1 week and only 10% had an income gap in the previous year
From August to December 2018, about 75,000 seasonal claimants who established a claim were eligible to receive the full 5 weeks of additional benefits—that is, had initial entitlement of 40 weeks or less. In total, 27,500 (37%) used at least 1 additional week during their claim, with an average usage of 3.9 weeks.
Those who used additional weeks had, on average, 930 hours of insurable employment, which translated into 29 weeks of entitlement. This compares to 1,300 insurable hours and 35 weeks of entitlement for non-users. Of those who used additional weeks, only 28% of them had an income gap in 2017 (previous gappers).
Close to 10,000 seasonal claimants were not included due to having initial entitlement greater than 40 weeks.
To better understand the annual working pattern of those who used additional weeks from the pilot project, their hours of insurable employment, from before their claim, are converted into standard work weeks of 35 hours and added to their initial entitlement (Figure 11).
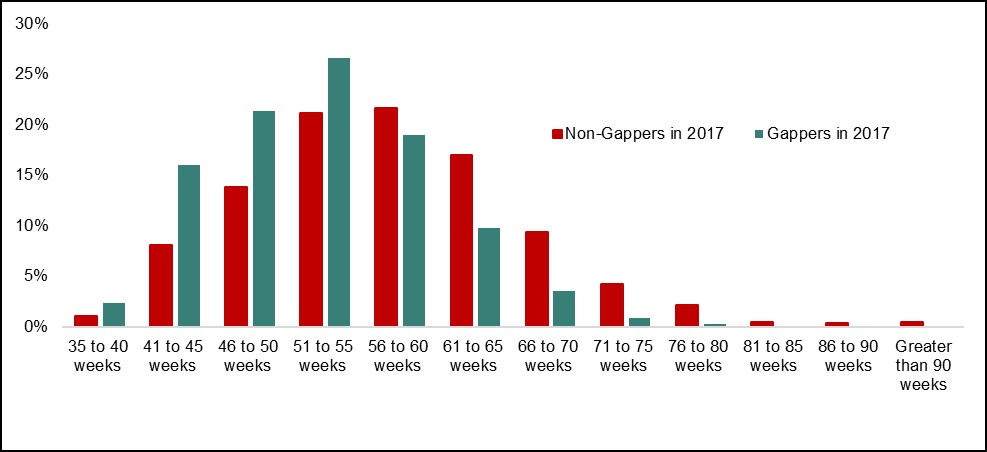
Text description of figure 11
| Entitlement and standard weeks worked | Share of non-gappers | Share of gappers |
|---|---|---|
| 35 to 40 weeks | 1.1% | 2.4% |
| 41 to 45 weeks | 8.1% | 16.0% |
| 46 to 50 weeks | 13.8% | 21.4% |
| 51 to 55 weeks | 21.2% | 26.6% |
| 56 to 60 weeks | 21.6% | 19.0% |
| 61 to 65 weeks | 17.0% | 9.8% |
| 66 to 70 weeks | 9.4% | 3.5% |
| 71 to 75 weeks | 4.2% | 0.9% |
| 76 to 80 weeks | 2.2% | 0.3% |
| 81 to 85 weeks | 0.5% | 0.1% |
| 86 to 90 weeks | 0.4% | 0.0% |
| Greater than 90 weeks | 0.5% | 0.0% |
- Source: EI Administrative Data.
For about 60% of users in 2018, ‘Entitlement + Standard Weeks Worked’ added up to greater than 52 weeks. This potentially suggests that for a significant proportion of seasonal gappers, the additional weeks are being used to cover an income gap that may only exist because they are working intensive work weeks.
As an example, 2 individuals who work 800 insurable hours in a region with an unemployment rate of 12.1%—one at 50 hours a week (16 weeks of work) and the other at 35 hours (23 weeks of work)—are both entitled to 29 weeks of regular benefits. However, only the individual who is working intensive weeks will have an income gap (6 weeks).
Cohort sample
Due to the COVID-19 pandemic, the only cohort of claimants with sufficient post-claim data to capture periods of no income are those who established their claim between August and December 2018. This evaluation focuses on those who were eligible to the full 5 weeks of benefits (40 weeks or less of entitlement without the additional weeks).
While the analysis only uses a 5 month sample, about 70% of seasonal claimants (80% of seasonal gappers) establish their claim during these months of the year. As such, the results presented in this evaluation should be considered as representative of the entire seasonal claimant population.
Finding 5: For seasonal claimants, an impact analysis found that the pilot project reduced the incidence of having a period without income by over 7 percentage points. This impact steadily decreased as the number of EI regular benefit weeks claimants were entitled to increased
The targeting mechanism of the pilot project allows for the use of a relatively more reliable and robust evaluation method compared to those used in previous evaluations which relied on a comparison between claimants in targeted regions to those in non-targeted regions. Comparing claimants across regions may result in findings related to unobservable characteristics stemming from regional differences and not necessarily the policy change.
The seasonal criteria introduced through the pilot project allows for the construction of a comparison group. This group consists of claimants who just missed being identified as seasonal within a targeted region and did not receive 5 additional weeks of entitlement—that is, the control group. The treatment group of claimants are those that just met the seasonal criteria and were eligible to receive all 5 additional weeks of entitlement during the pilot project.
Therefore, eligibility for the measure comes from a discontinuity in the history of claims and not from residing in one region over another. In other words, claimants could not change their history of claims to self-select into the pilot project. To ensure that the impacts are comparable for the treatment group, seasonal claimants that were not eligible to the full 5 weeks (already had initial entitlement of 41 or more weeks) are excluded.
In order to ensure that the control group of claimants are as close as possible to the treatment group, the evaluation approach introduces the concept of “new seasonal claimants”—that is, claimants who became seasonal within the past 4 years. Comparing outcomes between claimants who just missed being seasonal to yearly seasonal claimants would not provide for a robust comparison, as these individuals are quite different in terms of their demographic profile.
These groups are further split into those with an income gap in 2017 (previous gappers) and those with no income gap in 2017 (previous non-gappers).
Treatment group
EI regular benefit claimants (between August and December 2018) who had 3 regular or fishing claims in past 3 years (or 4 regular or fishing claims in past 4 years) before their 2018 claim (all of them occurring around the same time of year as the 2018 claim). However, the claimants who had a regular or fishing claim in the 5th or 6th year before their 2018 claim (that occurred around the same time as the 2018 reference claim) are not included in the treatment group.
Control group
EI regular benefit claimants (between August and December 2018) who had 2 regular or fishing claims in the 2 years before their 2018 claim (both occurring around the same time of the year as the 2018 claim). However, they had no other regular or fishing claims within the past 5 years (that is, they missed being seasonal due to not having a third claim in the past 5 years).
The pilot project was found to have a positive effect on reducing the incidence of seasonal claimants experiencing an income gap
This evaluation uses a difference-in-difference (DiD) approach for the impact analysis. This approach is used to identify the impact of a policy when an outcome can be observed in 2 different periods for 2 distinct groups, where only one of the groups is exposed to the policy in the second period.
Given that claimants within the treatment and control group had established a claim in 2017, the impact analysis allows for the comparison of claimants’ respective outcomes between 2017 (period before the pilot project) and 2018 (period during the pilot project).
As shown in Table 5, the incidence of having an income gap decreased by 7.2 percentage points following the introduction of the pilot project, representing a 38% decrease in the number of seasonal gappers. The effect was greater among gappers who also had a gap in the previous year (previous gappers in Table 5).
The likelihood of experiencing an income gap decreased by 17 percentage points among previous gappers (or over a 50% decrease).
| Variables | All new seasonal claimants | Previous gappers (year before) |
Previous non-gappers (year before) |
|---|---|---|---|
| Incidence of ‘gapping’ (percentage point) | -7.2*** | -17.1*** | -6.1*** |
| Gap duration (weeks) | Non-applicable | -1.0*** | Non-applicable |
| Exhaustion rate (percentage point) | -12.9 *** | -15.9*** | -12.4*** |
| Observations | 10,667 | 2,180 | 8,487 |
- Note: *** Significant at 99%
- Source: ESDC (2021). Annex A. Technical Report 2.
Finally, the pilot project significantly decreased the share of claimants using all of their entitlement (exhaustion rate) by 12.9 percentage points compared to 2017. This represented a 30.5% decrease in the number of seasonal claimants that exhausted their benefits.
The impact on the number of claimants who exhausted their benefits is different than for those who faced an income gap since one may exhaust their benefits but not face an income gap.
The effect of the pilot project on reducing the incidence of an income gap decreased as entitlement increased
It can be expected that the likelihood of experiencing weeks without income is closely related to the number of weeks of initial entitlement an individual has—that is, entitlement without the additional pilot project weeks. In other words, when the initial entitlement is higher the effect of the pilot project on eliminating or reducing the gap is lower. This is because as entitlement increases, the likelihood of having an income gap is reduced. For example, if a seasonal claimant is entitled to 35 weeks of regular benefits, the claimant only has to work for 17 weeks during the season to ensure a full 52 weeks of income (EI benefits and employment income).
This is confirmed through Figure 12 that shows that the effect of the pilot project on the likelihood of experiencing an income gap steadily decreased with the initial entitlement. At around 14 weeks of entitlement, the additional 5 weeks decreased the incidence of having an income gap by over 20 percentage points. However, the effect on the incidence drops to less than 10 percentage points at about 28 weeks.
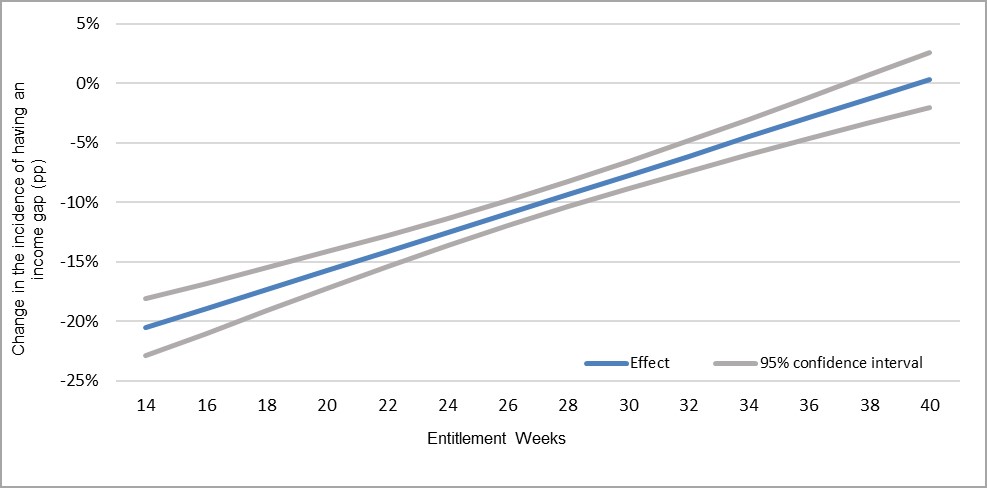
Text description of figure 12
| Entitlement weeks | Incidence of ‘gapping’ | 95% confidence interval (lower bound) | 95% confidence interval (upper bound) |
|---|---|---|---|
| 14 | -20.5% | -22.9% | -18.1% |
| 16 | -18.9% | -21.0% | -16.8% |
| 18 | -17.3% | -19.1% | -15.5% |
| 20 | -15.7% | -17.3% | -14.2% |
| 22 | -14.1% | -15.4% | -12.8% |
| 24 | -12.5% | -13.7% | -11.4% |
| 26 | -10.9% | -12.0% | -9.9% |
| 28 | -9.3% | -10.3% | -8.3% |
| 30 | -7.7% | -8.8% | -6.6% |
| 32 | -6.1% | -7.4% | -4.9% |
| 34 | -4.5% | -6.0% | -3.0% |
| 36 | -2.9% | -4.7% | -1.2% |
| 38 | -1.3% | -3.3% | 0.7% |
| 40 | 0.3% | -2.0% | 2.6% |
- Source: ESDC (2021). Annex A. Technical Report 2.
Furthermore, the figure shows that as entitlement approaches 37 weeks, the effect of the pilot on the likelihood of experiencing an income gap is insignificant. In other words, the additional weeks have no impact in terms of eliminating the gap for those who were entitled 37 weeks or more.
Exploratory analysis: alternative definitions for seasonal gappers
A seasonal claimant who experiences a recurring income gap— that is, a repeated seasonal gapper—may decide to take weeks without income within their EI claim or just before starting their claim. Certain gappers may prefer to more evenly spread out the number of weeks without income instead of having a long period without income at the end of their claim—that is, income smoothing. It may be possible that during the pilot project, these claimants used additional weeks to cover gaps at the start or within their claim, even if they were not identified as gappers as per the EI MAR definition. To account for these other types of income gaps, 2 alternative concepts were examined.
Alternative concept of an income gap—Claim Gap
The income Claim Gap is defined as the period after ‘Benefit Period Commencement (BPC) + EI Entitlement’ and before re-employment. The main difference of this alternate concept compared to the EI MAR definition is that all weeks without benefit and no employment income during the claim are considered as income gap weeks.
Timeline for identifying a claim gap (in chronological order):
- seasonal employment
- layoff
- period of unemployment
- start of EI claim and EI entitlement
- income gap
- re-employment
- seasonal employment resumes
Alternative concept of an income gap—Employment Gap
The Employment Gap is defined as the difference between the ‘Layoff + EI Entitlement’. The additional gap that this definition captures is the gap between the layoff and when the claim is established. The idea is that if ‘Layoff+ EI Entitlement’ is less than the period of unemployment (layoff to re-employment), then an individual faces a period of no income regardless of when the income gap occurred.
While this definition might not represent a ‘traditional’ seasonal gapper it does identify a group of seasonal claimants that could be impacted by the pilot project. For example, some claimants, who are anticipating an income gap at the end of their claim, may decide to take weeks without income at the beginning or during their claim. However, they may have resumed work earlier than expected without having exhausted their EI benefits. By providing additional weeks to this group of claimants, it may reduce the number of weeks of no income they face.
Timeline for identifying an employment gap (in chronological order):
- seasonal employment
- layoff
- period of unemployment
- layoff and EI entitlement
- income gap
- re-employment
- seasonal employment resumes
Impact analysis results
Using the same control and treatment group from Table 6, the impact analysis finds that Pilot Project 21 decreased the incidence of seasonal claimants with a Claim Gap by 8.1 percentage points and 8.0 percentage points for those with an Employment Gap.
Finding 6: Analysis points to the pilot project influencing subsequent work patterns of seasonal claimants who were eligible to additional weeks. Specifically, employment income decreased and benefit duration increased following the introduction of the pilot project, while total income remained unchanged
One issue that was identified in previous evaluations was the impact of providing additional weeks to seasonal non-gappers. Specifically, it increased the number of weeks of benefits used and reduced future employment (HRSDC 2010, ESDC 2016). When comparing claimants in targeted regions to those in non-targeted regions, both evaluations found an increased use of EI regular benefits among seasonal non-gappers. This resulted in more than 95% of total additional benefits being paid to non-gappers. The 2010 evaluation also found a decrease in future employment spell.
Figure 13 shows that when comparing new seasonal claimants to those claimants who just missed being seasonal in 2018 (same analysis as conducted in Finding #5), those who had an income gap in 2017 (previous gappers) had their claim open longer (4.4 weeks) and used an additional 3 weeks of regular benefits. While they did not experience a statistically significant change in the duration of their next employment spell, they did have a significant decrease in their employment income in 2019 compared to their level of income in 2017 (-$1,300).
Interestingly, there was no statistically significant reduction in total income, which suggests that the additional EI benefits used was substituted for employment income.
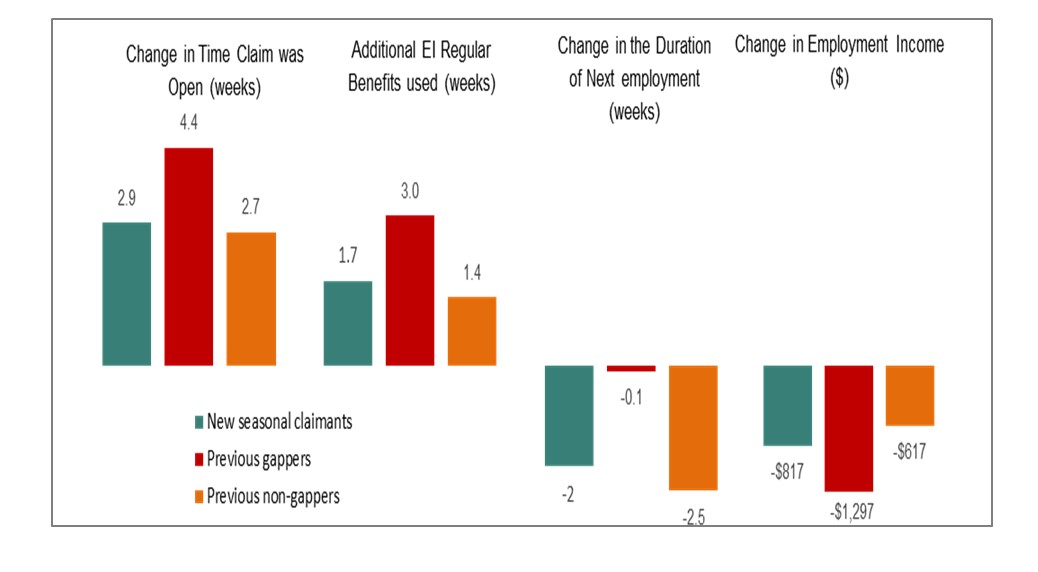
Text description of figure 13
| Variables | New seasonal claimants | Previous gappers (year before) | Previous non-gappers (year before) |
|---|---|---|---|
| Change in time claim was open (weeks) | 2.9 | 4.4 | 2.7 |
| Additional EI regular benefits used (weeks) | 1.7 | 3.0 | 1.4 |
| Change in the duration of next employment (weeks) | -2.0 | -0.1 | -2.5 |
| Change in employment income (dollars) | -817 | -1,297 | -617 |
- Source: ESDC (2021). Annex A. Technical Report 2.
When examining the impact of the pilot project on those new seasonal claimants in 2018 who did not have an income gap in 2017 (previous non-gappers), there was:
- an increase in weeks of benefit used (1.4 weeks)
- a reduction in the duration of their next employment spell by 2.5 weeks, and
- a decrease of about $600 in employment income
Similar to previous gappers, no impact was found on total income for previous non-gappers.
The impact on the income gap and the use of additional weeks appears to be linked to the industry of employment
When the impact analysis of comparing new seasonal claimants to those who just missed being eligible is broken down by industry there is a noticeable difference in the incidence of experiencing an income gap and the number of additional weeks of EI regular benefits used.
The pilot project led to a statistically significant reduction in the incidence of experiencing an income gap for new seasonal claimants working in 7 industries (Table 6). Relatedly, the pilot project led to a statistically significant increase in the number weeks of EI regular benefits used by claimants from these industries.
For new seasonal claimants working in 3 industries (Table 6), the pilot project led to a statistically significant increase in the usage of EI regular benefits (between 1.3 and 2.8 weeks). However, there was no statistically significant reduction in the incidence of experiencing an income gap.
| Industry | Incidence of an income gap (percentage points) |
Additional weeks used of EI regular benefits (weeks) |
|---|---|---|
| Arts, entertainment, and recreation | -0.191*** | 2.387*** |
| Accommodation and food Services | -0.164*** | 2.416*** |
| Public services | -0.107*** | 1.364** |
| Agriculture, forestry, fishing, and hunting | -0.0603** | 2.389*** |
| Retail and wholesale trade | -0.0750*** | 1.037** |
| Transport warehousing | -0.151*** | 1.353* |
| Administration and support, waste management services | -0.119*** | 1.285** |
| Construction | -0.0197 | 1.290*** |
| Manufacturing | -0.0233 | 2.176*** |
| Professional, scientific and technical services | 0.0938 | 2.751** |
- Note: * Significant at 90% ** Significant at 95%, *** Significant at 99%
- Source: ESDC (2021). Annex A. Technical Report 2.
Finding 7: Relative to previous pilot projects, Pilot Project No. 21 was more efficient at targeting seasonal gappers. Still, most of the additional weeks of benefits were paid to seasonal non-gappers
Building on the previous analysis which attributes specific impacts to the pilot project on benefit usage and work pattern of claimants, a preliminary costs analysis can be conducted. Given that the pilot project finished on September 25, 2021, data to inform the annual cost of the pilot was not available at the time of this evaluation. As such, a preliminary cost estimate is conducted to contextualize the ‘full’ cost implications of the pilot project, when factoring in behavioural effects.
In other words, for every dollar used by seasonal gappers (in additional weeks), what is the estimated cost associated with providing additional entitlement to seasonal non-gappers.
The analysis looked at 2 types of costs:
- total additional benefits paid as a result of the pilot project
- productivity loss due to reduced future employment
Analysis shows (Table 7) that the ‘full’ estimated cost per non-gapper is equal to $2,760—$650 in additional benefits and $2,110 as a result of reduced employment—while for seasonal gappers the ‘full’ estimated cost is $1,257 (See Annex E for a full breakdown of how the costs were calculated). As the impact analysis found, there was no impact on the duration of future employment for previous gappers, but there was a reduction of 2.5 weeks for previous non-gappers.
It should be noted that there are potentially other tangible and non-tangible costs and benefits that may be associated with the pilot project. For simplicity, the analysis was limited to the above mentioned costs.
| Regions | Additional Weeks of EI | Production loss | Total |
|---|---|---|---|
| Non-gappers in targeted regions | 650 | 2,110 | 2,760 |
| Gappers in targeted regions | 1,257 | 0 | 1,257 |
- Source: ESDC (2021). Annex A. Technical Report 2.
To estimate the costs associated with targeting an additional dollar of EI benefits to a seasonal gapper, figures presented in Table 7 for seasonal non-gappers are multiplied by 9.2. This reflects the fact that about 90% of seasonal claimants do not experience an income gap in any given year.
Overall, it is found that when the production loss is not included, for every $1 used by seasonal gappers to reduce their income gap, $4.8 is anticipated to be used by seasonal non-gappers in additional weeks of benefits. As a result, about 20% of total additional benefits are paid to seasonal gappers.
Conclusion and lessons learned
For a number of seasonal claimants, the amount of weeks of entitlement provided through the EI program is not sufficient to cover their off-season, leaving them with a period without income before the resumption of their seasonal employment—that is, seasonal gappers. To address this issue, Pilot Project No. 21 provided 5 additional weeks of regular benefits, up to a maximum entitlement of 45 weeks, to seasonal claimants who resided in 1 of the 13 targeted EI economic regions.
In contrast with previous pilot projects, Pilot Project No.21 sought to distinguish seasonal claimants from other EI regular claimants within the same region, based on their historical claiming pattern in the previous 5 years.
Overall, the evaluation provides evidence that the targeting mechanism is effective in identifying seasonal claimants with a frequent pattern of claiming EI. For this relatively small share of seasonal claimants (10%) the pilot project was found to have had a positive impact on eliminating or reducing the incidence of an income gap by over 7 percentage points. Still, seasonal non-gappers increased their use of EI regular benefits and decreased their next employment duration as a result of the additional weeks.
Based on these findings, the Evaluation Directorate notes the following lessons learned to the department:
- as evidence shows, any future permanent measure should take into account how sensitive the claiming pattern of an individual is to other temporary measures that affect the start and end date of a claim. As eligibility is based on the timing of when a claim is established, consideration could be given to other indicators which might better reflect seasonality than the timing of claim establishment
- as Pilot Project No. 21 showed, a more targeted mechanism for identifying seasonal claimants can reduce the cost of the measure while supporting seasonal claimants who experience an income gap. However, evidence suggest that even with the more targeted approach of Pilot Project No. 21, it is difficult to ensure that additional entitlement weeks are only being used by those who would otherwise face income gaps
- most seasonal claimants do not experience an income gap. In addition, findings suggest that a measure similar to Pilot Project No. 21 may influence the subsequent work and benefit claiming patterns of seasonal claimants by substituting earned income for EI benefits
Annexes
Annex A: Bibliography
Internal sources (not published, available upon request)
- Employment and Social Development Canada. (2022). “Supplementary Analysis on Employment Insurance and Seasonal Workers in Targeted Regions”
- Employment and Social Development Canada. (2021). “Literature Review: International Comparison of Seasonal Workers”.
- Employment and Social Development Canada. (2021). “Technical Report 1: Assessment of the Targeting Mechanism for Pilot Project No.21”.
- Employment and Social Development Canada. (2021). “Technical Report 2: Claimant Outcomes for Pilot Project No.21”.
- Gunderson, M. (2006). “Review of Research and Policy Literature on the Impacts of Employment Insurance Programs for Seasonal Workers”. Employment and Social Development Canada.
External sources
- Canada Gazette (2018): Regulations Amending the Employment Insurance Regulations (Pilot Project No. 21): SOR/2018-228.
- Employment and Social Development Canada (2016). “Evaluation of Initiatives to Extend EI Regular Benefits”.
- Employment and Social Development Canada (2021). “2019/2020 Employment Insurance Monitoring and Assessment Report”.
- Gray, D. & Leonard, P. (2020). “Mind the Gap: Running Out of Employment Insurance Benefits”. The Social Safety Net for Working-Age Adults. IRPP Study, No. 81.
- Human Resources and Skills Development Canada. (2010). “Evaluation of the Pilot Project to Extend Employment Insurance Benefits by Five Weeks: 2004-2009”.
Annex B: Data sources
The main analysis of this evaluation uses the Status Vector file for individuals who claimed EI regular or fishing benefits between the years 2018 and 2019. Due to data availability and the introduction of the Canada Emergency Response Benefit in March 2020, EI data for 2020 is excluded from the analysis. Additionally, the Social Insurance Masterfile is used to conduct analysis by age and gender. Finally, the Records of Employment (ROEs) were used to determine seasonal gappers.
The data sources used in this evaluation are as follows.
The Status Vector (SV) file
The SV file is derived from the main file used by Service Canada to deliver and administer the program. It contains information on the timing, duration and types of benefits paid during a claim. The Benefit Period Commencement (BPC) week, the week the claim started, is used to identify when an individual establishes a claim and allows for the classification of claims into quarters and/or years.
SIN master file
The SIN Masterfile is a registry of all Canadians with a Social Insurance Number, whereby all individuals are masked and non-identifiable. The variables used from this file include the date of birth (to determine age) and gender.
Record of employment
The records of employment (ROEs) contain all reported interruptions of earnings/work. The ROE includes information related to the first and last day worked, hours of insurable employment, insurable earnings, and the employer. The ROEs and SV file are used to identify the population of seasonal gappers. Seasonal gappers are seasonal claimants that had a period without income following the exhaustion of a claim and before the beginning of their next employment.
Annex C: Variable entrance requirement and entitlement table and variable best weeks
| Number of hours of insurable employment in the qualifying period | 6% and under | More than 6% but not more than 7% | More than 7% but not more than 8% | More than 8% but not more than 9% | More than 9% but not more than 10% | More than 10% but not more than 11% | More than 11% but not more than 12% | More than 12% but not more than 13% | More than 13% but not more than 14% | More than 14% but not more than 15% | More than 15% but not more than 16% | More than 16% |
|---|---|---|---|---|---|---|---|---|---|---|---|---|
| 420 to 454 | 0 | 0 | 0 | 0 | 0 | 0 | 0 | 0 | 26 | 28 | 30 | 32 |
| 455 to 489 | 0 | 0 | 0 | 0 | 0 | 0 | 0 | 24 | 26 | 28 | 30 | 32 |
| 490 to 524 | 0 | 0 | 0 | 0 | 0 | 0 | 23 | 25 | 27 | 29 | 31 | 33 |
| 525 to 559 | 0 | 0 | 0 | 0 | 0 | 21 | 23 | 25 | 27 | 29 | 31 | 33 |
| 560 to 594 | 0 | 0 | 0 | 0 | 20 | 22 | 24 | 26 | 28 | 30 | 32 | 34 |
| 595 to 629 | 0 | 0 | 0 | 18 | 20 | 22 | 24 | 26 | 28 | 30 | 32 | 34 |
| 630 to 664 | 0 | 0 | 17 | 19 | 21 | 23 | 25 | 27 | 29 | 31 | 33 | 35 |
| 665 to 699 | 0 | 15 | 17 | 19 | 21 | 23 | 25 | 27 | 29 | 31 | 33 | 35 |
| 700 to 734 | 14 | 16 | 18 | 20 | 22 | 24 | 26 | 28 | 30 | 32 | 34 | 36 |
| 735 to 769 | 14 | 16 | 18 | 20 | 22 | 24 | 26 | 28 | 30 | 32 | 34 | 36 |
| 770 to 804 | 15 | 17 | 19 | 21 | 23 | 25 | 27 | 29 | 31 | 33 | 35 | 37 |
| 805 to 839 | 15 | 17 | 19 | 21 | 23 | 25 | 27 | 29 | 31 | 33 | 35 | 37 |
| 840 to 874 | 16 | 18 | 20 | 22 | 24 | 26 | 28 | 30 | 32 | 34 | 36 | 38 |
| 875 to 909 | 16 | 18 | 20 | 22 | 24 | 26 | 28 | 30 | 32 | 34 | 36 | 38 |
| 910 to 944 | 17 | 19 | 21 | 23 | 25 | 27 | 29 | 31 | 33 | 35 | 37 | 39 |
| 945 to 979 | 17 | 19 | 21 | 23 | 25 | 27 | 29 | 31 | 33 | 35 | 37 | 39 |
| 980 to 1014 | 18 | 20 | 22 | 24 | 26 | 28 | 30 | 32 | 34 | 36 | 38 | 40 |
| 1015 to 1049 | 18 | 20 | 22 | 24 | 26 | 28 | 30 | 32 | 34 | 36 | 38 | 40 |
| 1050 to 1084 | 19 | 21 | 23 | 25 | 27 | 29 | 31 | 33 | 35 | 37 | 39 | 41 |
| 1085 to 1119 | 19 | 21 | 23 | 25 | 27 | 29 | 31 | 33 | 35 | 37 | 39 | 41 |
| 1120 to 1154 | 20 | 22 | 24 | 26 | 28 | 30 | 32 | 34 | 36 | 38 | 40 | 42 |
| 1155 to 1189 | 20 | 22 | 24 | 26 | 28 | 30 | 32 | 34 | 36 | 38 | 40 | 42 |
| 1190 to 1224 | 21 | 23 | 25 | 27 | 29 | 31 | 33 | 35 | 37 | 39 | 41 | 43 |
| 1225 to 1259 | 21 | 23 | 25 | 27 | 29 | 31 | 33 | 35 | 37 | 39 | 41 | 43 |
| 1260 to 1294 | 22 | 24 | 26 | 28 | 30 | 32 | 34 | 36 | 38 | 40 | 42 | 44 |
| 1295 to 1329 | 22 | 24 | 26 | 28 | 30 | 32 | 34 | 36 | 38 | 40 | 42 | 44 |
| 1330 to 1364 | 23 | 25 | 27 | 29 | 31 | 33 | 35 | 37 | 39 | 41 | 43 | 45 |
| 1365 to 1399 | 23 | 25 | 27 | 29 | 31 | 33 | 35 | 37 | 39 | 41 | 43 | 45 |
| 1400 to 1434 | 24 | 26 | 28 | 30 | 32 | 34 | 36 | 38 | 40 | 42 | 44 | 45 |
| 1435 to 1469 | 25 | 27 | 29 | 31 | 33 | 35 | 37 | 39 | 41 | 43 | 45 | 45 |
| 1470 to 1504 | 26 | 28 | 30 | 32 | 34 | 36 | 38 | 40 | 42 | 44 | 45 | 45 |
| 1505 to 1539 | 27 | 29 | 31 | 33 | 35 | 37 | 39 | 41 | 43 | 45 | 45 | 45 |
| 1540 to 1574 | 28 | 30 | 32 | 34 | 36 | 38 | 40 | 42 | 44 | 45 | 45 | 45 |
| 1575 to 1609 | 29 | 31 | 33 | 35 | 37 | 39 | 42 | 43 | 45 | 45 | 45 | 45 |
| 1610 to 1644 | 30 | 32 | 34 | 36 | 38 | 40 | 42 | 44 | 45 | 45 | 45 | 45 |
| 1645 to 1679 | 31 | 33 | 35 | 37 | 39 | 41 | 43 | 45 | 45 | 45 | 45 | 45 |
| 1680 to 1714 | 32 | 34 | 36 | 38 | 40 | 42 | 44 | 45 | 45 | 45 | 45 | 45 |
| 1715 to 1749 | 33 | 35 | 37 | 39 | 41 | 43 | 45 | 45 | 45 | 45 | 45 | 45 |
| 1750 to 1784 | 34 | 36 | 38 | 40 | 42 | 44 | 45 | 45 | 45 | 45 | 45 | 45 |
| 1785 to 1819 | 35 | 37 | 39 | 41 | 43 | 45 | 45 | 45 | 45 | 45 | 45 | 45 |
| 1820 and more | 36 | 38 | 40 | 42 | 44 | 45 | 45 | 45 | 45 | 45 | 45 | 45 |
Variable best weeks
EI benefits are calculated using an individual’s highest weeks of earnings within the past 52 weeks or since their last claim, whichever is shorter. This ensures that the rate of benefits that are paid is based on their “best weeks” of earnings.
Depending on the regional unemployment rate, the calculation of the weekly benefit rate uses between 14 and 22 weeks. Any weeks of lower earnings in excess of the number of best weeks are not used.
| Regional rate of unemployment | Required weeks |
|---|---|
| 6% or less | 22 |
| 6.1% to 7% | 21 |
| 7.1% to 8% | 20 |
| 8.1% to 9% | 19 |
| 9.1% to 10% | 18 |
| 10.1% to 11% | 17 |
| 11.1% to 12% | 16 |
| 12.1% to 13% | 15 |
| 13.1% or more | 14 |
Annex D: Impact analysis—sensitivity analysis
Two other groups were used to test the robustness of the main results: all seasonal claimants in targeted regions versus non-targeted regions, and periodic claimants (a claimant that is not claiming on a consistent basis year after year).
For analysis at the regional level the following 3 control groups were constructed:
- regions on the margin of eligibility: Altering the regional targeting criteria—decreasing the regional share of seasonal claims per labour force participants and the regional unemployment rate by 1 percentage point—would capture 4 additional EI regions into the pilot. These regions are:
- (12) Trois-Rivières
- (15) Montérégie
- (23) Eastern Ontario, and
- (34) Huron
- regional proximity: Comparing the closest non-targeted regions with the targeted regions. The closest non-targeted regions identified are:
- St. John’s (01)
- Halifax (06)
- Fredericton-Moncton-Saint John (07)
- all regions: targeted regions are compared with all non-targeted regions
Newfoundland-Labrador is the only EI region where claimants could have received additional benefits from the EI commodity-base price measure and the Pilot Project 21 (not at the same time). In other words, the period before Pilot Project 21 was significantly different in Newfoundland-Labrador compared to regions that were not part of the commodity-base measure (that is, parallel trend assumption not satisfied). Likewise, the analysis excludes the other 14 non-targeted regions which were included as part of the commodity-based price measure when regions are analyzed.
For periodic claimants, the control and treatment group are as follows.
Control group: EI regular benefit claimants (between August and December 2018) who had 2 regular or fishing claims in years 3, 4 or 5 before their 2018 claim (with only one occurring around the same time of year as the 2018 reference claim). However, even if they had no regular or fishing claims occurring around the same time of year in years 1 and 2 prior to the reference claim, it is possible they could still have claimed during these years (just not in a seasonal pattern).
Treatment group: EI regular benefit claimants (between August and December 2018) who had 3 regular or fishing claims in years 3, 4 or 5 before their 2018 claim (with both occurring around the same time of year as the 2018 claim). However, they had no other regular or fishing claims within the past 5 years that occurred around the same time of year as their reference claim. Similar to the control group, it is possible that they claimed in the 2 years prior to reference claim, just not at the same time.
The results when using the regions to define access to the pilot project are close to those from the main analysis and can be considered to corroborate the previous findings using the new seasonal approach. The impact on the duration of next employment is negative but smaller. However, when using only regions in close proximity to targeted regions, the duration of the next employment further decreased.
For periodic claimants, the results are less similar to new seasonal claimants. This is to be expected as they are not working in a seasonal pattern year over year. Results show that claim duration and the number of weeks of regular benefit used increased. However, since periodic claimants are likely to have a working pattern that does not lead to a seasonal income gap, the pilot has no impact on the duration of their income gaps or their next employment duration. Furthermore, they were found to increase the weeks of benefits used before returning back to employment.
| Variables | All regions | Regions on the margin | Regions in proximity | Periodic Seasonal claimants |
|---|---|---|---|---|
| Incidence of EI MAR gap (percentage point) | -6.5*** | -7.2*** | -7.7*** | -5.3*** |
| Incidence of Claim gap (percentage point) | -8.0*** | -8.3*** | -8.8*** | -6.0*** |
| Incidence of Employment gap(percentage point) | -6.8*** | -6.8*** | -8.7*** | -6.2*** |
| EI MAR gap duration (weeks) | -2.73*** | -2.96*** | -2.56*** | -0.42 |
| Claim gap duration (weeks) | -2.79*** | -3.02*** | -2.97*** | 0.19 |
| Employment gap duration (weeks) | -2.49*** | -2.92*** | -2.85*** | 0.17 |
| Claim duration (weeks) | 2.72*** | 3.17*** | 2.84*** | 3.36*** |
| Regular benefits (weeks) | 1.49*** | 1.76*** | 1.26*** | 1.80*** |
| Exhaustion rate (percentage point) | -13.6*** | -13.1*** | -15.3*** | -9.6*** |
| Next employment duration | -0.36*** | -0.33* | -0.58** | -0.53 |
| Probability of claiming again (percentage point) | 4.4*** | 3.3 | 4.4*** | 3.1* |
| Observations | 354,202 | 178,649 | 163,048 | 14,667 |
- Note: ** Significant at 95%, *** Significant at 99%
- Source: ESDC (2021). Annex A. Technical Report 2.
Annex E: Methodology for costing analysis
Seasonal non-gappers
The cost of Pilot 21 incurred by seasonal non-gappers can be divided into 2 parts:
- total additional benefits paid as a result of Pilot 21
- production loss due to reduced employment of non-gappers in their next employment (behavioural change)
The cost of additional weeks is computed based on the impact analysis. Particularly, the cost of additional weeks amounts to $650, which is the product of the number of additional weeks used (1.4 weeks) and the average weekly benefit for non-gappers ($464). The production loss per non-gapper is estimated to be equal to $2,110, which is computed by multiplying the average reduction in next employment duration of non-gappers (2.5 weeks) by their average weekly insurable earnings ($844). Average weekly insurable earnings are computed from the weekly benefit amount, which represents 55% of their average weekly insurable earnings. However, since the maximum weekly benefit and maximum weekly insurable earnings for an individual were was capped at $547 and $994, respectively, in 2018, the weekly employment loss likely underestimates the real employment loss for non-gappers.
When adding both the additional weeks paid to non-gappers and the production loss, a total cost per non-gapper is found to be $2,760. This means that the production loss is much higher ($2,110) than the cost of the increased usage of regular benefits ($650). For simplicity, it is assumed that there are no additional negative effects of receiving the additional entitlement weeks—for example, lower entitlement or higher usage of weeks of benefits during the next claim or increase incidence of claiming again.
Seasonal gappers
The average cost of providing additional weeks to gappers is computed by multiplying the impact on weeks of regular benefits used (3.0 weeks) and the average weekly benefit ($419). Therefore, the total cost of providing benefits received to gappers amounts to $1,257.
The effect of additional weeks on the next employment of gappers was not significant, therefore no production loss is assumed for gappers.
Annex F: Machine learning
Machine learning is a modeling technique used to predict outcomes. Firstly, relevant explanatory variables and the desired outcome form a dataset. Secondly, structures of the model are chosen—that is, the number of layers and number of nodes per layer.
No clear guideline exists on the correct structure of the model. In general, as the number of explanatory variables increases, more nodes are required at each layer to account for the exponential increase in potential interactions between the variables. However, the exact structure has to be determined by trial and error.
Thirdly, a portion of the dataset is used to train the model. In other words, the model makes a prediction, compares its estimation to the actual outcome and then adjusts its parameters accordingly. Finally, the remaining unused data are used as a validation dataset to properly check the accuracy of the model.
In the case where the probability of positive outcome is low, the training dataset must contain a high proportion of seasonal gappers to be trained properly. To do this a randomly selected negative outcomes is used so that the number of gappers is half of the training sample.
The following table presents the explanatory variable used to predict the probability of having an income gap.
| Variable | Type (number of variables) |
|---|---|
| Gender | Binary |
| Industry | Binary (21) |
| Age | Integer |
| Entitlement | Integer |
| Insurable Hours | Integer |
| Benefit Rate | Integer |
| Month | Binary (12) |
| Previous gap to 1 year | Binary |
| Previous gap to 2 years | Binary |
| Previous gap to 3 years | Binary |
| Previous gap to 4 years | Binary |
| Previous gap to 5 years | Binary |
| EI region | Binary (58) |