
Evaluation of the Employment Equity Programs
On this page
Alternate format

Evaluation of the Employment Equity Programs - Final Report - March 2019 [PDF - 900 KB]
Large print, braille, MP3 (audio), e-text and DAISY formats are available on demand by ordering online or calling 1 800 O-Canada (1-800-622-6232). If you use a teletypewriter (TTY), call 1-800-926-9105.
Highlights
Evaluation purpose and scope
This evaluation examines the relevance and performance of the Legislated Employment Equity Program; the Federal Contractors Program; and the Workplace Opportunities Program. They are administered by the Labour Program.
These programs support the Employment Equity Act by improving workplace equity outcomes for the four designated groups in the federally regulated private-sector and provincially regulated employers that contract with the Federal government. The designated groups include: women, Indigenous peoples, persons with disabilities and members of visible minorities.
The evaluation covers fiscal years 2011-2012 to 2015-2016 and complies with the 2016 Treasury Board Policy on Results as well as with Federal Administration Act requirements.
Achieving equitable representation
Since the development of the Employment Equity Act (1986), employers have made progress towards achieving a representative workforce. For example, representation of each designated group had increased substantially by 2015-2016.
Program activities contributed to this outcome by:
- developing guidance materials to assist employers in undertaking a systematic review of their employment policies and practices;
- offering one-on-one support to employers seeking to understand their obligations under the Act; and
- providing timely notifications and advice to support employer reporting on employment equity.
Despite these advancements, members of visible minorities were the only designated group to reach levels of labour market availabilityFootnote 1 (LMA) by 2015-2016 in Canada.
Overall, women earned lower salaries than men across all the designated groups. For example, there was a sizeable gap (approx. 15%) in earnings between men and women in the top salary range ($60,000 and above) in 2015.
The salary gap was more pronounced among Indigenous women in that year. For example, there were 9.1% fewer Indigenous women making $60,000 compared to all women at that salary range, and 24.4% fewer than all men.
Earnings were also substantially lower for women with disabilities in 2015. In particular, there were 3.6% fewer women with disabilities making $60,000 compared to all women at that salary range, and 18.9% fewer than all men.
Effectiveness of program supports
Evidence from the employer and contractor survey (in 2017) indicate that the vast majority of employers understood their employment equity obligations under the Act. This was supported by program activities, such as providing employers with information that clearly articulates their obligations.
Key informants reported that awareness of employment equity obligations may be greater among human resource administrators and managers. Therefore, smaller companies with no human resource department or staff may require greater support from the program.
Administrative data suggests that the approach to ensuring reporting on employment equity has been successful, with 100% of employer reports submitted on time. Activities that supported reporting included routine employer notifications in advance of reporting deadlines; new tracking mechanisms to promote coordination; and direct telephone follow-up.
Observations for program improvement
This evaluation does not make specific recommendations. However, it offers observations for program development in three main areas:
- re-examining definitions of the designated groups
- the need for greater capacity/resources
- enhancing performance measurement and access to information for the next evaluation
Background
Evaluation scope and purpose
This evaluation examines the relevance and performance of the following programs administered by the Labour Program’s Workplace Equity Division:
- the Legislated Employment Equity Program
- the Federal Contractors Program
- the Workplace Opportunities: Removing Barriers to Equity grants and contributions Program
The evaluation covers fiscal years 2011-2012 to 2015-2016 and complies with the 2016 Treasury Board Policy on Results as well as Federal Administration Act requirements for an evaluation of Workplace Opportunities by July 31, 2019.
Program description
The Labour Program supports the objectives of the Employment Equity Act in creating equitable employment opportunities and correcting social disadvantages experienced by four designated groupsFootnote 2.
The Act applies to the federally regulated private-sector (for example banking, communications, transportation, and ‘other’Footnote 3 sectors), and provincially regulated employers that contract with the Federal government, comprising approximately 8% of the Canadian workforce.
The Labour Program also ensures that federally regulated private-sector employers meet their legislated reporting obligations, and provincially regulated private-sector employers comply with the requirements of the Federal Contractors Program.
Key Findings
Progress towards achieving a representative workforce
As shown in Table 1, increases in representation have occurred for all four designated groups since the Act was implemented in the mid-1980s.
For example, while still low, labour market representation has almost doubled for persons with disabilities between 1987 to 2015, increasing from 1.6% to 3.0%.
Similarly, labour market representation has more than tripled for Indigenous peoples during this period, increasing from 0.7% in 1987 to 2.2% in 2015.
Members of visible minorities are the only designated group whose representation rate in 2015 (21.2%) exceeded its labour market availability (17.8%). However, there continues to be underrepresentation of visible minorities in certain sectors (in other words, transportation and “other”)Footnote 4 (not shown in Table 1).
Women’s labour market representation had not yet reached labour market availability by 2015, and levels of representation remained relatively stable from 1987 (40.9%) to 2015 (41.0%).
| Designated group | Labour market representation | Labourmarket availability | |
|---|---|---|---|
| 1987 | 2015 | 2011 to 2012 | |
| Women | 40.9% | 41.0% | 48.2% |
| Persons with disabilities | 1.6% | 3.0% | 4.9% |
| Indigenous peoples | 0.7% | 2.2% | 3.5% |
| Visible minorities | 5.0% | 21.2% | 17.8% |
Data sources: Employment Equity Annual Report, 2016 (ESDC); National Household Survey, 2011; Canadian Survey on Disability, 2012 (Statistics Canada).
Inequalities persist in the labour market
As shown in Table 2, women received lower wages than men on average in 2015. For example, there was a 15.3% gap in earnings between men (59.8%) and women (44.5%) in the top salary range ($60,000 and above). In the lowest salary range (below $50,000), there was a 12.7% gap between men (22.9%) and women (35.6%).
Importantly, the wage gap was even greater for women who belonged to more than one designated group. For example, Indigenous women (43.7%) represented a 20.8% larger share of the workforce in the lowest salary range (below $50,000), compared to all men (22.9%).
| Salary range | All | Indigenous peoples | Persons with disabilities | Visible minorities | ||||
|---|---|---|---|---|---|---|---|---|
| Men | Women | Men | Women | Men | Women | Men | Women | |
| $60,000 and above | 59.8% | 44.5% | 57.5% | 35.4% | 56.3% | 40.9% | 55.3% | 43.7% |
| $50,000 to $59,999 | 17.3% | 19.9% | 16.8% | 20.8% | 19.1% | 22.3% | 16.4% | 18.2% |
| Below $50,000 | 22.9% | 35.6% | 25.7% | 43.7% | 24.6% | 36.8% | 28.3% | 38.1% |
Data source: Employment Equity Annual Report 2016, Legislated Employment Equity data (ESDC).
Further analysis not shown above revealed that inequalities persisted in the types of jobs occupied by the designated groups, even where representation exceeded labour market availability overall.
Key examples of inequalities that persisted in 2015 include:
- Women only earned $0.87 for every dollar earned by men on averageFootnote 5.
- Representation of Indigenous peoples was below labour market availability for all job categories (with the exception of manual labourers). This was the most pronounced at the highest levels of management (See Annex E, Figure 6).
- Persons with disabilities were underrepresented in every occupation, and this underrepresentation was particularly pronounced at the supervisory levels (See Annex E, Figure 7).
Visible minorities were the exception. They showed increased representation in many occupation types, and exceeded labour market availability in the relatively higher paying middle management and professional categories (See Annex E, Figure 8).
Clients are highly satisfied with available supports
As shown in Figure 1, survey results indicate that employers and contractors were predominantly satisfied with available supports in 2017. Only 9% of respondents reported any level of dissatisfaction.
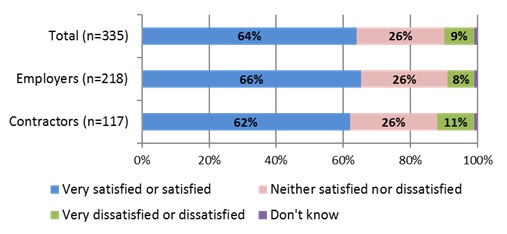
Figure 1 – Text version
| Respondents | Satisfaction | |||
|---|---|---|---|---|
| Very satisfied or satisfied | Neither satisfied nor dissatisfied | Very dissatisfied or dissatisfied | Don’t know | |
| Employers (n=218) | 66% | 26% | 8% | 0 |
| Contractors (n=117) | 62% | 26% | 11% | 1% |
| Total (n=335) | 64% | 26% | 9% | 1% |
Data source: Employer and Contractor Survey, ESDC, 2017.
Further analyses not shown above revealed that most Labour Program recipients have accessed available tools, yet there is room for improvement in terms of uptake, for example:
- certain tools were favoured over others, such as templates and guides
- less than 60% of Federal Contractors Program respondents used the tools and materials directly intended for them, with the exception of the goal setting tools
Direct assistance from the Labour Program was only accessed by 63% of the Federal Contractors Program respondents, and nearly half (49%) of Legislated Employment Equity Program respondents.
Employer and contractor interviewees noted potential ways to increase usage, such as improvements to the website, and streamlining and emphasizing content to aid the user.
Employers are aware and comply with their reporting obligations
As shown in Figure 2, the employer and contractor survey indicated that most respondents (70%) had high or very high levels of understanding of the Act and their employment equity obligations under it in 2017. Another 26% of respondents reported moderate levels of understanding.
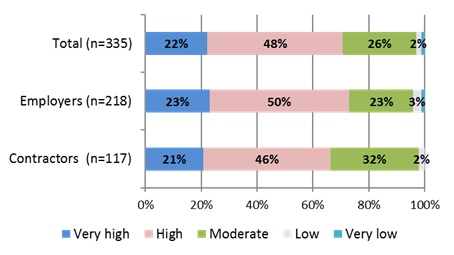
Figure 2 – Text version
| Respondents | Understanding of obligations | ||||
|---|---|---|---|---|---|
| Very high | High | Moderate | Low | Very low | |
| Employers (n=218) | 23% | 50% | 23% | 3% | 1% |
| Contractors (n=117) | 21% | 46% | 32% | 1% | 0% |
| Total (n=335) | 22% | 48% | 26% | 2% | 2% |
Data source: Employer and Contractor Survey, ESDC, 2017.
Additional findings from employer and contractor key informants, indicated that awareness may be concentrated in senior or managerial levels and among human resources staff. Companies with no human resource department or staff may have less understanding of their obligations, and may thus require greater support.
In terms of reporting, administrative data revealed that employers and contractors met their employment equity obligations. Compliance procedures for the Legislated Employment Equity Program were effective, with 100% of files successfully closed.
Federal Contractors Program compliance assessments were required to occur within 18 months of the start of the contracts. Ultimately, there was 100% compliance with reporting by contractors, based on the administrative data reviewed.
Importantly, compliance procedures focused on report completion rather than organizations’ substantive progress or improvement in employment equity.
Key informants within the federal government in 2017 considered the Labour Program’s approach to enforcement to be collegial and collaborative. They consider that this promotes compliance without having to resort to using the administrative monetary penalties under the Act.
Key informants external to the federal government considered in 2017 that the enforcement mechanisms ineffectual due to their focus being predominantly placed on submission of annual reports, as opposed to being focused on meeting representation targets.
Expert key informants indicated in 2017 that employers and contractors are underperforming in terms of having proper representation of designated groups within their organizations. They suggested:
- creating a tool to help companies develop a business case for employment equity, which demonstrates cost-effective approaches, while highlighting the benefit of employment equity to senior management
- adding a legislative requirement that employers spend a certain percentage of their budgets on employment equity
- strengthening staffing for Employment Equity Program operational personnel to enable them to contact employers more frequently
Barriers to employment equity still need to be addressed
As shown in Figure 3, only 52% of employers and contractors surveyed in 2017 reported minor or no challenges in meeting reporting requirements or in collecting, analyzing, and reviewing human resource policies and practices.
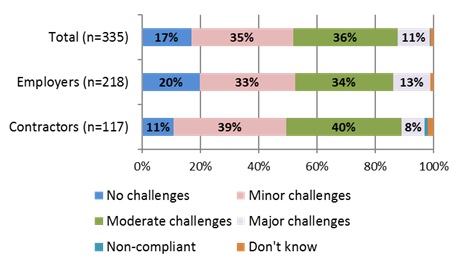
Figure 3 – Text version
| Respondents | Identifying barriers and implementing measures | |||||
|---|---|---|---|---|---|---|
| No challenges | Minor challenges | Moderate challenges | Major challenges | Non-compliant | Don’t know | |
| Employers (n=218) | 20% | 33% | 34% | 13% | 0% | 0% |
| Contractors (n=117) | 11% | 39% | 40% | 8% | 1% | 1% |
| Total (n=335) | 17% | 35% | 36% | 11% | 0% | 1% |
Data source: Employer and Contractor Survey, ESDC, 2017.
In key informant interviews, employers and contractors reported specific barriers to employment equity, such as:
- biases/discriminatory assumptions
- the nature of certain types of work
- a lack of openness in the hiring process
- structural factors that limited educational opportunities
- a lack of recognition of education, skills and qualifications
Key informants expressed the need for more information regarding best practices for removing barriers, specifically relevant to their organizational contexts.
Communication and cooperation with government agencies and stakeholders is improving
Communication and cooperation with stakeholders, including the Canadian Human Rights Commission, contracting departments, and other governmental stakeholders, was considered adequate to support the Program, according to key informant interviews.
However, Labour Program officials noted that receiving information from the Commission on completed audits would be very useful to inform programming design and development.
It was noted by both Labour Program and Commission key informants that the relationship between the Labour Program and the Commission is improving and that roles and responsibilities are becoming clearer.
However, all employer organizations reported limited collaboration and communication between the Labour Program and their organizations (in other words, one or a few times per year) and that more would be beneficial.
Suggestions for improving communication with the Labour Program from employer organizations related predominantly to wanting increased provision of telephone contact and access.
The workplace opportunities program facilitated information sharing with employers
The Workplace Opportunities was initiated near the end of the evaluation period (2014 to 2015) and focused on building employer capacity to hire and retain designated group employees.
Given that few projects had been completed by the time the evaluation was undertaken, it was challenging to measure changes in employers’ capacity.
However, early results indicate that three of the nine grants and contributions projects had been completed by 2015 to 2016, with the remainder on track to achieve expected results.
Key informant funding recipients reported that the projects facilitated opportunities for employers and stakeholders to engage in dialogue and exchanges regarding employment equity, diversity, and inclusion.
Program activities also enabled information sharing, raising awareness of barriers by connecting employers to designated group members and advocates, and providing content to support the development of tools and resources.
Particular examples of promising tools and resources developed by the Program through Workplace Opportunities and documented by administrative data include:
- production of a marketing video
- technical assistance to individual employers
- workshops engaging wide ranges of stakeholders
- a comprehensive recruitment framework
- the development of business cases
- presentation models
- tools for corporate change and partnership building, among others
Evidence suggests improvements in efficiency and effectiveness
Based on interviews with Program officials, a number of strategies were undertaken to improve services between 2011 to 2012 to 2015 to 2016, such as:
- offering more resources online
- developing templates
- using internal resources to develop materials and databases and the development of a performance measurement strategy in 2015
Program officials noted that they are delivering the Employment Equity Programs with fewer resources than in the past, which provides anecdotal evidence of cost-effectiveness.
The document and literature review identified evidence of measures taken to improve efficiency and effectiveness during the evaluation period such as:
- simplifying the Employment Equity Program reporting process
- streamlining the Minister’s annual reports to parliament
However, the changes the Labour Program underwent as well as the absence of a performance measurement framework and relevant financial data earlier in the evaluation period made it problematic to assess cost-effectiveness.
Strong alignment with government priorities
The Programs were found to align with the Government of Canada priorities in several ways, including by
- contributing to fair and inclusive workplaces
- supporting federal government priorities related to diversity as a Canadian value
- contributing to workforce participation of the four designated groups
- addressing the ESDC departmental strategic outcomes of “safe, fair, and productive workplaces and cooperative workplace relations”
- promoting more equitable job outcomes in the federally regulated sector and the broader Canadian context
Observations for program development
- Enhance performance measurement in the next program cycle. In the current cycle, initially there was a lack of:
- a performance measurement strategy
- administrative data to assess cost-effectiveness of program delivery
- access to recent audits conducted by the Canadian Human Rights Commission
- The Labour Program should be given access to audit reports produced by Canadian Human Rights Commission. This would provide them with valuable information to meaningfully inform program planning, such as:
- measures taken by Legislated Employment Equity Program employers to implement employment equity
- results achieved
- consultations undertaken
- Revisit and expand definitions of the designated groups according to recent labour market trends and the criteria set out in the Act. In particular, explore the possible inclusion of:
- LGBTQ2+
- older and younger workers, veterans
- immigrants as designated groups
- Finally, there is a need for greater capacity/resources to enable the Labour Program to conduct research, and to promote and foster public awareness and understanding of the purpose of the Act.
Annexes
Annex A – Text version
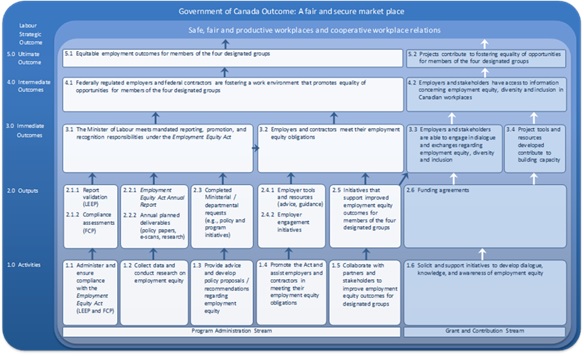
Annex A presents the program logic model for the Employment Equity Programs and Workplace Opportunities, which outlines the following activities, outputs, immediate outcomes, intermediate outcomes, and ultimate outcomes for both the program administration stream and the grant and contribution stream.
Activities:
- administer and ensure compliance with the Employment Equity Act (LEEP and FCP)
- collect data and conduct research on employment equity
- provide advice and develop policy proposals / recommendations regarding employment equity
- promote the Act and assist employers and contractors in meeting their employment equity obligations
- collaborate with partners and stakeholders to improve employment equity outcomes for designated groups
- solicit and support initiatives to develop dialogue, knowledge, and awareness of employment equity
The activities are intended to produce the outputs.
Outputs:
- report validation (LEEP)
- compliance assessments (FCP)
- employment Equity Act Annual Report
- annual planned deliverables (policy papers, e-scans, research)
- completed Ministerial / departmental requests (for example policy and program initiatives)
- employer tools and resources (advice, guidance)
- employer engagement initiatives
- initiatives that support improved employment equity outcomes for members of the four designated groups
- funding agreements
The outputs are intended to produce immediate outcomes.
Immediate outcomes:
- the Minister of Labour meets mandated reporting, promotion, and recognition responsibilities under the Employment Equity Act
- employers and contractors meet their employment equity obligations
- employers and stakeholders are able to engage in dialogue and exchanges regarding employment equity, diversity and inclusion
- project tools and resources developed contribute to building capacity
The immediate outcomes are expected to contribute to the intermediate outcomes.
Intermediate outcomes:
- federally regulated employers and federal contractors are fostering a work environment that promotes equality of opportunities for members of the four designated groups
- employers and stakeholders have access to information concerning employment equity, diversity and inclusion in Canadian workplaces
The intermediate outcomes are expected to contribute to ultimate outcomes.
Ultimate outcomes:
- equitable employment outcomes for members of the four designated groups
- projects contribute to fostering equality of opportunities for members of the four designated groups
Annex B: Methodology
Four lines of evidence informed the current evaluation:
- document and literature review.
- administrative data review, which involved analysis of two key datasets administered by the Workplace Equity Division: the Legislated Employment Equity Program data and Federal Contractors Program Access database.
- employer and contractor study involving both key informant interviews and a survey.
- the employer and contractor study focused on employers covered by the Legislated Employment Equity Program (n=9) and Federal Contractors Program (n=4). Key informants were selected based on: size of company, sector and geography. The study also included a survey with Legislated Employment Equity Program employers and Federal Contractors Program contractors (n=335). The response rate for employers was 48% (n=218) and for contractors it was 43% (n=117).
- key informant interviews (n=31) were conducted with a wide range of Program stakeholders (Table 3).
| Key informant category | # of key informants |
|---|---|
| EEP program officials | 5 |
| Contracting departments | 3 |
| Inter- and intra-departmental organizations | 4 |
| LEEP or FCP employer or employee associations | 3 |
| Canadian Human Rights Commission auditors | 3 |
| Employment equity experts | 5 |
| WORBE funding recipients | 8 |
| Total | 31 |
Annex C: Evaluation Questions
Relevance
1. To what extent is the Program needed to address employment equity for the four designated groups? Are the programs aligned with Government of Canada priorities?
- 1.1 Extent to which persons in the designated groups are underrepresented in workplaces covered by the Program.
- 1.2 Evidence that the objectives of the Program are in line with federal government priorities.
Performance
2. To what extent do educational tools, promotional materials, and support to employers contribute to compliance with the Employment Equity Act?
- 2.1 Extent to which federally regulated private-sector employers and contractors are reached by program activities.
- 2.2 Evidence that the Program has supported the Minister of Labour in meeting its mandated reporting, promotion, and recognition responsibilities under the Employment Equity Act.
- 2.3 Material and support are clear, accessible, used and responsive to the needs of employers and contractors.
- 2.4 Evidence that employers and contractors are meeting their employment equity obligations.
- 2.5 Evidence that the Program contribute to employers’ and contractors’ awareness and understanding of the Employment Equity Act.
- 2.6 Evidence that the Program is contributing to federally regulated employers and contractors fostering a work environment that promotes equality of opportunities for members of the four designated groups, by sector.
3. To what extent does the use of mechanisms of enforcement help to correct and/or prevent non-reporting?
- 3.1 Percentage of employment equity reports that are compliant with the requirements of the Employment Equity Act, by fiscal year, by sector (Legislated Employment Equity Program)
- 3.2. Percentage of required compliance assessments completed within six months of initiation, by fiscal year. (Federal Contractors Program)
- 3.3 Percentage of compliance assessments that are found to be either compliant or non-compliant. (Federal Contractors Program)
- 3.4 Extent to which enforcement mechanisms are used to promote compliance with the Employment Equity Act (Legislated Employment Equity Program and Federal Contractors Program)
4. Are the mechanisms of communication and cooperation between the Labour Program and its stakeholders and partners (for example, the Canadian Human Rights Commission, Public Services and Procurement Canada, and other contracting departments) adequate?
- 4.1 Frequency, type and effectiveness of communication between the Labour Program and its partners/stakeholders. (Legislated Employment Equity Program and Federal Contractors Program)
- 4.2 Frequency, type and effectiveness of communication between the Labour Program and employers/contractors covered by the Employment Equity Act. (Legislated Employment Equity Program and Federal Contractors Program)
5. To what extent do Workplace Opportunities funding agreements contribute to employers’ capacity to shape their workplace diversity strategies using the tools that are developed and leveraging partnerships that are created?
- 5.1 Extent to which employers are contributing financially or in-kind resources to the Workplace Opportunities-funded projects.
- 5.2 Extent to which employers and stakeholders engage in dialogue and exchanges regarding employment equity, diversity and inclusion.
- 5.3 Extent to which project tools and resources developed under Workplace Opportunities contribute to employer and industry capacity to shape workplace diversity strategies.
- 5.4 Employers and stakeholders have access to information concerning employment equity, diversity and inclusion in Canadian workplaces.
6. Are there alternative designs or delivery approaches that could be more cost-effective in achieving program expected outcomes?
- 6.1 Evidence of cost-effective program delivery.
- 6.2 Evidence from international/domestic best practices and lessons learned about effective approaches to implementing/ensuring equitable employment for targeted groups.
Annex D: Technical studies
Literature and document review
A review of the literature on relevant issues was conducted in 2018. As well, a review of the program’s internal documentation was carried out to elucidate program activities.
Administrative file and data review
An analysis of administrative data from the Labour Program’s Legislated Employment Equity Program and Federal Contractors Program Access database was conducted in 2017.
Key informant interviews
Interviews were conducted in 2017 with 31 key informants, including Labour Program officials, Contracting departments, governmental organizations, employer or employee associations, Canadian Human Rights Commission auditors, experts, and Workplace Opportunities funding recipients.
Employer and contractor study
A survey of 335 Legislated Employment Equity Program and Federal Contractors Program employers was carried out in 2017. In addition, interviews were conducted with 13 employers from these programs in 2017.
Annex E: Figures (cont’d)
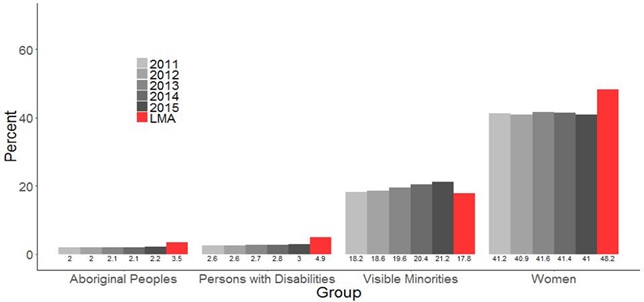
Figure 4 – Text version
| Designated group | Representation | |||||
|---|---|---|---|---|---|---|
| 2011 | 2012 | 2013 | 2014 | 2015 | LMA | |
| Aboriginal peoples | 2 | 2 | 2.1 | 2.1 | 2.2 | 3.5 |
| Persons with disabilities | 2.6 | 2.6 | 2.7 | 2.8 | 3 | 4.9 |
| Visible minorities | 18.2 | 18.6 | 19.6 | 20.4 | 21.2 | 17.8 |
| Women | 41.2 | 40.9 | 41.6 | 41.4 | 41 | 48.2 |
Data source: Employer and Contractor Survey, ESDC, 2017.
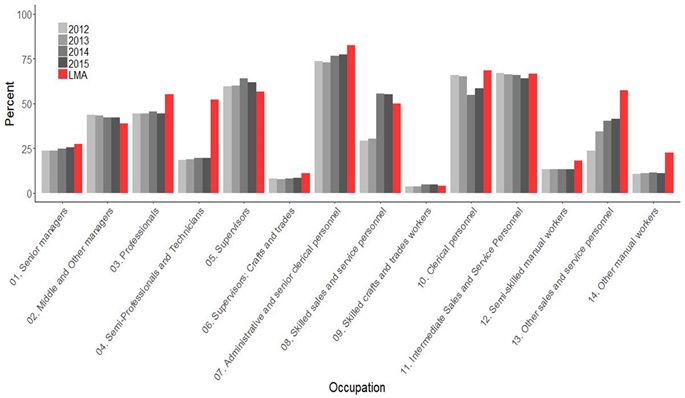
Figure 5 – Text version
| Sector | Representation | ||||
|---|---|---|---|---|---|
| 2012 | 2013 | 2014 | 2015 | LMA | |
| Senior managers | 23.5 | 23.8 | 24.8 | 25.5 | 27.4 |
| Middle and other managers | 43.6 | 43.3 | 42 | 42.1 | 38.9 |
| Professionals | 44.4 | 44.5 | 45.5 | 44.5 | 55 |
| Semi-professionals and technicians | 18.6 | 18.9 | 19.7 | 19.4 | 52 |
| Supervisors | 59.7 | 60 | 63.9 | 61.9 | 56.5 |
| Supervisors: crafts and trades | 8.1 | 7.8 | 8.1 | 8.3 | 11.2 |
| Administrative and senior clerical personnel | 73.6 | 72.8 | 76.8 | 77.4 | 82.6 |
| Skilled sales and service personnel | 29.1 | 30.2 | 55.6 | 55 | 49.9 |
| Skilled crafts and trades workers | 3.6 | 3.7 | 4.7 | 4.8 | 3.9 |
| Clerical personnel | 65.8 | 65 | 54.6 | 58.3 | 68.4 |
| Intermediate sales and service personnel | 67.1 | 66.2 | 65.9 | 63.9 | 66.8 |
| Semi-skilled manual workers | 13.3 | 13.2 | 13.3 | 13.3 | 17.9 |
| Other sales and service personnel | 23.8 | 34.5 | 40.2 | 41.5 | 57.5 |
| Other manual workers | 10.5 | 10.9 | 11.3 | 10.9 | 22.7 |
Data source: Employer and Contractor Survey, ESDC, 2017.
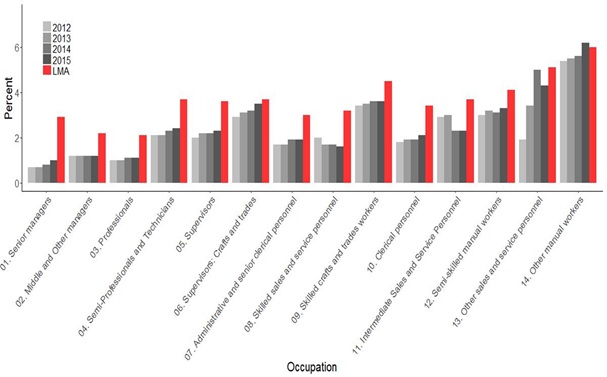
Figure 6 – Text version
| Sector | Representation | ||||
|---|---|---|---|---|---|
| 2012 | 2013 | 2014 | 2015 | LMA | |
| Senior managers | 0.7 | 0.7 | 0.8 | 1 | 2.9 |
| Middle and other managers | 1.2 | 1.2 | 1.2 | 1.2 | 2.2 |
| Professionals | 1 | 1 | 1.1 | 1.1 | 2.1 |
| Semi-professionals and technicians | 2.1 | 2.1 | 2.3 | 2.4 | 3.7 |
| Supervisors | 2 | 2.2 | 2.2 | 2.3 | 3.6 |
| Supervisors: crafts and trades | 2.9 | 3.1 | 3.2 | 3.5 | 3.7 |
| Administrative and senior clerical personnel | 1.7 | 1.7 | 1.9 | 1.9 | 3 |
| Skilled sales and service personnel | 2 | 1.7 | 1.7 | 1.6 | 3.2 |
| Skilled crafts and trades workers | 3.4 | 3.5 | 3.6 | 3.6 | 4.5 |
| Clerical personnel | 1.8 | 1.9 | 1.9 | 2.1 | 3.4 |
| Intermediate sales and service personnel | 2.9 | 3 | 2.3 | 2.3 | 3.7 |
| Semi-skilled manual workers | 3 | 3.2 | 3.1 | 3.3 | 4.1 |
| Other sales and service personnel | 1.9 | 3.4 | 5 | 4.3 | 5.1 |
| Other manual workers | 5.4 | 5.5 | 5.6 | 6.2 | 6 |
Data source: Employer and Contractor Survey, ESDC, 2017.
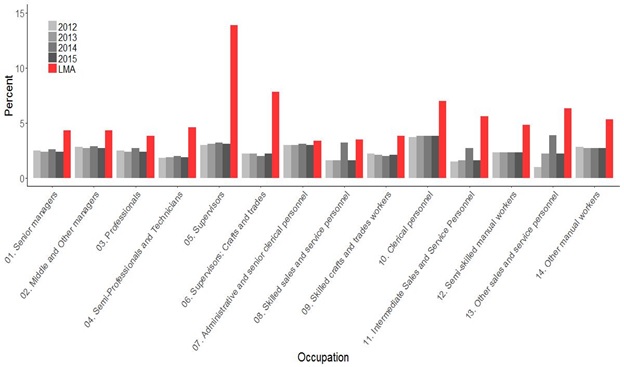
Figure 7 – Text version
| Sector | Representation | ||||
|---|---|---|---|---|---|
| 2012 | 2013 | 2014 | 2015 | LMA | |
| Senior managers | 2.5 | 2.4 | 2.6 | 2.9 | 4.3 |
| Middle and other managers | 2.8 | 2.7 | 2.9 | 3.1 | 4.3 |
| Professionals | 2.5 | 2.4 | 2.7 | 2.9 | 3.8 |
| Semi-professionals and technicians | 1.8 | 1.9 | 2 | 2.3 | 4.6 |
| Supervisors | 3 | 3.1 | 3.2 | 3.3 | 13.9 |
| Supervisors: crafts and trades | 2.2 | 2.2 | 2 | 2.1 | 7.8 |
| Administrative and senior clerical personnel | 3 | 3 | 3.1 | 3.4 | 3.4 |
| Skilled sales and service personnel | 1.6 | 1.6 | 3.2 | 3 | 3.5 |
| Skilled crafts and trades workers | 2.2 | 2.1 | 2 | 2.4 | 3.8 |
| Clerical personnel | 3.7 | 3.8 | 3.8 | 4 | 7 |
| Intermediate sales and service personnel | 1.5 | 1.6 | 2.7 | 2.8 | 5.6 |
| Semi-skilled manual workers | 2.3 | 2.3 | 2.3 | 2.6 | 4.8 |
| Other sales and service personnel | 1 | 2.2 | 3.9 | 3.8 | 6.3 |
| Other manual workers | 2.8 | 2.7 | 2.7 | 3.1 | 5.3 |
Data source: Employer and Contractor Survey, ESDC, 2017.
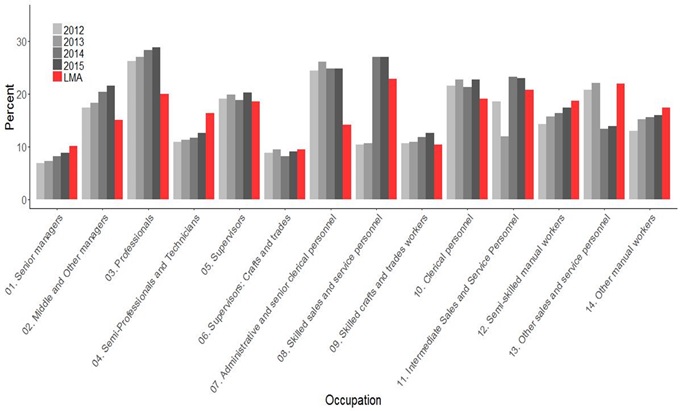
Figure 8 – Text version
| Sector | Representation | ||||
|---|---|---|---|---|---|
| 2012 | 2013 | 2014 | 2015 | LMA | |
| Senior managers | 6.9 | 7.2 | 8.1 | 8.8 | 10.1 |
| Middle and other managers | 17.4 | 18.3 | 20.4 | 21.5 | 15 |
| Professionals | 26.2 | 27 | 28.3 | 28.8 | 19.9 |
| Semi-professionals and technicians | 10.9 | 11.3 | 11.6 | 12.5 | 16.3 |
| Supervisors | 19 | 19.8 | 18.8 | 20.2 | 18.5 |
| Supervisors: crafts and trades | 8.8 | 9.4 | 8.1 | 9 | 9.5 |
| Administrative and senior clerical personnel | 24.4 | 26 | 24.7 | 24.7 | 14.1 |
| Skilled sales and service personnel | 10.3 | 10.6 | 26.9 | 26.9 | 22.8 |
| Skilled crafts and trades workers | 10.6 | 10.9 | 11.8 | 12.6 | 10.3 |
| Clerical personnel | 21.5 | 22.7 | 21.3 | 22.7 | 19 |
| Intermediate sales and service personnel | 18.5 | 19.9 | 23.2 | 22.9 | 20.7 |
| Semi-skilled manual workers | 14.3 | 15.7 | 16.3 | 17.3 | 18.7 |
| Other sales and service personnel | 20.7 | 22 | 13.3 | 13.8 | 21.9 |
| Other manual workers | 13 | 15.1 | 15.5 | 15.9 | 17.3 |
Data source: Employer and Contractor Survey, ESDC, 2017.