
Horizontal Evaluation of the Labour Market Development Agreements
On this page
- List of abbreviations
- List of charts
- List of tables
- Executive summary
- Management response and action plan
- Introduction
- Labour Market Development Agreements
- Methodology
- Evaluation findings
- Supplemental studies
- Conclusions and recommendations
- References
- Appendix A. Heterogeneity of treatment effects study findings for active EI claimants in Skills Development
- Appendix B. List of 9 studies included in this national synthesis report
Alternate formats

Horizontal Evaluation of the Labour Market Development Agreements [PDF - 2,26 MB]
Large print, braille, MP3 (audio), e-text and DAISY formats are available on demand by ordering online or calling 1 800 O-Canada (1-800-622-6232). If you use a teletypewriter (TTY), call 1-800-926-9105.
List of abbreviations
- ATE
- Average Treatment Effect
- ATET
- Average Treatment Effect on Treated
- EAS
- Employment Assistance Services
- EBSM
- Employment Benefits and Support Measures
- EI
- Employment Insurance
- ESDC
- Employment and Social Development Canada
- GATE
- Group Average Treatment Effect
- IATE
- Individualized Average Treatment Effect
- JCP
- Job Creation Partnerships
- LMDA
- Labour Market Development Agreements
- SA
- Social Assistance
- SD
- Skills Development
- TWS
- Targeted Wage Subsidies
List of charts
- Chart i. Change in probability of being employed in participants relative to non-participants (annual average)
- Chart ii. Employment earnings of participants relative to non-participants (annual average)
- Chart iii. Change in dependence on government income support (annual average)
- Chart 1. Change in probability of being employed in participants relative to non-participants (annual average)
- Chart 2. Employment earnings of participants relative to non-participants (annual average)
- Chart 3. Change in the use of EI benefits (annual average)
- Chart 4. Change in the use of SA benefits (annual average)
- Chart 5. Change in dependence on government income support (annual average)
- Chart 6. Average earnings for active claimant participants in Skills Development-Apprentices
- Chart 7. Average earnings for former claimant participants in Skills Development-Apprentices
- Chart A1. Individualized average treatment effects by all participants and subgroups
- Chart A2. Estimates of Group Average Treatment Effects for incidence of employment by subgroup
- Chart A3. Estimates of Group Average Treatment Effects for employment earnings by subgroup
- Chart A4. Estimates of Group Average Treatment Effects for dependence on government income supports by subgroup
List of tables
- Table i. Share of LMDA funding and average cost per Action Plan Equivalent per participant across Canada, for 2010 to 2012 period
- Table ii. Number of years for the benefits to exceed program costs
- Table 1. LMDA devolution dates and total expenditures between 2018 and 2021
- Table 2. Share of LMDA funding and average cost per Action Plan Equivalent per participant across Canada
- Table 3. Profile of active and former EI claimant participants in EBSMs across Canada in 2010 to 2012
- Table 4. Employment and earning levels, and use of SA in the year before participation in EBSMs
- Table 5. Profile of female active and former EI claimant participants in EBSMs across Canada in 2010 to 2012
- Table 6. Incremental impacts for female participants (annual average)
- Table 7. Profile of male active and former EI claimant participants in EBSMs across Canada in 2010 to 2012
- Table 8. Incremental impacts for male participants (annual average)
- Table 9. Profile of youth active and former EI claimant participants in EBSMs across Canada in 2010 to 2012
- Table 10. Incremental impacts for youth participants (annual average)
- Table 11. Profile of older worker active and former EI claimant participants in EBSMs across Canada in 2010 to 2012
- Table 12. Incremental impacts for older worker participants (annual average)
- Table 13. Profile of Indigenous active and former EI claimant participants in EBSMs across Canada in 2010 to 2012
- Table 14. Incremental impacts for Indigenous participants (annual average)
- Table 15. Profile of persons with disabilities active and former EI claimant participants in EBSMs across Canada in 2010 to 2012
- Table 16. Incremental impacts for persons with disabilities (annual average)
- Table 17. Profile of recent immigrant active and former EI claimant participants in EBSMs across Canada in 2010 to 2012
- Table 18. Incremental impacts for recent immigrants (annual average)
- Table 19. Profile of visible minority active and former EI claimant participants in EBSMs across Canada in 2010 to 2012
- Table 20. Incremental impacts for visible minority participants (annual average)
- Table 21. Cost-benefit results for active and former EI claimant participants
- Table 22. Profile of active and former EI claimant participants in Skills Development-Apprentices programs across Canada in 2010 to 2012
- Table A1. Selected sociodemographic characteristics and outcomes of participants
- Table A2. Annual average post-program incremental impacts for Skills Development active claimants “Average Treatment Effect on the Treated”
Executive summary
The Labour Market Development Agreements (LMDAs) are bilateral agreements between Canada and each province and territory for the design and delivery of Employment Benefits and Support Measures (EBSMs).
The objective of EBSMs is to assist individuals to obtain or keep employment through various active employment programs, including training or employment assistance services. Successful delivery of EBSMs is expected to result in participants receiving needed services, a quick return to work, and savings to the Employment Insurance (EI) account.
Programs and services delivered by provinces and territories have to correspond to the EBSM categories defined under the EI Act. The following is a short description of the EBSMs examined in the evaluation:
- Skills Development (SD) helps participants obtain employment skills by giving them financial assistance in order to attend classroom training
- Targeted Wage Subsidies (TWS) help participants obtain on-the-job work experience by providing employers with a wage subsidy
- Self-Employment provides financial assistance and business planning advice to participants to help them start their own business
- Job Creation Partnerships (JCP) provide participants with opportunities to gain work experience that will lead to ongoing employment. Employment opportunities are provided by projects that contribute to developing the community and the local economy
- Employment Assistance Services (EAS) such as counselling, job search skills, job placement services, provision of labour market information and case management
- Labour Market Partnerships seeks to deal with labour force adjustments and meet human resources requirements by enabling employers, employee or employer associations, community groups, and communities to work together to develop or implement strategies
- Research and Innovation initiatives that seek to identify better ways of helping people prepare for, return to or keep employment, and be productive participants in the labour force
The LMDA investment
In fiscal year 2020 to 2021, Canada transferred nearly $2.5 billion (including nearly $186.6 million in administration funds) to provinces and territories.
Table i: provides an overview of the share of funding allocated to EBSMs and the average cost per participant. The average cost per participant is calculated based on the 2010 to 2012 data from the EI Monitoring and Assessment Reports. The 2010 to 2012 period corresponds with the cohort of participants selected for incremental impacts and cost-benefit analysis in the LMDA evaluation.
| Employment Benefits and Support Measures | Average share of funding | Average cost – active claimants | Average cost – former claimants |
|---|---|---|---|
| Skills Development | 52% | $10,193 | $10,052 |
| Employment Assistance Services | 30% | $826 | $826 |
| Labour Market Partnerships | 7% | n/a | n/a |
| Self-Employment | 6% | $15,551 | $15,833 |
| Targeted Wage Subsidies | 3% | $7,538 | $7,384 |
| Job Creation Partnerships | 2% | $11,750 | $10,940 |
| Research and Innovation | <1% | n/a | n/a |
| Total | 100% | n/a | n/a |
Sources: EI Monitoring and Assessment Reports for fiscal years 2010 and 2011 to 2011 and 2012.
Compared to the 2010 to 2012 period, the LMDA budget allocation varied for few programs and services in 2020 to 2021. For example, investments in SD decreased from 52% to 39%. As well, investments in Research and Innovation increased from less than 1% to 10% of total allocation.
Evaluation objectives
Building on the success of previous LMDA evaluation cycles, the aim of this evaluation is to fill in knowledge gaps about the effectiveness, efficiency, as well as design and delivery of EBSMs across Canada.
Evaluation methodology
The findings in this report are drawn from 9 separate evaluation studies. These studies examine issues related to program effectiveness, efficiency, and design and delivery. A mix of qualitative and quantitative methods are used, including:
- incremental impact analysis for participants who began an intervention between 2010 and 2012
- outcome analysis
- cost-benefit analysis (including savings to health care)
- key informant interviews with 287 provincial/territorial representatives, service providers, agreement holders and key stakeholders
- provincial/territorial questionnaires
- a national survey of 2,023 self-employment participants
- document and literature reviews
For the purposes of this evaluation, incremental impacts are estimated for 2 types of participants:
- active EI claimants are participants who started an EBSM intervention while collecting EI benefits
- former EI claimants are participants who started an EBSM intervention up to 3 years after the end of their EI benefitsFootnote 3
Key findings
Between 2010 and 2012, nearly 609,000 participants began participating in LMDA programs and services across Canada.
Effectiveness and efficiency of EBSMs
Overall, incremental impacts demonstrate that participation in most EBSMs improves labour market attachment and reduces dependence on government income supports compared to similar non-participants. These results are consistent with those found for earlier cohorts of participants as part of the previous evaluation cycle. A subgroup analysis shows that with some exceptions, SD and TWS interventions also benefit most subgroups of participants. EAS alone was found to improve the labour market attachment for female, Indigenous and recent immigrant participants, and decrease their use of EI. As well, for most interventions, the social benefits of participating in EBSMs exceed the initial investment costs over time.
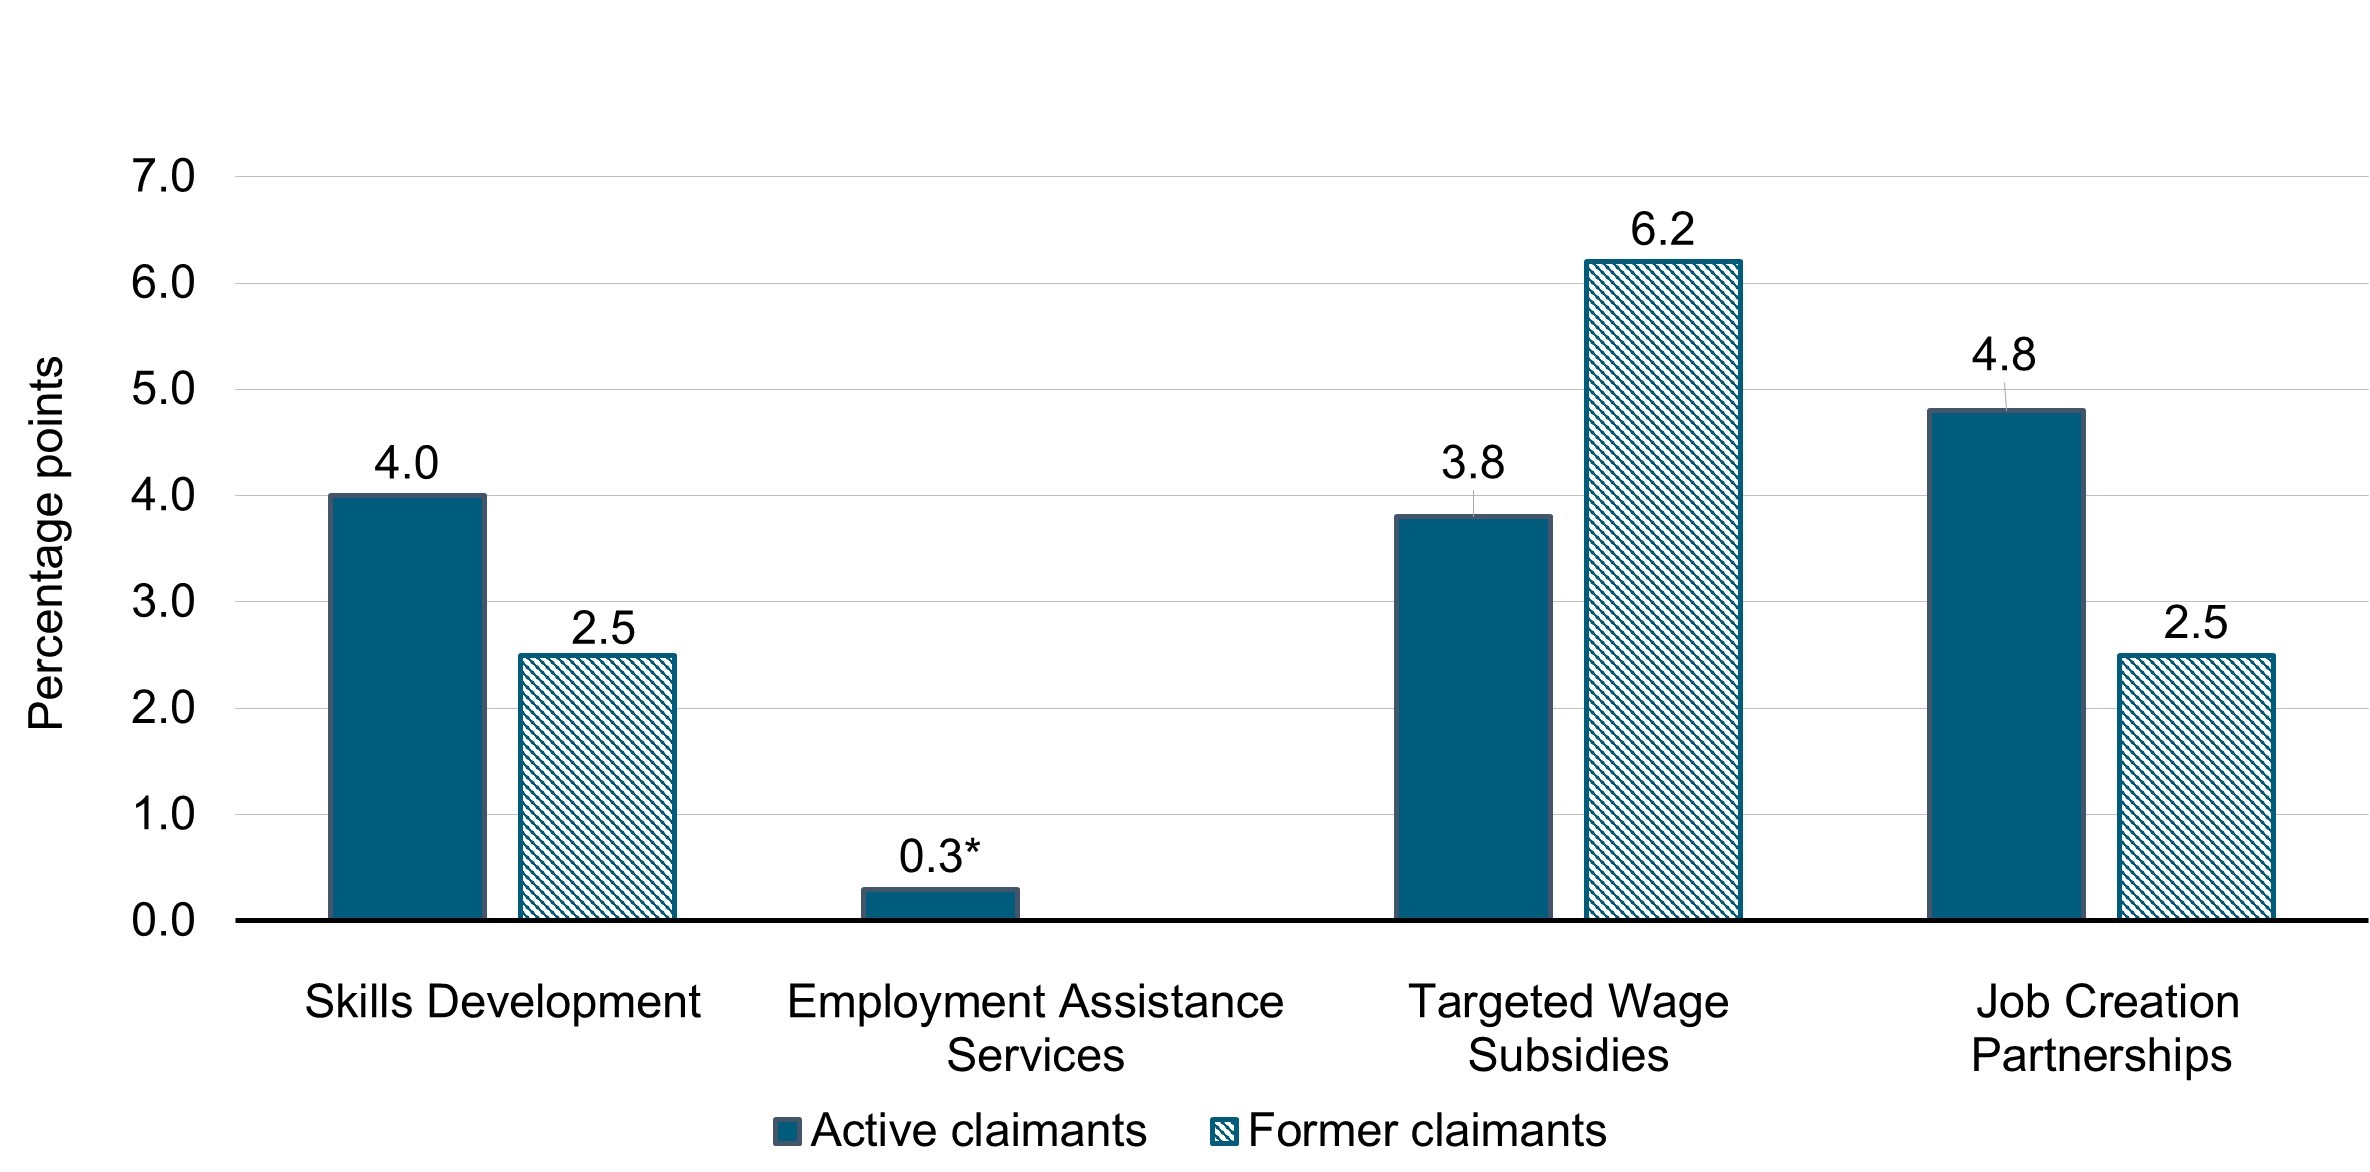
Chart i: presents the incremental impacts on the incidence of employment for active and former claimants by EBSM. The estimates can be interpreted as change in the probability of being employed following participation. For example, participation in SD increases the probability of being employed by 4 percentage points for active EI claimants relative to non-participants.
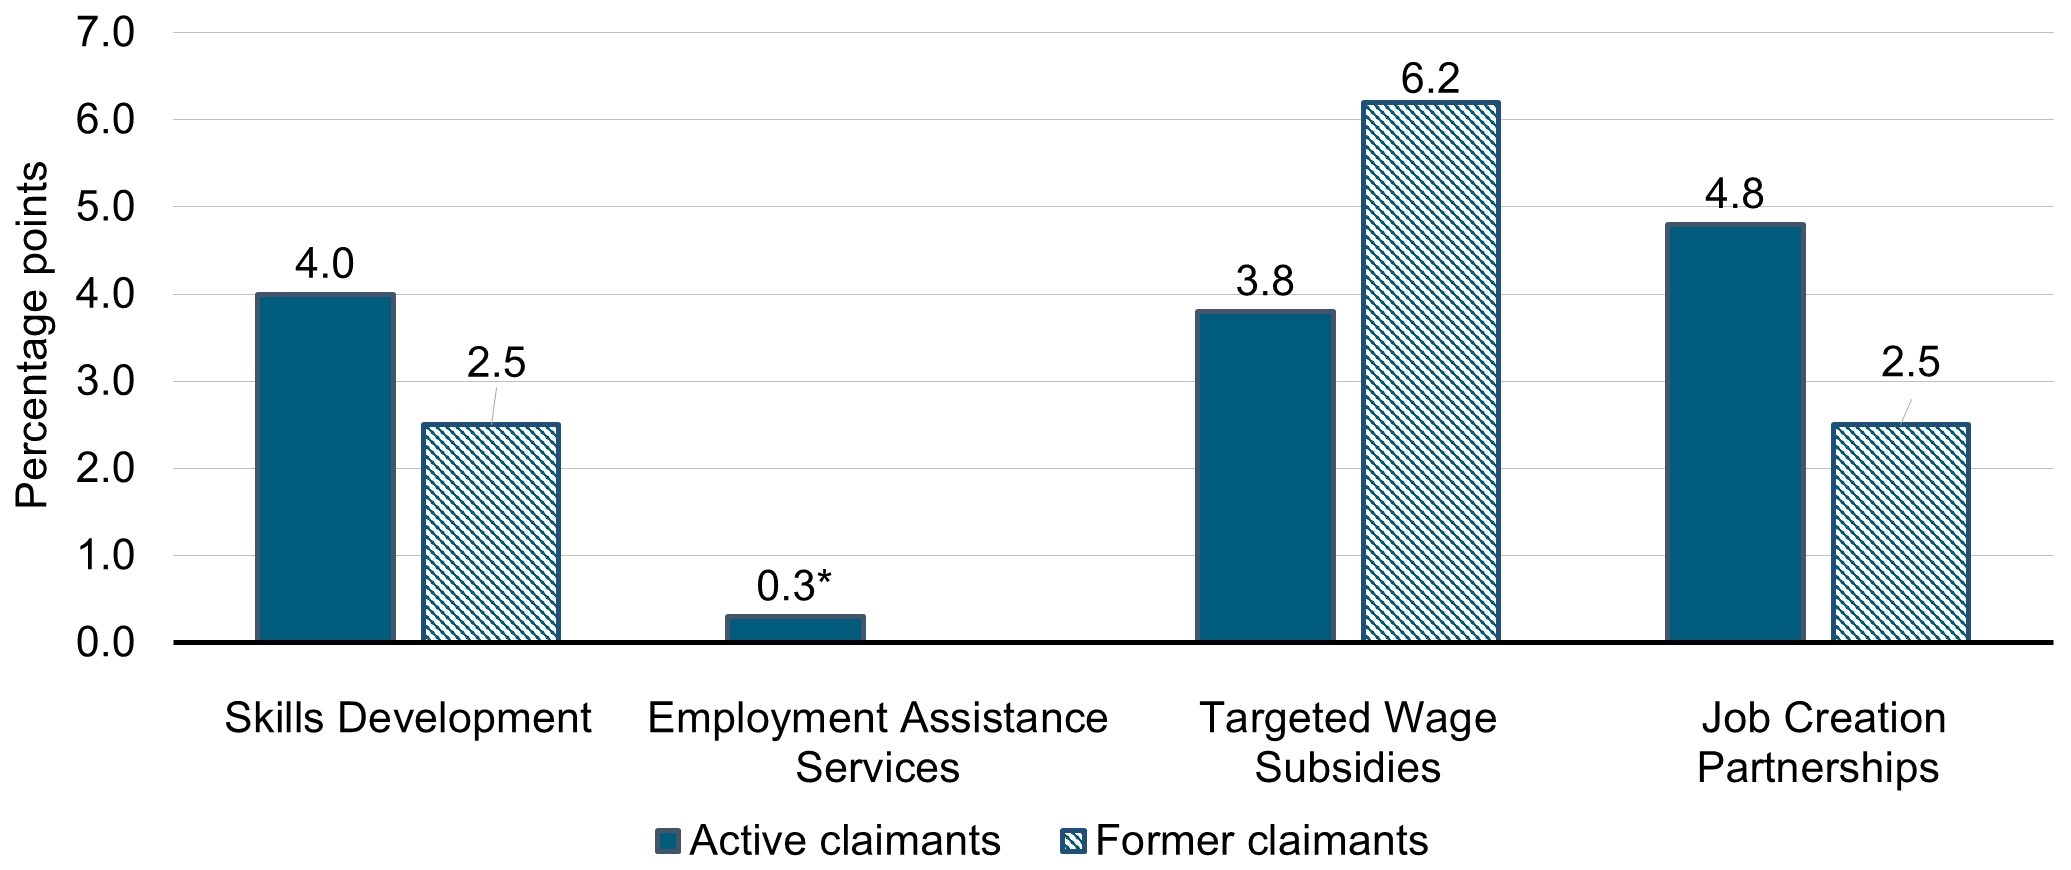
*The impact is non-statistically significant, however, it is still valid in terms of informing the direction of the impact (negative or positive).
Note: Impacts are estimated over 4 post-program years (or 5 years in the case of EAS).
Text description – Chart i
| Program name | Incidence of employment for active claimants (percentage points) | Incidence of employment for former claimants (percentage points) |
|---|---|---|
| Skills Development | 4.0 | 2.5 |
| Employment Assistance Services | 0.3* | n/a |
| Targeted Wage Subsidies | 3.8 | 6.2 |
| Job Creation Partnerships | 4.8 | 2.5 |
*The impact is non-statistically significant, however, it is still valid in terms of informing the direction of the impact (negative or positive).
Note: Impacts are estimated over 4 post-program years (or 5 years in the case of EAS).
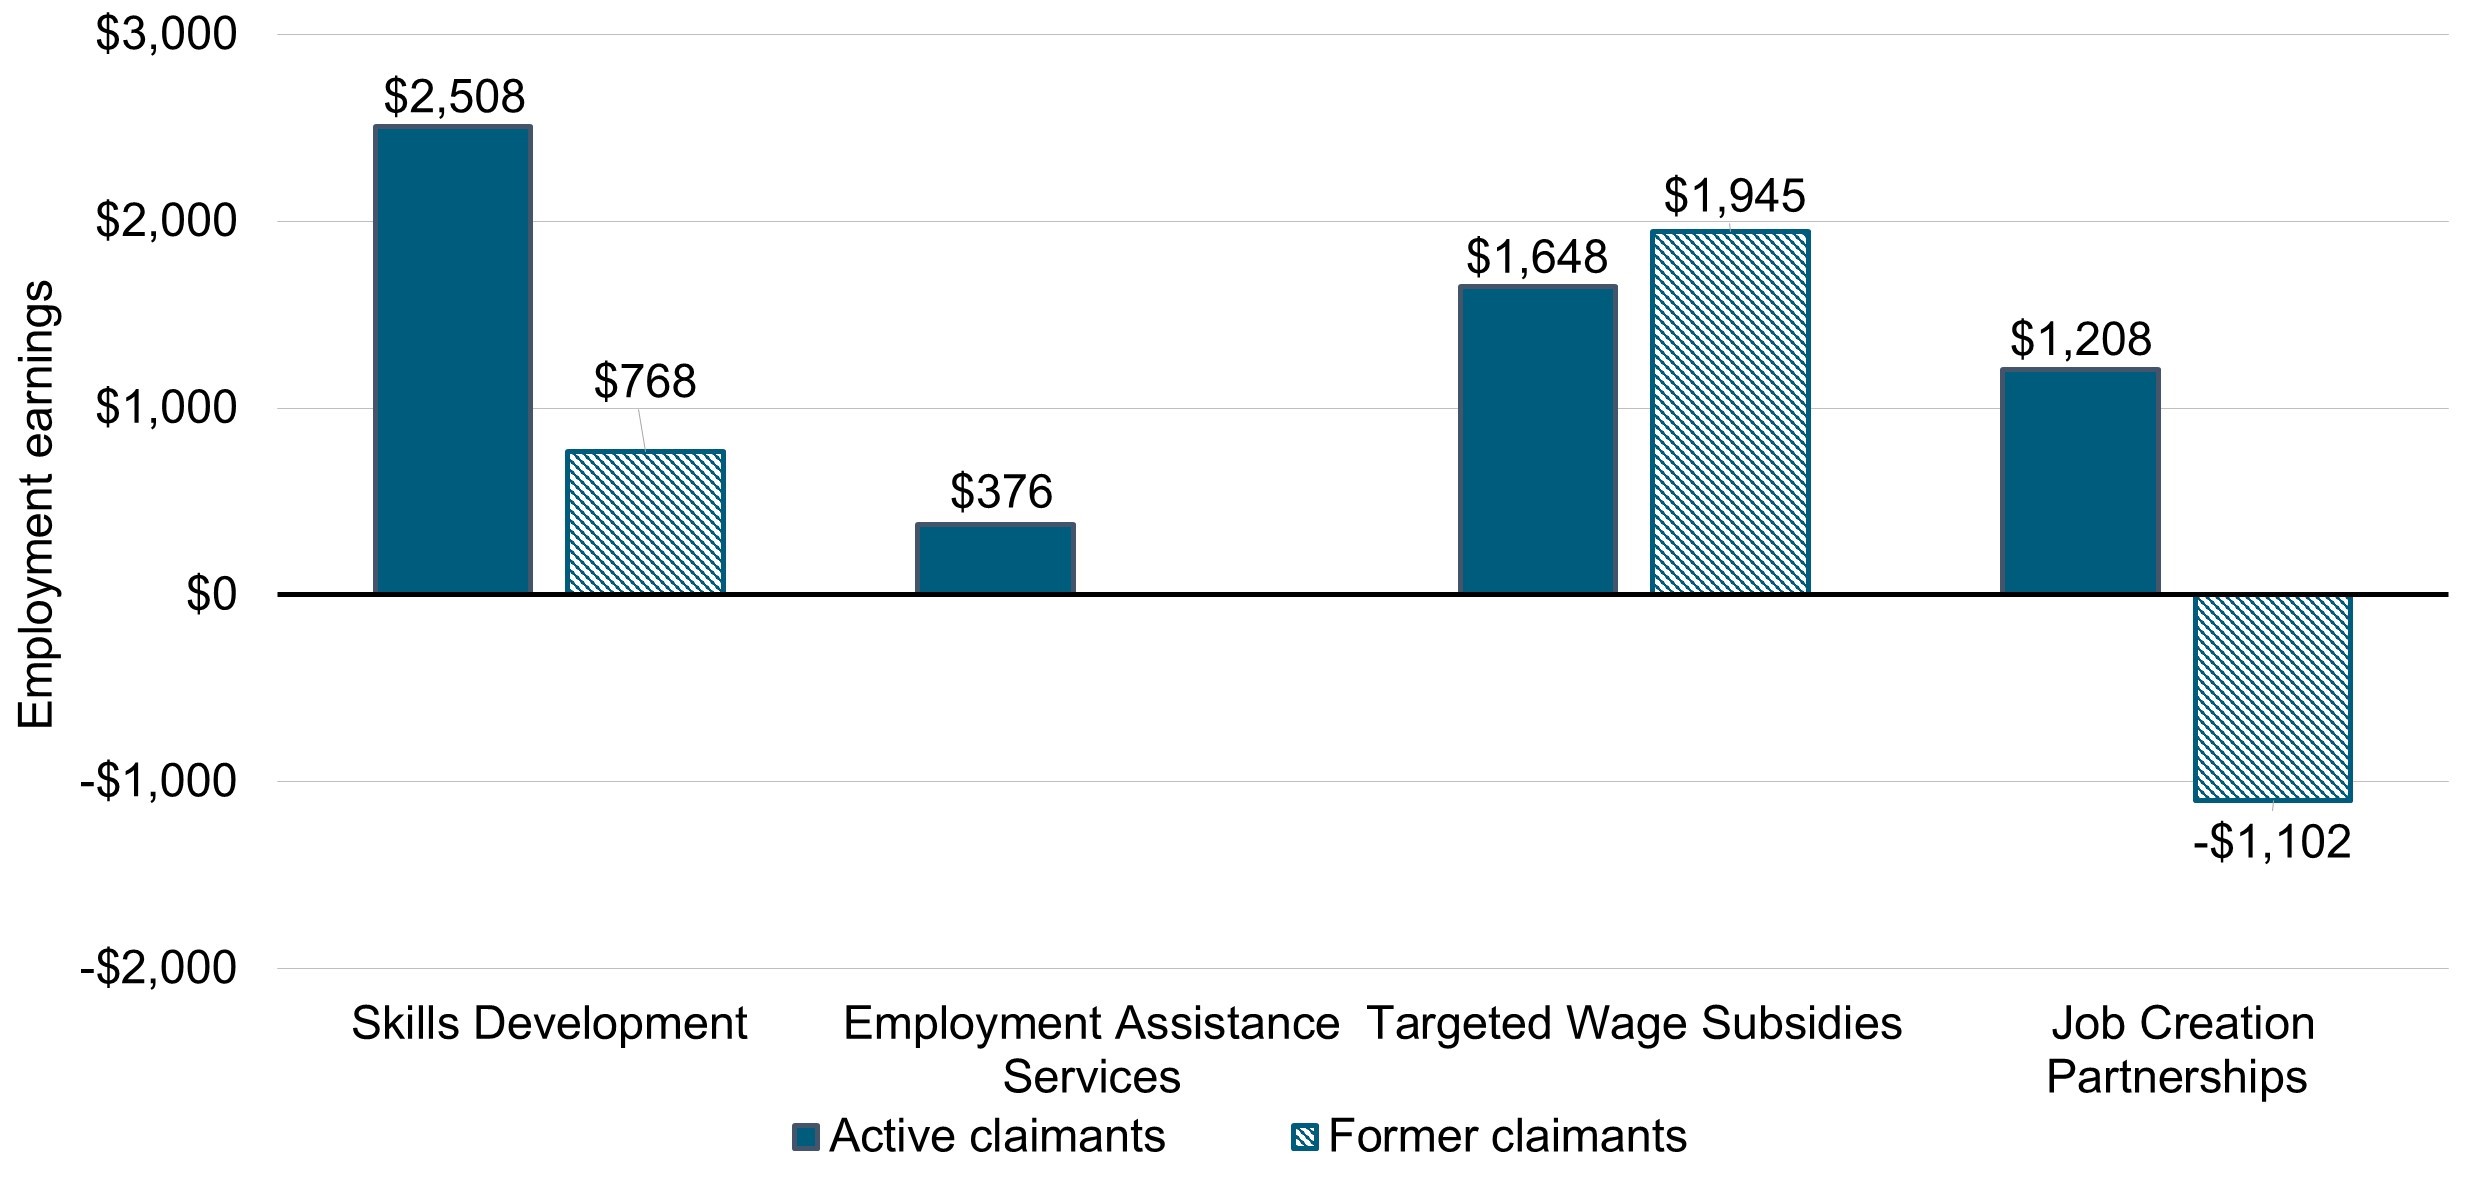
Chart ii: presents the annual average increase in employment earnings for active and former claimants over the post-participation period.
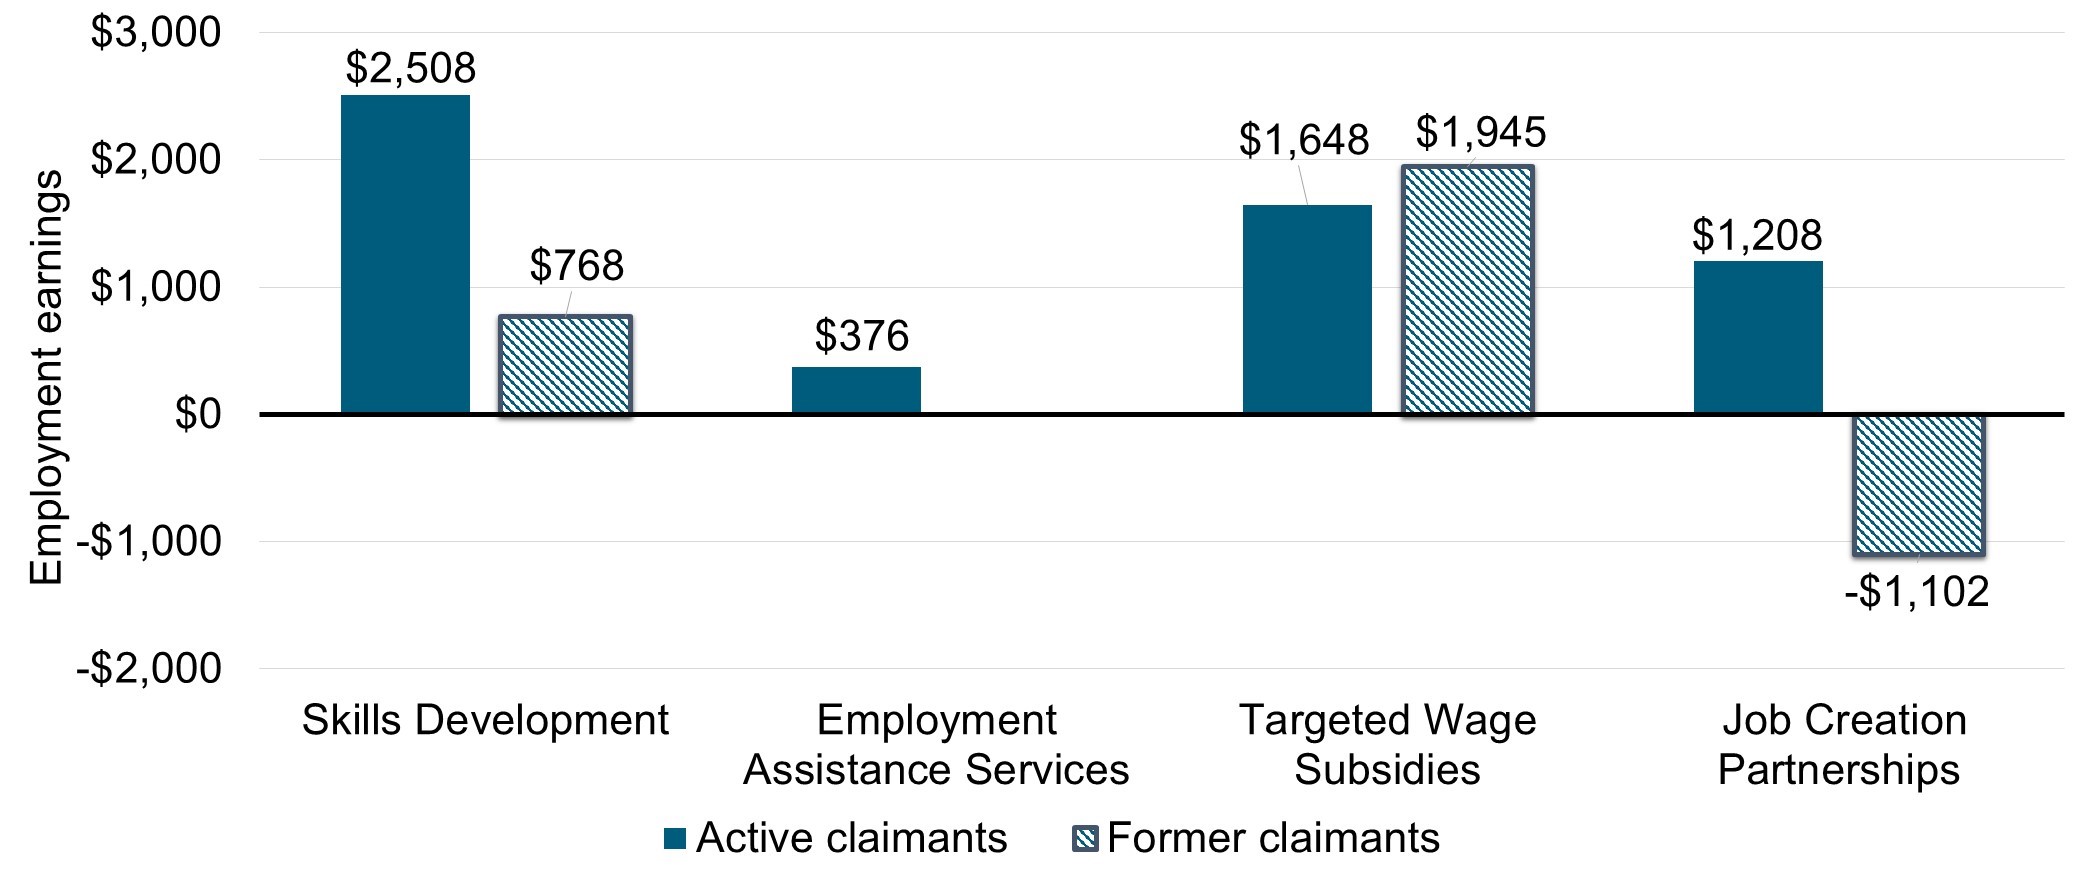
Note: Impacts are estimated over 4 post-program years (or 5 years in the case of EAS).
Text description – Chart ii
| Program name | Employment earnings of active claimants | Employment earnings of former claimants |
|---|---|---|
| Skills Development | $2,508 | $768 |
| Employment Assistance Services | $376 | n/a |
| Targeted Wage Subsidies | $1,648 | $1,945 |
| Job Creation Partnerships | $1,208 | -$1,102 |
Note: Impacts are estimated over 4 post-program years (or 5 years in the case of EAS).
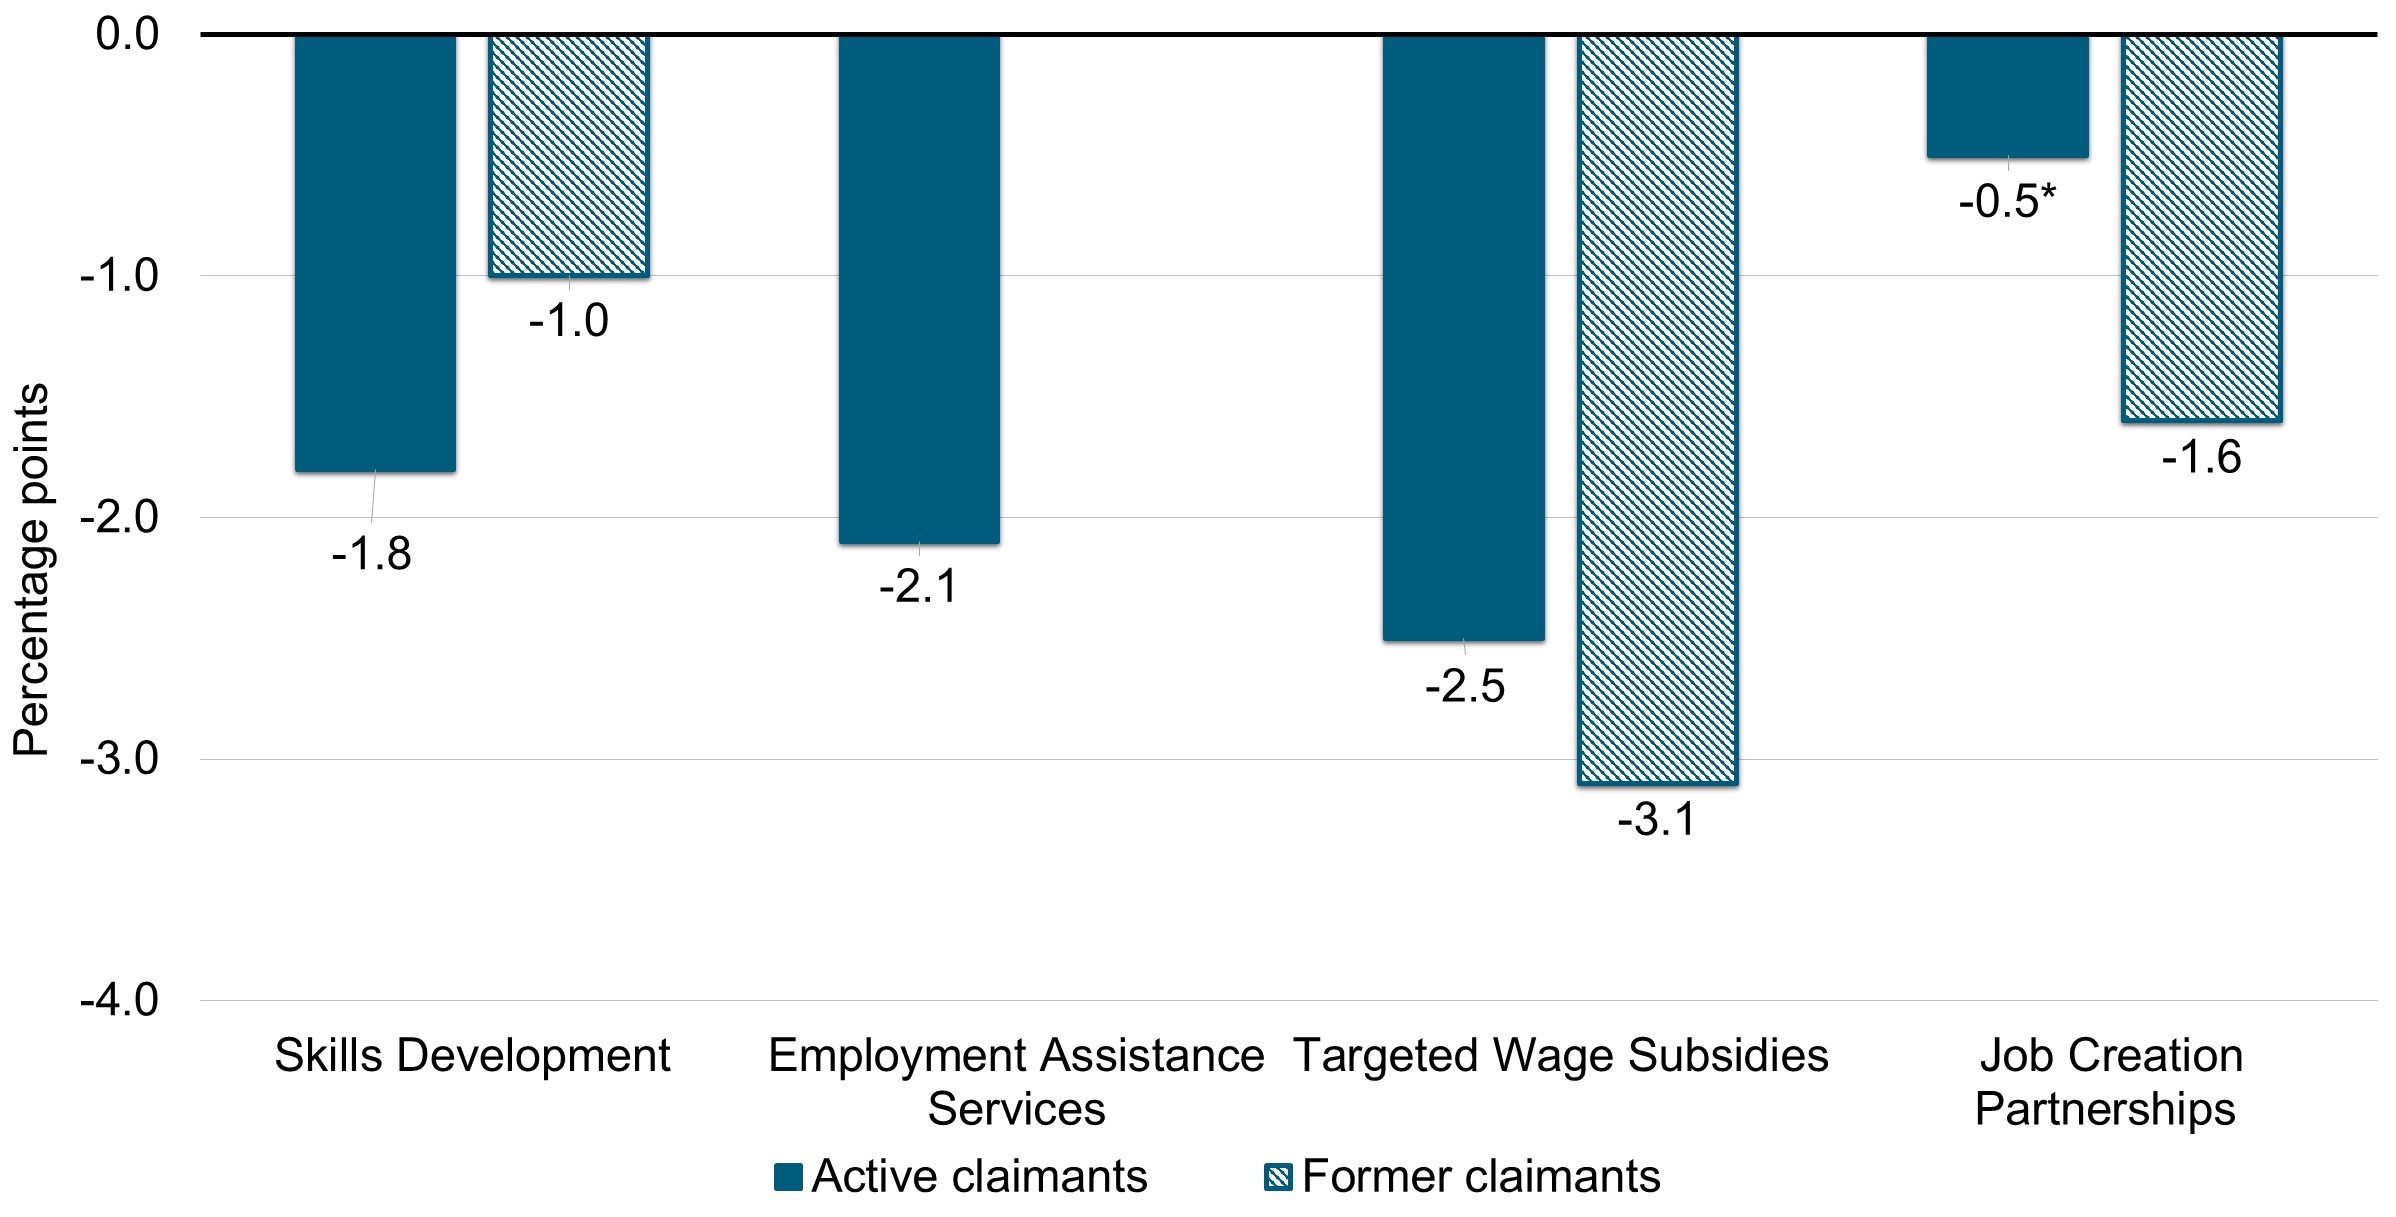
As shown in Chart iii, overall active and former claimants reduce their dependence on government income supports.
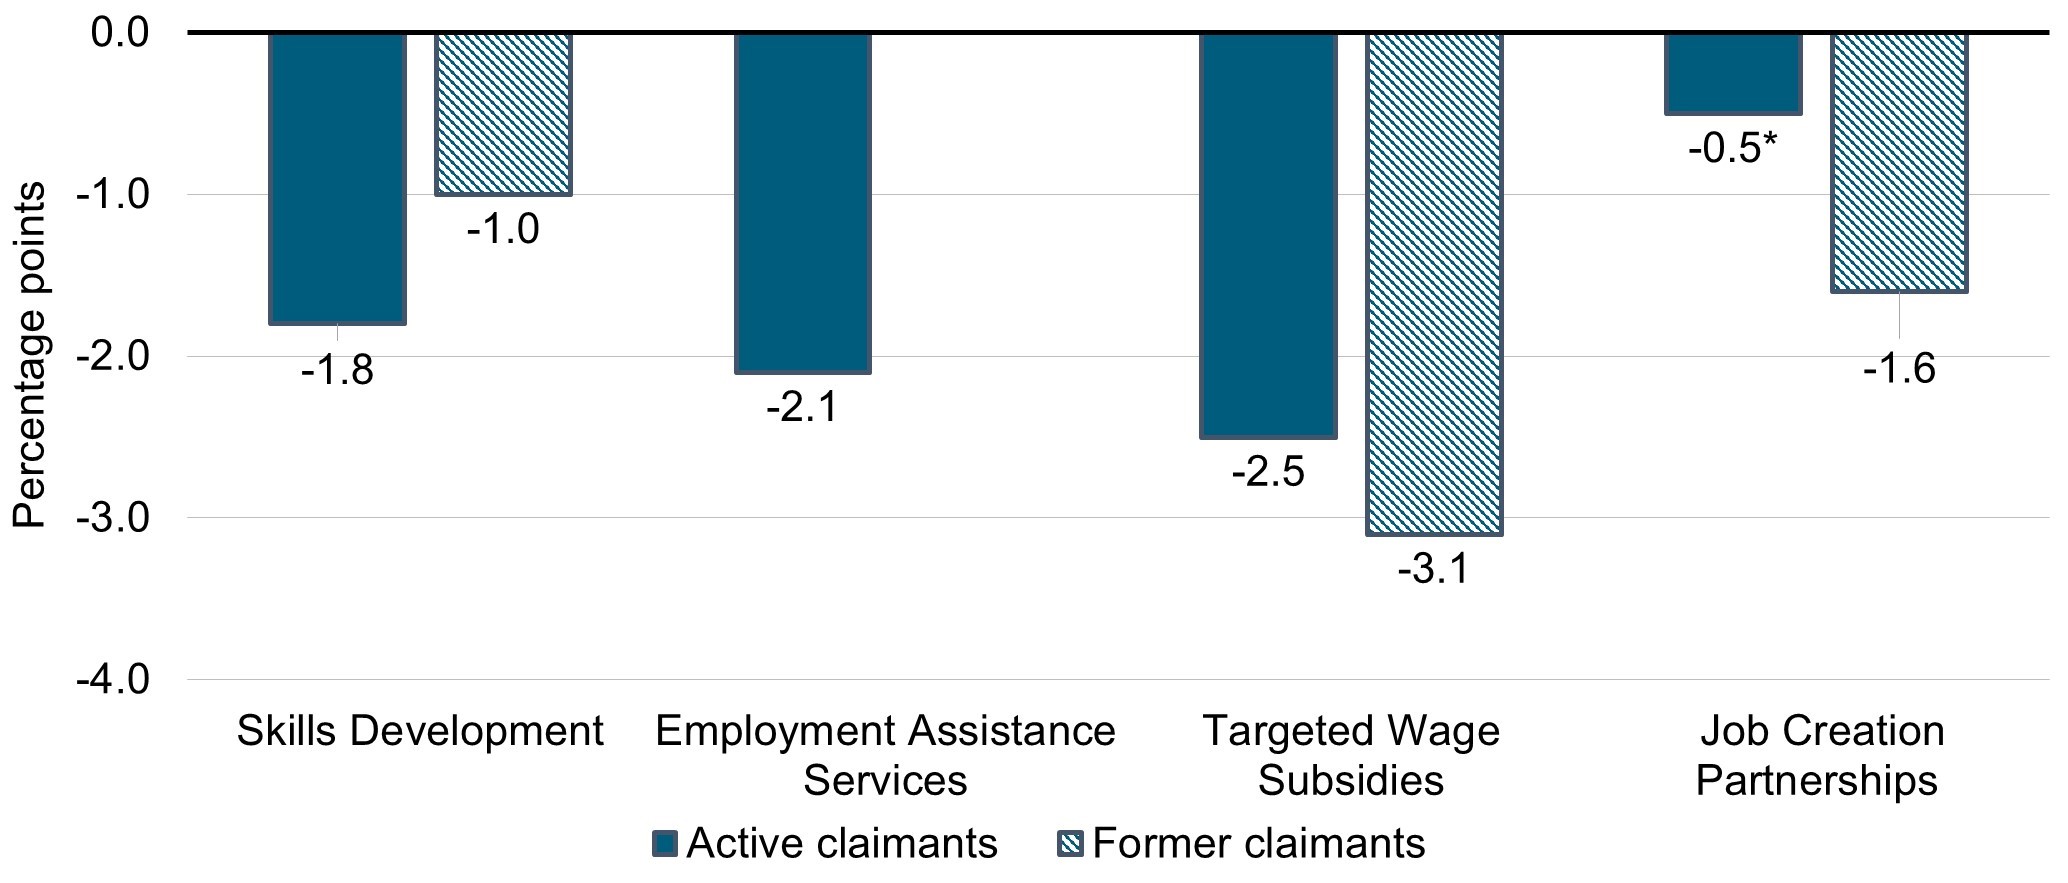
*The impact is non-statistically significant, however, it is still valid in terms of informing the direction of the impact (negative or positive).
Note: Impacts are estimated over 4 post-program years (or 5 years in the case of EAS).
Text description – Chart iii
| Program name | Dependence on government income support for active claimants (percentage points) | Dependence on government income support for former claimants (percentage points) |
|---|---|---|
| Skills Development | -1.8 | -1.0 |
| Employment Assistance Services | -2.1 | n/a |
| Targeted Wage Subsidies | -2.5 | -3.1 |
| Job Creation Partnerships | -0.5* | -1.6 |
*The impact is non-statistically significant, however, it is still valid in terms of informing the direction of the impact (negative or positive).
Note: Impacts are estimated over 4 post-program years (or 5 years in the case of EAS).
Table ii: presents the number of years required for the social benefits to exceed program costs. Social benefits to participation exceed initial investment costs over a period ranging from less than a year to 18.5 years.
| Category | SD active claimants (10 years post-program) | SD youth active claimants (10 years post-program) | TWS active claimants (5 years post-program) | JCP active claimants (5 years post-program) | EAS active claimants (5 years post-program) | SD former claimants (10 years post-program) | TWS former claimants (5 years post-program) |
|---|---|---|---|---|---|---|---|
| Payback period (years after end of participation) | 8.3 | 5.4 | 5.2 | 16.1 | 7.7 | 18.5 | 0.7 |
Supplemental studies
A series of supplemental studies address information gaps previously identified in LMDA evaluations regarding the design and delivery, challenges and lessons learned for Self-Employment, JCP, Labour Market Partnerships, and Research and Innovation.
Most of these interventions are not suitable for incremental impact analysis. For example, Labour Market Partnerships and Research and Innovation do not collect participant information. As a result, a mix of qualitative and quantitative methods are used to examine these EBSMs in detail. Key considerations are included to help guide future program and policy discussions.
Self-Employment study
The evaluation found that the Self-Employment program aims to assist participants in creating employment for themselves by providing them with a range of services.
Based on a survey, it was found that 2 to 4 years after program participation:
- participants increased their employment level by 15 percentage points from 59% in the year before participation to 74% at the time of survey; the increase is mainly due to an increase in the percentage of self-employed participants
- nearly 50% of survey respondents launched a self-employment business and it was still in operation
- half of self-employment businesses were launched in other servicesFootnote 4; professional, scientific and technical services; as well as in construction and retail trade
- 73% of respondents said that they were financially about the same or better off after the program
- 70% of respondents said that their household net worth was about the same or higher after the program
The survey did examine the contribution of the program to the success of self-employment businesses. At least 81% of survey respondents who launched a self-employment business rated the following services and training as very or somewhat important to the business launch, operation and success:
- assistance with business plan development
- one-on-one mentoring / advice or counselling supports
- discussion on risks and challenges of self-employment
- assessment of entrepreneurial readiness
- living allowance during participation and financial assistance with business start-up costs
- information about and assistance to access capital
- training on budgeting, financial management, marketing, business operation and sales
Job Creation Partnership (JCP) study
The design and delivery of JCP allows provinces and territories to address a variety of barriers to employment experienced by their citizens (such as, lack of work experience). Provinces and territories can use the program to address various labour market needs by targeting sub-groups of individuals, professions or economic sectors in demand and communities.
In addition to gaining work experience, key informants expect participants to develop work-related skills and to enhance their career development, job search abilities, and to improve their personal well-being. Project holders can benefit from the program through increased capacity, implementing their projects, and increasing their presence within local communities.
For employers that provide work experience to trained participants, benefits are mostly associated with gaining a source of trained employees. At the community level, projects support the local economy and provide new assets (such as, restored buildings or hiking trails) or services (such as, support for newcomers).
Labour Market Partnerships study
The Labour Market Partnerships program(s) aim to assist employers, communities and/or industries to address their labour force adjustments and human resource needs. Funded projects target current and/or forecasted skills and/or labour shortages. These projects also target specific unemployed populations (for example, women, youth, Indigenous peoples, newcomers, persons with disabilities and the self-employed).
All participating provinces and territories confirm that program officials carried out activities to support the formation and maintenance of partnerships. Provincial and territorial departments and key informants explained that partners’ expertise, network and financial contribution are all essential to project implementation and success.
Research and Innovation study
The Research and Innovation support measure provides funding to provinces and territories for research and demonstration projects. These projects aim to identify better ways of helping individuals prepare for, return to, or keep employment and to be productive in the labour force.
The document review reveals that Research and Innovation projects encompassed a variety of activities including:
- developing and/or testing new approaches to improve employment outcomes for clients with some projects also focusing on persons with disabilities, youth, Indigenous, and other demographic groups
- strengthening service delivery
- improving learning and post-secondary education with a focus on expanding online course delivery
- funding for cost-sharing of internships, temporary work placements, or training
- delivering career fairs or career/employment information presentations
- research
Provincial/territorial questionnaires reveal factors contributing to successful testing and identification of innovative approaches, including:
- project holders:
- employing experienced staff
- possessing organizational structure and financial reporting capacity
- having strong commitment from partners
- providing detailed cost estimates as part of their project proposals
- projects that have:
- a clear plan with measurable outcomes
- continuous project application intake to address on-going and emerging labour market issues
Skills Development-Apprentices study
The objective of the program is to help apprentices become skilled tradespeople and to increase their labour market attachment. Program participants have generally chosen a career and are already attached to the labour market. The apprenticeship process involves on-the-job learning and technical training in a classroom setting.
The evaluation found that active EI claimants increased their average earnings from $19,325 in the fifth year pre-program to $56,131 in the fifth year after the program start year. Former EI claimants increased their average earnings from $21,772 in the fifth year pre-program to $58,158 in the fifth year after the program start year. After participating in the program, both active and former claimants also decreased their dependence on government income supports.
Recommendations
Since 2012, 15 qualitative and quantitative studies addressed issues and questions related to EBSM design, delivery and effectiveness. The quantitative studies successfully assessed the effectiveness and efficiency of EBSMs by producing incremental impacts and cost-benefit analysis. The qualitative studies help to contextualize the findings from the quantitative studies and to identify specific challenges, lessons learned and best practices associated with the design and delivery of EBSMs. Each study included key considerations for program and policy development or recommendations.
In addition, the recently completed evaluation of the Workforce Development Agreements complements the LMDA qualitative studies. This comprehensive evaluation provided unique insights into challenges and lessons learned to assist persons with disabilities, immigrants and those further removed from the labour market.
Most results from this evaluation stem from the conduct of advance causal analysis whereby impacts found could be attributed to a specific EBSM. These analyses are predicated on having access to high quality administrative records, thereby confirming the importance of the capacity to leverage and integrate relevant administrative data.
From these main findings, 2 key recommendations emerge:
Recommendation #1: ESDC and provinces/territories are encouraged to share and discuss lessons learned, best practices and challenges associated with the design and delivery of EI-funded provincial/territorial programming. Discussions are encouraged at the bilateral or multilateral levels as well as with service delivery network if necessary.
Recommendation #2: ESDC and provinces/territories are encouraged to pursue efforts to maintain and strengthen data collection provisions in support of reporting, performance measurement and data-driven evaluations at the national and provincial/territorial levels. To that regard, ESDC should:
- continue to prioritize data integrity, including validating data uploads and documenting changes over time
- explore ways of accessing data on social assistance, unsuccessful EI applicants, and immigration and citizenship, in light of expanded eligibility to the LMDAs beyond active and former EI claimants
Management response and action plan
Overall management response
ESDC would like to thank all members of the Labour Market Development Agreements (LMDA) Evaluation Steering Committee for their valuable contributions to the evaluation of the LMDAs.
Recommendation #1
ESDC and provinces/territories are encouraged to share and discuss lessons learned, best practices and challenges associated with the design and delivery of EI-funded provincial/territorial programming. Discussions are encouraged at the bilateral or multilateral levels as well as with service delivery network if necessary.
Management response
As the evaluation demonstrates, participation in most LMDA programs similar to Employment Benefit and Support Measures (EBSMs) improves labour market attachment and reduces dependence on government income supports compared to similar non-participants. For example, a survey conducted after program participation in the Self-Employment program demonstrates that participants increased their employment levels from 59% to 74%. EI claimants who participated in Skills Development activities while collecting EI benefits reduced their use of EI benefits and had higher annual earnings ($2,508 higher on average) than those who did not take training.
To identify further opportunities to enhance participant outcomes under the LMDAs, ESDC will encourage discussions with provinces and territories on the lessons learned, best practices and challenges associated with the design and delivery of programs similar to EBSMs through existing bilateral and multilateral forums.
Management action plan
The Skills and Employment Branch, ESDC, will explore opportunities through existing bilateral and multilateral forums to discuss with provinces and territories the lessons learned, best practices and challenges associated with the design and delivery of programs similar to EBSMs.
Completion Date: April 1, 2024
Recommendation #2
ESDC and provinces/territories are encouraged to pursue efforts to maintain and strengthen data collection provisions in support of reporting, performance measurement and data-driven evaluations at the national and provincial/territorial levels. To that regard, ESDC should:
- continue to prioritize data integrity, including validating data uploads and documenting changes over time
- explore ways of accessing data on social assistance, unsuccessful EI applicants, and immigration and citizenship, in light of expanded eligibility to the LMDAs beyond active and former EI claimants
Management response
ESDC will explore opportunities to engage with provinces and territories on performance measurement and evaluation in order to improve reporting and better demonstrate results for Canadians.
Management action plan
2.1 The Skills and Employment Branch, ESDC, will engage with provinces and territories to develop an approach to strengthen data integrity and reporting to Canada, which will help ensure a continuous monitoring of trends.
Completion Date: April 1, 2024
2.2. ESDC will continue to support efforts led by Strategic and Service Policy Branch, to explore possible data development options aiming to improve, refine and allow more flexibilities for upcoming policy analysis, research and evaluations activities.
Completion Date: September, 2024
Introduction
Employment and Social Development Canada (ESDC) worked jointly with 12 provinces and territories to undertake the 2018 to 2023 third cycle for the Labour Market Development Agreement (LMDA) evaluations.
The first cycle of LMDA evaluations was carried out from 1998 to 2012. It involved the conduct of separate formative and summative evaluations in all provinces and territories under the guidance of bilateral Joint Evaluation Committees.
Building on lessons learned and best practices from the first cycle, the second cycle of LMDA evaluations was undertaken between 2012 and 2017. The second cycle was designed and implemented under the guidance of a federal-provincial/territorial LMDA Evaluation Steering Committee.Footnote 5 The work was supported by bilateral discussions at Joint Evaluation Committees.
Under the second cycle, studies generated evaluation evidence on the effectiveness, efficiency and design and delivery of Employment Benefits and Support Measures (EBSMs). Findings and conclusions from up to 9 studies were summarized in 1 national and 12 bilateral reports for public release.
The third LMDA evaluation cycle builds on the success of the second cycle. The aim is to fill in knowledge gaps about the effectiveness, efficiency, and design and delivery of EBSMs. The evaluation cycle was designed and implemented under the guidance of a federal-provincial/territorial LMDA Evaluation Steering Committee composed of ESDC and 12 participating provinces and territories.Footnote 6
This report presents a summary of the third cycle evaluation findings from 9 studies.Footnote 7
Labour Market Development Agreements
The LMDAs are bilateral agreements between Canada and each province and territory for the design and delivery of EBSM programs and services. They were established under Part II of the 1996 Employment Insurance (EI) Act.
In fiscal year 2020 to 2021, Canada transferred nearly $2.5 billion (including nearly $186.6 million in administration funds) to provinces and territories.Footnote 8 Each province and territory is responsible for the design and delivery of programs and services aimed at assisting individuals to prepare for, obtain, and maintain employment.
As of February 2010, the delivery of EBSMs became fully devolved to all provinces and territories. Table 1 provides the key dates related to the LMDAs’ devolution and recent LMDA expenditures by jurisdiction.
| Province / Territory | Devolution date | 2018 to 2019 | 2019 to 2020 | 2020 to 2021 |
|---|---|---|---|---|
| British Columbia | February 2, 2009 | $320,325,994 | $321,242,200 | $324,175,000 |
| Alberta | November 1, 1997 | $166,560,149 | $174,226,603 | $192,380,000 |
| Saskatchewan | January 1, 1999 | $48,105,020 | $ 50,028,901 | $54,371,000 |
| Manitoba | November 27, 1997 | $55,820,088 | $56,883,703 | $61,704,000 |
| Ontario | January 1, 2007 | $700,423,363 | $707,753,826 | $741,361,740 |
| Quebec | April 1, 1998 | $688,104,016 | $688,291,329 | $706,505,000 |
| Newfoundland & Labrador | November 2, 2009 | $142,334,176 | $145,579,812 | $150,306,000 |
| Nova Scotia | July 1, 2009 | $96,166,239 | $ 97,991,656 | $101,182,000 |
| New Brunswick | April 1, 1997 | $107,078,366 | $107,755,844 | $111,497,000 |
| Prince Edward Island | October 5, 2009 | $28,965,942 | $29,050,151 | $29,755,000 |
| Nunavut | April 1, 2000 | $3,769,642 | $ 3,799,455 | $3,954,000 |
| Northwest Territories | October 1, 1998 | $4,705,577 | $4,699,339 | $4,766,000 |
| Yukon | February 1, 2010 | $4,397,899 | $ 4,453,652 | $4,669,000 |
| Total | n/a | $2,366,756,471 | $2,391,756,471 | $2,486,625,740 |
Source: EI Monitoring and Assessment Reports (2018 to 2019, 2019 to 2020, and 2020 to 2021).
LMDA programs and services are classified under 2 categories:
- Employment benefitsFootnote 9,Footnote 10 fall into 5 sub-categories:
- Skills Development
- Targeted Wage Subsidies
- Self-Employment
- Job Creation Partnerships
- Targeted Earnings SupplementsFootnote 11
- Support measures fall into 3 sub-categories:
- Employment Assistance ServicesFootnote 12
- Labour Market Partnerships
- Research and Innovation
Provinces and territories have the flexibility to adapt EBSMs to their jurisdiction’s context as long as they are consistent with Part II of the EI Act.Footnote 13
The objective of EBSMs is to assist individuals to obtain or keep employment through various active employment programs, including training or employment assistance services. Successful delivery of EBSMs is expected to result in participants receiving needed services, a quick return to work, and savings to the EI account.
Programs and services examined in this study include:
Employment benefits
Skills Development (SD) provides direct financial assistance to individuals to select, arrange, and pay for training. Training is tailored to the needs of participants through counselling and career orientation, and averages 48.5 weeks. It can include adult-based education, literacy and essential skills, language training, short-term training and occupational training leading to certification from an accredited institution.
Targeted Wage Subsidies (TWS) subsidize the wages of individuals whom employers would not ordinarily hire. Subsidies range in duration from 16 to 52 weeks, with the maximum level ranging from 50% to 100% of the employee’s wage.
Job Creation Partnerships (JCP) support community-oriented projects that provide work experience to participants. Participants can take part in a finite project for up to 52 weeks.
Self-Employment provides financial assistance and business planning advice to participants to help them start their own business.
Support measures
Employment Assistance Services (EAS) support individuals as they prepare to enter or re-enter the workforce or assist them to find a better job. Services include job search services, career development and counselling, and résumé writing assistance. These services are light touch interventions due to their very short duration, and can be provided on a one-on-one basis or in a group setting. A typical intervention lasts less than 1 day, but a participant may receive multiple short interventions over a few weeks. These services are generally provided in combination with more intensive interventions.
Labour Market Partnerships seek to deal with labour force adjustments and meet human resources requirements. They enable employers, employee or employer associations, community groups, and communities to work together to develop or implement strategies.
Research and Innovation initiatives seek to identify better ways of helping people prepare for, return to or keep employment, and be productive participants in the labour force.
Eligible participants covered in this study
The incremental impacts are estimated for active and former EI claimants:
- active claimants are participants who started an EBSM intervention while collecting EI benefits
- former claimants are participants who started an EBSM intervention up to 3 years after the end of their EI benefitsFootnote 14
Table 2 provides an overview of the share of funding allocated to EBSMs and the average cost per participant. It is noted that the average cost per participant is calculated based on the 2010 to 2012 data from the EI Monitoring and Assessment Reports. The 2010 to 2012 period corresponds with the cohort of participants selected for incremental impacts and cost-benefit analysis in the LMDA evaluation.
From the 2010 to 2012 time period to the 2020 to 2021 fiscal year, investments in SD decreased by 13 percentage points and those in Self-Employment decreased by 4 percentage points. The largest increases in funding are noted for Research and Innovation (+9 percentage points) and Labour Market Partnerships (+5 percentage points).
| Employment Benefits and Support Measures | Share of funding (2010 to 2012 years) | Share of funding (year 2020 to 2021) | Average cost – active claimants (2010 to 2012) | Average cost – former claimants (2010 to 2012) |
|---|---|---|---|---|
| Skills Development | 52% | 39% | $10,193 | $10,052 |
| Employment Assistance Services | 30% | 31% | $826 | $826 |
| Labour Market Partnerships | 7% | 12% | n/a | n/a |
| Self-Employment | 6% | 2% | $15,551 | $15,833 |
| Targeted Wage Subsidies | 3% | 5% | $7,538 | $7,384 |
| Job Creation Partnerships | 2% | 2% | $11,750 | $10,940 |
| Research and Innovation | <1% | 10% | n/a | n/a |
Sources: EI Monitoring and Assessment Reports for fiscal years 2010 to 2011, 2011 to 2012 and 2020 to 2021.
Methodology
This section presents key aspects of the quantitative analyses carried out as part of the LMDA studies.
All quantitative analyses are based on administrative data from the EI Part I (EI claim data) and Part II (EBSM participation data). The EI Part I and II data are then linked to the T1 and T4 taxation files from the Canada Revenue Agency. Incremental impact and cost-benefit analyses are based on up to 100% of participants who began their EBSM participation in 2010 to 2012.
The 2010 to 2012 timeframe was selected in order to assess the impacts of EBSMs in the years following participation. Impacts were assessed over a period of at least 4 years after program completion up to the 2017 calendar year (most recent available information at the time of this evaluation).
Incremental impacts analysisFootnote 17
Program effectiveness is assessed by estimating incremental impacts from EBSM participation on participants’ labour market experience. That is, earnings from employment and self-employment, incidence of employment, use of EI, use of Social Assistance (SA), and dependence on government income supports after participation.
The role of the incremental impact analysis is to isolate the effects of participation from other factors. In order to achieve this, the incremental impact analysis compares the labour market experience of participants before and after their participation with that of similar non-participants. Figure1 presents an example of incremental impact calculation.
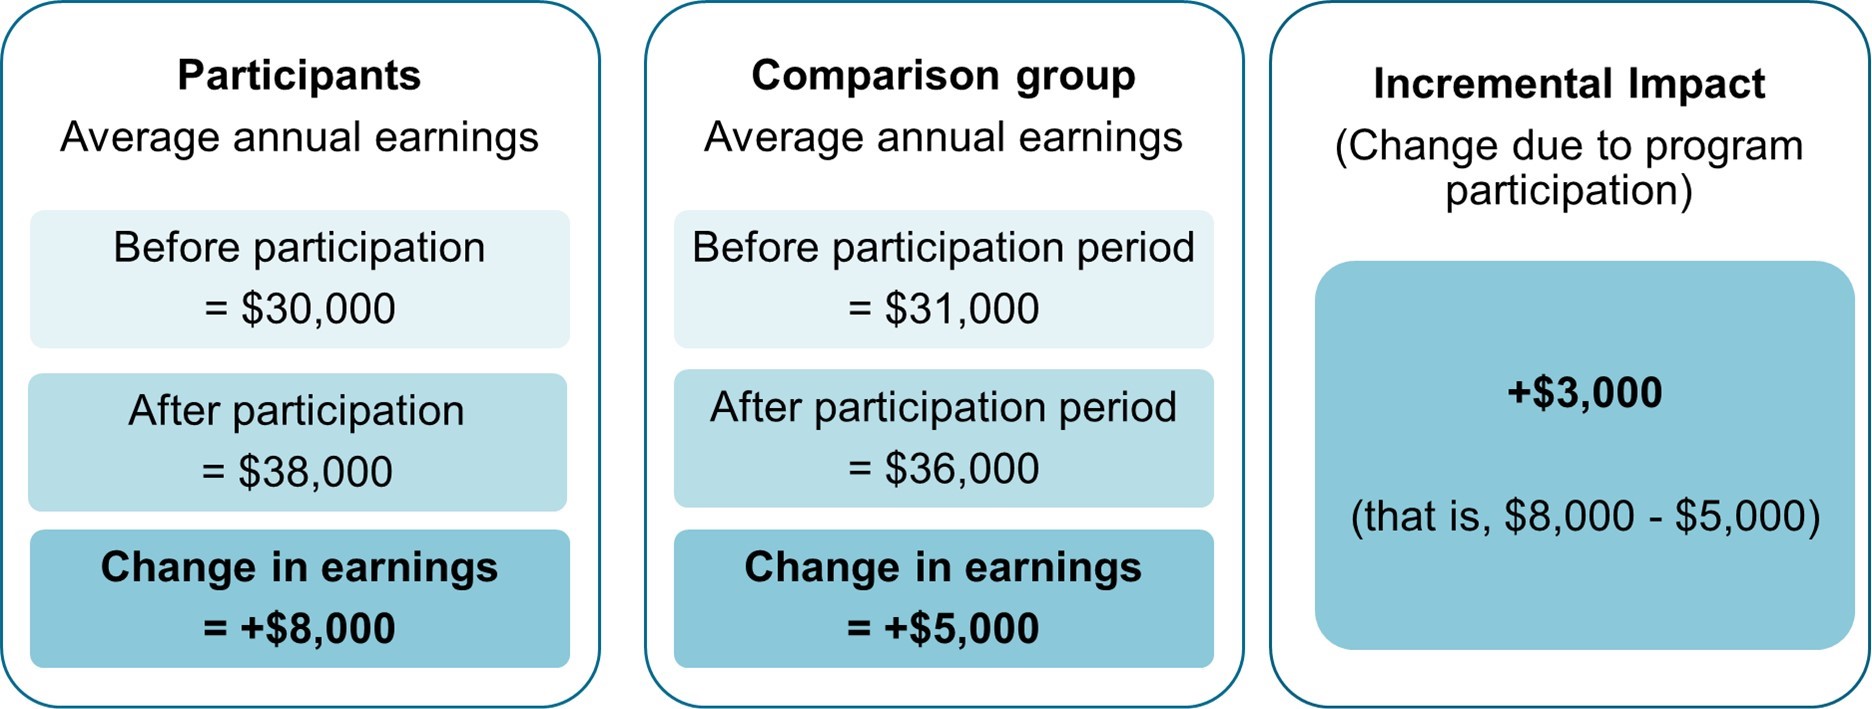
Text description – Figure 1
Incremental impacts are the difference in the pre-post participation outcomes between participants and similar non-participants.
For example:
- if the average annual earnings of participants are $30,000 before participation and $38,000 after participation, the change in earning for participants is an increase of $8,000
- if the average annual earnings in the comparison group are $31,000 before participation and $36,000 after participation, the change in earnings for the comparison group is an increase of $5,000
- the incremental impact, that is the change attributed to program participation, is $8,000 minus $5,000, which equals an increase of $3,000
The main estimator used is propensity score kernel matching technique combined with difference-in-differences estimator. Moreover, 3 different state-of-the-art estimation techniques (Inverse Probability Weighting, Nearest Neighbour and Cross-sectional Matching) were carried out separately for each type of EBSMs and EI claimants in order to validate the impact estimates.
As for previous LMDA evaluation studies, the Action Plan Equivalent is the unit of analysis used. Action Plan Equivalents regroup all EBSMs received by an individual within less than 6 months between the end of one EBSM and the start of the next. Action Plan Equivalents are categorized based on the longest EBSM they contain, except for EAS-only Action Plan Equivalents which include only EAS interventions.
The analysis includes Action Plan Equivalents that consist only of LMDA interventions. Action Plan Equivalents that include a combination of LMDA and other labour market programs funded by ESDC, were excluded from the participant sample.
The matching of participants and comparison group members used up to 75 socio-demographic and labour market variables observed over 5 years before participation. Two different comparison groups were used to measure impacts for active and former EI claimants.
For active claimants, incremental impacts were measured relative to a comparison group of active claimants who were eligible to, but did not, participate in EBSMs during the reference period.
For former claimants, the comparison group was created using individuals who participated in EAS only during the reference period.Footnote 18 In other words, the experience of former claimants in SD, TWS, or JCP interventions is compared to the experience of former claimants who received EAS only. This is a conservative approach given the fact that participation in EAS can lead to limited effects on labour market outcomes.
Due to this difference in measurement, incremental impacts estimated for active claimant participants should not be directly compared to those of former claimant participants.
Impacts are generated over 4 years for SD, JCP and TWS, while a fifth year is estimated for participants in EAS.Footnote 19
Factors accounted for in the cost-benefit analysisFootnote 20,Footnote 21
Building on the results of the incremental impacts, program efficiency is assessed through a cost-benefit analysis. The analysis compares the participants’ cost of participating and the government’s cost of delivering the program to the benefits associated with the program. Overall, this analysis provides insights on the extent to which the program is efficient for society (that is, for both participants and the government).
Sources of data and information
The analysis takes into account all the quantifiable costs and benefits directly related to EBSM delivery and participation that can be measured given the information available. The analysis is comprehensive in that it accounts for the vast majority of possible direct costs and benefits.
However, the analysis does not account for all costs and benefits. For example, there are factors that can lead to an understatement of the benefits (for example, positive spillovers to other family members) and other factors that can lead to an overstatement of the benefits (for example, effects on skill prices or displacement).
This study relied on integrated data from the EI Part I and II Databank and Income Tax records from the Canada Revenue Agency. Information about earnings, use of EI, and use of social assistance was taken from the study of incremental impacts.Footnote 22 The program costs were calculated using information available in the EI Monitoring and Assessment Reports.
Relative to the previous cycle of evaluation, the methodology has been extended to incorporate one of the indirect health benefits associated with increased labour market attachment. In particular, the methodology includes an estimate of the change in public health care cost due to the decline in health care utilization resulting from program participation.
Data on average public healthcare costs by income quintiles are taken from the report Lifetime Distributional Effects of Publicly Financed Health Care in Canada (2013) by the Canadian Institute for Health Information.
Program costs are measured using information on LMDA expenditures and new interventions reported in the EI Monitoring and Assessment Reports. Other costs and benefits are assessed using integrated administrative data from the EI Part I and II databank and the Canada Revenue Agency.
Incremental impacts measured over the second year of participation and up to 5 post-program years are discounted by 3% to bring them to a common base with the program cost and benefits incurred in the program start year. This 3% rate accounts for the interest the government could have collected if the funds used to pay for the program had been invested. Incremental impacts are estimated using 2010 constant dollars and this accounts for inflation.
The costs and benefits accounted for in the calculations
Program costs: costs incurred by the government for delivering the program (that is, administration and direct program costs calculated from data reported in the EI Monitoring and Assessment Reports).
Marginal social cost of public funds: loss incurred by society when raising additional revenues such as taxes to fund government spending. The value is estimated at 20% of the program cost, sales taxes, income taxes, impacts on EI and impacts on SA paid or collected by the government.
Foregone earnings: estimated net impacts on participants’ earnings during the participation period. During labour market program participation, some individuals have lower earnings than what they would have received if they had not participated.
Employment earnings: incremental impacts on participants’ earnings during and after participation. In-program earnings represent the foregone earnings for participants.
Fringe benefits: the employer-paid health and life insurance as well as pension contributions. They are estimated at 15% of the incremental impacts on earnings.
Federal and provincial income taxes: incremental impacts on federal, provincial and territorial taxes paid by participants.
Sales taxes: the sales taxes paid by participants estimated as incremental impacts on earnings multiplied by the propensity to consume (97%), the proportion of household spending on taxable goods and services (52%) and the total average federal and provincial sales tax rate (11%).
Social assistance and Employment Insurance benefits collected: incremental impacts on SA and EI benefits use by participants following participation.
Canada Pension Plan and Quebec Pension Plan contribution and EI premiums: these contributions and premiums were identified from the Canada Revenue Agency data and then, the incremental impacts on Canada Pension Plan and Quebec Pension Plan contributions and EI premiums were estimated.
Public health care costs: estimated impact of participation in EBSMs on public health care costs shown as an average change per participant over the post-program period examined.
Strengths and limitations of the studies
One of the key strengths from the studies is that all quantitative analyses are based on administrative data rather than survey responses. Compared to survey data, administrative data are not subject to recall errors or response bias.
The propensity score models used to match participants and non-participants for the incremental impact analyses are judged to be robust. In part, this is because they were based on 5 years of pre-participation data. Moreover, these models are based on a vast array of variables including sociodemographic characteristics, location, skill level related to last occupation, and indicators of labour market attachment.
However, the matching process can be further refined for specific subgroups if the following information is available in the future:
- persons with disabilities: the type and severity of the disability, and the capacity/willingness to work full-time
- recent immigrants: the country of origin, the proficiency in English or French, and the relevance of credentials and work experience
- visible minorities: place of birth; individuals who are born outside of Canada face different challenges compared to those born in Canada
Refining the matching process for population subgroups could broaden the scope for greater Gender-based Analysis Plus.
Sensitivity analysis and the use of alternative estimation methods have increased confidence in the incremental impact estimates. However, one limitation with the propensity score matching techniques is that no one can be fully sure the impacts are not influenced by factors not captured in the data.
The cost-benefit analysis accounted for all quantifiable costs and benefits directly attributable to the EBSMs and could be estimated with the available administrative data. It is furthered strengthened by incorporating one of the indirect benefits, which is the change in public health care expenditures associated with program participation. However, the analysis did not account for non-quantifiable factors that can lead to an understatement of the benefits (for example, positive spillovers to other family members) and factors that can lead to an overstatement of the benefits (for example, effects on skill prices or displacement).
In some studies that use qualitative data collection methods, the number of key informants interviewed is relatively small in some provinces and territories. Responses provided by key informants reflect their own experience and their own region, and may not be fully representative of the entire province and territory.
Overview of the studies summarized in this report
The findings in this report are drawn from 9 separate studies carried out at the national level. These studies examine issues related to program effectiveness, efficiency, design/delivery and used a mix of qualitative and quantitative methods. Appendix B presents an overview of these studies. The studies are:
- Examination of the medium-term outcomes from 2010 to 2017
- Estimation of the medium-terms incremental impacts from 2010 to 2017
- Cost-benefit analysis of Employment Benefits and Support Measures
- Cost-Benefit Analysis: Incorporating Public Health Care Costs Savings in the Context of the Labour Market Programs Evaluation
- Heterogeneity of treatment effects
- Design and delivery of the Job Creation Partnerships program
- Design and delivery of the self-employment program
- Design and delivery of the Labour Market Partnerships program
- Design and delivery of the Research and Innovation support measure
Evaluation findings
Profile of participants
Across Canada, nearly 609,000 EI active and former claimants participated in LMDA programs and services between 2010 and 2012. The profile of participants is presented in Table 3.
The profile of participants is presented in Table 3 by gender, age, sociodemographic group, and marital status. Information about their educational attainment, occupation and industry is based on the latest job they held prior to applying for EI benefits. Information about sociodemographic groups is self-reported.
| Categories | Active claimants | Former claimants |
|---|---|---|
| Number of participants | 367,964 | 240,857 |
| Gender: Female | 49% | 50% |
| Gender: Male | 51% | 50% |
| Age: 30 and under | 27% | 31% |
| Age: 31 to 54 | 59% | 58% |
| Age: 55 and over | 14% | 12% |
| Sociodemographic group: Indigenous | 4% | 8% |
| Sociodemographic group: Person with disability | 5% | 8% |
| Sociodemographic group: Visible minority | 5% | 6% |
| Sociodemographic group: Recent immigrant | 4% | 4% |
| Marital status: Married or common-law | 43% | 34% |
| Marital status: Widow / divorced / separated | 13% | 14% |
| Marital status: Single | 41% | 46% |
| Education or skills level: High school or occupational training | 39% | 39% |
| Education or skills level: On-the-job training | 23% | 27% |
| Education or skills level: College, vocational education or apprenticeship training | 28% | 25% |
| Education or skills level: University degree | 5% | 4% |
*Values may not equal 100% due to rounding or missing information.
Top 3 occupational groups for EBSMs participants
Active claimants:
- semi-skilled manual workers =14%
- clerical personnel =14%
- other manual workers =13%
Former claimants:
- other manual workers =14%
- semi-skilled manual workers =14%
- clerical personnel =12%
Top 3 industries for EBSMs participants
Active claimants:
- manufacturing = 15%
- retail trade = 11%
- construction = 10%
Former claimants:
- manufacturing = 14%
- retail trade = 12%
- administrative and support, waste management and remediation services = 11%
As presented in Table 4, in the year before program participation, former claimants have lower levels of employment and earnings than active claimants. Former claimants also have a higher dependence on SA.
| Pre-EBSM participation employment characteristics | Active claimants | Former claimants |
|---|---|---|
| Average employment earnings | $24,910 | $12,547 |
| Percentage employed | 99% | 82% |
| Percentage on SA | 6% | 19% |
Incremental impacts for active and former EI claimants
The incremental impact results presented below are generally consistent with those found as part of the second LMDA evaluation cycle.
Incidence of employment
Chart 1 presents the incremental impacts on the incidence of employmentFootnote 23 for active and former claimants by type of program. The estimates can be interpreted as a change in the probability of being employed following participation.
Active claimants in SD, TWS and JCP increase their incidence of employment relative to similar non-participants. Former claimants in SD, TWS and JCP increase their incidence of employment relative to similar participants who receive only EAS.
Active claimants in EAS-only experience a small positive, but not statistically significant, impact on their incidence of employment. EAS are relatively modest activities such as counselling, job search assistance and case management, which focus on quicker returns to work for participants. EAS supports that are not provided with longer interventions, are not expected to increase participants’ skills or influence their employment levels to a large extent.
*The impact is non-statistically significant, however, it is still valid in terms of informing the direction of the impact (negative or positive).
Note: Impacts are estimated over 4 post-program years (or 5 years in the case of EAS).
Text description – Chart 1
| Program name | Incidence of employment for active claimants (percentage points) | Incidence of employment for former claimants (percentage points) |
|---|---|---|
| Skills Development | 4.0 | 2.5 |
| Employment Assistance Services | 0.3* | n/a |
| Targeted Wage Subsidies | 3.8 | 6.2 |
| Job Creation Partnerships | 4.8 | 2.5 |
*The impact is non-statistically significant, however, it is still valid in terms of informing the direction of the impact (negative or positive).
Note: Impacts are estimated over 4 post-program years (or 5 years in the case of EAS).
Employment earnings
Chart 2 presents the average annual increase in employment earnings for active and former EI claimants over the 4 years post-participation. Active EI claimants in SD, TWS, JCP, and EAS increase their employment earnings compared to similar non-participants.
Former EI claimants in SD and TWS increase their employment earnings relative to similar participants who receive only EAS services. Former claimants in JCP have lower employment earnings compared to similar participants in only EAS services.
Note: Impacts are estimated over 4 post-program years (or 5 years in the case of EAS).
Text description – Chart 2
| Program name | Employment earnings of active claimants | Employment earnings of former claimants |
|---|---|---|
| Skills Development | $2,508 | $768 |
| Employment Assistance Services | $376 | n/a |
| Targeted Wage Subsidies | $1,648 | $1,945 |
| Job Creation Partnerships | $1,208 | -$1,102 |
Note: Impacts are estimated over 4 post-program years (or 5 years in the case of EAS).
Use of EI benefits
As shown in Chart 3, active claimants reduce their use of EI benefits in the post-program period compared to similar non-participants. In the post-program period, former claimants in SD, TWS and JCP increase their EI benefits use relative to similar participants who receive EAS services only.
In the case of SD and TWS, the increase in the use of EI by former claimants is consistent with previous evaluations and is not necessarily a negative impact. Following participation, former claimants are likely to requalify for EI benefits due to their stronger labour market attachment demonstrated by increases in their incidence of employment and earnings.
The increase in the use of EI for former claimants in JCP is a negative impact given the decrease in employment earnings. Therefore, for former EI claimants, this intervention will not be effective from a cost-benefit perspective. However, the supplemental study for JCP confirmed that the program has added value for participants, employers, and communities that cannot be taken into account.
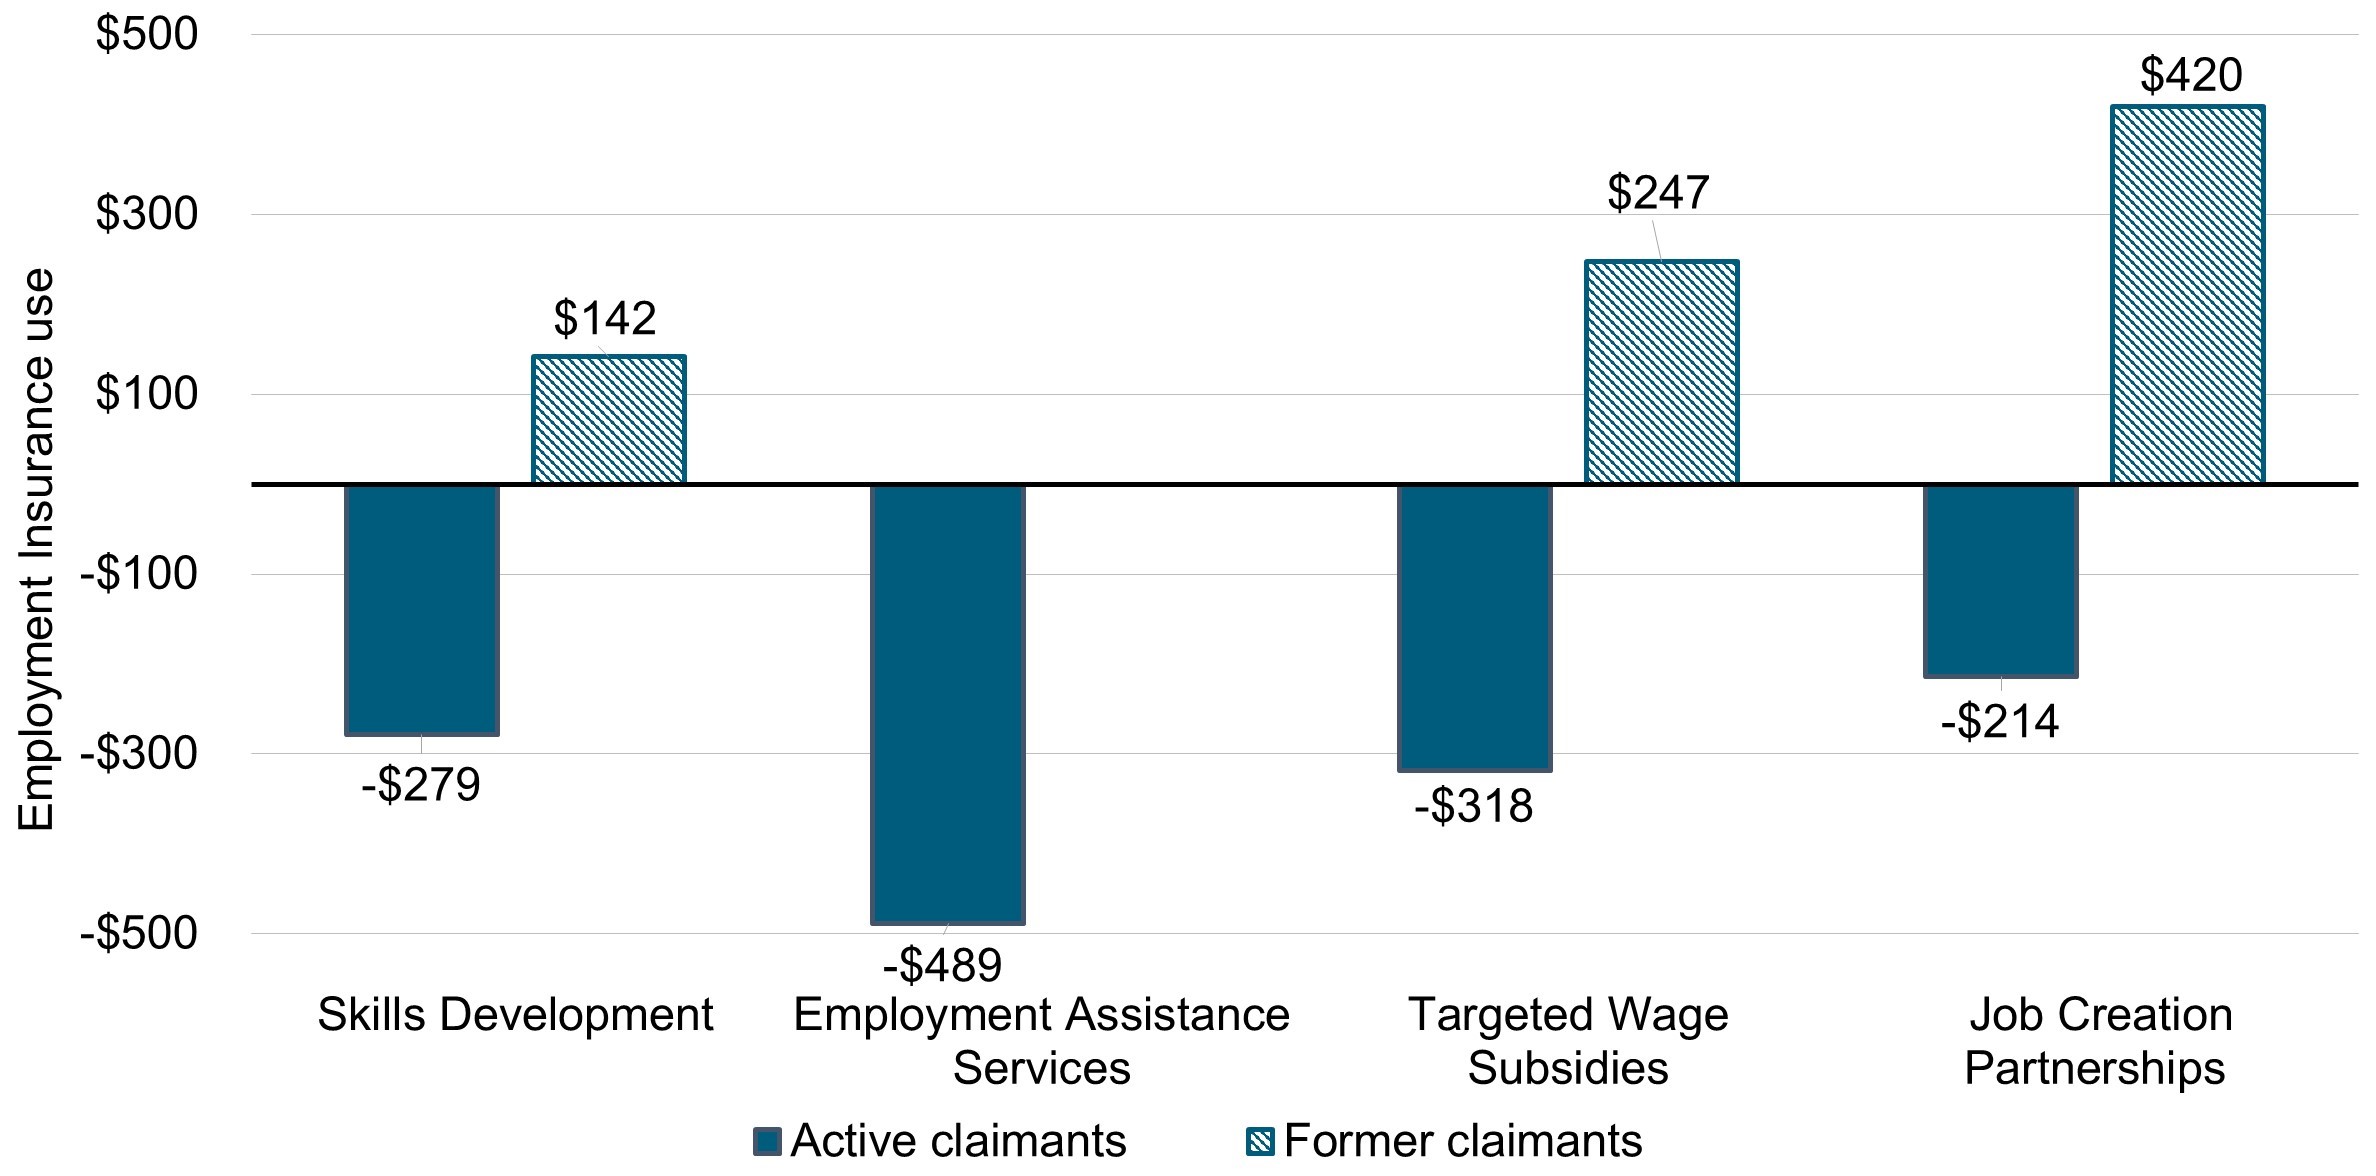
Note: Impacts are estimated over 4 post-program years (or 5 years in the case of EAS).
Text description – Chart 3
| Program name | Use of EI benefits for active claimants | Use of EI benefits for former claimants |
|---|---|---|
| Skills Development | -$279 | $142 |
| Employment Assistance Services | -$489 | n/a |
| Targeted Wage Subsidies | -$318 | $247 |
| Job Creation Partnerships | -$214 | $420 |
Note: Impacts are estimated over 4 post-program years (or 5 years in the case of EAS).
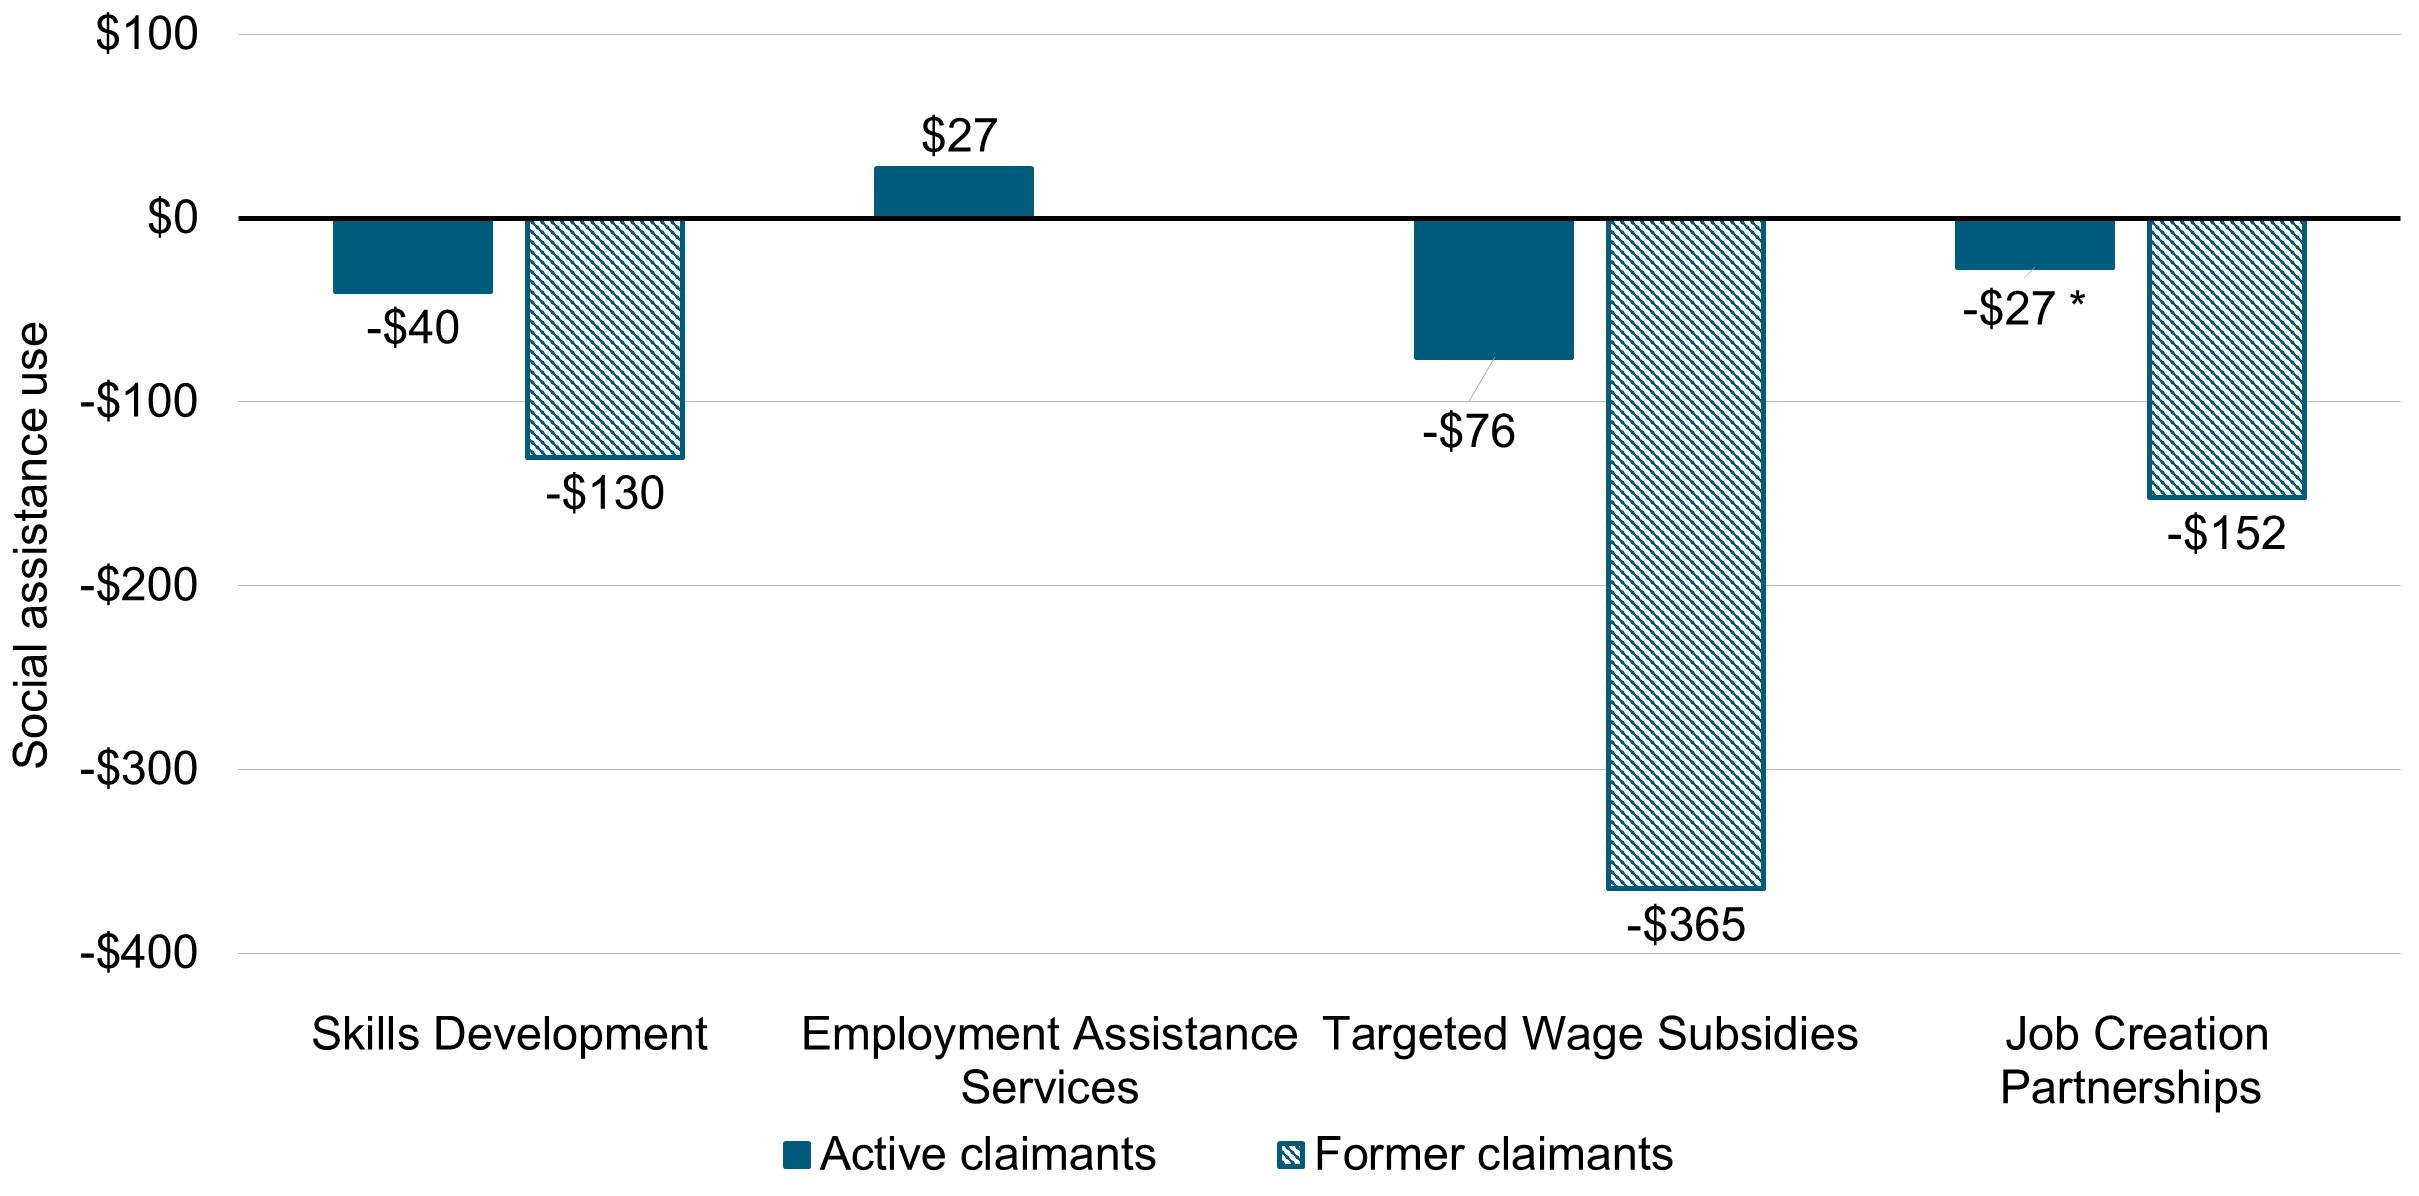
Use of social assistance (SA) benefits
As shown in Chart 4, most active and former EI claimant participants decrease their use of SA benefits in the post-program period.
Active EI claimants in SD and TWS decrease their use of SA benefits in the post-program period compared to similar non-participants. Active EI claimants in EAS services experience a small increase in the use of SA benefits compared to similar non-participants.Footnote 24
Former EI claimants in SD, TWS and JCP decrease their use of SA benefits compared to similar participants in only EAS services.
*The impact is non-statistically significant, however, it is still valid in terms of informing the direction of the impact (negative or positive).
Note: Impacts are estimated over 4 post-program years (or 5 years in the case of EAS).
Text description – Chart 4
| Program name | Use of SA benefits for active claimants | Use of SA benefits for former claimants |
|---|---|---|
| Skills Development | -$40 | -$130 |
| Employment Assistance Services | $27 | n/a |
| Targeted Wage Subsidies | -$76 | -$365 |
| Job Creation Partnerships | -$27* | -$152 |
*The impact is non-statistically significant, however, it is still valid in terms of informing the direction of the impact (negative or positive).
Note: Impacts are estimated over 4 post-program years (or 5 years in the case of EAS).
Dependence on income support
As shown in Chart 5, overall active and former claimants reduce their dependence on government income supports.
*The impact is non-statistically significant, however, it is still valid in terms of informing the direction of the impact (negative or positive).
Note: Impacts are estimated over 4 post-program years (or 5 years in the case of EAS).
Text description – Chart 5
| Program name | Dependence on government income support for active claimants (percentage points) | Dependence on government income support for former claimants (percentage points) |
|---|---|---|
| Skills Development | -1.8 | -1.0 |
| Employment Assistance Services | -2.1 | n/a |
| Targeted Wage Subsidies | -2.5 | -3.1 |
| Job Creation Partnerships | -0.5* | -1.6 |
*The impact is non-statistically significant, however, it is still valid in terms of informing the direction of the impact (negative or positive).
Note: Impacts are estimated over 4 post-program years (or 5 years in the case of EAS).
Incremental impacts by subgroups of participants
Female participants
Nearly 300,350 EI active and former claimant participants in LMDA programs and services, between 2010 and 2012 are female, representing nearly 49% of participants.
The profile of female participants is presented in Table 5 by age, sociodemographic group, and marital status. Information about their educational attainment, occupation and industry is based on the latest job they held prior to applying for EI benefits. Information about sociodemographic groups is self-reported.
| Categories | Active claimants | Former claimants |
|---|---|---|
| Number of participants | 179,882 | 120,469 |
| Age: 30 and under | 24% | 30% |
| Age: 31 to 54 | 62% | 59% |
| Age: 55 and over | 14% | 11% |
| Sociodemographic group: Indigenous individual | 4% | 8% |
| Sociodemographic group: Person with disability | 5% | 7% |
| Sociodemographic group: Visible minority | 4% | 6% |
| Sociodemographic group: Recent immigrant | 4% | 4% |
| Marital status: Married or common-law | 43% | 38% |
| Marital status: Widow / divorced / separated | 17% | 18% |
| Marital status: Single | 37% | 41% |
| Education or skills level: High school or occupational training | 44% | 44% |
| Education or skills level: On-the-job training | 18% | 22% |
| Education or skills level: College, vocational education or apprenticeship training | 25% | 22% |
| Education or skills level: University degree | 6% | 5% |
*Values may not equal 100% due to rounding or missing information.
Top 3 occupational groups for female participants
Active claimants:
- clerical personnel = 20%
- intermediate sales and service personnel = 17%
- other sales and service professionals = 11%
Former claimants:
- intermediate sales and service personnel = 20%
- clerical personnel = 18%
- other sales and service professionals = 15%
Top 3 industries for female participants
Active claimants:
- retail trade = 13%
- manufacturing = 11%
- healthcare and SA = 10%
Former claimants:
- retail trade = 15%
- accommodation and food services = 12%
- healthcare and SA = 10%
Main findings: Female participants improve their labour market attachment through increases in their incidence of employment and earnings. Excluding JCP, participants also decrease their dependence on government income supports. While female former claimants increase their use of EI benefits irrespective of the program received, only JCP participants saw an increase in their dependence on government income supports.
Table 6 presents the detailed incremental impacts.
For example, the results reveal that relative to similar non-participants female active claimants in SD have higher annual earnings (+$1,964 per year) and increase their incidence of employment (+4.7 percentage points). They also depend less on government income supports (-2.4 percentage points), by decreasing their use of EI (-$318 per year) and SA (-$75 per year) benefits.
Female former claimants in TWS increase their annual earnings (+$1,478 per year) and incidence of employment (+5.6 percentage points) compared to similar participants in EAS only. They also lower their reliance on government income supports (-2.3 percentage points), mostly by decreasing their use of SA benefits (-$344).
| Indicator | SD active claimants | SD former claimants | TWS active claimants | TWS former claimants | JCP active claimants | JCP former claimants | EAS active claimants |
|---|---|---|---|---|---|---|---|
| Incidence of employment (percentage points) | 4.7*** | 2.4*** | 5.4*** | 5.6*** | 6.6*** | 5.3*** | 1.4*** |
| Employment earnings ($) | 1,964*** | 679*** | 1,485*** | 1,478*** | 1,724*** | 614 | 605** |
| EI benefits ($) | -318*** | 113*** | -37 | 350*** | -26 | 635*** | -380*** |
| SA benefits ($) | -75*** | -130*** | -31 | -344*** | -21 | -236*** | 13 |
| Dependence on income support (percentage points) | -2.4*** | -1.0*** | -1.1*** | -2.3*** | 1.7** | 1.3 | -1.6*** |
| n= | 39,034 | 22,546 | 4,511 | 6,319 | 1,460 | 1,259 | 20,224 |
Statistical significance level *** 1%; ** 5%; * 10%, other values are non-statistically significant.
Note: Impacts are estimated over 4 post-program years (or 5 years in the case of EAS).
Male participants
Nearly 308,840 EI active and former claimant participants in LMDA programs and services between 2010 and 2012 are male, representing about 51% of participants.
The profile of male participants is presented in Table 7 by age, sociodemographic group, and marital status. Information about their educational attainment, occupation and industry is based on the latest job they held prior to applying for EI benefits. Information about sociodemographic groups is self-reported.
| Categories | Active claimants | Former claimants |
|---|---|---|
| Number of participants | 188,280 | 120,563 |
| Age: 30 and under | 29% | 31% |
| Age: 31 to 54 | 57% | 56% |
| Age: 55 and over | 14% | 12% |
| Sociodemographic group: Indigenous individual | 5% | 9% |
| Sociodemographic group: Person with disability | 5% | 9% |
| Sociodemographic group: Visible minority | 4% | 5% |
| Sociodemographic group: Recent immigrant | 4% | 3% |
| Marital status: Married or common-law | 42% | 31% |
| Marital status: Widow / divorced / separated | 9% | 10% |
| Marital status: Single | 44% | 52% |
| Education or skills level: High school or occupational training | 33% | 33% |
| Education or skills level: On-the-job training | 27% | 31% |
| Education or skills level: College, vocational education or apprenticeship training | 31% | 29% |
| Education or skills level: University degree | 4% | 4% |
*Values may not equal 100% due to rounding or missing information.
Top 3 occupational groups for male participants
Active claimants:
- semi-skilled manual workers = 21%
- other manual workers = 19%
- skilled crafts and trades = 15%
Former claimants:
- semi-skilled manual workers = 21%
- other manual workers = 21%
- skilled crafts and trades = 15%
Top 3 industries for male participants
Active claimants:
- manufacturing = 18%
- construction = 16%
- administrative and support, waste management and remediation services = 10%
Former claimants:
- manufacturing = 19%
- construction = 16%
- administrative and support, waste management and remediation services = 11%
Main findings: Male participants in SD and TWS improve their labour market attachment through increases in their incidence of employment and employment earnings. They also decrease their dependence on government income support, that is, their combined use of EI and SA benefits. Mixed and non-statistically significant results are found for participants in JCP and EAS.
Table 8 presents the detailed incremental impacts.
For example, the results reveal that relative to similar participants in EAS only, male former claimants in SD have higher annual earnings (+$865 per year) and incidence of employment (+2.5 percentage points). They also depend less on government income supports (-0.9 percentage points), mostly by decreasing their use of SA benefits (-$128).
Male active claimants in TWS have higher annual earnings (+$1,657 per year) and incidence of employment (+3.9 percentage points) compared to similar non-participants. They also lower their income support reliance rate (-2.4 percentage points), by decreasing their use of EI benefits (-$379 per year).
| Indicator | SD active claimants | SD former claimants | TWS active claimants | TWS former claimants | JCP active claimants | JCP former claimants | EAS active claimants |
|---|---|---|---|---|---|---|---|
| Incidence of employment (percentage points) | 3.5*** | 2.5*** | 3.9*** | 6.7*** | 3.4*** | 0.6 | 0.1 |
| Employment earnings ($) | 3,291*** | 865*** | 1,657*** | 2,294*** | 832 | -4,068*** | 544 |
| EI benefits ($) | -224*** | 194*** | -379*** | 133*** | -55 | 284* | -448*** |
| SA benefits ($) | -48*** | -128*** | -51** | -395*** | -3 | -52 | 86*** |
| Dependence on income support (percentage points) | -2.1*** | -0.9*** | -2.4*** | -3.7*** | 0.6 | 2.1** | -1.4*** |
| n= | 44,052 | 20,273 | 4,999 | 7,495 | 1,095 | 1,261 | 20,697 |
Statistical significance level *** 1%; ** 5%; * 10%, other values are non-statistically significant.
Note: Impacts are estimated over 4 post-program years (or 5 years in the case of EAS).
Youth participants
Nearly 172,730 EI active and former claimant participants, between 2010 and 2012, were 30 years of age or younger when they began their program, representing about 28% of participants.
The profile of youth participants is presented in Table 9 by gender, sociodemographic group, and marital status. Information about their educational attainment, occupation and industry are based on the latest job they held prior to applying for EI benefits. Information about sociodemographic groups is self-reported.
| Categories | Active claimants | Former claimants |
|---|---|---|
| Number of participants | 98,805 | 73,922 |
| Gender: Female | 44% | 49% |
| Gender: Male | 56% | 51% |
| Sociodemographic group: Indigenous individual | 5% | 9% |
| Sociodemographic group: Person with disability | 4% | 6% |
| Sociodemographic group: Visible minority | 3% | 4% |
| Sociodemographic group: Recent immigrant | 3% | 3% |
| Marital status: Married or common-law | 23% | 22% |
| Marital status: Widow / divorced / separated | 3% | 5% |
| Marital status: Single | 71% | 69% |
| Education or skills level: High school or occupational training | 36% | 38% |
| Education or skills level: On-the-job training | 28% | 33% |
| Education or skills level: College, vocational education or apprenticeship training | 27% | 24% |
| Education or skills level: University degree | 4% | 3% |
*Values may not equal 100% due to rounding or missing information.
Top 3 occupational groups for youth participants
Active claimants:
- other manual workers = 18%
- clerical personnel = 12%
- semi-skilled manual workers = 12%
Former claimants:
- other manual workers = 18%
- other sales and service professionals = 15%
- intermediate sales and service personnel = 14%
Top 3 industries for youth participants
Active claimants:
- construction = 14%
- retail trade = 13%
- manufacturing = 12%
Former claimants:
- retail trade = 15%
- manufacturing = 12%
- accommodation and food services = 12%
Main findings: Youth in SD and TWS improve their labour market attachment through increases in their incidence of employment and employment earnings. They also decrease their dependence on government income support (that is, the combined use of EI and SA benefits). Mixed and non-statistically significant results are found for participants in JCP and EAS.
Table 10 presents the detailed incremental impacts.
For example, the results reveal that relative to similar non-participants, youth active claimants in SD have higher annual earnings (+$1,887 per year) and incidence of employment (+1.9 percentage points). They also depend less on government income supports (-2.4 percentage points), by decreasing their use of EI (-$349 per year) and SA (-$150 per year) benefits.
Youth former claimants in TWS have higher annual earnings (+$2,122 per year) and incidence of employment (+5.1 percentage points) compared to similar participants in EAS only. They also lower their reliance on government income supports (- 3.3 percentage points), by decreasing their use of SA (- $409).
| Indicator | SD active claimants | SD former claimants | TWS active claimants | TWS former claimants | JCP active claimants | JCP former claimants | EAS active claimants |
|---|---|---|---|---|---|---|---|
| Incidence of employment (percentage points) | 1.9** | 2.9*** | 4.1*** | 5.1*** | -1.2 | 3.0*** | 0.1 |
| Employment earnings ($) | 1,887*** | 1,144*** | 2,345*** | 2,122*** | -1,857 | -911 | 218 |
| EI benefits ($) | -349*** | 209*** | -7 | 211*** | -284 | 463*** | -432*** |
| SA benefits ($) | -150*** | -140*** | -67* | -409*** | -188* | -171* | 46* |
| Dependence on income support (percentage points) | -2.4*** | -0.6* | -1.9*** | -3.3*** | -3.2* | 0 | -1.4*** |
| n= | 30,227 | 16,261 | 2,318 | 4,111 | 688 | 724 | 9,825 |
Statistical significance level *** 1%; ** 5%; * 10%, other values are non-statistically significant.
Note: Impacts are estimated over 4 post-program years (or 5 years in the case of EAS).
Older worker participants
Nearly 79,500 EI active and former claimant participants, between 2010 and 2012, were 55 years of age or older when they began their program, representing about 13% of participants.
The profile of older worker participants is presented in Table 11 by gender, sociodemographic group, and marital status. Information about their educational attainment, occupation and industry are based on the latest job they held prior to applying for EI benefits. Information about sociodemographic groups is self-reported.
| Categories | Active claimants | Former claimants |
|---|---|---|
| Number of participants | 51,513 | 27,997 |
| Gender: Female | 50% | 47% |
| Gender: Male | 50% | 53% |
| Sociodemographic group: Indigenous individual | 3% | 5% |
| Sociodemographic group: Person with disability | 6% | 10% |
| Sociodemographic group: Visible minority | 4% | 6% |
| Sociodemographic group: Recent immigrant | 1% | 1% |
| Marital status: Married or common-law | 55% | 43% |
| Marital status: Widow / divorced / separated | 23% | 26% |
| Marital status: Single | 20% | 26% |
| Education or skills level: High school or occupational training | 42% | 40% |
| Education or skills level: On-the-job training | 22% | 24% |
| Education or skills level: College, vocational education or apprenticeship training | 26% | 25% |
| Education or skills level: University degree | 4% | 5% |
*Values may not equal 100% due to rounding or missing information.
Top 3 occupational groups for older worker participants
Active claimants:
- semi-skilled manual workers = 16%
- clerical personnel = 14%
- intermediate sales and service personnel = 11%
Former claimants:
- semi-skilled manual workers = 16%
- other sales and service professionals = 12%
- clerical personnel = 12%
Top 3 Industries for older worker participants
Active claimants:
- manufacturing = 16%
- retail trade = 12%
- administrative and support, waste management and remediation services = 9%
Former claimants:
- manufacturing = 16%
- retail trade = 11%
- administrative and support, waste management and remediation services = 11%
Main findings: Incremental impacts reveal that older workers in SD and TWS improve their labour market attachment. Older workers who are active claimants and participate in JCP also improve their labour market attachment. However, only former EI claimants in TWS also decrease their dependence on government support following participation.
Table 12 presents the detailed incremental impacts.
For example, the results reveal that compared to similar participants in EAS only , older worker former claimants in TWS have higher annual earnings (+$2,254) and incidence of employment (+8.9 percentage points). They also depend less on government income supports (-3.3 percentage points), mostly by decreasing their use of SA benefits (-$278).
Older worker active claimants in JCP have higher annual earnings (+$1,241) and incidence of employment (+8.3 percentage points) compared to similar non-participants. However, the increase in EI benefits (+$466) indicates that participants are unable to maintain the employment secured following the intervention.
| Indicator | SD active claimants | SD former claimants | TWS active claimants | TWS former claimants | JCP active claimants | JCP former claimants | EAS active claimants |
|---|---|---|---|---|---|---|---|
| Incidence of employment (percentage points) | 11.8*** | 4.1*** | 8.1*** | 8.9*** | 8.3*** | -0.2 | 0.2 |
| Employment earnings ($) | 3,847*** | 1,626*** | 3,479*** | 2,254*** | 1,241** | -2,498* | 180 |
| EI benefits ($) | 82 | 100 | 77 | 173* | 466** | 282 | -359*** |
| SA benefits ($) | 181*** | 71 | 132*** | -278*** | 20 | -35 | 135*** |
| Dependence on income support (percentage points) | 1.3*** | 0.5 | 0.1 | -3.3*** | 1.0 | 2.4 | -1.0*** |
| n= | 5,791 | 2,859 | 1,518 | 1,682 | 602 | 468 | 17,436 |
Statistical significance level *** 1%; ** 5%; * 10%, other values are non-statistically significant.
Note: Impacts are estimated over 4 post-program years (or 5 years in the case of Employment Assistance Services).
Indigenous participants
Nearly 36,400 EI active and former claimant participants, between 2010 and 2012, self-identify as being Indigenous Canadians, representing about 6% of participants.
The profile of Indigenous participants is presented in Table 13 by gender, age and marital status. Information about educational attainment, occupation and industry are based on the latest job held prior to applying for EI benefits. The profile of Indigenous participants is generally comparable to the one observed for LMDA participants at large across Canada.
| Categories | Active claimants | Former claimants |
|---|---|---|
| Number of participants | 16,416 | 19,981 |
| Gender: Women | 46% | 46% |
| Gender: Men | 54% | 54% |
| Age: 30 and under | 30% | 33% |
| Age: 31 to 54 | 61% | 60% |
| Age: 55 and over | 9% | 7% |
| Marital status: Married or common-law | 31% | 25% |
| Marital status: Widow / divorced / separated | 12% | 11% |
| Marital status: Single | 53% | 57% |
| Education or skills level: High school or occupational training | 35% | 33% |
| Education or skills level: On-the-job training | 29% | 33% |
| Education or skills level: College, vocational education or apprenticeship training | 28% | 26% |
| Education or skills level: University degree | 4% | 4% |
*Values may not equal 100% due to rounding or missing information.
Top 3 occupational groups for Indigenous participants
Active claimants:
- other manual workers = 18%
- semi-skilled manual workers = 15%
- intermediate sales and service personnel =11%
Former claimants:
- other manual workers = 20%
- semi-skilled manual workers = 13%
- other sales and service professionals = 13%
Top 3 industries for Indigenous participants
Active claimants:
- construction = 15%
- public administration = 14%
- accommodation and food services = 8%
Former claimants:
- construction = 15%
- public administration = 14%
- accommodation and food services = 10%
Main findings: Indigenous participants in SD, TWS and EAS improve their labour market attachment through increases in their incidence of employment and employment earnings. They also decrease their dependence on government income support (that is, the combined use of EI and SA benefits). The findings are consistent with findings from the Indigenous Skills and Employment Training Strategy evaluation.
Table 14 presents the detailed incremental impacts.
For example, the results reveal that relative to similar non-participants, Indigenous active claimants in SD have higher annual earnings (+$5,759 per year) and incidence of employment (+7.4 percentage points). They also depend less on government income supports (-3.4 percentage points), by decreasing their use of SA benefits (-$182 per year).
Indigenous former claimants in TWS have higher annual earnings (+ $2,312 per year) and incidence of employment (+ 6.7 percentage points) compared to similar participants in EAS only. They also lower their reliance on government income supports (-4 percentage points), mostly by decreasing their use of SA benefits (-$471 per year).
| Indicator | SD active claimants | SD former claimants | TWS active claimants | TWS former claimants | EAS active claimants |
|---|---|---|---|---|---|
| Incidence of employment (percentage points) | 7.4*** | 5.1*** | 7.2*** | 6.7*** | 1.9*** |
| Employment earnings ($) | 5,759*** | 3,996*** | 4,210*** | 2,312** | 2,056*** |
| EI benefits ($) | 34 | 306*** | -381* | 98 | -153** |
| SA benefits ($) | -182*** | -275*** | -158* | -471*** | 110*** |
| Dependence on income support (percentage points) | -3.4*** | -1.3* | -2.8** | -4.0*** | -0.6 |
| n= | 4,079 | 3,509 | 423 | 670 | 11,717 |
Statistical significance level *** 1%; ** 5%; * 10%, other values are non-statistically significant.
Note: Impacts are estimated over 4 post-program years (or 5 years in the case of EAS).
Persons with disabilities
Nearly 38,000 EI active and former claimant participants, between 2010 and 2012, self-identify as persons with disabilities, representing about 6% of participants.
The profile of persons with disability participants is presented in Table 15 by gender, age, and marital status. Information about their educational attainment, occupation and industry is based on the latest job they held prior to applying for EI benefits.
Recent interviews with 40 service providers working with persons with disabilities reveal that a significant proportion of participants are looking or only capable of working on part-time basis. In fact, the outcome trends reveal that at least 40% of persons with disabilities earn less than $10,000 per year in the 4 post-program years.
| Categories | Active claimants | Former claimants |
|---|---|---|
| Number of participants | 18,465 | 19,562 |
| Gender: Female | 47% | 46% |
| Gender: Male | 53% | 54% |
| Age: 30 years and younger | 20% | 22% |
| Age: 31 to 54 years old | 64% | 63% |
| Age: 55 years and older | 17% | 15% |
| Marital status: Married or common-law | 32% | 26% |
| Marital status: Widow / divorced / separated | 17% | 16% |
| Marital status: Single | 47% | 53% |
| Education or skills level*: High school or occupational training | 40% | 38% |
| Education or skills level*: On-the-job training | 27% | 31% |
| Education or skills level*: College, vocational education or apprenticeship training | 25% | 23% |
| Education or skills level*: University degree | 4% | 4% |
*Values may not equal 100% due to rounding or missing information.
Top 3 occupational groups for persons with disabilities
Active claimants:
- other sales and service professionals = 14%
- semi-skilled manual workers = 14%
- clerical personnel = 14%
Former claimants:
- other sales and service professionals = 16%
- other manual workers = 14%
- semi-skilled manual workers = 13%
Top 3 industries for persons with disabilities
Active claimants:
- retail trade = 13%
- manufacturing = 12%
- administrative and support, waste management and remediation services = 11%
Former claimants:
- retail trade = 13%
- manufacturing = 12%
- administrative and support, waste management and remediation services = 12%
Main findings: Persons with disabilities, who are active claimants in SD and TWS, improve their incidence of employment and decrease their dependence on income support. Participants have small positive but non-statistically significant impacts on employment earnings. Former EI claimants in SD and TWS improve their labour market attachment and decrease their overall level of dependence on income supports.
Table 16 presents the detailed incremental impacts.
For example, the results reveal that relative to similar participants in EAS only, persons with disabilities who are former claimants in SD have higher annual earnings (+$2,087) and incidence of employment (+6.3 percentage points). They also lower their reliance on government income supports (-1.7 percentage points) mostly by decreasing their receipt of SA benefits (-$436).
Persons with disabilities who are active claimants in TWS have higher incidence of employment (+8.1 percentage points) compared to similar non-participants. They also lower their reliance on government income supports (-8.1 percentage points) mostly by decreasing their use of SA benefits (-$641).
| Indicator | SD active claimants | SD former claimants | TWS active claimants | TWS former claimants |
|---|---|---|---|---|
| Incidence of employment (percentage points) | 5.6*** | 6.3*** | 8.1*** | 11.5*** |
| Employment earnings ($) | 38 | 2,087*** | 221 | 2,489*** |
| EI benefits ($) | -46 | 331*** | -229 | 364*** |
| SA benefits ($) | -151 | -436*** | -641*** | -938*** |
| Dependence on income support (percentage points) | -2.3** | -1.7* | -8.1*** | -9.2*** |
| n= | 3,392 | 2,295 | 1,249 | 1,797 |
Statistical significance level *** 1%; ** 5%; * 10%, other values are non-statistically significant.
Note: Impacts are estimated over 4 post-program years.
Recent immigrantsFootnote 31
Nearly 24,500 EI active and former claimant participants in LMDA programs and services, between 2010 and 2012, are recent immigrants, representing about 4% of participants.
The profile of recent immigrant participants is presented in Table 17 by gender, age and marital status. Information about their educational attainment, occupation and industry is based on the latest job they held prior to applying for EI benefits.
| Categories | Active claimants | Former claimants |
|---|---|---|
| Number of participants | 15,543 | 8,944 |
| Gender: Female | 46% | 54% |
| Gender: Male | 54% | 46% |
| Age: 30 years and younger | 19% | 22% |
| Age: 31 to 54 years old | 77% | 74% |
| Age: 55 years and older | 5% | 4% |
| Marital status: Married or common-law | 72% | 72% |
| Marital status: Widow / divorced / separated | 9% | 10% |
| Marital status: Single | 17% | 16% |
| Education or skills level*: High school or occupational training | 36% | 38% |
| Education or skills level*: On-the-job training | 26% | 32% |
| Education or skills level*: College, vocational education or apprenticeship training | 25% | 21% |
| Education or skills level*: University degree | 9% | 6% |
*Values may not equal 100% due to rounding or missing information.
Top 3 occupational groups for recent immigrants
Active claimants:
- semi-skilled manual workers = 14%
- other manual workers = 14%
- clerical personnel = 12%
Former claimants:
- other sales and service professionals = 17%
- other manual workers = 15%
- semi-skilled manual workers = 14%
Top 3 industries for recent immigrants
Active claimants:
- manufacturing = 18%
- administrative and support, waste management and remediation services = 17%
- retail trade = 8%
Former claimants:
- administrative and support, waste management and remediation services = 19%
- manufacturing = 17%
- retail trade = 10%
Main findings: Recent immigrants who are active EI claimants in SD, TWS and EAS improve their labour market attachment. Participants in SD and EAS also reduce their use of EI benefits. The incremental impacts for recent immigrant former EI claimants are non-statistically significant.
Table 18 presents the detailed incremental impacts. For example, the results reveal that relative to similar non-participants, recent immigrants who are active claimants in SD have higher annual earnings (+$2,942) and incidence of employment (+6.7 percentage points). They also depend less on government income supports (-1 percentage point), mostly by decreasing their use of EI benefits (-$324 per year).
Recent immigrants who are active claimants in EAS have higher annual earnings (+$2,120) and incidence of employment (+4.7 percentage points) relative to similar non-participants. Active claimants also lower their use of EI benefits (-$251 per year).
| Indicator | SD active claimants | SD former claimants | TWS active claimants | TWS former claimants | EAS active claimants |
|---|---|---|---|---|---|
| Incidence of employment (percentage points) | 6.7*** | -0.7 | 6.7*** | 4.1 | 4.7*** |
| Employment earnings ($) | 2,942*** | -3,110 | 5,167*** | 2,019 | 2,120*** |
| EI benefits ($) | -324*** | -154* | -143 | 231 | -251*** |
| SA benefits ($) | 22 | -5 | 100 | -102 | 48* |
| Dependence on income support (percentage points) | -1.0*** | -0.7 | -0.1 | -1.6 | -0.3 |
| n= | 3,510 | 2,155 | 279 | 334 | 11,738 |
Statistical significance level *** 1%; ** 5%; * 10%, other values are non-statistically significant.
Note: Impacts are estimated over 4 post-program years (or 5 years in the case of Employment Assistance Services).
Visible minorities
Nearly 29,000 EI active and former claimant participants in LMDA programs and services, between 2010 and 2012, self-identify as visible minorities, representing about 5% of participants.
The profile of visible minority participants is presented in Table 19 by gender, age, and marital status. Information about their educational attainment, occupation and industry are based on the latest job they held prior to applying for EI benefits.
| Categories | Active claimants | Former claimants |
|---|---|---|
| Number of participants | 15,384 | 13,600 |
| Gender: Female | 52% | 53% |
| Gender: Male | 48% | 47% |
| Age: 30 years and younger | 18% | 20% |
| Age: 31 to 54 years old | 69% | 69% |
| Age: 55 years and older | 14% | 12% |
| Marital status: Married or common-law | 54% | 48% |
| Marital status: Widow / divorced / separated | 13% | 15% |
| Marital status: Single | 30% | 33% |
| Education or skills level*: High school or occupational training | 40% | 41% |
| Education or skills level*: On-the-job training | 23% | 27% |
| Education or skills level*: College, vocational education or apprenticeship training | 26% | 23% |
| Education or skills level*: University degree | 6% | 6% |
*Values may not equal 100% due to rounding or missing information.
Top 3 occupational groups for visible minorities
Active claimants:
- semi-skilled manual workers = 16%
- clerical personnel = 14%
- other sales and service professionals = 12%
Former claimants:
- semi-skilled manual workers = 15%
- other sales and service professionals = 14%
- clerical personnel = 14%
Top 3 industries for visible minorities
Active claimants:
- manufacturing = 18%
- administrative and support, waste management and remediation services = 12%
- retail trade = 9%
Former claimants:
- manufacturing = 19%
- administrative and support, waste management and remediation services = 14%
- retail trade = 9%
Main findings: Visible minorities who are active EI claimants in SD and TWS improve their labour market attachment. Only those who participate in SD, are also able to decrease their reliance on government income supports. Visible minority participants who are former EI claimants in TWS improve their labour market attachment. Former participants in SD do not benefit from the program.
Table 20 presents the detailed incremental impacts.
For example, the results found that relative to similar non-participants, visible minorities who are active claimants in SD, have higher annual earnings (+$1,605) and incidence of employment (+8.9 percentage points). They also depend less on government income supports (- 3.3 percentage points).
Former claimants in TWS have higher annual earnings (+ $2,775) and incidence of employment (+ 5.0 percentage points) compared to similar participants in EAS only.
| Indicator | SD active claimants | SD former claimants | TWS active claimants | TWS former claimants |
|---|---|---|---|---|
| Incidence of employment (percentage points) | 8.9*** | -0.4 | 8.6*** | 5.0** |
| Employment earnings ($) | 1,605** | -1,616** | 5,812*** | 2,775** |
| EI benefits ($) | -66 | -26 | 299 | 246 |
| SA benefits ($) | -108 | -2 | -30 | -163 |
| Dependence on income support (percentage points) | -3.3*** | -0.2 | -0.6 | 0.5 |
| n= | 3,008 | 2,004 | 296 | 375 |
Statistical significance level *** 1%; ** 5%; * 10%, other values are non-statistically significant.
Note: Impacts are estimated over 4 post-program years (or 5 years in the case of Employment Assistance Services).
Heterogeneity of treatment effect study
A supplemental study, the heterogeneity of treatment effects,Footnote 34 examines alternative methods to traditional incremental impact analysis. This new method uses newly developed causal machine learning methods to examine whether the effectiveness of EBSMs varies across participants’ sociodemographic characteristics. Footnote 35,Footnote 36
This information may help to inform program and policy making decisions in the future. The findings for the Heterogeneity of Treatment Effects study for SD active participants can be found in Appendix A.
Cost-benefit analysis
This analysis is based on the EBSM medium-term incremental impacts previously described in this report. Costs and benefits are examined over the participation period of 1 or 2 years and 5 or 10 years after the end of participation.Footnote 37
The cost-benefit analysis addresses the following questions:
- Are the benefits from EBSMs exceeding the costs within 5 years (for TWS, JCP or EAS) or 10 years (for SD and SD youth participants) after the end of participation?
- How much is the benefit for the government and society if the government spends $1 in EI part II funding?
- How many years does it take the benefits to recover the costs?
The following results are presented from the social perspective, that is, the government and individual combined. This allows for a sound assessment of program effectiveness in achieving its objectives of helping unemployed individuals to obtain and maintain employment and to generate EI savings.
Table 21 presents the cost-benefit results for active and former EI claimant participants.
| Variable | SD active claimants (10 years post-program) | SD youth active claimants (10 years post-program) | TWS active claimants (5 years post-program) | JCP active claimants (5 years post-program) | EAS active claimants (5 years post-program) | SD former claimants (10 years post-program) | TWS former claimants (5 years post-program) |
|---|---|---|---|---|---|---|---|
| Net present value | $5,508 | $21,619 | -$351 | -$13,902 | -$2,395 | -$9,573 | $9,052 |
| Benefit cost ratio | $1.54 | $3.19 | $0.95 | -$0.18 | -$1.90 | $0.05 | $2.23 |
| Payback period (years after end of participation) | 8.3 years | 5.4 years | 5.2 years | 16.1 years | 7.7 years | 18.5 years | 0.7 year |
| Social return | 54% | 219% | -5% | -118% | -290% | -95% | 123% |
| Savings to public health care | $178 | $298 | $75 | $52 | -$47 | -$15 | $169 |
The information below provides examples of the net present value, the benefit-cost ratio, the payback period, the social rate of return and savings to health care costs.
Skills DevelopmentFootnote 38
During the 2010 to 2012 period, SD represents almost 52% of EBSM expenditures under the LMDAs across Canada. The average duration of an SD Action Plan Equivalent is 49 weeks for active claimants and 48 weeks for former claimants. As shown in Table 21, over the 10 year post-program period the benefit for active claimants is +$5,508 higher than the costs, yielding a social return of 54% on investment. This means that if the government spends $1 on SD for active EI claimants, it generates +$1.54 of benefit for society. It takes 8.3 years for the benefits to recover the costs of programing. Overall, there are savings to health care costs of $178 per participant.
Targeted Wage Subsidies
During the 2010 to 2012 period, TWS represents 3% of total EBSM expenditures across Canada. The average duration of a TWS Action Plan Equivalent is 38 weeks for active claimants and 31 weeks for former claimants. As shown in Table 21, over the 5 year post-program period the benefit for former claimants is +$9,052 higher than the costs, yielding a social return on investment of 123%. A savings to health care costs of $169 is found per participant 5 years after the program. The costs are recovered during the first year following participation (0.7 year).
Of all EBSMs, TWS has the most positive results for former claimants.
Job Creation PartnershipsFootnote 39
In addition to helping participants obtain work experience in the funded projects, JCP also benefits the communities where the projects are implemented. However, community impacts are not accounted for in this cost-benefit analysis, since they are not captured in the administrative data and are difficult to quantify.
In this context, the benefits from the social perspective are likely underestimated. Overall, JCP represented 2% of the total EBSM investment in the 2010 to 2012 period. The average duration of a JCP Action Plan Equivalent is 33 weeks for active claimants, and 30 weeks for former claimants.
As shown in Table 21, over the 5 year post-program period the benefits of delivering JCP to active claimants are -$13,902 lower than the costs 5 years after participation, yielding a return on investment of -118%. It takes 16.1 years for the benefits to recuperate the cost. A savings of $52 in health care costs is found per participant following participation.
Employment Assistance ServicesFootnote 40
EAS includes a variety of services such as computer access for job search services, group sessions to prepare for an interview, career counselling, and action plan development. The administrative data, however, do not allow to identify what proportion of EAS interventions belong to each category or the intensity of services offered to participants.
While EAS are often provided with other EBSMs, this analysis examined only participants who received one or more EAS without participating in other EBSMs. EAS represents about 30% of total EBSM expenditures between 2010 and 2012. The average length of an EAS-only Action Plan Equivalent is 12 weeks compared to between 33 to 49 weeks for active EI claimant participants in other EBSMs.
As shown in Table 21, over the 5 year post-program period the benefits for active claimants in EAS is -$2,395 lower than the costs, yielding a social return on investment of -290%. It takes 7.7 years after participation for the benefits to recover the costs. No savings to health care costs is found.
Overall, the goal of EAS is not to help participants acquire more skills, therefore, increasing participants’ earnings after participation is not necessarily expected. Conducting a cost-benefit analysis for EAS is a challenge as it is not possible to attribute a dollar figure to the return to employment. However, including earnings in the cost-benefit calculation is still very relevant since it captures partially the positive impact of the quicker return to work.
Supplemental studies
Self-EmploymentFootnote 41
Program design and delivery
The following is a summary of guidelines from provinces and territories that were delivering the self-employment programming in fall 2018. Key informants did confirm and complement the information found in program guidelines.
The Self-Employment program aims to assist participants in creating employment for themselves by providing them with a range of services including:
- assistance with business plan development
- counselling, coaching and mentoring
- entrepreneurial training and workshops
In addition to being unemployed and EI-eligible, participants must not already own and/or operate their businesses prior to program participation.
Provinces and territories have the flexibility to design and deliver the program to meet their labour market needs. In fall 2018, the program was delivered mainly through third-party organizations, including:
- business development corporations
- Community Futures (used in rural areas)
- community organizations serving specialized groups (such as, women and francophone)
- private management or consulting firms
Program officials report that the amount allocated to the Self-Employment program depends on regional allocations, demand for the program and local labour market conditions. Three provinces and territories have decided not to deliver the program because other entrepreneurial programs exist, high costs relative to the demonstrated results, or low demand and labour market conditions.
The application process aims to ensure that participants are suited for self-employment, have a viable business idea and the financial resources to launch a business.
Participants’ employment outcomes
The following is a summary of labour market outcomes and satisfaction rates from a survey of self-employment participants across 9 provinces and territories completed in winter 2020.Footnote 42 A total of 2,199 individuals responded to the survey with a 40.5% response rate.
Self-employment participants increased their employment level by 15 percentage points from 59% in the year before participating to 74% at the time of survey. That is, 2 to 4 years after program participation. The increase is mainly due to an increase in the percentage of self-employed participants.
Type of businesses created, survival rates and success factors
Nearly 50% of survey respondents launched a self-employment business and it was still in operation in winter 2020 (2 to 4 years following program participation).
Among the 1,365 respondents who started a business, 68% of them were still operating their business at 2 to 4 years post-program. Another 4% sold their business, but it was still operational. Twenty-four percent (24%) of respondents were unable to maintain the operation of the business they started as part of the program.
The business survival rate is consistent with a 2018 Statistics Canada studyFootnote 43 that found that less than half of unincorporated self-employed individuals continued operations for more than 2 years.
Half of self-employment businesses were launched in other servicesFootnote 44; professional, scientific and technical services; as well as in construction and retail trade.
Regarding factors influencing the success or failure of self-employment businesses:
- participants who started a business and were still in operation at the time of survey attributed their business success to:
- their dedication, hard work and positive attitude
- the high demand for their services or products
- the quality of service provided
- their own abilities, experience, knowledge and skills
- their network and business contacts
- participants who started a business but were forced to close it attributed the closure to:
- poor sales and low revenues
- small market
- workload
- finding another job
- participants who did not launch a business attributed this to:
- the lack of funding, and the level of uncertainty and risk involved
- workload, work life balance, and underestimating the required commitment
Earning outcomes and reliance on income support
Survey respondents were not comfortable answering questions that related to their earnings. This situation made it difficult to compare the pre- and post-earnings of self-employment participants.
Overall, there appears to be an increase in the number of participants reporting less than $10,000 in earnings annually. However, survey respondents, who are able to maintain the operation of their business, are more likely to report earning more or the same as before participating in the program.
As a complement to the earning questions, survey respondents did assess their financial well-being. When considering their entire financial situation:
- 73% of respondents said that they are financially about the same or better off after the program
- 70% of respondents said that their household net worth is about the same or higher after the program
In line with survey findings, 14 provincial/territorial program managers state that immediate increases in earnings are not necessarily an expected outcome of the program.
Regarding the reliance on government income support, participants reduce reliance on the use of EI and SA following program participation.
Satisfaction with services received and current employment
A high percentage of respondents who started a self-employment business report that they are equally or more satisfied with their job situation after program participation. Those who are able to maintain the operation of their business are 29 percentage points more likely to report being more satisfied, compared to those whose business closed (76% compared to 47%).
The survey did examine the contribution of the program to the success of self-employment businesses. At least 81% of survey respondents who launched a self-employment business rate the following services and training as very or somewhat important to the business launch, operation and success:
- assistance with business plan development
- one-on-one mentoring / advice or counselling supports
- discussion on risks and challenges of self-employment
- assessment of entrepreneurial readiness
- living allowance during participation and financial assistance with business start-up costs
- information about and assistance to access capital
- training on budgeting, financial management, marketing, business operation and sales
Challenges and lessons learned related to program design and delivery
The following is based on key informant interviews with program managers, and front-line third-party service providers, and case workers.
Key informants identify the following challenges related to program design and delivery, including:
- the lack of clear communication between service providers and the provincial or territorial department and/or Service Canada regarding the confirmation of eligibility for Employment Insurance
- restrictive contract provisions for service providers
- complex assessment process of candidates
- difficulty to serve remote and rural areas
Best practices related to program design and delivery included:
- using local and specialized organizations to deliver the program
- using standardized tools for business plan development
- relying on local expertise to assess business viability
- providing ongoing mentorship, advice and counselling
- using specialists to deliver tailored training
- providing participants with opportunity to network and facilitating their knowledge of and access to funding
Key considerations for Self-Employment program and policy development
The following considerations emerged as part of the study.
The Self-Employment program can benefit from an updated objective specifying that it is dedicated to eligible participants who have a viable business idea, the financial or in-kind resources to launch a business, and the required level of dedication.
The data collection process should include only participants who have been deemed suitable for self-employment and accepted into the program. This will require excluding candidates who attended information sessions alone or those deemed not suited for self-employment. The latter participants can be reported under Employment Assistance Services.
Indicators of program success can include: increase in employment and/or self-employment levels; medium-term increase in earnings; business survival rate similar to the local economy and/or the sector; and acquisition of transferable skills.
Provinces and territories may wish to consult with their service delivery network on the extent to which identified challenges are applicable to their unique context, and how best to address them along with integrating lessons learned that can benefit program delivery.
Rationale
The Self-Employment program aims to assist participants in creating employment for themselves. The participant’s application process is structured and aimed to ensure that they are suited for self-employment, have a viable business idea, and the financial resources to launch a business. However, the survey revealed that:
- one third of participants did not launch a business
- 176 survey respondents confirmed that they did not participate in the program
- nearly one quarter of participants were unable to maintain the operation of the business they had started as part of the program
Participants who started a business under the Self-Employment program and were still in operation at the time of the survey attributed their business success to: their dedication, hard work and positive attitude; the high demand for their services or products; the quality of service provided; their own abilities, experience, knowledge and skills; their network; and, business contacts. Those who started a business but were forced to close it attributed the closure to: poor sales and low revenues; small market; workload; and, finding another job. Finally, participants who did not launch a business during program participation attributed this to: the lack of funding; the level of uncertainty and risk involved; workload, work-life balance; and, underestimating the required commitment.
The survey confirmed that participants acquire transferable skills through training and workshops, they experience increase in employment and medium-term earnings, and they create additional jobs. As well, business survival rates mirror those observed for small business in the economy. These indicators are useful in measuring and reporting program success as well as managing contribution agreements with service providers.
Job Creation PartnershipsFootnote 45
Program description
The following is a summary of guidelines from 8 provinces and territories that were delivering JCP in the years 2018 and 2019. Key informants did confirm and complement the information found in program guidelines.
Program objective
The objective of JCP is to provide participants with the opportunity to gain work experience or training that improves their employment prospects.
Provinces and territories use 2 models to deliver the program:
- the first, and most common, is the provision of funds to an organization that implements a community-benefiting project while providing work experience to participants
- the second is the provision of classroom-based training in combination with work experience for participants through third-party training providers
Participants receive benefits from EI Part I or II.Footnote 46 Benefits to participants follow the prevailing wage rate, up to the maximum EI weekly benefit rate. Provinces and territories may provide additional funding to project holders or training providers to cover the project or training costs.
Program delivery
The design and delivery of JCP allow provinces and territories to address a variety of barriers to employment experienced by their citizens (such as, lack of work experience). Provinces and territories can use the program to address various labour market needs by targeting sub-groups of individuals, professions or economic sectors in demand and communities.
Program managers report that the amount allocated to the program depends on government priorities, demand for the program, previous funding levels and labour market needs. Five provinces and territories did not deliver the program in 2018 and 2019 because of budget priorities, lack of interest by organizations and job seekers, and the temporary nature of jobs offered under the program.
In addition to gaining work experience, key informants expect participants to develop work-related skills and to enhance their career development, job search abilities, and to improve their personal well-being. Project holders can benefit from the program through increased capacity, implementing their projects, and increasing their presence within local communities.
For employers that provide work experience to trained participants, benefits are mostly associated with gaining a source of trained employees. At the community level, projects support the local economy and provide new assets (such as, restored buildings or hiking trails) or services (such as, support for newcomers).
Challenges and lessons learned
Key informants identify challenges related to:
- the recruitment of participants and organizations
- ensuring that funded projects are assisting participants in addressing their barriers to employment
- program administration and monitoring
Key informants identify the following elements as contributing factors to participants’ success:
- implementation is effective when contract coordinators provide support to project holders during the writing of their program proposal and throughout project implementation
- on-site visits, open communication, and establishing clear project expectations support effective monitoring
- for training providers, participant recruitment can improve by involving employers in the recruitment process and in curriculum development
- classroom-based training is most effective when it is occupation or sector-specific and aligned with current or forecasted labour demand
- participants who benefit the most from the program face one or multiple barriers to employment such as work experience, networking opportunities, skills training, or assistance with reintegrating into the labour force
- experienced organizations who used the program previously can implement effective projects, as they have the capacity to manage funding and to provide support to participants
- projects found to be best suited for funding are those who align with community needs, government priorities and labour market issues. Examples of well-suited project sectors and activities include event coordination, arts and culture, and construction
Key considerations for JCP program and policy development
The following considerations emerged as part of the JCP study.
Consideration #1: JCP could benefit from an updated logic model and narrative explaining the program theory, from the development of detailed Terms and Conditions, or simply from an update to the “Process for Determination of Similarity”Footnote 47 document, in consultation with provinces and territories.
The objective of JCP is to enable unemployed persons who qualify as “insured participants” under section 58 of the EI Act to obtain employment by providing them with employment opportunities through which they can gain work experience to improve their long-term employment prospects.
The qualitative and quantitative evidence, documented in this study, demonstrate that JCP is generally meeting its objectives by assisting participants to improve their labour market attachment following their program participation. As well, JCP has benefits to organizations, employers and local communities.
However, the current program description is not comprehensive enough to cover all the programs similar to JCP that are designed and implemented by provinces and territories. For example, it is not clear to what extent the combination of training and work experience or placements provided in 3 provinces and territories are aligned with the description of JCP in the document entitled “Process for Determination of Similarity”. As is, the incremental impacts for these programs should be reported separately from JCP and SD. One province has recently reclassified the program as SD instead of JCP in its annual plan. This may require creating a new program category (for example, Training to Work or Training and Work Experience) or expanding the definition of JCP.
Moreover, the “Process for Determination of Similarity” document does not address the issue of repeat participation for participants and organizations, though there may be advantages to this approach. Evidence suggests that some participants can benefit from more than one JCP participation, or simply from a participation of a longer duration. Furthermore, evidence from key informant interviews suggests that established organizations who used JCP in the past are well suited to implement JCP projects.
Consideration #2: Compared to other Employment Benefits offered under the LMDAs, JCP is a less attractive program and is the least used. The program could benefit from increased promotion to organizations and more importantly from reducing its administrative burden.
On average, JCP accounted for 1.5% of total LMDA expenditure between 2012 to 2013 and 2016 to 2017. Only 2 provinces spent close to 7% of their LMDA expenditure on JCP in 2016 to 2017. Furthermore, the program is not used in 5 provinces and territories because of budget priorities, lack of interest by organizations and job seekers, and the temporary nature of jobs.
Awareness and interest in the program was a challenge, despite its positive outcomes. Key informants reported the lack of promotion to potential organizations and identified the lack of interest by organizations and job seekers as challenges. Recruitment of participants may be affected by the low level of financial support available to them. The availability of skilled participants can support the recruitment of low-capacity organizations.
Key informant interviews revealed the complex nature of JCP administration for both organizations and government staff. The administration of the program includes activities such as submitting a project proposal, producing monthly reports, advertisement and recruitment, confirmation of EI eligibility, and monitoring participants and project holders. In the current design of JCP, key informants identified delivery challenges related to the burden of program administration and monitoring for both contract coordinators and small organizations.
Labour Market PartnershipsFootnote 48
The Labour Market Partnerships program(s) aim to assist employers, communities and/or industries to address their labour force adjustments and human resource needs. It includes a wide range of funded activities, such as:
- labour market and human resource research
- development of workforce strategies and plans
- raising awareness about human resources and labour market information
- skills development training
- labour force adjustment services (for example, pre-layoff supports and needs assessment of laid-off workers)
- developing training curriculum
- engagement activities
Labour Market Partnerships is one type of support measures delivered under the LMDAs. In 2019 to 2020, provinces and territories spent nearly $277 million or 11% of the LMDA funding envelope. In 2020 to 2021, provinces and territories spent nearly $256 million on Labour Market Partnerships, which represented 12% of the LMDA funding envelope.
Funded organizations
Funded organizations include non-profits such as:
- industry associations, sector councils, employer associations and businesses/employers
- Indigenous organizations, educational institutions and training providers (private and non-profit)
- municipal and local governments including Indigenous governments
Targeted labour market issues
Funded projects target current and/or forecasted skills and/or labour shortages. These projects also target specific unemployed populations (for example, women, youth, Indigenous peoples, newcomers, persons with disabilities and the self-employed).
Generally, projects target labour market issues associated with:
- lack of capacity for human resource planning resulting in employee attraction and retention challenges
- projected or actual growth of industry/business
- aging workforce
- businesses downsizing/closure
- limited employment opportunities in Indigenous, small and remote communities
- barriers to employment experienced by a target population
The majority of projects reviewed align with their respective provincial or territorial program objectives and eligible activities.
Partnerships
All participating provinces and territories confirm that program officials carried out activities to support the formation and maintenance of partnerships. Provincial and territorial departments and key informants explained that partners’ expertise, network and financial contribution are all essential to project implementation and success.
The document review of 117 projects confirm that:
- partnerships were established to support the delivery of the majority of projects
- partners made a financial or in-kind contribution:
- the most common forms of in-kind contribution were expertise, staff time to project administration and delivery, office/event space and equipment
- project activities delivered with the support of partners include:
- labour market and human resource research
- training development and/or delivery
- career/job awareness, workforce strategy/plan development, and engagement
- awareness of labour market information and human resource tools development
Challenges and lessons learned
Provinces and territories, and key informants identified challenges related to project holder recruitment and setting up projects (application, identifying partners). Additional challenges include program administration and monitoring.
Actions of program officials and project characteristics that are conducive to the success of the program include:
- ongoing communication and relationship building between provincial and territorial government officials and project holders
- clearly defined labour market issues/needs that the projects aimed to address. These generally occur through clear project objectives, activities, expected outputs and outcomes, and performance measurement requirements
- ensuring that project holders have the capacity to deliver the project
- strong partnerships between project holders, government officials, and stakeholders (community, sector) resulting in valuable contributions to the project delivery
Key considerations for Labour Market Partnership program and policy development
The following considerations emerged as part of the Labour Market Partnerships study.
Considering that the current performance indicators do not reflect the diversity of activities funded under Labour Market Partnerships, it is important for ESDC and provinces and territories to discuss current Labour Market Partnerships funded activities in order to make recommendations on how to best report on results.
Considering the intermittent or limited use of the program in some provinces and territories, it is essential to share lessons learned about successful Labour Market Partnerships projects. Particularly, for projects targeted to employers (such as workplace or employer-sponsored training), and those assisting communities and economic sectors dealing with labour market adjustment issues (contraction or expansion).
Research and InnovationFootnote 49
Research and Innovation provides funding for research and demonstration projects. These projects aim to identify better ways of helping participants prepare for, return to, or keep employment and to be productive in the labour force.
Program officials report that the amount allocated to Research and Innovation is influenced by:
- government priorities
- labour market demand
- project capacity to introduce innovative tools
- previous funding levels
Between 2014 and 2020, 11 provinces and territories used Research and Innovation funding.Footnote 50 Of the 11 jurisdictions, 8 provinces and territories used the support measure regularly, while 3 used it intermittently. Two jurisdictions did not use Research and Innovation during the review period.
Funded organizations
Funded organizations include:
- not-for-profit organizations (such as research organizations, school boards, and Indigenous organizations)
- businesses/employers
- educational institutions and training providers
- municipal and local governments including Indigenous governments
Funded Research and Innovation activities
Research and Innovation projects encompassed a variety of activities including:
- development and/or testing of new approaches to improve employment outcomes for clients with some projects also focusing on persons with disabilities, youth, Indigenous, and other demographic groups
- strengthening service providers
- improving learning and post-secondary education with a focus on expanding online course delivery
- funding for cost-sharing of internships, temporary work placements, or training
- delivering career fairs or career/employment information presentations
- research
Innovation definition and criteria
Provinces and territories use different criteria to determine what is innovative. For example, in 4 provinces and territories, innovative approaches are deemed to be either:
- tools or processes that have not been used in the jurisdiction or Canada in general; and/or
- for a specific client group and that help to improve existing services or programs
Dissemination and adoption of innovative approaches
Five participating jurisdictions confirmed that project results can be shared with other provincial/territorial departments. They can also be shared with various stakeholders, which can include employment practitioners, employers, communities, researchers, and other key industry stakeholders.
Dissemination activities include:
- synthesising best practices
- developing knowledge and presenting products such as webinars, conference presentations, infographics, online products, and articles
- creating/enriching portals of the project holders
- issuing media releases
- developing and piloting a new apprenticeship curriculum
Performance measurement
Evaluation of project results was an integral part of Research and Innovation performance measurement in 5 provinces/territories.Footnote 51
Challenges and lessons learned
Project documents and program officials identified challenges related to testing and identification of innovative approaches including:
- project holder staff turnover due to poor terms of employment and job security
- recruitment and/or retention of participants to implement pilot projects
- recruitment of employers as partners in the delivery of supports to participants
In relation to factors contributing to successful testing and identification of innovative approaches, program officials highlighted the importance of:
- project holders employing experienced staff
- possessing organizational structure and financial reporting capacity
- having strong commitments with partners
- providing detailed cost estimates as part of their project proposals
- having clear project implementation plan with measurable outcomes
- continuous application intake to address on-going and emerging labour market issues
Skills Development-Apprentices
The objective of the program is to help apprentices become skilled tradespeople and to increase their labour market attachment. Program participants have generally chosen a career and are already attached to the labour market. The apprenticeship process involves on-the-job learning and technical training in a classroom setting.
Apprentices who have worked enough hours to qualify for EI can apply to receive EI Part I benefits while on training. The program provides financial assistance to EI eligible apprentices to help them offset the costs they incur while they attend technical training. The level of funding is based on the needs of apprentices, the location of the training, and any fees paid by the apprentices.Footnote 52
The profile of program participants is presented in Table 22 by age, sociodemographic group, and marital status. Information about their educational attainment, occupation and industry is based on the latest job they held prior to applying for EI benefits. Information about sociodemographic groups is self-reported.
| Categories | Active claimants | Former claimants |
|---|---|---|
| Number of participants | 43,494 | 28,910 |
| Gender: Female | 5% | 8% |
| Gender: Male | 95% | 92% |
| Age: 30 and under | 75% | 73% |
| Age: 31 to 54 | 24% | 26% |
| Age: 55 and over | 1% | 1% |
| Sociodemographic group: Indigenous individual | 4% | 4% |
| Sociodemographic group: Person with disability | 1% | 1% |
| Sociodemographic group: Visible minority | 5% | 6% |
| Sociodemographic group: Recent immigrant | 1% | 1% |
| Marital status: Married or common-law | 30% | 34% |
| Marital status: Widow / divorced / separated | 3% | 3% |
| Marital status: Single | 65% | 61% |
| Education or skills level: High school or occupational training | 4% | 7% |
| Education or skills level: On-the-job training | 7% | 10% |
| Education or skills level: College, vocational education or apprenticeship training | 88% | 82% |
| Education or skills level: University degree | 0% | 0% |
Top 3 occupational groups for participants in SD-Apprentices
Active claimants:
- skilled crafts and trades workers = 83%
- other manual workers = 7%
- semi-skilled manual workers = 3%
Former claimants:
- skilled crafts and trades workers = 74%
- other manual workers = 8%
- skilled sales and service personnel = 4%
Top 3 industries for participants in SD-ApprenticesFootnote 53
Active claimants:
- construction = 64%
- manufacturing = 7%
- retail trade; other services (excluding public administration) = 6% each
Former claimants:
- construction = 51%
- manufacturing = 13%
- retail trade; other services (excluding public administration) = 7% each
Labour market outcomes
The labour market outcomes are based on individuals who began their participation during the 2010 to 2012 period. Statistics focus on 5 years before program participation and 5 years after the program start year.
Active claimants
As shown in Chart 6, program participants increase their average earnings from $19,325 in the fifth year pre-program to $56,131 in the fifth year after the program start year.
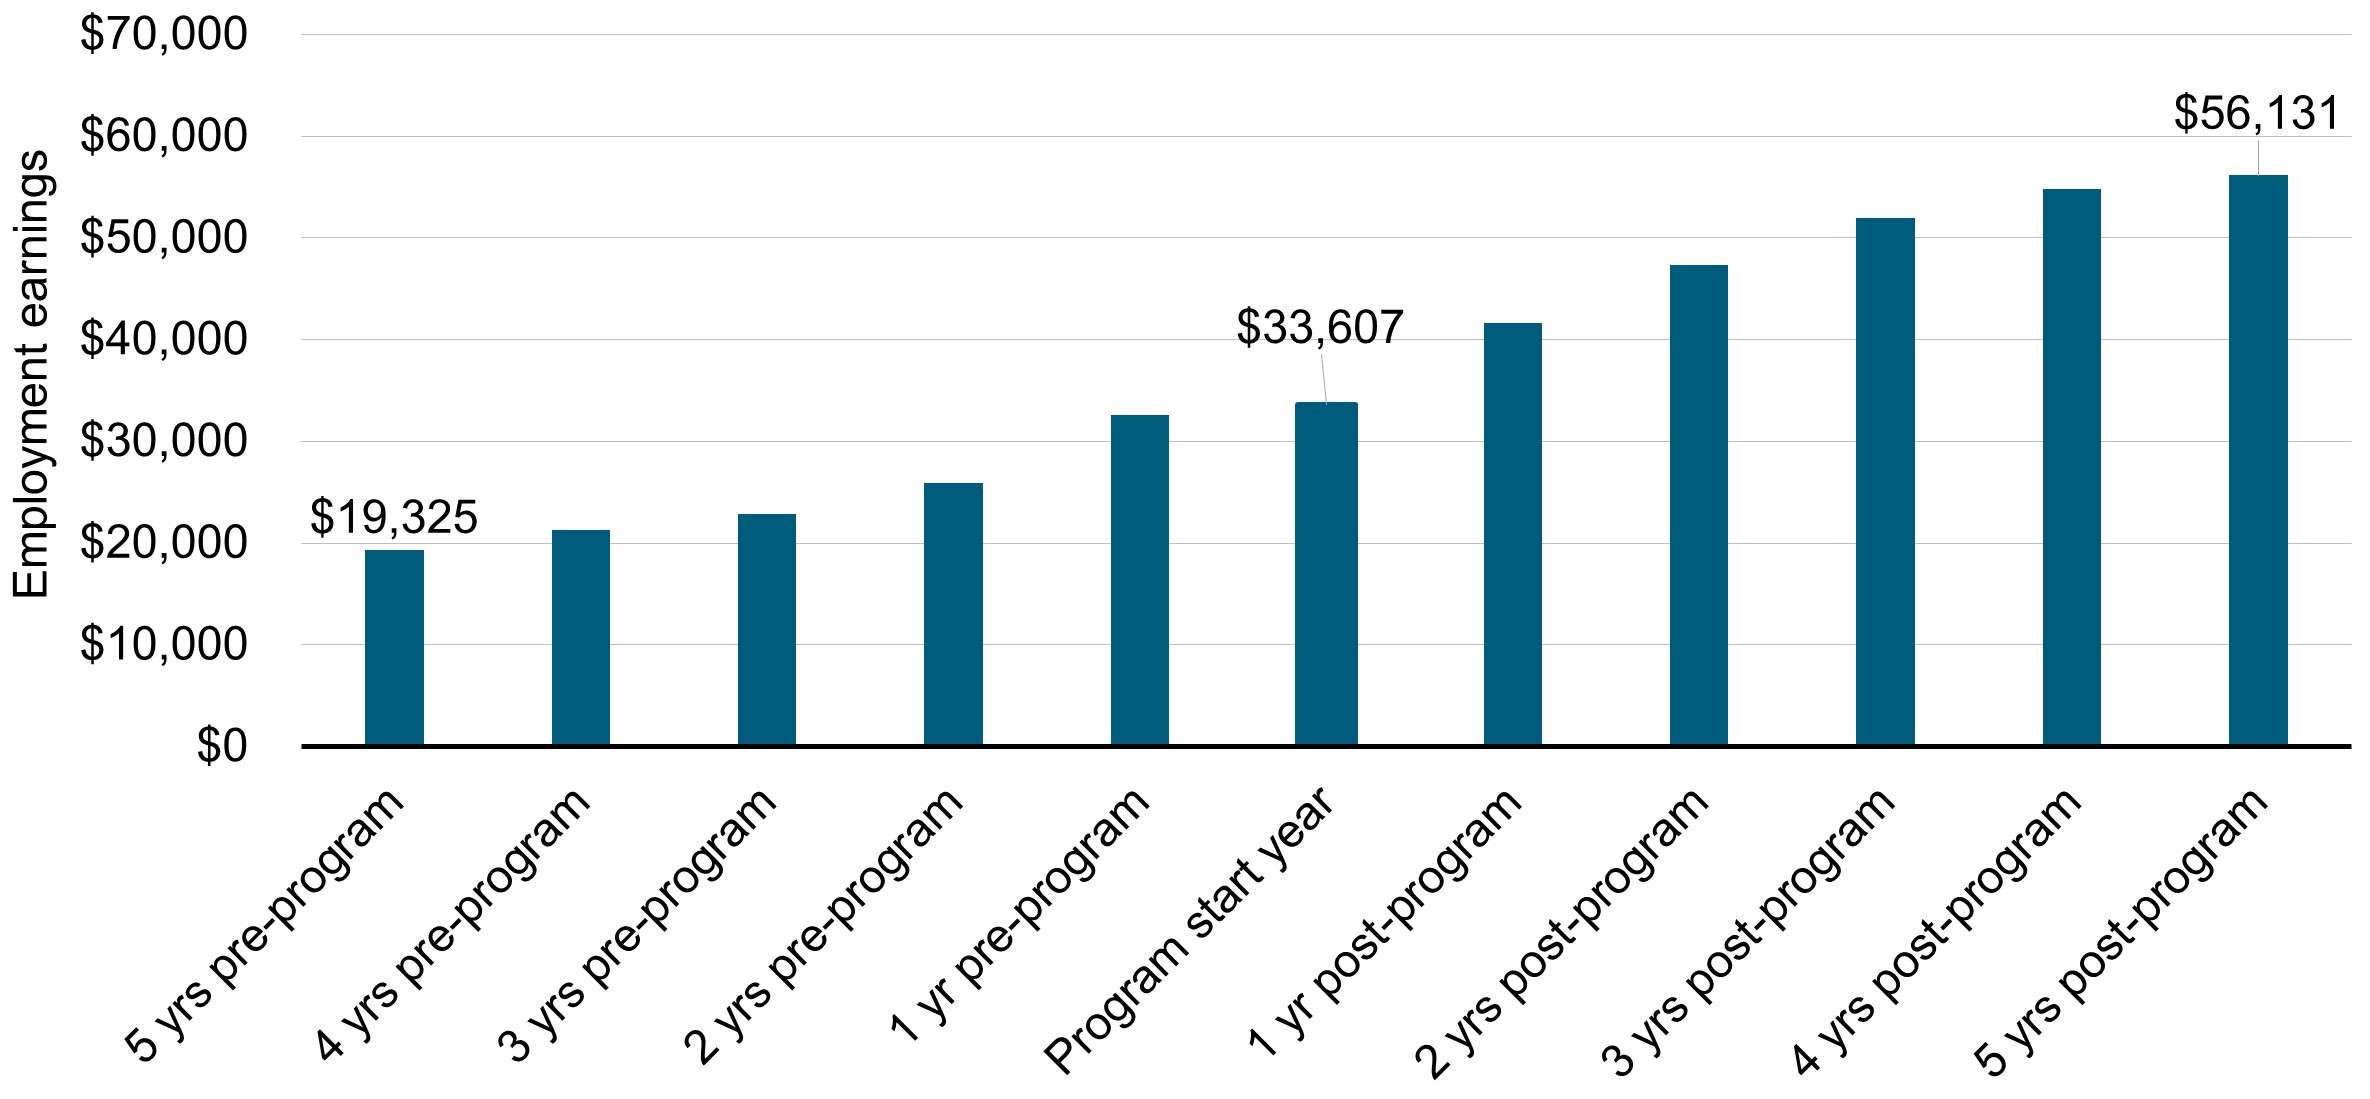
Text Description – Chart 6
| Year pre-post participation | Employment earnings for active claimants |
|---|---|
| 5 years pre-program | $19,325 |
| 4 years pre-program | $21,309 |
| 3 years pre-program | $22,841 |
| 2 years pre-program | $25,890 |
| 1 year pre-program | $32,552 |
| Program start year | $33,607 |
| 1 year post-program | $41,638 |
| 2 years post-program | $47,322 |
| 3 years post-program | $51,971 |
| 4 years post-program | $54,795 |
| 5 years post-program | $56,131 |
The proportion of employed participants declines by 1 percentage point annually after the program start year, but remains around 96%. The proportion of participants on EI Part I decreases from 100% in the program start year to 35% in the fifth year after the program start year. Participants decrease their dependence on income support from 23% in the program start year to 5% in the fifth year after participation.
Former claimants
As shown in Chart 7, program participants increased their average earnings from $21,772 in the fifth year pre-program to $58,158 in the fifth year after the program start year.
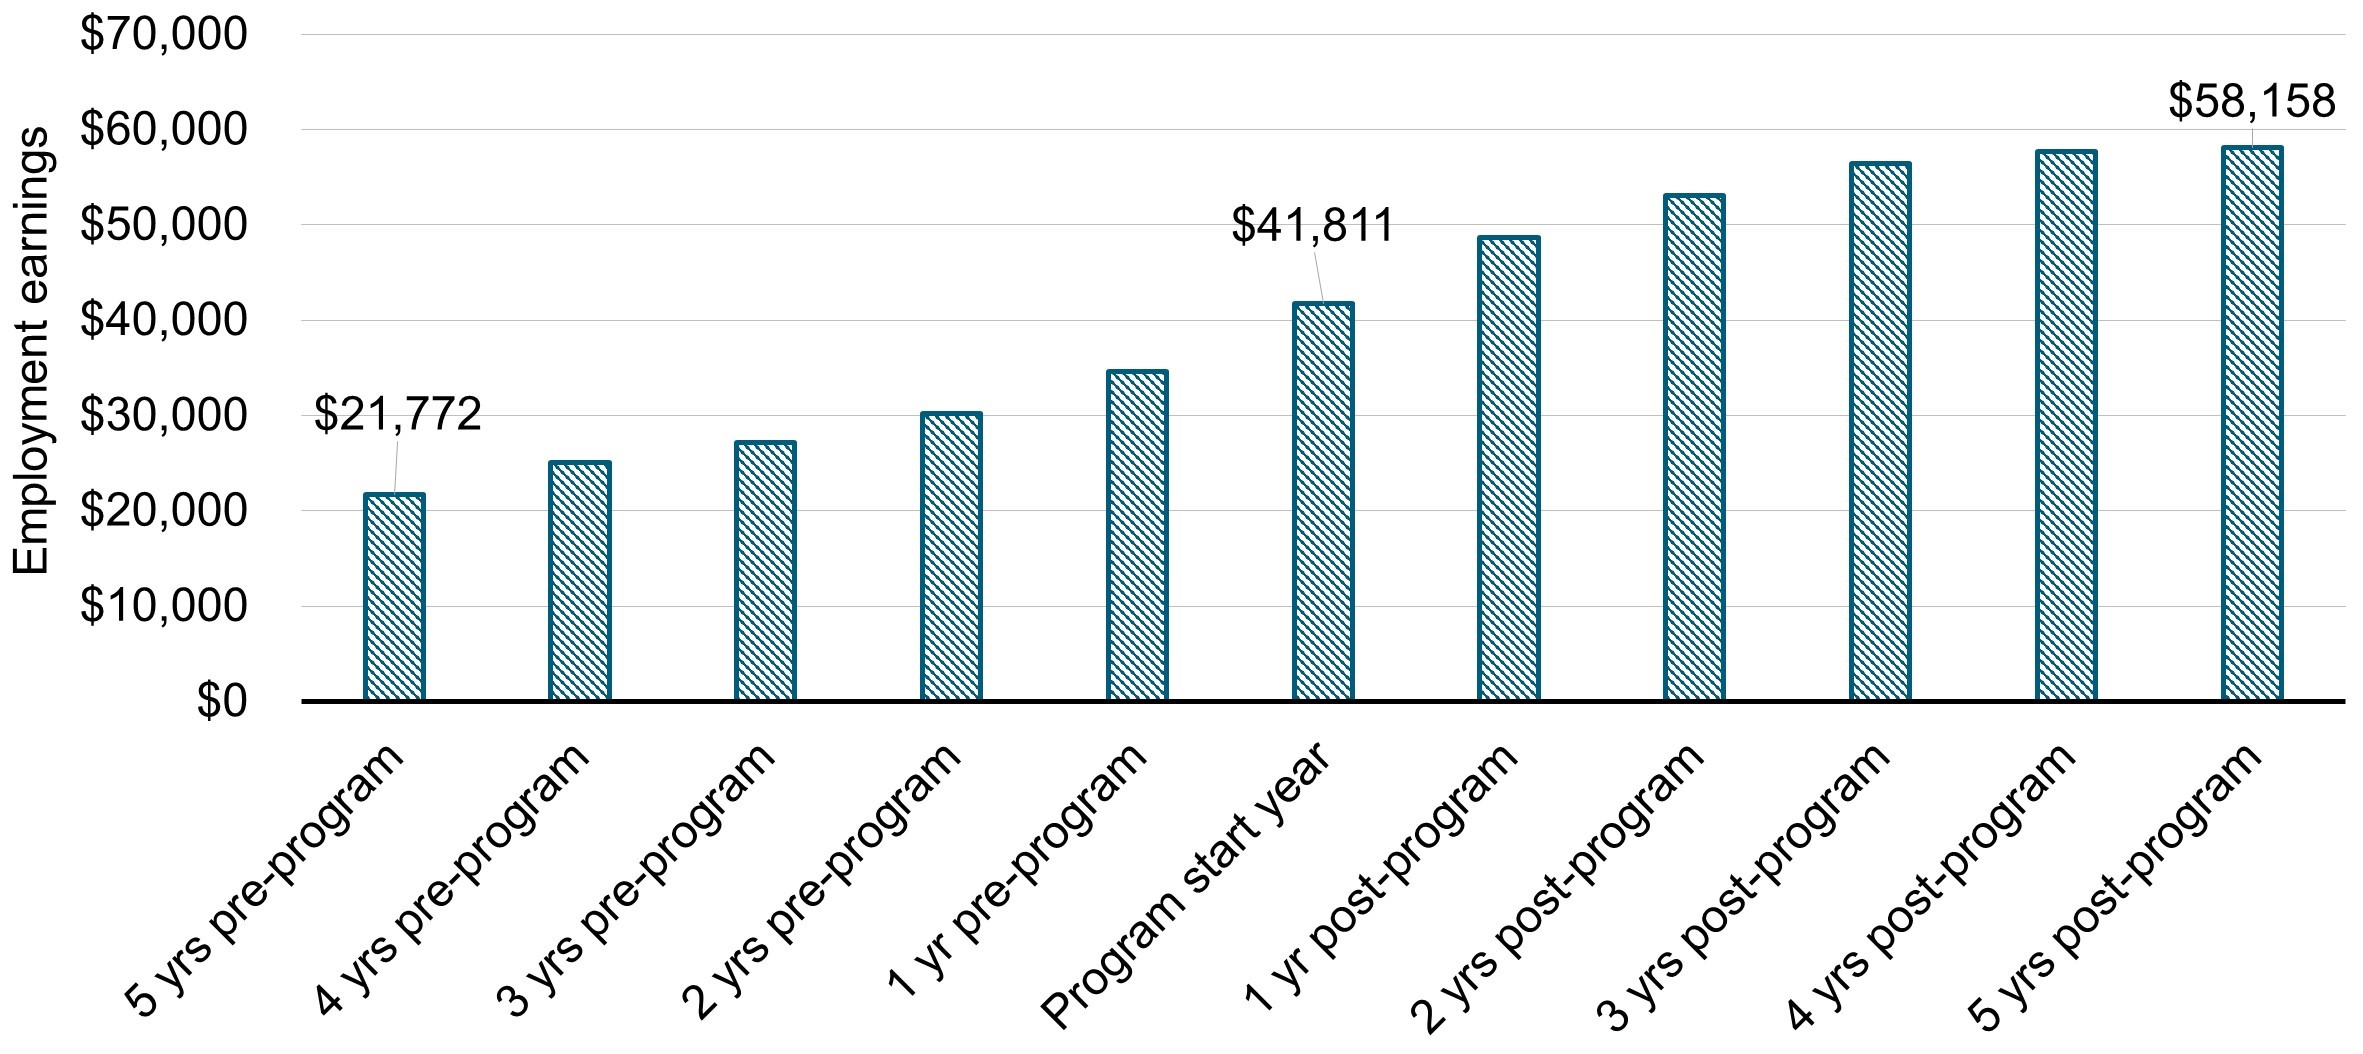
Text Description – Chart 7
| Year pre-post participation | Employment earnings for former claimants |
|---|---|
| 5 years pre-program | $21,772 |
| 4 years pre-program | $25,123 |
| 3 years pre-program | $27,146 |
| 2 years pre-program | $30,176 |
| 1 year pre-program | $34,663 |
| Program start year | $41,811 |
| 1 year post-program | $48,732 |
| 2 years post-program | $53,120 |
| 3 years post-program | $56,470 |
| 4 years post-program | $57,669 |
| 5 years post-program | $58,158 |
The proportion of employed participants declined by 1 percentage point annually after the program start year, but remained around 95%. The proportion of participants on EI Part I decreased from 70% in the program start year to 28% in the fifth year after the program start year. Participants decreased their dependence on income support from 12% in the program start year to 5% in the fifth year after participation.
Conclusions and recommendations
The LMDAs are the largest annual investment in active labour market programs and services in Canada. Based on the findings presented in this report, the EBSMs are meeting the objective of assisting individuals to obtain or keep employment through various active employment programs, including training or employment assistance services.
Summary of findings
Overall, incremental impacts demonstrate that participation in most EBSMs improves labour market attachment and reduces dependence on government income supports compared to similar non-participants. A subgroup analyses shows that with some exceptions, SD and TWS improves the labour market attachment and reduced the dependence on income support for most subgroups of participants. EAS alone was found to improve the labour market attachment for female, Indigenous and recent immigrant participants, and decrease their use of EI. As well, the social benefits of participating in EBSMs exceeds the costs of investments for most interventions over time.
A series of supplemental studies address information gaps previously identified in LMDA evaluations for Self-Employment, JCP, Labour Market Partnerships, Research and Innovation, and SD-Apprentices. Each study identified lessons learned, best practices and challenges, and issued when relevant considerations for policy design and development.
Overall, the following findings emerged from these studies.
The Self-Employment program helps carefully selected participants to create employment for themselves by providing them with a range of services.
Provinces and territories use JCP to address a variety of barriers to employment experienced by their citizens (such as, a lack of work experience). In addition, provinces and territories use these programs to address the various labour market needs of subgroups of individuals, employers, and communities. It is difficult to quantify all the positive impacts of JCP for individuals, employers and communities.
Provinces and territories use Labour Market Partnerships programs to assist employers, communities and/or industries to address their labour force adjustment and human resource needs. The current performance indicators do not reflect the diversity of funded activities. Therefore, it is important for ESDC and provinces/territories to discuss current funded activities in order to make recommendations on how to best report on results.
The Research and Innovation support measure is used by provinces and territories to fund labour market research and demonstration projects. There is an added value in documenting and sharing of lessons learned and best practices from demonstration projects.
After participating in SD, apprentices increase their employment earnings and decrease their dependence on government income supports.
Recommendations
Since 2012, 15 qualitative and quantitative studies addressed issues and questions related to EBSM design, delivery and effectiveness. The quantitative studies successfully assessed the effectiveness and efficiency of EBSMs by producing incremental impacts and cost-benefit analysis. The qualitative studies identified specific challenges, lessons learned and best practices associated with the design and delivery of EBSMs. Each study included key considerations for program and policy development or recommendations.
The recently completed evaluation of the Workforce Development Agreements complements the LMDA qualitative studies. This evaluation was also supported by literature reviews and provided unique insights into challenges and lessons learned to assist persons with disabilities, immigrants and those further removed from the labour market.
Most results from this evaluation stem from the conduct of advance causal analysis whereby impacts found could be attributed to a specific EBSM. These analyses are predicated on having access to high quality administrative records, thereby confirming the importance of the capacity to leverage and integrate relevant administrative data.
From these main findings, 2 key recommendations emerge:
Recommendation #1: ESDC and provinces/territories are encouraged to share and discuss lessons learned, best practices and challenges associated with the design and delivery of EI-funded provincial/territorial programming. Discussions are encouraged at the bilateral or multilateral levels as well as with service delivery network if necessary.
Recommendation #2: ESDC and provinces/territories are encouraged to pursue efforts to maintain and strengthen data collection provisions in support of reporting, performance measurement and data-driven evaluations at the national and provincial/territorial levels. To that regard, ESDC should:
- continue to prioritize data integrity, including validating data uploads and documenting changes over time
- explore ways of accessing data on social assistance, unsuccessful EI applicants, and immigration and citizenship, in light of expanded eligibility to the LMDAs beyond active and former EI claimants
References
Allin, S., Corscadden, L., Gapanenko, K., & Grignon, M. Lifetime Distributional Effects of Publicly Financed Health Care in Canada. CIHI, 2013.
Athey, S., and Imbens, G. Machine Learning Methods Economists Should Know About. Annual Review of Economics, 2019.
Douwere G. and Huju Liu. The Entry into and Exit out of Self-employment and Business Ownership in Canada. Statistics Canada, 2018.
Employment and Social Development Canada. Cost-Benefit Analysis: Incorporating Public Health Care Costs Savings in the Context of the Labour Market Programs Evaluation. Internal document, 2022. Available upon request.
Employment and Social Development Canada. Cycle II of the Evaluation of the Labour Market Development Agreements: Cost-Benefit Analysis of Employment Benefits and Support Measures. Internal document, 2015. Available upon request.
Employment and Social Development Canada. Design and delivery of the Job Creation Partnerships program. Internal report, 2019. Available upon request.
Employment and Social Development Canada. Employment Insurance Monitoring and Assessment Reports. 2011 to 2022.
Employment and Social Development Canada. Evaluation of the Labour Market Development Agreements, Design and delivery of the self-employment program. Internal report, 2020. Available upon request.
Employment and Social Development Canada. Heterogeneous Causal Effects of the Canadian Labour Market Development Agreements: A Machine Learning Approach. Internal report, 2022. Available upon request.
Employment and Social Development Canada. Horizontal evaluation of the Labour Market Development Agreements, Design and delivery of the Labour Market Partnerships program. Internal document, 2021. Available upon request.
Employment and Social Development Canada. Labour Market Development Agreements Process for Determination of Similarity. Internal document, 2012. Available upon request.
Employment and Social Development Canada. Technical Report on the Analysis of Employment Benefits and Support Measures (EBSMs) Profile, Outcomes and Medium-Term Incremental Impacts from 2010 to 2017. Internal report, 2021. Available upon request.
Employment and Social Development Canada. Third Cycle for the Horizontal Evaluation of the Labour Market Development Agreements: Quantitative Methodology Report. Internal document, 2019. Available upon request.
Lechner, M. Modified Causal Forests for Estimating Heterogeneous Causal Effects. 2019.
Appendix A. Heterogeneity of treatment effects study findings for active EI claimants in Skills Development
A supplemental study, the heterogeneity of treatment effects,Footnote 54 examines alternative methods to traditional incremental impact analysis. This new method uses newly developed causal machine learning methods to examine whether the effectiveness of EBSMs varies across participants’ sociodemographic characteristics. Footnote 55,Footnote 56
In general, machine learning methods are used either for predictive or descriptive purposes. Unlike typical machine learning algorithms, causal machine learning is not trying to predict an outcome, but to estimate an incremental impact. These methods are able to estimate impacts at a very fine-grained level (in this case, at the participant level) and can also be used to systematically detect groups with heterogeneous effects.
The incremental impacts estimated using machine learning methods differ from those estimated using propensity score kernel matching techniques combined with difference-in-differences estimators. The reason for this difference is due to using different estimators. However, it is important to note that the direction of the findings under both methods is consistent.
The study outlines the causal machine learning methods used to capture heterogeneous incremental impacts of participation in EBSMs under the LMDAs. It was carried out in 2020 to 2021, as a component of the third cycle for the Horizontal Evaluation of the LMDAs. This study covers active claimants in SD who began participating in EBSMs delivered under LMDAs across Canada between April 1, 2010 and December 31, 2012.
The unit of analysis is the Action Plan Equivalent.
The sample sizes used for this study, including participant sociodemographic characteristics, are summarized below.
| Categories | SD active EI claimants |
|---|---|
| Number of observations | 33,234 |
| Sample selected of all participants | 40% |
| Average Duration (weeks) | 49 |
| Male | 53% |
| Female | 47% |
| Average age (years) | 37 |
| Single | 45% |
| Recent Immigrants | 11% |
| Person with disability | 4% |
| Visible minority | 5% |
| Indigenous individual | 4% |
The main estimation method is the Modified Causal Forests algorithm. It was implemented to detect heterogeneity as part of program effects. This method allows for the estimation of individual average treatment effects and uncovers substantial heterogeneity effects across participants.
Using the Modified Causal Forest algorithm, net impacts can be estimated at 3 levels of aggregation:
- Individualized Average Treatment Effect (IATE): measure the average impact a treatment has for individuals with a given set of characteristics. This represents the incremental impacts at the finest aggregation level of the features available
- Average Treatment Effect (ATE) and Average Treatment Effect on the Treated (ATET): represent the population averages and participants’ population averages, respectively. These 2 levels of aggregation are considered the classical parameters investigated in many econometric causal studies
- Group Average Treatment Effect (GATE): parameters are in between Individualized Average Treatment Effect and Average Treatment Effect with respect to their aggregation levels. It is similar to traditional subgroup analysis where one preselects the variables prior to estimation according to policy interest
These include ATET, GATE, and IATE. The table below reports the annual average post-program incremental impacts for SD active EI claimant participants.
SD interventions help active claimants increase their labour market attachment through increases in employment and earnings and decreases in dependence on government income supports. The table below details the incremental impacts found.
| Indicators | Average Treatment Effect on the Treated |
|---|---|
| Incidence of employment (percentage points) | 3.9*** |
| Employment earnings | $1997*** |
| Dependence on income support (percentage points) | -1.1*** |
Statistical significance level *** 1%; ** 5%; * 10%
The IATE estimates the incidence of employment, employment earnings, and dependence on income support at the granular level. On average, SD interventions benefited:
- 82% of participants in terms of incidence of employment
- 68% of participants in terms of employment earnings
- 70% of participants to reduce their reliance on income support
In an additional analysis, k-means clustering was conducted to better understand the individuals who are most or least benefitting from interventions. The algorithm partitions the population of participants into distinct clusters.
Clustering is performed using the IATE for each outcome and intervention separately. The groups are then ordered according to program effectiveness and profiled to obtain an informal characterization of subgroups and detect patterns of heterogeneity.
Chart A.1 presents the percentage of participants benefiting from program participation by all participants and subgroups of interest.
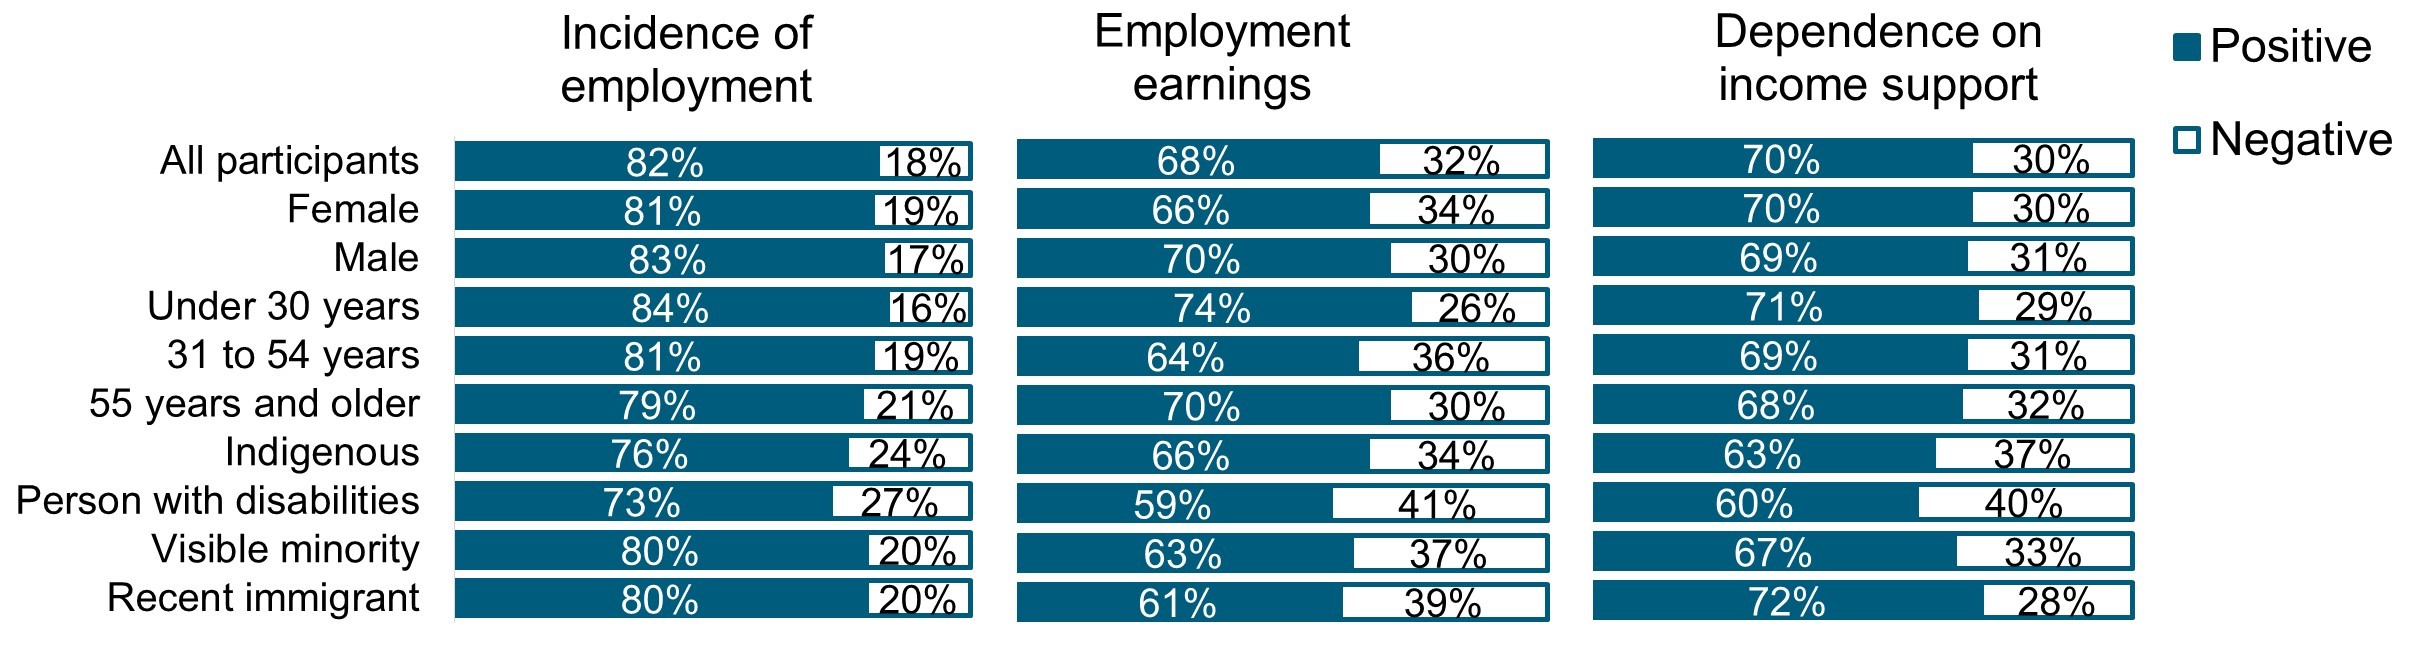
Text description – Chart A1
Chart A1 provides a visual representation of the following 3 tables showing the IATE in terms of percent of all participants and subgroups with positive and negative incremental impacts for incidence of employment, employment earnings and dependence on government income support.
| Active EI claimant participants in Skills Development | Individualized Average Treatment Effect on incidence of employment Positive effect | Individualized Average Treatment Effect on incidence of employment Negative effect |
|---|---|---|
| All active EI claimant | 82% | 18% |
| Females | 81% | 19% |
| Males | 83% | 17% |
| Under 30 years | 84% | 16% |
| 31 to 54 years | 81% | 19% |
| 55 years and older | 79% | 21% |
| Indigenous people | 76% | 24% |
| Person with disabilities | 73% | 27% |
| Visible minorities | 80% | 20% |
| Recent immigrants | 80% | 20% |
| Active EI claimant participants in Skills Development | Individualized Average Treatment Effect on employment earnings Positive effect | Individualized Average Treatment Effect on employment earnings Negative effect |
|---|---|---|
| All active EI claimants | 68% | 32% |
| Females | 66% | 34% |
| Males | 70% | 30% |
| Under 30 years | 74% | 26% |
| 31 to 54 years | 64% | 36% |
| 55 years and older | 70% | 30% |
| Indigenous people | 66% | 34% |
| Person with disabilities | 59% | 41% |
| Visible minorities | 63% | 37% |
| Recent immigrants | 61% | 39% |
| Active EI claimant participants in Skills Development | Individualized Average Treatment Effect on dependence on income support Positive effect | Individualized Average Treatment Effect on dependence on income support Negative effect |
|---|---|---|
| All active EI claimants | 70% | 30% |
| Females | 70% | 30% |
| Males | 69% | 31% |
| Under 30 years | 71% | 29% |
| 31 to 54 years | 69% | 31% |
| 55 years and older | 68% | 32% |
| Indigenous people | 63% | 37% |
| Person with disabilities | 60% | 40% |
| Visible minorities | 67% | 33% |
| Recent immigrants | 72% | 28% |
Further, the study examines how the GATE varies across select sociodemographic groups. The findings reveal that for all subgroups in SD there are positive and statistically significant improvements in incidence of employment and earnings.
The following charts illustrate the GATE by subgroups for incidence of employment, employment earnings and dependence on government income supports. For example, Chart A2 demonstrates that all subgroups of SD participants had positive and statistically significant improvements in incidence of employment. Relative to similar non-participants older workers and female participants experienced the largest impacts.
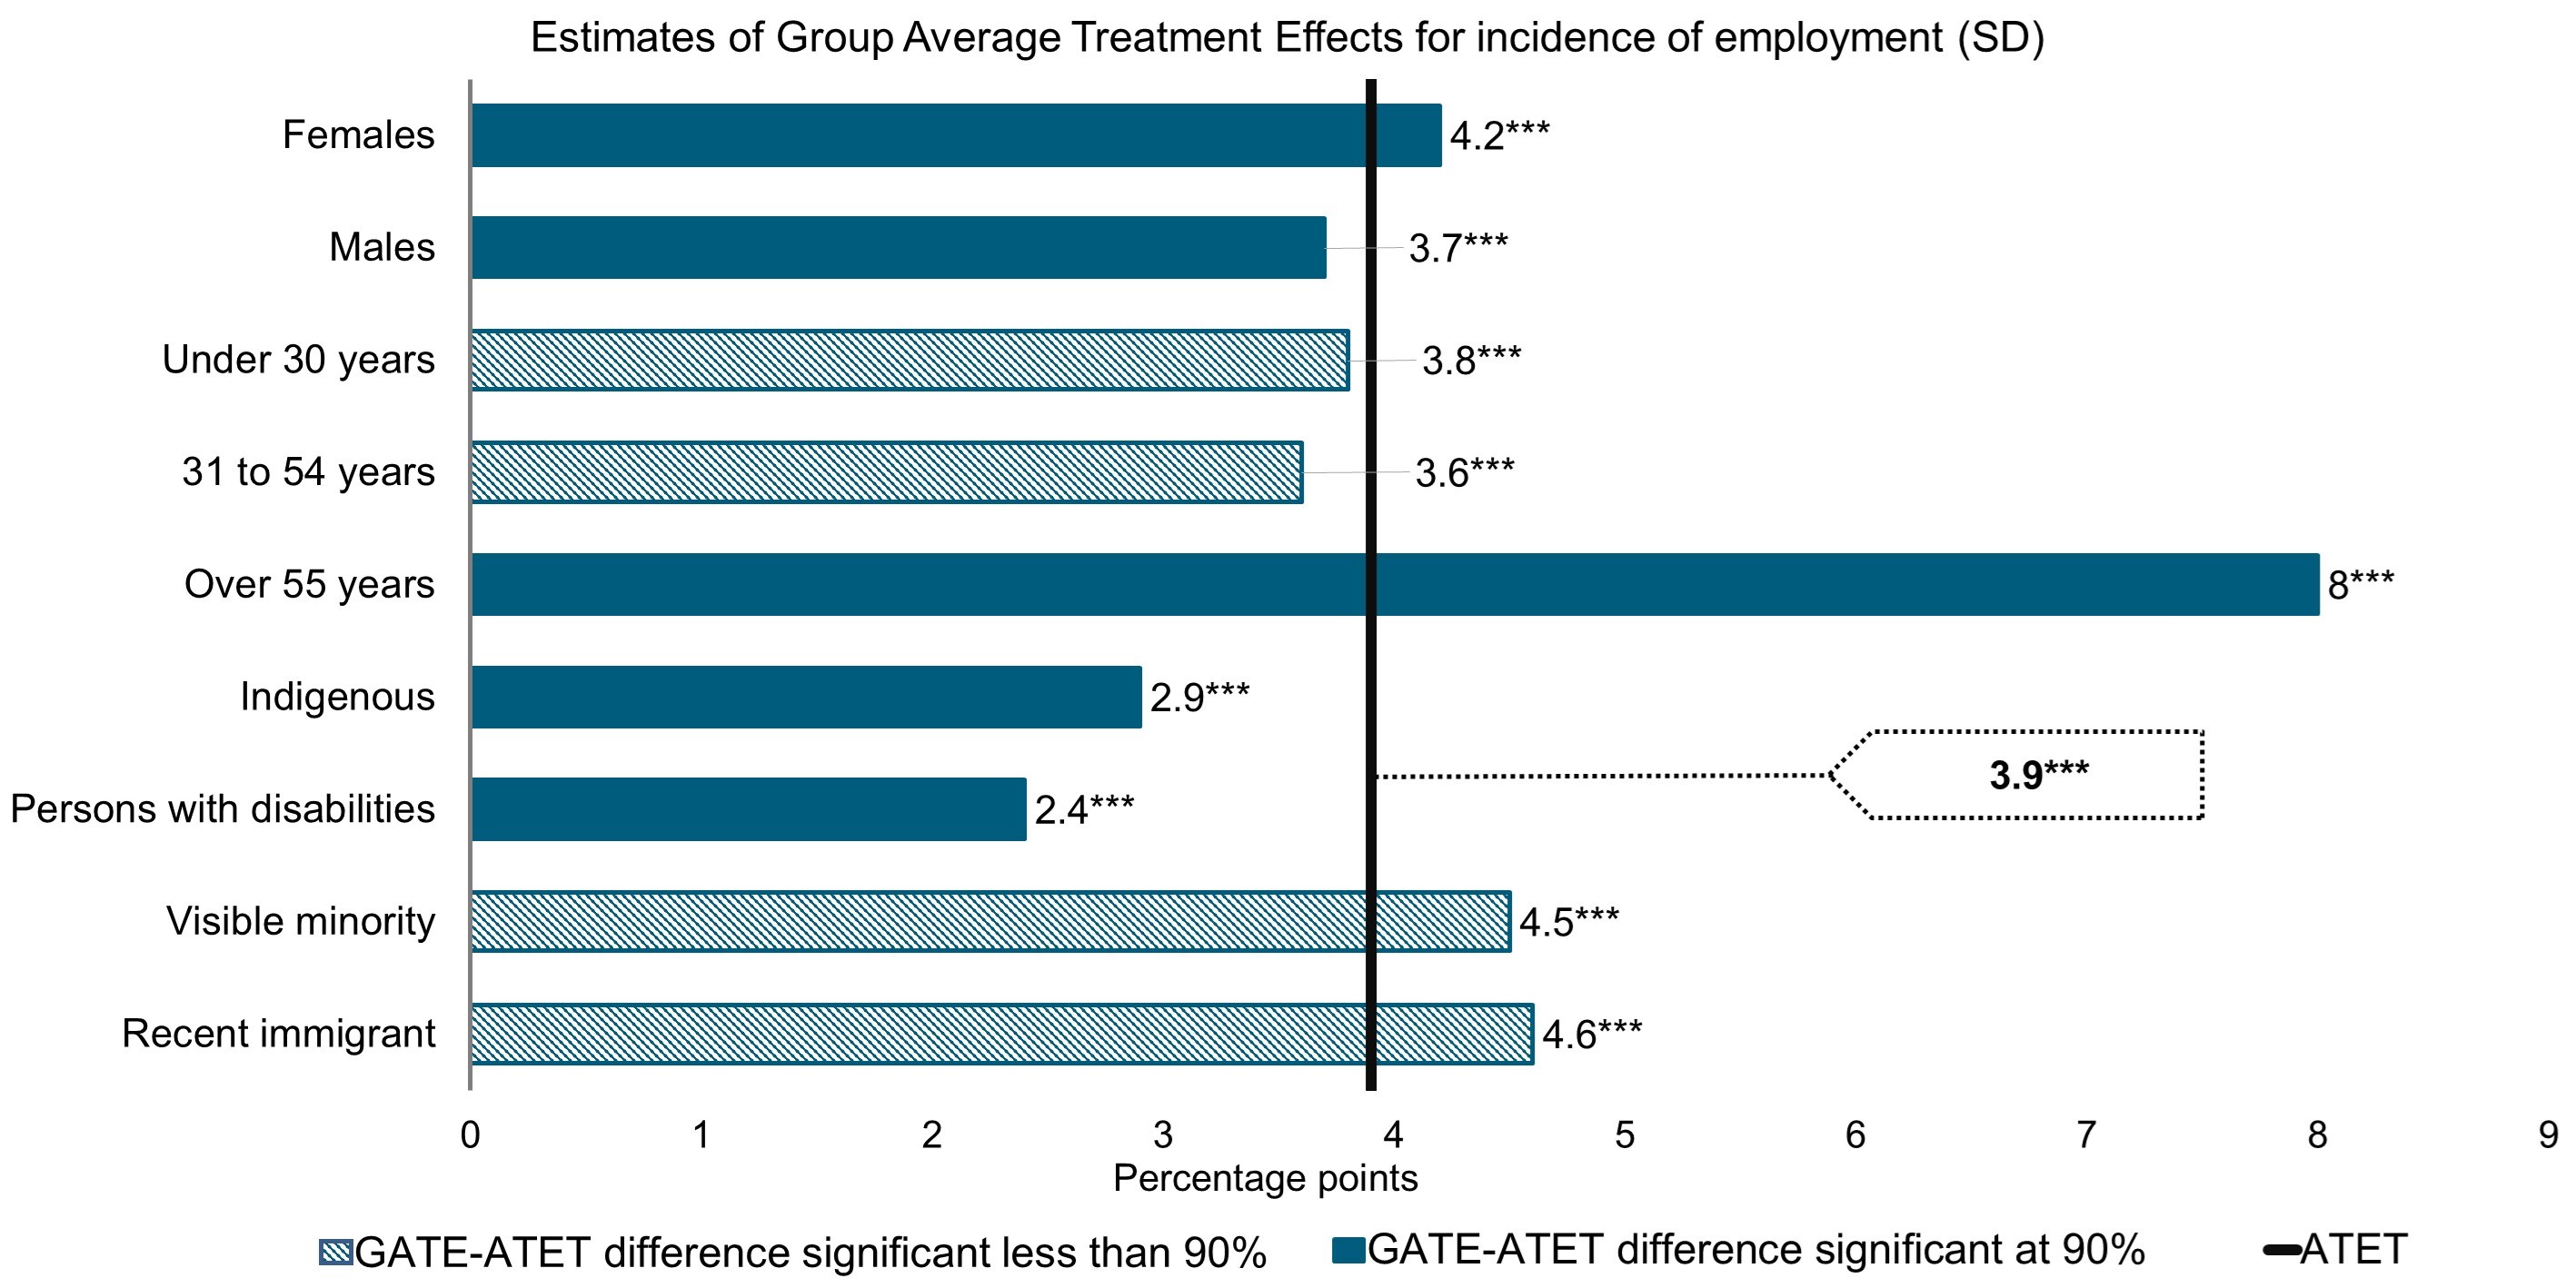
Statistical significance level *** 1%; ** 5%; * 10%
Text description – Chart A2
Chart A2 provides a visual representation of the data from the following 2 tables presenting the ATET for incidence of employment for all active claimant participants in SD; the GATE for incidence of employment by subgroups of active claimant participants in SD and whether or not a statistically significant difference was found between the GATE and ATET for incidence of employment by subgroups.
| Participants in Skills Development | Average Treatment Effect on the Treated for incidence of employment (percentage points) |
|---|---|
| All active EI claimants | 3.9*** |
Statistical significance level *** 1%; ** 5%; * 10%
| Subgroups of active EI claimant participants in Skills Development | Group Average Treatment Effect for incidence of employment (percentage points) | Statistically significant difference between Group Average Treatment Effect and Average Treatment Effect on the Treated at 90% or higher (YES/NO) |
|---|---|---|
| Females | 4.2*** | YES |
| Males | 3.7*** | YES |
| Under 30 years | 3.8*** | NO |
| 31 to 54 years | 3.6*** | NO |
| Over 55 years | 8*** | YES |
| Indigenous people | 2.9*** | YES |
| Persons with disabilities | 2.4*** | YES |
| Visible minorities | 4.5*** | NO |
| Recent immigrants | 4.6*** | NO |
Statistical significance level *** 1%; ** 5%; * 10%
Chart A3 demonstrates that all SD subgroups experienced positive and statistically significant improvements in employment earnings. It was found that SD is most effective in improving the employment earnings of youth and male participants.
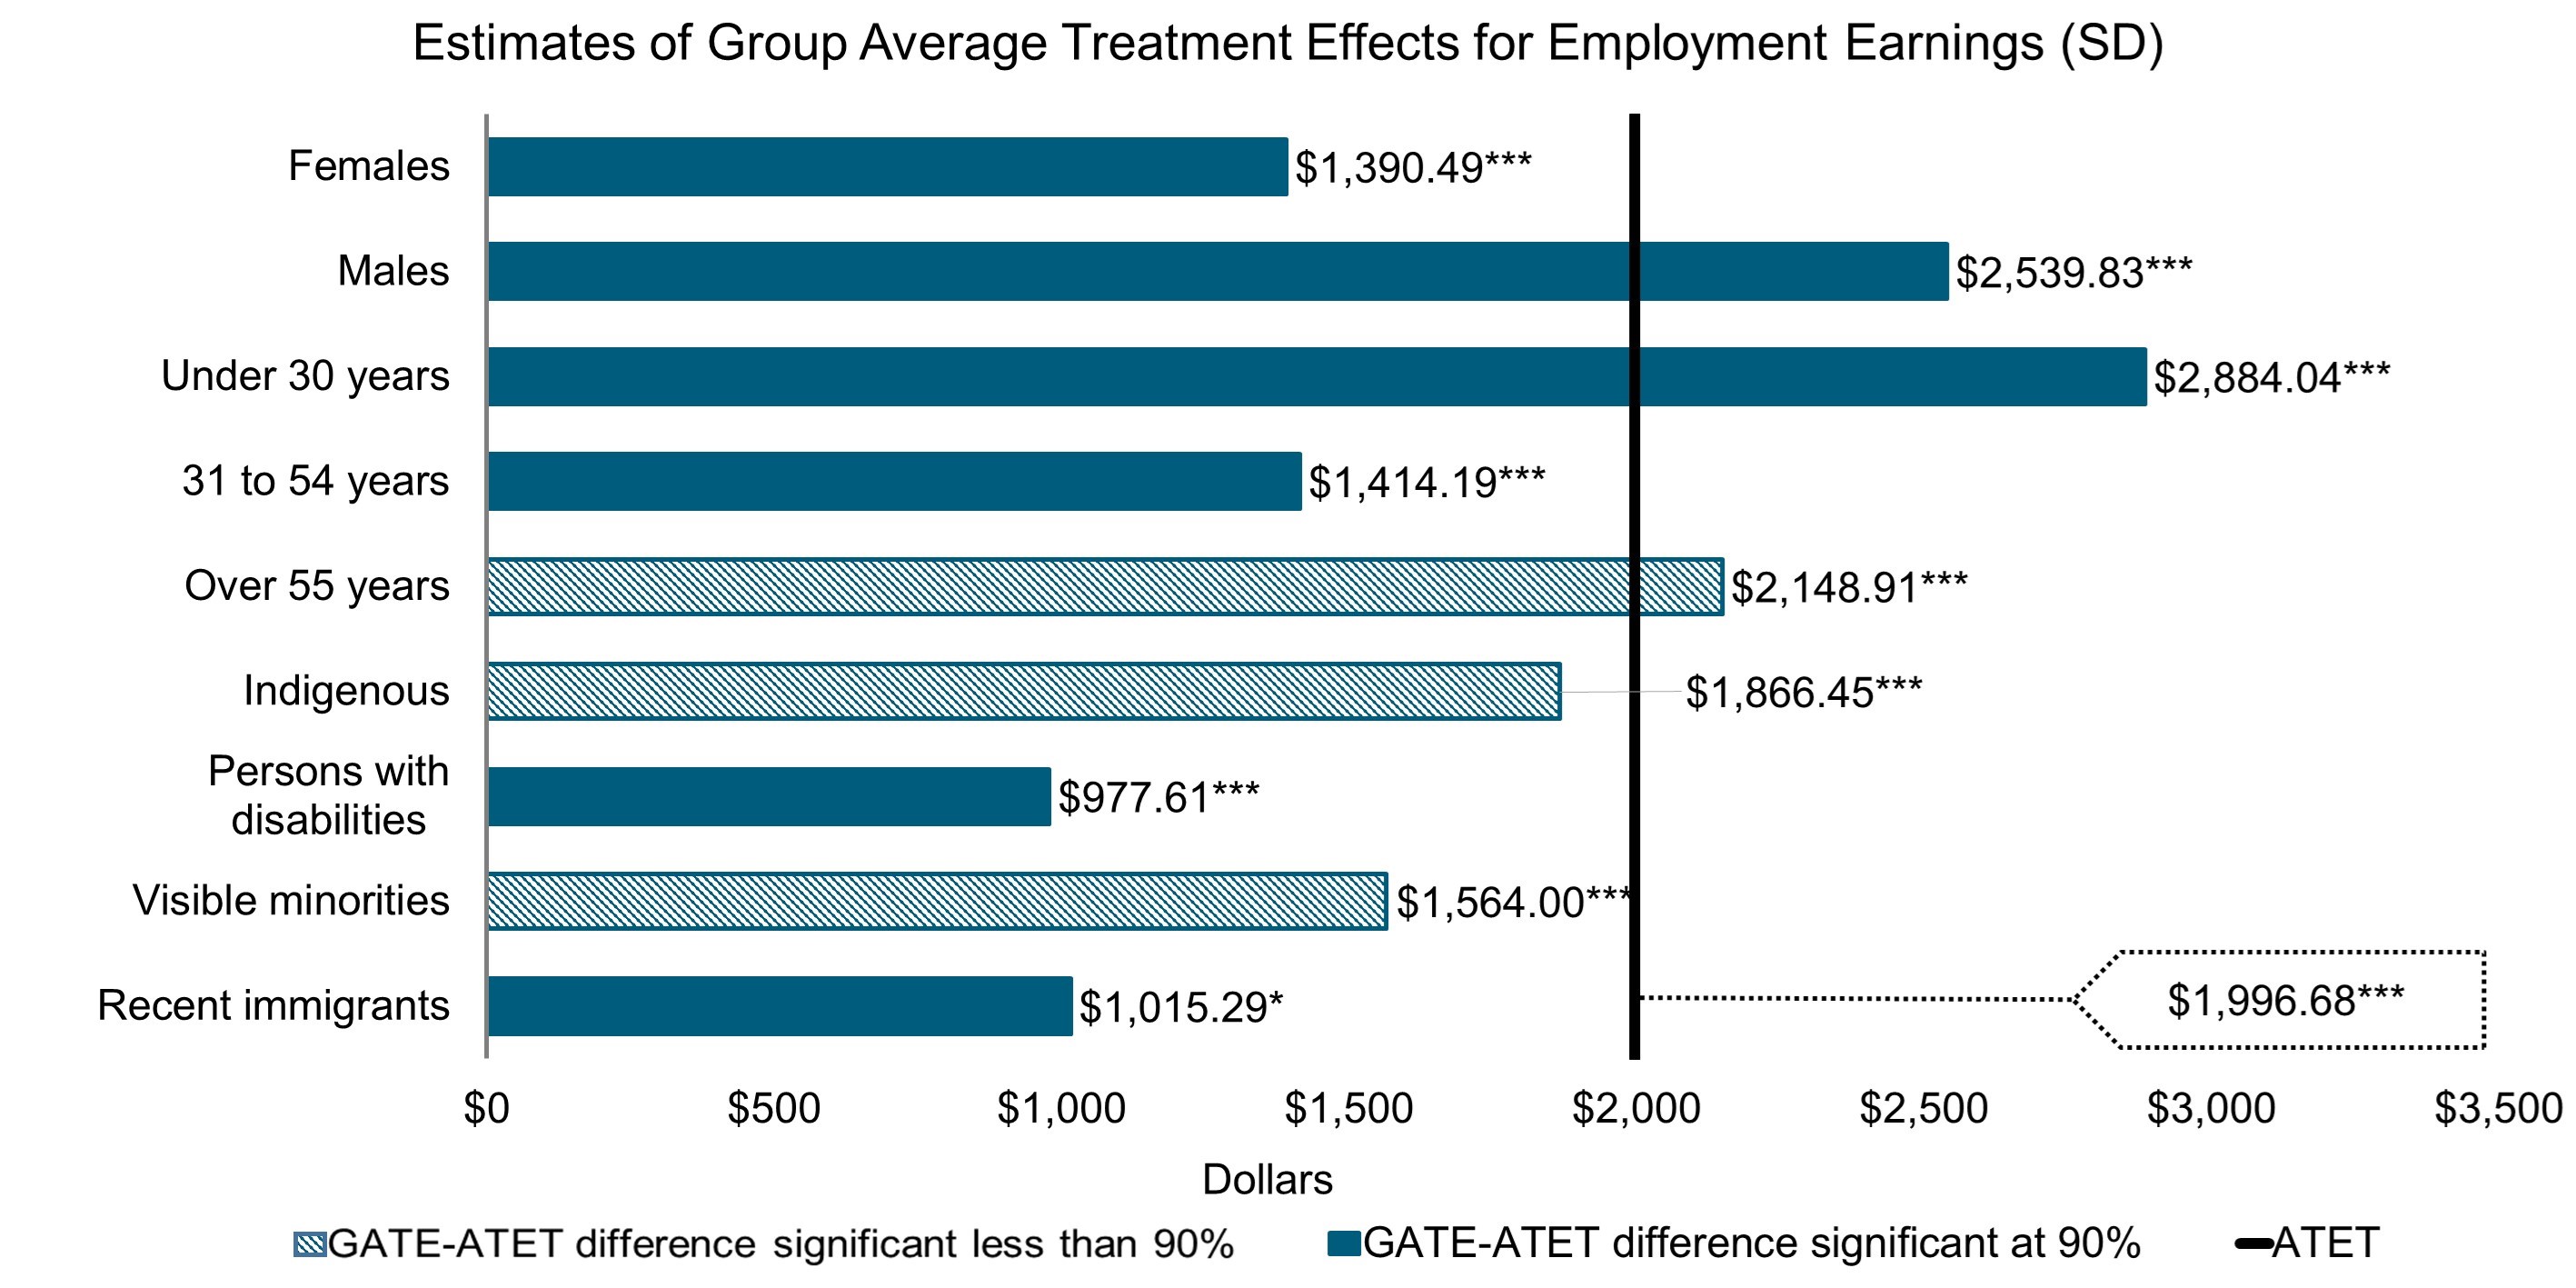
Statistical significance level *** 1%; ** 5%; * 10%
Text description – Chart A3
Chart A3 provides a visual representation of the data from the following 2 tables presenting the ATET for employment earnings for all active claimant participants in SD; the GATE for employment earnings by subgroups of active claimant participants in SD and whether or not a statistically significant difference was found between the GATE and ATET for employment earnings by subgroups of active claimant participants in SD.
| Participants in Skills Development | Average Treatment Effect on the Treated for employment earnings ($) |
|---|---|
| All active EI claimants | $1,996,68*** |
Statistical significance level *** 1%; ** 5%; * 10%
| Subgroups of active EI claimant participants in Skills Development | Group Average Treatment Effect for employment earnings ($) | Statistically significant difference between Group Average Treatment Effect and Average Treatment Effect on the Treated at 90% or higher (YES/NO) |
|---|---|---|
| Females | $1,390.49*** | YES |
| Males | $2,539.83*** | YES |
| Under 30 years | $2,884.04*** | YES |
| 31 to 54 years | $1,414.19*** | YES |
| Over 55 years | $2,148.91*** | NO |
| Indigenous people | $1,866.45*** | NO |
| Persons with disabilities | $977.61*** | YES |
| Visible minorities | $1,564.00*** | NO |
| Recent immigrants | $1,015.29* | YES |
Statistical significance level *** 1%; ** 5%; * 10%
Chart A4 shows that findings vary by subgroups of SD participants. For example, females, males, youth, adults (31 to 54 years of age), and recent immigrants all experience statistically significant reductions in dependence on government income supports after SD participation. Youth participants were found to benefit the most in terms of reducing their dependence on government income supports.
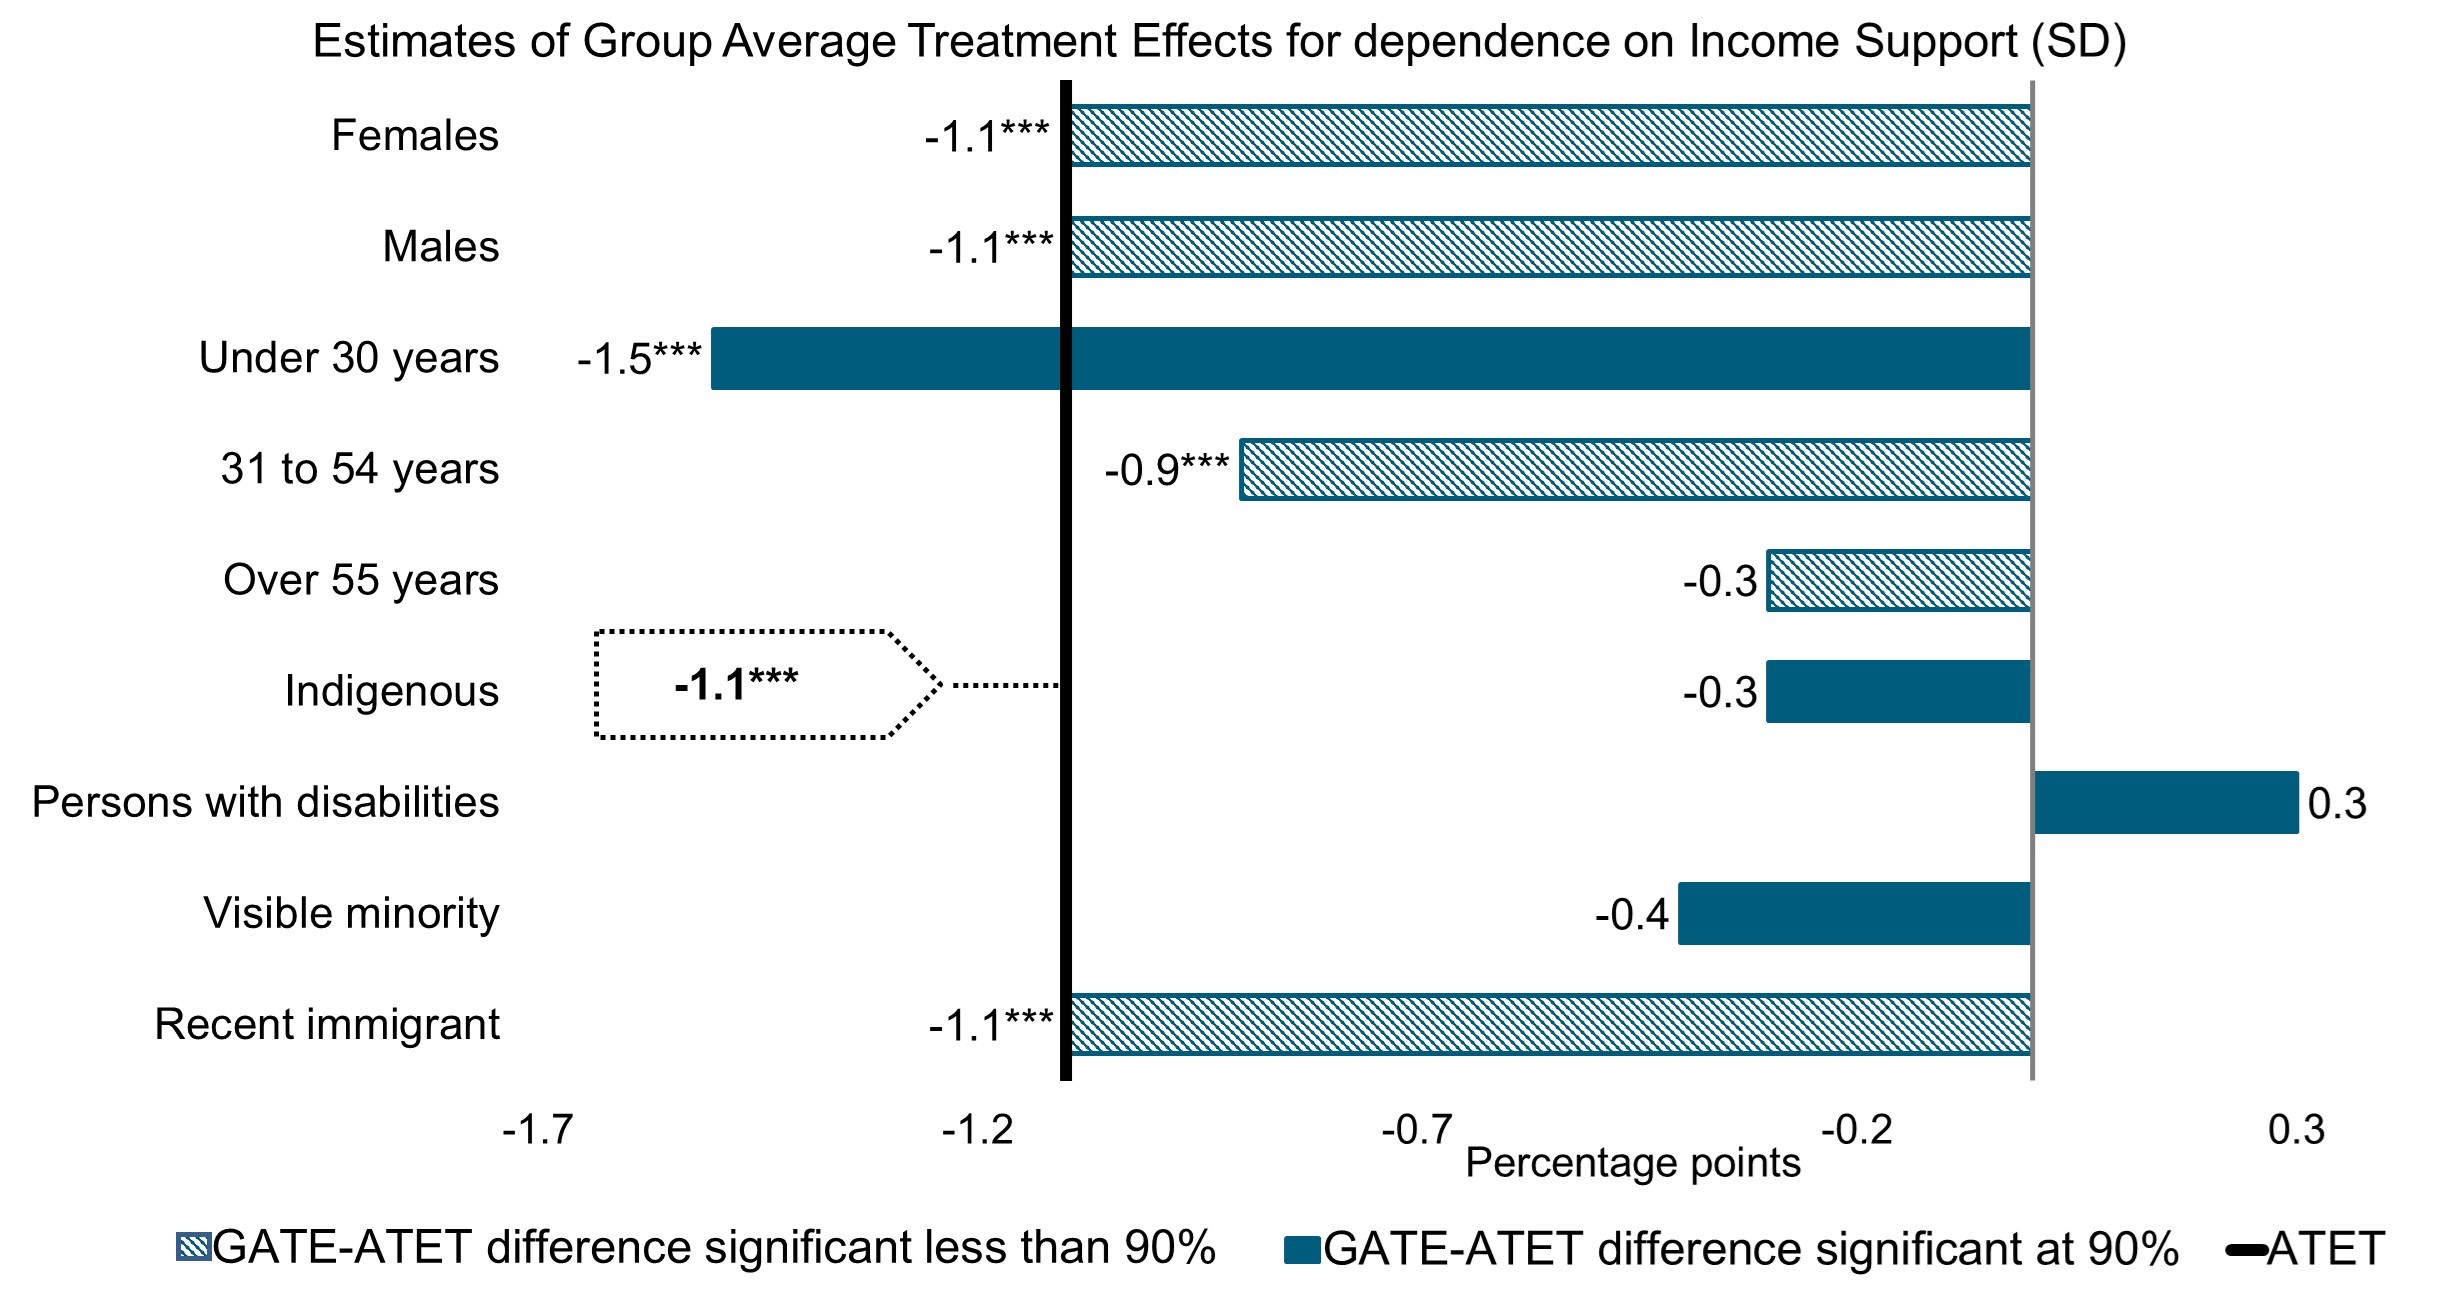
Statistical significance level *** 1%; ** 5%; * 10%
Text description – Chart A4
Chart A4 provides a visual representation of the data from the following 2 tables presenting the ATET for dependence on income support for all active claimant participants in SD; the GATE for dependence on income support by subgroups of active claimant participants in SD and whether or not a statistically significant difference was found between the GATE and ATET for dependence on income support by subgroups of active claimant participants in SD.
| Participants in Skills Development | Average Treatment Effect on the Treated for dependence on income support (percentage points) |
|---|---|
| All active EI claimants | -1.1*** |
Statistical significance level *** 1%; ** 5%; * 10%
| Subgroups of active EI claimant participants in Skills Development | Group Average Treatment Effect for incidence of employment (percentage points) | Statistically significant difference between Group Average Treatment Effect and Average Treatment Effect on the Treated at 90% or higher (YES/NO) |
|---|---|---|
| Females | -1.1*** | NO |
| Males | -1.1*** | NO |
| Under 30 years | -1.5*** | YES |
| 31 to 54 years | -0.9*** | NO |
| Over 55 years | -0.3 | NO |
| Indigenous people | -0.3 | YES |
| Persons with disabilities | 0.3 | YES |
| Visible minorities | -0.4 | YES |
| Recent immigrants | -1.1*** | NO |
Statistical significance level *** 1%; ** 5%; * 10%
The Modified Causal Forest algorithm is able to simultaneously yield aggregate level and heterogeneous treatment effects. This allows for robust and precise estimates of EBSM intervention effects on sociodemographic groups. It is also possible to detect and quantify the amount by which select subgroups benefit the most or least from these interventions. This information may help to inform program and policy making decisions in the future.
Appendix B. List of 9 studies included in this national synthesis report
Overview of studies included in this synthesis report
Study 1: Examination of medium-term outcomes from 2010 to 2017
Evidence generated: national level profile of active and former EI claimants; outcomes by claimant type and by subgroup
Methods: before and after results of program participation
Reference period: 2010 to 2012 participants
Observation period: up to 12 years (5 years before participation, 1 to 2 years of participation, and 5 years after participation)
Study 2: Estimation of medium-term incremental impacts from 2010 to 2017
Evidence generated: incremental impacts for active and former EI claimants; incremental impacts by subgroup; profile and socio-demographic characteristics of participants
Methods: non-experimental method using propensity score matching in combination with difference-in-differences; statistical profiling
Reference period: 2010 to 2012 participants
Observation period: up to 7 years (1 to 2 years in program, and up to 5 years after participation)
Study 3: Cost-Benefit Analysis of Employment Benefits and Support Measures
Evidence generated: cost-benefit analysis
Methods: non-experimental method using propensity score matching in combination with Difference-in-Differences; cost-benefit analysis
Reference period: 2010 to 2012 participants
Observation period: 5 years post-program for TWS, JCP and EAS; 10 years post-program for SD and SD youth
Study 4: Cost-Benefit Analysis: Incorporating Public Health Care Costs Savings in the Context of the Labour Market Programs Evaluation
Evidence generated: cost-benefit analysis
Methods: estimation of adjusted annualized healthcare costs
Reference period: 2010 to 2012 participants
Observation period: 5 years post-program for TWS, JCP and EAS; 10 years post-program for SD and SD youth
Study 5: Heterogeneous Causal Effects of the Canadian Labour Market Development Agreements: A Machine Learning approach
Evidence generated: heterogeneous incremental impacts
Methods: use of causal machine learning methods (Causal Modified Forest) to capture heterogeneous incremental impacts
Reference period: 2010 to 2012 participants
Observation period: up to 7 years (1 to 2 years in program, and up to 5 years after participation)
Study 6: Design and delivery of the Job Creation Partnerships program
Evidence generated: program design and delivery; challenges and lessons learned
Methods: non-experimental approach (from cycle II); statistical analysis; document review; 88 semi-structured telephone interviews with 117 key informants (8 provinces and territories)
Reference period: 2015 to 2017 participants
Observation period: 2015 to 2019
Study 7: Design and delivery of the self-employment program
Evidence generated: program design, delivery and success; define outcomes attributed to the program; fill in knowledge gaps; challenges and lessons learned
Methods: document review; statistical analysis of administrative data; Canadian self-employment literature and statistics; 80 semi-structured telephone interviews with 102 key informants (9 provinces and territories); statistical analysis of administrative data; survey of self-employment participants across 9 provinces and territories
Reference period: 2015 to 2017 participants
Observation period: 2015 to 2020
Study 8: Design and delivery of the Labour Market Partnerships program
Evidence generated: program design and delivery; challenges and lessons learned
Methods: document review; questionnaire completed by 11 provinces and territories; 60 interviews with 68 key informants in 10 provinces and territories
Reference period: 2018 to 2020
Observation period: design and delivery at the time of the data collection
Study 9: Design and delivery of the Research and Innovation Support measure
Evidence generated: program design and delivery; challenges and lessons learned
Methods: document review; questionnaire completed by 9 provinces and territories
Reference period: 2017 to 2020
Observation period: design and delivery at the time of the data collection