
Evaluation of the Canada - Nunavut Labour Market Development Agreement
From: Employment and Social Development Canada
Alternate formats

Large print, braille, MP3 (audio), e-text and DAISY formats are available on demand by ordering online or calling 1 800 O-Canada (1-800-622-6232). If you use a teletypewriter (TTY), call 1-800-926-9105.
Executive summary
Introduction
Employment and Social Development Canada (ESDC) worked jointly with Nunavut and 11 other Provinces and Territories (P/Ts) to undertake the 2012 to 2017 second cycle for the Labour Market Development Agreement (LMDA) evaluation. The evaluation cycle consisted of conducting two to three studies per year on the Employment Benefits and Support Measures (EBSMs) similar programming delivered under these agreements. These studies generated evaluation evidence on the effectiveness, efficiency and design/delivery of EBSMs for Canada and participating P/Ts.
Under LMDAs, Canada transfers $2.14B Employment Insurance (EI) Part II funds to P/Ts for the design and delivery of programs and services to help unemployed individuals, mainly eligible under EI, to find and maintain employment.
The programs and services delivered by Nunavut have to correspond to the EBSM categories defined under the EI Act. The following is a short description of the four categories of programs and services examined in the evaluation:
- Skills Development (Adult Learning and Training Supports) helps participants, including apprentices, obtain employment skills by giving them financial assistance in order to attend classroom training.
- Targeted Wage Subsidies (Training on the Job) help participants obtain on-the-job work experience by providing employers with a wage subsidy.
- Self-Employment (Nunavut Entrepreneurial Incentive) provides financial assistance and business planning advice to participants to help them start their own business.
- Job Creation Partnerships provide participants with opportunities to gain work experience that will lead to ongoing employment. Employment opportunities are provided by projects that contribute to developing the community and the local economy.
- Employment Assistance Services such as counselling, job search skills, job placement services, the provision of labour market information and case management.
Three additional programs and services are available under the LMDA and they are: Labour Market Partnerships, Research and Innovation and Targeted Earnings Supplements. They were not evaluated as part of this evaluation. The Targeted Earnings Supplements program is used in one province only while Labour Market Partnerships, and Research and Innovation will be evaluated at a later stage.
Table i provides an overview of the share of funding allocated to the four EBSMs examined and the average cost per participant.
| Program and service | Share of funding 2014 to 2015 | Average cost per participant 2002 to 2005 |
|---|---|---|
| Adult Learning and Training Supports (including for Apprentices) | 38% | $11,107 |
| Training on the Job | 17% | $8,333 |
| Nunavut Entrepreneurship Incentive | 1% | $11,400 |
| Employment Assistance Services | 44% | – |
| Total | 100% | – |
Source: EI Monitoring and Assessment Reports 2002 to 2003 to 2014 to 2015. No participants in Employment Assistance Services were reported between 2002 and 2005 in these reports.
This report presents a summary of the findings from five studies. Results were produced for active and former Employment Insurance Claimants as well as for youth (under 30 years old) and adults (30 years old and over) when the number of participants was sufficient to conduct quantitative analyses. Active EI claimants were actively on EI at the time of their EBSM participation. Former EI claimants received EI up to three years before starting their EBSM participation.
Key findings
Overall, labour market outcomes provide some indications that LMDA-funded programs and services delivered in Nunavut are generally helping participants to improve their labour market attachment after participation.
With some exceptions, participants in LMDA programs and services showed higher average earnings and lower average proportions on EI and social assistance during the five years after program participation when compared to the five years prior to participation.
Some participants do not appear to be securing employment following their participation in LMDA programs and services, as reflected in the general decrease in the proportion of participants employed in the post-participation period compared to the pre-participation period. However, employment outcomes should be interpreted with caution taking into consideration the limited employment opportunities in Nunavut, particularly in smaller communities.
Labour Market outcomes
Most participants have higher average earnings after program participation
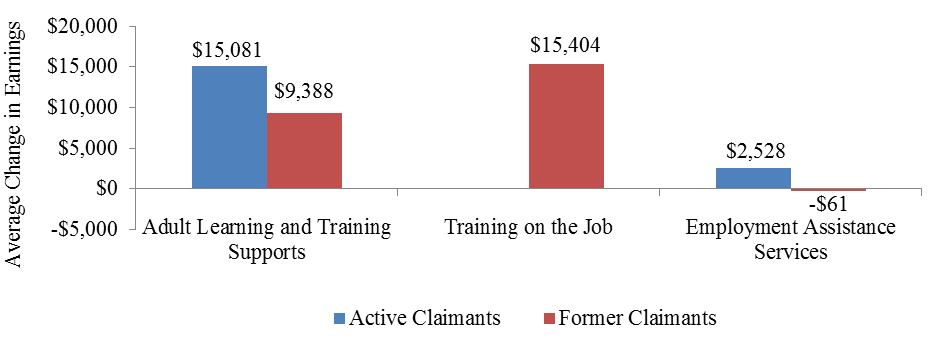
As shown in Figure i, active claimants who participated in Adult Learning and Training Supports and Employment Assistance Services showed higher average employment during the five years after their participation when compared to five years prior to participation. As well, former claimants who participated in Adult Learning and Training Supports and Training on the Job also showed higher average employment earnings after participation compared to before participation.
Considering the small number of active claimants who participated in Employment Assistance Services (n=52), their figures should be interpreted with caution. As well, Employment Assistance Services are relatively modest activities such as counselling, job search assistance and case management. By themselves, they are not expected to lead to substantial effects on labour market outcomes.
Text description of Figure i
| Average change in earnings | ||
|---|---|---|
| Active claimants | Former claimants | |
| Adult Learning and Training Supports | 15,081 | 9,388 |
| Training on the Job | 15,404 | |
| Employment Assistance Services | 2,528 | -61 |
Note: outcomes for active participants in Employment Assistance Services should be interpreted with caution given the small number of participants (n=52).
The average proportion of participants on Employment Insurance and social assistance is generally lower after program participation when compared to before program participation
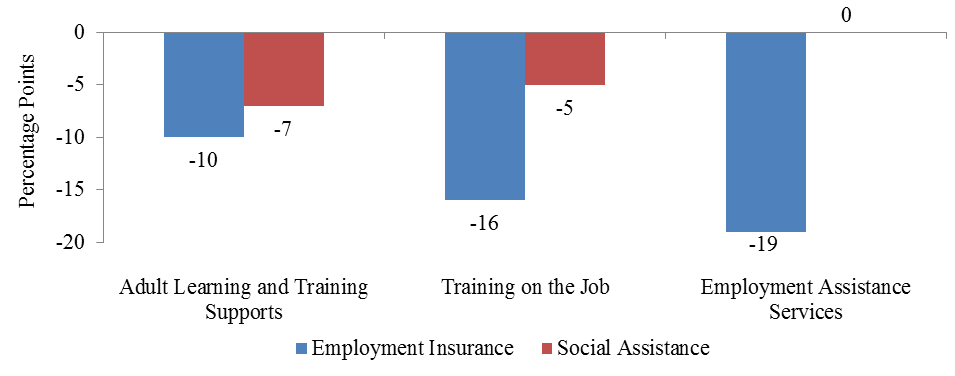
As shown in Figure ii and iii, overall, the average proportion of participants who use EI and social assistance is shown to be lower in the post-participation period for active and former claimants of Adult Learning and Training Supports as well as former claimants of Training on the Job. In addition, the average proportion of former claimants who use EI is also shown to be lower in the five years after program participation for those who participated in Employment Assistance Services (when compared to five years prior).

Text description of Figure ii
| Percentage Points | ||
|---|---|---|
| Employment Insurance | Social Assistance | |
| Adult Learning and Training Supports | 0 | -3 |
| Employment Assistance Services | 1 | 0 |
Note: outcomes for active participants in Employment Assistance Services should be interpreted with caution given the small number of participants (52 claimants).
Text description of Figure iii
| Percentage Points | ||
|---|---|---|
| Employment Insurance | Social Assistance | |
| Adult Learning and Training Supports | -10 | -7 |
| Training on the Job | -16 | -5 |
| Employment Assistance Services | -19 | 0 |
The average proportion of participants employed is generally lower after program participation when compared to the before program participation
As shown in Figure iv, active EI claimants of Adult Learning and Training Supports were the only participants who showed an increase in the proportion employed between the pre- and post-participation periods. Participants of the other programs and services displayed decreases in the proportion of participants employed in the post-participation period compared to the pre-participation period. These decreases can be partially explained by the high unemployment levels in Nunavut and the limited employment opportunities, particularly in smaller communities.

Text description of Figure iv
| Percentage Points | ||
|---|---|---|
| Employment Insurance | Social Assistance | |
| Adult Learning and Training Supports | 2 | -4 |
| Training on the Job | -6 | |
| Employment Assistance Services | -12 | -11 |
Note: outcomes for active participants in Employment Assistance Services should be interpreted with caution given the small number of participants (n=52).
Lessons learned about program design and delivery
Key informants interviews with service providers and program managers as well as the documents reviewed and the questionnaires filled by provincial/territorial representative also generated a few lessons about program design and delivery:
Adult Learning and Training Supports
To collect labour market information, representatives from the Department of Family Services regularly attend trade shows, mining symposiums and hold meetings with industry in the area to determine the local labour market demand. The Department also examines what programs, offered by the Nunavut Arctic College, correspond to labour market demand. Program participants are expected to do further research on training options and local labour market demand as part of the application process. This may contribute to program effectiveness.
According to Career Development Officers and managers interviewed as part of the evaluation, the main challenges related to program design and delivery included:
- The perceived insufficient level for some components of financial assistance.
- Maintaining regular contact with participants for monitoring purposes can be difficult for Career Development Officers.
Adult Learning and Training Supports for apprentices
Existing Canadian literature showed that there is a fairly high non-completion rate among apprentices (40-50%)Footnote 1. Furthermore, subject matter literature revealed that despite the growth in apprenticeship registrations in Canada, there has not been a corresponding increase in completion ratesFootnote 2. According to Career Development Officers and managers involved in apprenticeship delivery drop-out can be is due to factors such as:
- The difficulty associated withrelocation for training purposes.
- Low level of essential skills.
- Financial difficulties.
- Lack of housing.
- Lack of training and job opportunities.
- Family issues.
- Substance abuse.
- Delays in conducting exams following the end of training.
Additional challenges identified by Career Development Officers and managers in relation to program design and delivery include the need to:
- Provide additional financial supports (high cost of living in the north, equipment and books, and relocation).
- Provide information on apprenticeships both online and in pamphlet because of the high cost of Internet.
- Provide mandatory counselling to participants in order to help identify challenges, including social challenges.
- Provide pre-apprenticeship training, especially essential skills training.
- Provide tutoring support given the fact that some apprentices may be shy and have difficulty learning in large groups.
Training on the Job
According to the EI Monitoring and Assessment Reports, the number of new interventions has decreased between 2005 to 2006 and 2013 to 2014. According to key informants, factors affecting take-up included:
- The reporting burden to employers.
- Employers cannot access the program multiple times.
- Level of funding is insufficient to encourage employers to participate.
- The positions supported usually need to be new jobs.
Recommendations
A total of 6 recommendations emerged from the evaluation findings. They are as follows:
The report presents challenges experienced by Adult Learning and Training Supports (including the Apprentice component) participants in general. These challenges are centered on the low levels of literacy and essential skills, low education, lack of work related skills and perceived insufficient level of financial support. As well, labour market statistics demonstrate that Inuit experience significantly higher unemployment rates and lower levels of education compared to the average rates in the territory.
Recommendation 1: The provision of literacy and essential skills training is important in the Nunavut context to support individuals to prepare for vocational training and to reintegrate into the labour market. These measures should be reported separately from other Adult Learning and Training Supports interventions given their unique objectives.
Recommendation 2: Consideration should be given to examine to what extent the level of financial supports provided under the program are sufficient.
Recommendation 3: Consideration should be given to examine to what extent Career Development Officers can increase monitoring and provide additional supports to apprentices.
Outcome analysis results show that the Training on the Job program is improving the earnings of participants and reducing their use of EI and social assistance as well as the dependence on government income support. However, the number of interventions declined between 2005 to 2006 and 2013 to 2014. According to key informants, this is due to the reporting burden on employers, the limitation on using the program multiple times and employers’ capacity to create a new position.
Recommendation 4: Depending on labour market priorities and budget allocation across the various EBSMs, Nunavut may wish to explore ways of removing barriers to employer participation in Training on the Job.
A study carried out across Canada regarding the timing of participation in Employment Assistance Services showed that receiving assistance early after starting an EI claim can lead to better labour market impacts.
Recommendation 5: Consideration should be given by Nunavut to request timely access to data on new EI recipients for targeting purposes, especially if awareness about Employment Assistance Services is also an issue in the territory.
The LMDA evaluation was only able to produce labour market outcomes, given the small number of participants. Labour market outcomes were produced over five years and for the entire population of participants using rich data on EI claimants, EBSM participation data and Canada Revenue Agency taxation files. Some data gaps were identified in order to support future evaluation activities.
Recommendation 6: Improvements in the data collection process are recommended to address key program and policy questions of interest to Canada and Nunavut. Specifically:
- Collect data on whether participants are members of designated groups including Inuit and persons with disabilities.
- Collect data on the type of training funded under Adult Learning and Training Supports and the type of assistance provided under Employment Assistance Services. Nunavut, ESDC and other P/Ts should work together to define common categories for both EBSMs.
- Collect detailed data on the cost of EBSM interventions.
- ESDC and Nunavut should carry out a data assessment regarding the integrity of data uploads and the standardization process of Nunavut data within ESDC.
Management response
Introduction
The Nunavut Department of Family Services worked in close collaboration with the Evaluation Directorate of ESDC during the planning and implementation of the second cycle for the LMDA evaluation. The Department of Family Services would like to thank all members of the LMDA Evaluation Steering Committee for their dedication and commitment to the success of this evaluation process. The Department of Family Services agrees with the evaluation recommendations and is pleased to submit this management response. These findings are an important source of advice, as governments work together to renew the labour market transfer agreements.
Detailed response from the Department of Family Services
The Department of Family Services identified the following actions in relation to the recommendations coming out of the evaluation:
- Recommendation 1: The provision of literacy and essential skills training is important in the Nunavut context to support individuals to prepare for vocational training and to reintegrate into the labour market. These measures should be reported separately from other Adult Learning and Training Supports interventions given their unique objectives.
- Recommendation 2: Consideration should be given to examine to what extent the level of financial supports provided under the program are sufficient.
- Recommendation 3: Consideration should be given to examine to what extent Career Development Officers can increase monitoring and provide additional supports to apprentices.
Response:
Recognizing that the objective of Literacy and Essential skills training is to support clients to move on to further training, the Department of Family Services will work toward reporting on literacy and essential skills training separately from other Adult Learning and Training Supports interventions.
As well, the Department of Family Services will review the financial supports under the program in order to determine if they are sufficient to allow for an individual to receive the training required and to complete it toward a graduation or certification. In addition, the Department will devote efforts to increase monitoring and provide additional support to apprentices.
Recommendation 4: Depending on labour market priorities and budget allocation across the various EBSMs, Nunavut may wish to explore ways of removing barriers to employer participation in Training on the Job.
Response: The Department of Family Services will review practices and processes in the effort to increase employer satisfaction, ease of service and their participation numbers.
Recommendation 5: Consideration should be given by Nunavut to request timely access to data on new EI recipients for targeting purposes, especially if awareness about Employment Assistance Services is also an issue in the territory.
Response: Although this affects a small number of EI eligible participants, the Department of Family Services will devote efforts to secure timely access to data on EI recipients for targeting purposes.
Recommendation 6: Improvements in the data collection process are recommended to address key program and policy questions of interest to Canada and Nunavut. Specifically:
- Collect data on whether participants are members of designated groups including Inuit and persons with disabilities.
- Collect data on the type of training funded under Adult Learning and Training Supports and the type of assistance provided under Employment Assistance Services. Nunavut, ESDC and other P/Ts should work together to define common categories for both EBSMs.
- Collect detailed data on the cost of EBSM interventions.
- ESDC and Nunavut should carry out a data assessment regarding the integrity of data uploads and the standardization process of Nunavut data within ESDC.
Response:
The Department of Family Services will work with its systems’ resources and current infrastructure to allow for improvements in data collection processes and data details. These changes will account for data collection decisions made by the Forum of Labour Market Ministers Working Group on the new performance measurement strategy for the program.
1. Introduction
Employment and Social Development Canada (ESDC) worked jointly with Nunavut and 11 other Provinces and Territories (P/Ts) to undertake the 2012 to 2017 second cycle for the Labour Market Development Agreement (LMDA) evaluations. The evaluation work consisted of conducting two to three studies per year on the Employment Benefits and Support Measures (EBSMs) delivered under these agreements. The studies aimed to generate evaluation evidence on the effectiveness and design/delivery of EBSMs for Canada overall, for Nunavut and for the 11 other P/Ts that opted for a joint evaluation process with the Government of Canada.
This report presents a summary of the findings from the studies conducted for Nunavut. The report is organised as follows:
- Introduction with an overview of the studies summarized in this report including their scope and methodology, and contextual information on the LMDAs.
- Findings section with a discussion around the unique labour market context in Nunavut, territorial labour market priorities and a summary of evaluation evidence.
- Comparison of key findings by program type.
- Conclusions and lessons learned.
- Recommendations that emerge from the evaluation findings.
1.1 Labour Market Development Agreement background
LMDAs are bilateral agreements between Canada and each province and territory, and were established under Part II of the 1996 Employment Insurance (EI) Act. As part of these agreements, Canada transfers $2.14B annually to P/Ts to design and deliver programs and services to assist individuals to prepare for, obtain and maintain employment.
The Canada-Nunavut LMDA was signed on May 11, 2000. The agreement transferred responsibility to Nunavut for the design and delivery of programs and services. The Nunavut Department of Family Services administers these programs, which are classified under two categories: 1) Employment Benefits and 2) Support Measures.
Employment Benefits
Employment Benefits are offered to unemployed individuals who 1) are actively on EI (that is, active claimants); 2) ended their benefit period within three years before participating (former claimants); or 3) established a claim for maternity or parental benefits within the past five years and are returning to the labour force for the first time (former claimants)Footnote 3. Employment Benefits include the following categories:
- Skills Development (Adult Learning and Training Supports) helps participants, including apprentices, obtain employment skills by giving them financial assistance that enables them to select, arrange and pay for classroom training.
- Targeted Wage Subsidies (Training on the Job) help participants obtain on-the-job work experience by providing employers with financial assistance to help with the wages of participants.
- Self-Employment (Nunavut Entrepreneurship Incentive) provides financial assistance and business planning advice to EI-eligible participants to help them start their own business. This financial assistance is intended to cover personal living expenses and other expenses during the initial stages of the business.
- Job Creation Partnerships provide participants with opportunities to gain work experience that will lead to ongoing employment. Employment opportunities are provided by projects that contribute to developing the community and the local economy. The program is not delivered in Nunavut.
- Targeted Earnings Supplements encourage unemployed persons to accept employment by offering them financial incentives. The program is not delivered in Nunavut.
Support measures
Support Measures are available to all unemployed individuals including those not eligible to receive EI and include:
- Employment Assistance Services such as individual counselling, action planning, help with job search skills, job-finding clubs, job placement services, the provision of labour market information, and case management and follow-up.
- Labour Market Partnerships provide funding to help employers, employee and employer associations, and communities improve their capacity to deal with human resource requirements and implement labour force adjustments. These partnerships involve developing plans and strategies, and implementing labour force adjustment measures.
- Research and Innovation supports activities that identify better ways of helping people prepare for or keep employment and be productive participants in the labour force. Funds are provided to eligible recipients to enable them to carry out demonstration projects and research for this purpose.
Targeted Earnings Supplements, Labour Market Partnerships, and Research and Innovation were not covered under the second cycle of the LMDA evaluation.
Table 1 provides an overview of the share of funding allocated to the four programs and services examined under the second cycle for LMDA evaluation and the average cost per participant. It is noted that the average cost per participant was calculated based on the 2002 to 2005 data from the EI Monitoring and Assessment Reports. The 2002 to 2005 period corresponds to the cohort of participants selected for incremental impacts and cost-benefit analysis in the LMDA evaluation.
| Program and service | Share of funding 2014 to 2015 | Average cost per participant 2002 to 2005 |
|---|---|---|
| Adult Learning and Training Supports (including for Apprentices) | 38% | $11,107 |
| Training on the Job | 17% | $8,333 |
| Nunavut Entrepreneurship Incentive | 1% | $11,400 |
| Employment Assistance Services | 44% | – |
| Total | 100% | – |
Source: EI Monitoring and Assessment Reports 2002-2003 to 2014-2015. No participants in Employment Assistance Services were reported between 2002 and 2005 in these reports.
1.2 Methodology
This section presents key aspects of the quantitative analyses carried out as part of the LMDA studies, while a more detailed description of the methodology is provided in Appendix A.
All quantitative analyses were based on administrative data from the EI part I (EI claim data) and part II (EBSM participation data collected by Nunavut and transferred to ESDC) linked to the T1 and T4 taxation files from the Canada Revenue Agency. The analysis of labour market outcomes was based on 100% of participants in the reference period selected.
Outcome analysis
Incremental impacts were not estimated for EBSMs in Nunavut because of the small number of participants. An attempt was made to estimate incremental impacts for active and former claimants who participated in Adult Learning and Training Supports. However, the balancing tests requirements were not satisfied and the results are not robust enough to be included in this report. Alternatively, an outcome analysis was conducted in three studies using selected indicators (for example, earnings from employment/self-employment, incidence of employment, use of EI or Social Assistance and dependence on income support). The analysis provides descriptive statistics on the labour market experience of participants before, during and after participation. For example, it displays the average annual earnings of active claimants before, during and after participation and presents what changes were experienced in their earnings from before to after participation.
Overall, the analysis was conducted on a period of approximately 9 to 12 years (five years before participation, one or two years during participation, and three or five years after participation). Two cohorts of participants were used in separate studies; however, the discussion will focus mainly on the 2001 to 2007 cohort because data for the 2006 to 2008 cohort only extends for three years after participation.
When the number of participants was sufficient, outcomes were examined for active and former EI claimants who were youth (under 30 years old) and adult workers (30 years old and over).
Strengths and limitations of the studies
One of the key strengths from the LMDA evaluation studies is that all quantitative analyses were based on administrative data rather than survey responses. Compared to survey data, administrative data are not subject to recall errors or response bias.
The outcome analysis provides an assessment of how the labour market experience of participants evolved over time but does not allow an assessment of the extent to which those changes were due to EBSM participation. For example, increases in employment earnings over the period examined could be partly due to inflation or normal wage increase associated with experience. With that respect, the outcome results should not be interpreted as a direct measure of program effectiveness.
When interpreting qualitative findings, readers should keep in mind that those are based on the perception of a small number of key informants who are directly involved in the design or delivery of the program. Their perception may be representative of their own region or community but not necessarily of the entire territory. Since the number of key informants interviewed in each study is small (that is, ranging between 4 and 5), the number of informants who reported a specific finding is not indicated in the report. However, the report does note when there was a clear disagreement between key informants.
1.3 Overview of the studies summarized in this report
Evaluation findings presented in this report were drawn from five separate studies on participants who received programs and services under the Canada – Nunavut LMDA. These studies examined issues related to EBSM effectiveness and design/delivery, using a mix of qualitative and quantitative methods. Each study examined evaluation issues in relation to active and former EI claimants who participated in EBSMs.
Table E1 in Appendix E presents an overview of these studies, including the type of evidence generated, the methods used, the reference period and the length of the post-program period over which program effects were observed.
2. Evaluation findings
2.1 Rationale and Labour Market context
Labour Market context
Nunavut covers an area of approximately 2,093,190 kmFootnote 4 and has a total population of 37,146 (as of October 2016)Footnote 5. The vast majority of the population is Inuit (84.2%). Iqaluit is the biggest community with a population of 7,590 and only three (of 25) communities have populations in excess of 2,000 (Rankin Inlet, Arviat and Baker Lake). In addition to being small in numbers, Nunavut’s 25 communities are also remote, with no roads connecting any of the communities. Connectivity is further limited by the limited and expensive internet available in the territory.
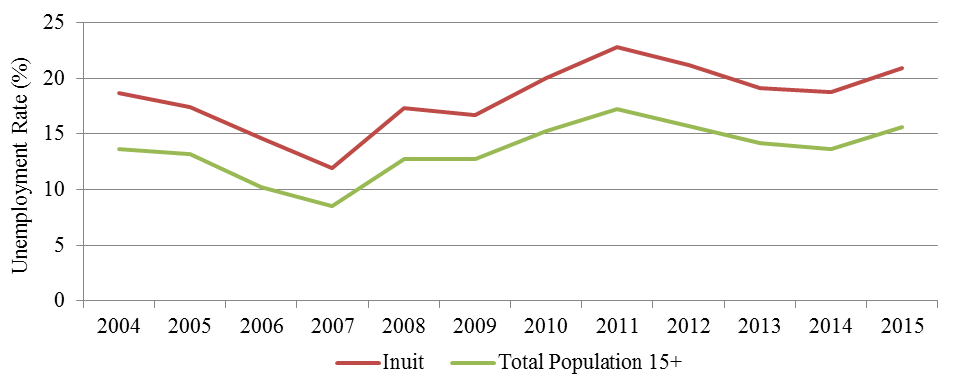
As shown in Figure 1, Inuit experience significantly high unemployment compared to the total working age population of Nunavut. In 2015, 20.9% of the Inuit population was unemployed compared to 15.7% of the total working age population of Nunavut.
Text description of Figure 1
| Unemployment Rate (%) | ||
|---|---|---|
| Inuit | Total Population 15+ | |
| 2004 | 18.7 | 13.6 |
| 2005 | 17.4 | 13.2 |
| 2006 | 14.6 | 10.2 |
| 2007 | 11.9 | 8.6 |
| 2008 | 17.3 | 12.8 |
| 2009 | 16.7 | 12.8 |
| 2010 | 20 | 15.2 |
| 2011 | 22.8 | 17.2 |
| 2012 | 21.2 | 15.7 |
| 2013 | 19.1 | 14.2 |
| 2014 | 18.8 | 13.7 |
| 2015 | 20.9 | 15.7 |
Source: Statistics Canada, Labour Force Survey as prepared by the Nunavut Bureau of Statistics.
Similar disparities can also be observed with respect to levels of education. Figure 2 illustrates the educational levels of Nunavut residents aged between 25 and 64 years old. Data show that 59.6% (6,370) working-age Inuit lack a High School diploma, compared to only 5% (170) for non-Aboriginal people. As well, only 1.8% (192) of working-age Inuit have a university degree compared to 47.4% (1,616) for non-Aboriginal people.

Text description of Figure 2
| Population Number | ||
|---|---|---|
| Non-Aboriginal | Inuit | |
| No certificate, diploma or degree | 170 | 6370 |
| High school diploma or equivalent | 505 | 1235 |
| Postsecondary certificate, diploma or degree (excluding bachelor level or above) | 1119 | 2888 |
| University certificate, diploma or degree at bachelor level or above | 1616 | 192 |
Source: 2011 National Household Survey 99-012-X2011046
LMDA investments align with territorial government priorities
Active labour market programs aim to help unemployed or underemployed individuals find and maintain employment. These programs are fairly similar across member countries of the Organization for Economic Co-operation and Development and consist of skills training in a classroom setting, work experience with employers (often subsidized) or in the public/non-profit sector, return-to-employment assistance and self-employment assistance.
In Nunavut, the Ministry of Family Services administers a range of active labour market programming targeted at various groups of individuals including EI claimants and social assistance recipients. There are three regional Career Development Offices available to deliver these services in person and from a distance. For people without a Career Development Officer in their community and who do not have access to a fax machine, scanner, or computer, they can visit their local Government of Nunavut office for assistance or speak to a Government Liaison OfficerFootnote 6. Programs and services offered to active and former EI claimants are mainly funded under the LMDA transfer.
Investments under the LMDA in 2014 to 2015 were mainly targeted toward Employment Assistance Services and Adult Learning and Training Supports with 44% and 38% of total budget respectively. As well, 678 individuals participated in Employment Assistance Services, followed by 208 in Adult Learning and Training Supports, 39 in Adult Learning and Training Supports for Apprentices, 7 participated in Training on the Job and 2 in Nunavut Entrepreneurship Incentive.
Regarding government priorities, in 2014 the Government of Nunavut developed Sivumut Abluqt, establishing a vision for the 2014 to 2018 period. In this document, the Government of Nunavut identifies “self-reliance and optimism through education and training” as one of four priorities. Commitments under this priority include “enable Nunavummiut to enter into training to become trades apprentices and to complete their certification requirements on the job” and “support labour force training, development and employment through strategic alliances with sector partners”. In addition, the Nunavut Adult Learning Strategy for 2006 to 2026 has an objective to “provide stable long-term funding for literacy, adult education, training and employment programs”. Finally, the Department of Family Services has the mandate to provide services to the public in order to link people with jobs.
Overall, outcomes for Adult Learning and Training Supports, Training on the Job and Employment Assistance Services participants reported in this LMDA evaluation demonstrated that LMDA funded programs and services delivered in Nunavut are generally helping participants to improve their labour market attachment after participation. As such, evaluation evidence suggests that LMDA funded programming are generally contributing to achieving the Government of Nunavut’s priority of self-reliance through training as well as contributing to fulfilling the objective of the Nunavut Adult Learning Strategy and the mandate of the Career Development division of the Department of Family Services to provide services to the public in order to link people with jobs.
2.2 Adult Learning and Training Supports
2.2.1 Program description
Based on a document review and 4 key informant interviews completed in summer 2015
The Skills Development program in Nunavut is called Adult Learning and Training Supports. The program aims to assist active and former EI claimants in obtaining the skills they need to return to employment, ranging from basic to advanced skills. The types of training that are supported under the program include employment skills training, pre-employment, life skills, pre-trades, workplace training and literacy training with a work-related component. Financial supports that are provided under the program include:
- tuition fees
- books and material
- special equipment
- training allowance
- living away from home allowance
- transportation
- childcare
- disability supports
The maximum support provided is $20,000, however additional funds can be provided in extenuating circumstances. Eligible clients may also receive a variety of services including financial and career counselling that aims to reduce their barriers to employment.
Key informants identified that office administration is one of the most popular training programs. Other popular training programs include environmental technologists and heavy equipment operators.
2.2.2 Program delivery
Based on a document review and 4 key informant interviews completed in summer 2015
Career Development Officers deliver the programs including the case management of participants. To begin the application process, Career Development Officers first assess the needs, interests and goals of individuals to determine if Adult Learning and Training Supports is a suitable intervention that would assist them to return to employment. For participants deemed eligible for the program, Career Development Officers assist them in determining the type of training that they would like to take and then assist participants in filling out the program’s application. The application also requires that participants collect and submit information such as financial information, transcripts and childcare information.
The application process typically takes one week according to key informants. Career Development Officers review applications in order to ensure that they are complete and identify the supports required for the participant. The Career Development Officers approve Adult Learning and Training Supports agreements that are under $20,000 whereas agreements over that amount require manager approval. The level of investment in program allocations is based primarily on a combination of participant interests, career counselling decisions and labour market opportunities.
To monitor participants’ progress, Career Development Officers typically conduct bi-weekly follow-ups with participants. In addition, there is a requirement to obtain bi-weekly attendance updates from the course instructors. Career Development Officers can also discuss progress with participants and determine if any additional supports may be needed.
2.2.3 Targeting to Labour Market demand
Based on a document review and key 4 informant interviews completed in summer 2015
With the advice of Career Development Officers, participants do further research on training options and local labour market demand as part of the application process.
To stay informed, the Department of Family Services contacts Nunavut Arctic College in order to assess what programs are being offered locally and examine which training corresponds to demand. The department conducts research by regularly attending trade shows, mining symposiums and holding meetings with industry in the area to determine labour market demand.
2.2.4 Profile of program participants
Socio-demographic characteristics
Table B1 in Appendix B presents the socio-demographic characteristics for two cohorts of active and former EI claimants who started an intervention in 2001 to 2007 and 2006 to 2008.
The majority of active participants in both the 2001 to 2007 and 2006 to 2008 cohorts were male (68% and 80% respectively) and between 25 to 34 years old (41% and 48%). Most of the participants self-identified as Aboriginal individuals in both cohorts (83% and 96%). The most common skill level required for the job held before participation was on-the-job training (39% and 42%), followed by secondary school or occupational training (25% and 34%) and college or apprenticeship training (23% and 15%).
Former claimants who participated in the program in 2001to 2007 and in 2006 to 2008 followed similar trends as active claimants. Former claimants were also predominantly male (58% and 69% respectively) and between 25 to 34 years old (47% and 51% respectively). Most of the participants self-identified as Aboriginal individuals in both cohorts (70% and 96% respectively). Participants most frequently held jobs requiring secondary or occupational training (33% and 35% respectively) followed by on-the-job training (36% and 32% respectively) before participation.
Barriers faced by participants
Based on a document review and 4 key informant interviews completed in summer 2015
Key informants were asked to identify the main barriers to employment or to participation faced by participants. The most frequently identified barriers were the following:
- Lack of education and credentials.
- Addiction issues.
- Lack of work experience/employment opportunities.
- Essential skills challenges and low literacy levels.
- Lack of available childcare.
2.2.5 Outcomes
Active claimants
As shown in Table B2 in Appendix B, active claimants who started participation between 2001 and 2007 earned, on average, $15,081 more annually in the five years after participation compared to the five years before participation. Figure 3 depicts the growth in average annual earnings for these participants from $12,526 in the 5th pre-program year to $35,304 in the 5th post-program year. It is noted that average earnings were not adjusted for inflation using the Consumer Price Index given the fact that the program start year varied between 2001 and 2007. As well, the average annual proportion of participants employed increased from 89% to 91% from before to after participation.
The average annual proportions of participants claiming social assistance benefits declined by 3 (from 29% to 26%) percentage points between the pre-and-post program periods. The average annual proportions of participants claiming EI and the level of dependence on income support remained unchanged at 27% and 15% respectively.

Text description of Figure 3
| Employment earnings | |
|---|---|
| 5 yrs pre | 12,526 |
| 4 yrs pre | 13,686 |
| 3 yrs pre | 14,764 |
| 2 yrs pre | 19,494 |
| 1 yr pre | 23,343 |
| Participation period | 17,139 |
| Participation period | 20,183 |
| 1 yr post | 25,539 |
| 2 yrs post | 30,365 |
| 3 yrs post | 32,877 |
| 4 yrs post | 35,136 |
| 5yrs post | 35,304 |
Notes: Average earnings include participants with zero earnings in a specific year.
Active claimants who started participation between 2006 and 2008 experienced an increase in average annual earnings ($18,526), a decrease in the average annual proportion of participants claiming social assistance (10 percentage points) between the pre- and post-program periods and a decrease in the level of dependence on income support (3 percentage points).
There was, however, an increase of the average annual proportion of participants claiming EI (9 percentage points). The average annual proportion of participants employed remained unchanged at 97%.
Labour market outcomes for sub-groups of interest were as follows:
- Youth (under 30 years old) who started participation between 2001 and 2007 experienced a large increase in the average annual earningsFootnote 7 ($20,480) from before to after participation. They also experienced an increase in the proportion employed (5 percentage points). Furthermore, the average annual proportion of youth claiming social assistance decreased by 4 percentage points while the annual proportion of youth claiming EI increased by 6 percentage points. This was reflected in a small increase of 1 percentage point in the dependence on income support.
- Adults (30 years old and over) who started participation between 2001 and 2007 experienced an increase in the average annual earnings ($11,498) and decreases in the annual proportion of adults claiming EI (4 percentage points) and social assistance (1 percentage point). This was reflected in a small decrease of 1 percentage point in the dependence on income support. Finally, adults experienced a small decrease in the proportion employed (2 percentage points) but 91% of them were employed annually during the post-program period.
Overall, there are clear indications that active claimants who participated in Adult Learning and Training Supports improved their labour market attachment mainly through increases in earnings and reduction in social assistance use. This interpretation accounts for the unique labour market context in Nunavut and the fact that the vast majority of participants are Aboriginals (mainly Inuit). As reported in section 2.1, Inuit experience significantly high unemployment and lower education levels compared to the total working age population of Nunavut. As well, these numbers should be interpreted taking into consideration the limited employment opportunities in Nunavut, particularly in smaller communities.
Former claimants
As shown in Table B3 in Appendix B, former claimants who started participation between 2001 and 2007 earned, on average, $9,388 more annually in the five years after participation compared to the five years before participation. Figure 4 depicts the growth in average annual earnings for these participants from $12,940 in the 5th pre-program year to $26,203 in the 5th post-program year. It is noted that average earnings were not adjusted for inflation using the Consumer Price Index given the fact that the program start year varied between 2001 and 2007.
The average annual proportion of participants employed decreased by 4 percentage points from 90% to 86% from before to after participation. This decline can be partially explained by retirement decisions given the fact that 8% of participants were 45 years old and over at the start of participation. As well, the average annual proportions of participants claiming EI and social assistance benefits declined by 10 and 7 percentage points, respectively, while the dependence on income support decreased by 6 percentage points.

Text description of Figure 4
| Employment earnings | |
|---|---|
| 5 yrs pre | 12,940 |
| 4 yrs pre | 14,518 |
| 3 yrs pre | 16,571 |
| 2 yrs pre | 15,716 |
| 1 yr pre | 10,995 |
| Participation period | 10,109 |
| Participation period | 14,736 |
| 1 yr post | 19,806 |
| 2 yrs post | 22,230 |
| 3 yrs post | 23,933 |
| 4 yrs post | 25,509 |
| 5yrs post | 26,203 |
Former claimants who started participation between 2006 and 2008 experienced similar trends to the 2001 to 2007 participants. They experienced an increase in average annual earnings ($11,911), a decrease in the average annual proportion of participants claiming EI and social assistance (16 and 6 percentage points respectively) between the pre- and post-program periods and a decrease in the level of dependence on income support (7 percentage points). Finally, former claimants experienced a small decrease in the proportion employed (2 percentage points) but 93% of them were employed annually during the post-program period.
Labour market outcomes for sub-groups of interest were as follows:
- Youth who started participation between 2001 and 2007 experienced a larger increase in the average annual earnings ($14,506) from before to after participation. They also experienced decreases in the average annual proportion of participants claiming EI and social assistance (9 and 5 percentage points respectively) between the pre- and post-program periods and a decrease in the level of dependence on income support (5 percentage points). The percentage of youth employed averaged 88% during the post-program period with a 1 percentage point decrease.
- Adults who started participation between 2001 and 2007 experienced an increase in the average annual earnings ($6,844) and decreases in the annual proportion of adults claiming EI (9 percentage points) and social assistance (7 percentage point). This was reflected by a 7 percentage points decrease in the dependence on income support. Finally, adults experienced a decrease in the proportion employed (5 percentage points) but 85% of them were employed annually during the post-program period.
Overall, there are clear indications that former claimants who participated in Adult Learning and Training Supports improved their labour market attachment mainly through increases in earnings and reduction in EI and social assistance use. This interpretation accounts for the unique labour market context in Nunavut and the fact that the vast majority of participants are Aboriginals (mainly Inuit). As reported in section 2.1, Inuit experience significantly high unemployment and lower education levels compared to the total working age population of Nunavut. As well, these numbers should be interpreted taking into consideration the limited employment opportunities in Nunavut, particularly in smaller communities.
2.2.6 Challenges and lessons learned about program design and delivery
Based on a document review and 4 key informant interviews completed in summer 2015
Key informants identified the following challenges in relation to program design and delivery:
- The perceived insufficient level for some components of financial assistance.
- Monitoring participants can be a challenge because it is difficult for Career Development Officers to maintain regular contact with them.
Key informants also identified a number of lessons learned:
- It is important to spend time on career exploration with participants in order to ensure that they are choosing to attend training programs that they are personally invested in.
- Working as a team has helped with program success. Multiple Career Development Officers review each application in order to make sure that it is complete.
- Career Development Officers have the ability to approve funding agreements up to $20,000 but this amount should be increased because Adult Learning and Training Supports agreements are usually quite expensive. When participants must travel to attend training, these costs can quickly rise. Key informants said that this change would speed up the processing time.
- The training allowance should be increased to help participants with families. As well, the level of support for transportation and childcare should be increased.
- It is important to ensure that front-line staff are consulted on policy changes so that the changes reflect on-the-ground delivery realities.
- The need to incorporate more adult basic education and life skills training into programming since these are common challenges experienced by participants.
- Key informants identified that Career Development Officers require additional time to work with participants who have multiple barriers. If there are literacy issues, academic upgrading may be required before pursuing occupation-specific training.
- Conducting learning disability assessments in the initial stage would help to identify existing barriers. Knowing participant barriers early in the application process allows Career Development Officers to set-up accommodations early.
- Career Development Officers are increasingly managing participants with disabilities and there is a need for additional training on assisting these participants.
2.3 Adult Learning and Training supports for Apprentices
2.3.1 Program description
Based on a document review and 5 key informant interviews completed in summer 2015
The Skills Development - Apprentice program in Nunavut is called Adult Learning and Training Supports for Apprentices. The objective of the program is to provide supports for apprentices who are attending block release training. The program is offered to all registered apprentices who are eligible for EI. Apprentices register for technical training and complete the program’s application package. As part of the application process, apprentices must prove their apprentice status and identify the list of supports that they require.
Career Development Officers will meet with most of the first year apprentices to provide support on completing the paperwork. Apprentices who participate in subsequent years are expected to complete the paperwork on their own. Career Development Officers approve applications under $20,000. The budget for the program fluctuates based on the demand by apprentices.
The program is not directed to specific occupations or industries. Apprentices in any eligible trade program attending block release training in Nunavut or in another province or territory (for example Alberta) are eligible. The individuals are attached to employers in Nunavut and therefore a link to labour market demand is ensured through this relationship.
In 2014, there was a change to the program’s delivery process. Career Development Officers in the regions are now responsible for delivering the program. This change included a structured approach detailing each step of the program, accompanied by guidelines for the range of supports provided.
Supports provided under the program include:
- Tools and equipment
- Living away from home allowance
- Childcare
- Transportation
- Books
- Tutoring
- Tuition
- Living allowance
- Disability support
2.3.2 Program delivery
The program does not employ a case management process. Rather, Career Development Officers receive updates from the Apprenticeship Unit at the Department of Family Services if the apprentice misses class or is struggling. Career Development Officers may follow-up and help the apprentice to access on campus supports such as counselling or tutoring.
2.3.3 Challenges and lessons learned about program design and delivery
Based on a document review and 5 key informant interviews completed in summer 2015
Existing literature has shown that there is a fairly high non-completion rate among apprentices in Canada (40 to 50%)Footnote 8. Furthermore, subject matter literature revealed that despite the growth in apprenticeship registrations in Canada, there has not been a corresponding increase in completionsFootnote 9. Key informants interviewed in the evaluation identified reasons that could lead apprentices from Nunavut to drop-out from the apprenticeship process. The reasons for this include:
- Relocating to a city can be challenging for an individual from a very small community. There can also be social barriers and family issues with having to relocate for training.
- The level of literacy, mathematics and science skills may not be sufficient to allow apprentices to excel in trades education. There is a lack of assessment of these essential skills prior to apprenticeship training.
- Financial pressures such as high cost of living and food costs pose challenges. This cost of living varies significantly by location.
- Lack of available journeypersons to help train the apprentices.
- Lack of available work causing the apprentice to interrupt progression in their apprenticeship.
- Lack of housing.
- There are delays in conducting exams at the end of the training. Apprentices usually have to wait approximately one month for the exam in Iqaluit.
- Substance abuse challenges.
Key informants identified a number of challenges associated with the design and delivery of the program, such as:
- There is a need for extra financial support to cover the high cost of living in Nunavut. As well, supports should consider the costs associated with taking training in the Nunavut compared to the south.
- The special equipment allowance and books supports should be increased.
- Apprentices relocating for training may have difficulty paying rent and security deposits, so financial assistance for this should be provided by the program.
- There is a need for information on apprenticeships both online and in pamphlet form because of the high cost of internet in Nunavut.
- Pre-apprenticeship training is needed to help ensure that apprentices have a sufficient level of essential skills to succeed in training.
- It is necessary to provide mandatory counselling to participants in order to help identify challenges and to address social challenges.
- Tutoring support is necessary because apprentices may be shy and may have difficulty learning in large groups. Individuals may not feel comfortable approaching staff for help when needed.
- There are challenges in determining issues with the essential skills of apprentices with multiple barriers. Career Development Officers need to assess essential skills in mathematics, science and reading at the beginning of the application process. Without essential skills training, apprentices may struggle, fail their block release training or drop out of their apprenticeship entirely.
Key informants identified a number of lessons learned in the design and delivery of the program.
- Apprentices who relocate to attend training are more likely to succeed when they receive peer-support from an individual with a similar background and location.
- It is important to have conversations with apprenticeship candidates about what to expect in terms of training and financial costs such as student fees, rent deposits, etc. in order to help them plan for these expenses.
- Some employers provide extra financial support (such as a completion bonus or per diem) to apprentices to help them while attending block release training. This was identified as helping apprentices access and complete their block release training.
- There is flexibility with financial supports to provide funds for the two-week EI waiting period under the program.
- Recently, a trade school was opened locally allowing some apprentices to remain at home while completing their training rather than travelling to the south. This is beneficial because it allows apprentices to continue to receive the support of their community and tuition is lower.
- The application process is relatively short.
2.4 Training on the Job
2.4.1 Program description
Based on a document review and 4 key informant interviews completed in summer 2015
The Targeted Wage Subsidies program in Nunavut is called the Training on the Job program. The objective of the program is to encourage employers to hire unemployed EI-eligible individuals who they would not normally hire, in order to help the individual gain work experience. In addition, it was identified that the program is intended to provide an incentive for employers to hire, train and even retain workers who need experience and training, including pre-apprentice opportunities leading to apprenticeship registration. With these objectives, the program provides a subsidy to employers to cover a portion of the participant’s salary. Individuals can be supported to gain training in full-time, part-time (minimum of 20 hours per week) and seasonal jobs. Under the LMDA, the Training on the Job program is provided to active and former EI claimants, including apprentices.
The amount and duration of the subsidy are negotiated with Career Development Officers. The maximum length of the subsidy is 52 weeks, but may be considerably less where the training and skills requirements for particular positions are low. The maximum amount of the subsidy provided is $15 per hour. Apprentices who participate in the program receive $15 per hour for the first level, $12.50 per hour for the second level and $10 per hour for the third level. No additional employment-related expenses are supported under the program.
2.4.2 Program delivery
Based on a document review and 4 key informant interviews completed in summer 2015
The program is delivered by Career Development Officers. Most key informants identified that the program is primarily employer-driven. Employers usually initiate the application process for the program. According to some key informants, applications take approximately one week to complete.
According to all key informants, Career Development Officers make contact with participants at regular intervals during and after the wage subsidy. During the subsidy, Career Development Officers ensure that the participant is on track for their learning plan and that no new barriers have arisen. Career Development Officers may provide support to participants when required and may also encourage participants to call them to discuss any issues that they may be facing, including personal or family issues, since these can impact their work life.
Career Development Officers follow-up with participants and employers at 3, 6 and 12 months. For participants who did not remain employed, Career Development Officers re-assess participants and determine if job search or other supports may be required.
According to key informants, the program is open to a variety of occupations. Examples of recent occupations supported under the program include: hotel front desk staff, stock persons, administrative assistants/receptionists, veterinary technicians and by-law officers. For apprentices assisted by the program, key informants identified that the most common occupations are carpenters, electricians, oil mechanics and plumbers.
2.4.3 Profile of program participants
As shown in Table C1 in Appendix C, former claimants who started participation in 2001 to 2007 were predominantly male (71%), in the 25 to 34 age category (48%), and self-identified as Aboriginal (69%). The most common skill level required for the job held before participation was on-the-job training (36%) followed by college or apprenticeship training (29%). The small number of active EI claimants’ participants in Training on the Job prevented an analysis of their data.
2.4.4 Outcomes
Former claimants
As shown in Table C2 in Appendix C, former claimants who started participation in 2001 to 2007 experienced an increase in average annual earnings ($15,404), a decrease in the average annual proportion of participants claiming EI and social assistance (16 and 5 percentage points respectively) between the pre- and post-program periods and a decrease in the level of dependence on income support (6 percentage points). Finally, former claimants experienced a decrease in the proportion employed (6 percentage points or 6 participants) but 87% of them were employed annually during the post-program period. A more detailed display of average earnings is provided in Figure 5 below.

Text description of Figure 5
| Employment earnings | |
|---|---|
| 5 yrs pre | 13,712 |
| 4 yrs pre | 15,533 |
| 3 yrs pre | 18,007 |
| 2 yrs pre | 17,387 |
| 1 yr pre | 16,880 |
| Participation period | 22,778 |
| Participation period | 28,125 |
| 1 yr post | 28,174 |
| 2 yrs post | 30,245 |
| 3 yrs post | 31,752 |
| 4 yrs post | 34,224 |
| 5 yrs post | 34,143 |
Overall, there are clear indications that former claimants who participated in Training on the Job improved their labour market attachment mainly through increases in earnings and reduction in EI and social assistance use. This interpretation accounts for the unique labour market context in Nunavut and the fact that the vast majority of participants are Aboriginals (mainly Inuit). As reported in section 2.1, Inuit experience significantly high unemployment and lower education levels compared to the total working age population of Nunavut. As well, these numbers should be interpreted taking into consideration the limited employment opportunities in Nunavut, particularly in smaller communities.
2.4.5 Challenges and lessons learned about program design and delivery
Based on a document review and 4 key informant interviews completed in summer 2015
According to the Employment Insurance Monitoring and Assessment Reports, the number of new interventions has decreased between 2005 to 2006 and 2013 to 2014. Key informants identified the following reasons to explain the decline in the use of the program:
- The reporting burden can discourage employer participation. Key informants identified that there is approximately 10 pages of paperwork for the application (including the job description and training plan, among other details).
- Employers cannot access the program multiple times.
- The positions supported usually need to be new jobs and this can be a challenge for some employers in Nunavut since there are not many new jobs.
Almost all of the key informants identified that most participants are retained by employers. For participants who did not continue working for the same employer, key informants provided a number of reasons, including layoff due to lack of work, family issues or participants pursuing other employment opportunities.
Key informants also identified a number of challenges with the design and delivery of the program including:
- The application length and amount of paperwork can be a burden on employers.
- The maximum amount of the subsidy is not high enough to encourage some employers to participate.
Key informants identified a number of lessons learned and best practices in the design and delivery of the program:
- Having Career Development Officers conduct outreach activities and raise awareness about the program with employers.
- Meeting with the employer and the participant at the same time to explain the application and administrative processes ensures that they have a common understanding of the requirements.
- Conducting follow-up with both participants and employers is beneficial. This can help to ensure that issues are addressed as they arise. As well, encouraging Career Development Officers to conduct site visits would help to ensure that participants are progressing well in their training plan.
- Career Development Officers may need to help employers develop training plans and prepare their job descriptions. Key informants identified that when developing training plans for apprentices, looking at the skills that the apprentice must develop before their next training period and encouraging the employer to incorporate that into the training plan is beneficial.
2.5 Nunavut Entrepreneurship Incentive
2.5.1 Program description
Based on information available on the website of the Department of Family Services
The self-employment program in Nunavut is called the Nunavut Entrepreneurship Incentive. The program provides $5,000 ($2,500 in two installments) in financial support to new entrepreneurs. Participants receive career counseling from Career Development Officers and business start-up support from designated business development partner consultants.
Eligible expenses under the program include:
- Licensed child care costs for children under the age of six.
- Business telephone, rent or lease payments.
- Fuel costs for a vehicle related to the business.
- Travel costs to attend training related to the business.
- Course costs directly related to the business.
- Purchase of special equipment for the business.
2.5.2 Program delivery
Based on information available on the website of the Department of Family Services
Candidates must complete an Employment Assistance Services application with a Career Development Officer. They will then work through the development of a business plan using the expertise of a business development partner. The duration of this process varies and may take just a few weeks or up to a few years to develop. Upon completion of the business plan, the client will obtain a Nunavut business license.
Once a Business License is obtained, an application for the Nunavut Entrepreneurship Incentive can be submitted to a Career Development Officer and must be done within 12 months of receiving business plan approval.
Nunavut-based entrepreneurs are eligible for the financial support if they:
- Are starting a new business
- Are 18 years or older and either a Canadian citizen or permanent resident
- Have not received the Nunavut Entrepreneurship Incentive option in the past
- Have developed a viable business plan in collaboration with an eligible Nunavut business development partner
- Have obtained a valid business license
- Provide a confirmation letter from an eligible business development consultant
Upon application approval, an initial payment of $2,500 will be sent via direct deposit to the eligible participant. The participant must account for all eligible expenses (that is retain receipts) for that amount within six months. The Career Development Officer will verify the amounts and reconcile the statements/invoices, then determine the issuance of the second payment of $2,500. The client then has another six months to account for the funding. Expenses related to the funding must match the initial application for funding which states area of need.
Based on the EI Monitoring and Assessment Reports, there were 2 Nunavut Entrepreneurship Incentive participants in 2014 to 2015.
2.6 Employment Assistances Services
2.6.1 Program description and delivery
Based on information available on the website of the Department of Family Services
Employment Assistances Services connect participants with career services such as labour market information, employment and career counseling, career action planning, resume writing workshops and interview skills. To benefit from these services, participants fill out an application and submit it to the regional Career Development Officer for review.
2.6.2 Profile of EAS participants
As shown in Table D1 in Appendix D, active claimants who started an intervention in 2001 to 2007 and 2006 to 2008 were mostly male (56% and 64% respectively). For both cohorts, the most common age categories were 25 to 34 and 35 to 44 with about a third of participants in each. While Aboriginal was the most common socio-demographic group, only 46% reported being an Aboriginal individual in the 2001 to 2007 cohort, while 76% were reported in the 2006 to 2008 cohort. For both cohorts, the most common skill level required for the job held before participation was on-the-job training (around 40% of participants in both cohorts).
Former claimants who started an intervention in 2001 to 2007 were mostly female (55%) while those who started an intervention in 2006 to 2008 were mostly male (56%). Former claimants in both cohorts were mainly aged between 35 and 44 years old (35% each). Participants in both cohorts most often had jobs requiring secondary or occupational training (38% and 31% respectively), on-the-job training (33% and 31% respectively) or college or apprentice training (20% and 30% respectively) before participation.
Labour Market barriers faced by Employment Assistances Services participants in general
Based on 81 key informant interviews completed in 10 P/Ts in summer 2013
According to key informants across Canada, the main labour market barriers faced by individuals who access the program with or without participating in Employment Benefits include:
- Lack of work experience or skills mismatches (9 P/Ts)
- Low essential and foundational skills (8 P/Ts)
- Access and affordability of transportation (8 P/Ts)
- Access and affordability of childcare (8 P/Ts)
- Criminal records and addictions (8 P/Ts)
- Being a person with a disability or having mental health issues (7 P/Ts)
- Working in temporary, seasonal or part-time employment (7 P/Ts)
- Lack of marketable skills (that is, outdated skills, inability to network) (7 P/Ts)
- Employers’ perception toward individuals in some groups (visible minorities, persons with disabilities, new immigrants, Aboriginal peoples, etc.) (7 P/Ts)
- Lack of employment opportunities, particularly in rural and remote areas (6 P/Ts)
- Language barriers (6 P/Ts)
- Low self-esteem, lack of motivation and negative attitude (6 P/Ts)
- Lack of job search or interview skills (5 P/Ts)
- Homelessness and lack of affordable housing (4 P/Ts)
2.6.3 Outcomes
Active claimants
Figures presented in this sub-section should be interpreted with caution given the small number of participants (52 participants for the 2001 to 2007 cohort and 42 for the 2006 to 2008 cohort)
As shown in Table D2 in Appendix D, active claimants who started an intervention between 2001 and 2007 earned, on average, $2,528 more annually in the five years after participation compared to the five years before participation. Figure 6 depicts the variation in average annual earnings for these participants from $16,852 in the 5th pre-program year to $23,871 in the 5th post-program year. It is noted that average earnings were not adjusted for inflation using the Consumer Price Index given the fact that the program start year varied between 2001 and 2007.

Text description of Figure 6
| Employment earnings | |
|---|---|
| 5 yrs pre | 16,852 |
| 4 yrs pre | 16,745 |
| 3 yrs pre | 18,949 |
| 2 yrs pre | 25,535 |
| 1 yr pre | 25,403 |
| Participation period | 17,180 |
| 1 yr post | 22,776 |
| 2 yrs post | 26,920 |
| 3 yrs post | 24,452 |
| 4 yrs post | 24,153 |
| 5 yrs post | 23,871 |
The average annual proportion of participants employed decreased by 12 percentage points (or 6 participants) between the pre-program (92%) and the post-program (80%) periods. This can be partially explained by retirement decisions given the fact that 13% or 7 participants were 55 years old or over at the start of participation.
Finally, the average annual proportion of participants claiming EI benefits increased slightly by 1 percentage point (or 0.9 week) while the proportion of participants claiming social assistance benefits remained unchanged at 16%. Overall, the average level of dependence on income support increased by 6 percentage points, from 14% before participation to 20% after participation.
Active claimants who started an intervention between 2006 and 2008 experienced an increase in average earnings ($9,507) while 39 of the 42 participants remained employed. As well, few participants collected more EI and social assistance benefits in the post-program period.
Overall, between 80% and 93% of active claimants who participated exclusively in Employment Assistance Services in 2001 to 2007 and 2006 to 2008 remained employed in the 5 years post-program participation. Employment Assistance Services are relatively modest activities and, by themselves, are not expected to lead to substantial effects on labour market outcomes. In other words, Employment Assistance Services aim to support the return to work of unemployed participants and not necessarily to secure a better paying job than pre-participation. As well, these numbers should be interpreted taking into consideration the limited employment opportunities in Nunavut, particularly in smaller communities.
Former claimants
As shown in Table D3 in Appendix D, former claimants who started an intervention between 2001 and 2007 did not experience a meaningful change in the average annual earnings between the five years after participation ($13,634) compared to the five years before participation ($13,695). Figure 7 depicts the variation in average annual earnings for these participants from $13,952 in the 5th pre-program year to $16,068 in the 5th post-program year. It is noted that average earnings were not adjusted for inflation using the Consumer Price Index given the fact that the program start year varied between 2001 and 2007.

Text description of Figure 7
| Employment earnings | |
|---|---|
| 5 yrs pre | 13,952 |
| 4 yrs pre | 15,728 |
| 3 yrs pre | 15,128 |
| 2 yrs pre | 13,149 |
| 1 yr pre | 10,518 |
| Participation period | 9,531 |
| 1 yr post | 12,264 |
| 2 yrs post | 13,571 |
| 3 yrs post | 14,577 |
| 4 yrs post | 15,795 |
| 5 yrs post | 16,068 |
The average annual proportion of participants employed decreased by 11 percentage points between the pre-program (85%) and the post-program (74%) periods. This can be partially explained by retirement decisions given the fact that 7% participants were 55 years old or over at the start of participation.
Finally, the average annual proportion of participants claiming EI benefits decreased by 19 percentage points (or 3.4 weeks) while the proportion of participants claiming social assistance benefits remained unchanged at 23%. Overall, the average level of dependence on income support decreased slightly by 1 percentage point, from 22% before participation to 21% after participation.
Former claimants who started an intervention between 2006 and 2008 experienced an increase in average earnings ($7,704). They also experienced a decrease in the proportion of participants employed (4 percentage points) and a decrease in the use of EI (15 percentage points). There was an increase in the use of social assistance benefits (5 percentage points) while the level of dependence on income support remained unchanged at 22%.
The majority of former claimants who started an intervention in 2001 to 2007 were adults (30 years old and over) with only 24% aged below 30 years old (youth). Average outcomes for adults mirrored those of former claimants in general. In contrast, youth experienced an increase in average annual earnings.
Overall, between 74% and 91% of former claimants who participated exclusively in Employment Assistance Services remained employed in the 5 years post-program participation. Employment Assistance Services are relatively modest activities and, by themselves, are not expected to lead to substantial effects on labour market outcomes. In other words, Employment Assistance Services aim to support the return to work of unemployed participants and not necessarily to secure a better paying job than pre-participation. As well, these numbers should be interpreted taking into consideration the limited employment opportunities in Nunavut, particularly in smaller communities.
2.6.4 Lessons learned about program design and delivery
Based on a document review and 81 key informant interviews in 10 P/Ts completed in summer 2013
Managers and caseworkers from 10 P/Ts involved in the delivery of Employment Assistance Services were interviewed during the summer of 2013. These interviews, in addition to document reviews, provided insight into the challenges and lessons learned related to program design and delivery. National-level qualitative findings are included in this report with the perspective of sharing lessons learned and best practices with Nunavut.
Key informants identified the following challenges related to program design and delivery:
- Participants in some regions face issues with limited access to services, mobility and transportation (7 P/Ts).
- There is a lack of awareness about the program among potential participants (6 P/Ts).
- The current budget allocation is not enough to support the delivery of the program. This led some service providers to eliminate services and reduce the number of participants served (5 P/Ts).
- Service providers cannot necessarily provide all the services required by participants facing multiple barriers to employment. They have to refer these individuals to other organizations and sometimes, one individual can be referred to more than one organization. This may lead some participants to give up on their return-to-work process (5 P/Ts).
- The current performance measurement strategy does not capture the various outcomes achieved over time when assisting people with multiple barriers to employment (3 P/Ts).
- Service providers have difficulties in hiring skilled and knowledgeable staff (2 P/Ts). As well, some service providers have a high turn-over of staff and staff training is very costly (2 P/Ts).
- Service providers lack capacity to follow up with each participant in order to provide job maintenance support (2 P/Ts).
Key informants also provided examples of best practices and lessons leared with respect to the program design and delivery. These include:
- It is important to case manage participants and to provide a client-centered holistic approach through counselling, motivation, building self-esteem and assisting them in choosing a career path (9 P/Ts).
- It is important for service providers to be engaged in their community and well connected to other service providers (for information sharing and referral purposes), particularly for those dealing with persons with disabilities and mental health issues. Partnerships and ongoing communication with employers can also facilitate the labour market integration of participants through job placements and subsidy (8 P/Ts).
- Since participants with multiple barriers to employment often require more intensive interventions, it is important to conduct a strong needs assessment in order to make the best training decision (7 P/Ts).
- Having a one-stop shop for services and streamlining services (co-location, no wrong-door approach, offering a comprehensive suite of services from self-serve to workshops, employability assessment, career orientation, need determination and ongoing case management), as well as removing barriers to access and participation (7 P/Ts).
- It is important to keep a long-term perspective when assisting participants facing multiple barriers to employment (6 P/Ts).
- Providing long-term follow-up with participants for employment retention support is seen as a best practice (6 P/Ts).
- Giving service providers increased flexibility when assisting participants with multiple barriers to employment, particularly in terms of the length of services and the type of financial support that can be made available to participants (6 P/Ts).
- It is important for service providers to have dedicated workers, specialized teams to deal with participants facing multiple barriers to employment, and job coaches/developers that are dedicated and committed to support these participants (6 P/Ts).
- Service providers need to make appropriate referrals, when available, to specialized community organizations for participants dealing with disabilities, mental health issues, addictions and criminal records (5 P/Ts).
- Providing participants with help to contact employers (for example, assistance in handing out resumes) and networking opportunities (5 P/Ts).
- Providing participants with an opportunity to try and test prospective jobs (5 P/Ts).
- It is important for provincial/territorial governments to have strong partnerships with third-party service providers and employers in order to be able to mobilize the service delivery network in cases of emerging labour market challenges (major lay-offs, downturn, etc.) and to organize job fairs and joint group workshops (5 P/Ts).
- There is a need to enhance the promotion of programs and services (5 P/Ts).
- There is a need to provide services in an innovative way depending on local needs and reality (that is, online resources and training) (3 P/Ts).
- There is a need to change the way success is measured under the program. For example, the progress of a participant with multiple barriers to employment should be measured through small steps from securing adequate housing to dealing with addictions, improving life skills and integrating into the labour market (3 P/Ts).
- Service providers need additional resources in order to maintain the level and quality of services and to train staff, particularly those operating in rural areas (3 P/Ts).
3. Comparison of key findings by program type
This section provides an overview of the key findings from the analysis of labour market outcomes for the participation in Adult Learning and Training Supports, Training on the Job, and Employment Assistance Services for both active and former EI claimant participants who started participation in the 2001 to 2007 period.
Overall, labour market outcomes provide some indications that LMDA-funded programs and services delivered in Nunavut are generally helping participants to improve their labour market attachment after participation.
With some exceptions, participants in LMDA programs and services showed higher average earnings and lower average proportions on EI and social assistance during the five years after program participation when compared to five years prior.
Some participants do not appear to be securing employment following their participation in LMDA programs and services, as reflected in the general decrease in the proportion of participants employed in the post-participation period compared to the pre-participation period. However, employment outcomes should be interpreted with caution taking into consideration the limited employment opportunities in Nunavut, particularly in smaller communities.
Most program participants have higher average earnings after program participation
As shown in Figure 8, active claimants who participated in Adult Learning and Training Supports and Employment Assistance Services showed higher average employment during the five years after their participation when compared to five years prior to participation. As well, former claimants who participated in Adult Learning and Training Supports and Training on the Job also showed higher average employment earnings after participation compared to before participation.
Considering the small number of active claimants who participated in Employment Assistance Services (n=52), their figures should be interpreted with caution. As well, Employment Assistance Services are relatively modest activities such as counselling, job search assistance and case management. By themselves, they are not expected to lead to substantial effects on labour market outcomes.

Text description of Figure 8
| Average change in earnings | ||
|---|---|---|
| Active claimants | Former claimants | |
| Adult Learning and Training Supports | 15,081 | 9,388 |
| Training on the Job | 0 | 15,404 |
| Employment Assistance Services | 2,528 | -61 |
Note: outcomes for active participants in Employment Assistance Services should be interpreted with caution given the small number of participants (n=52).
The average proportion of participants on Employment Insurance and social assistance is generally lower after program participation when compared to before program participation
As shown in Figures 9 and 10, overall, the average proportion of participants who use EI and social assistance is shown to be lower in the post-participation period for active and former claimants of Adult Learning and Training Supports as well as former claimants of Training on the Job. In addition, the average proportion of former claimants who use EI is also shown to be lower in the five years after program participation for those who participated in Employment Assistance Services (when compared to five years prior).

Text description of Figure 9
| Percentage points | ||
|---|---|---|
| Employment Insurance | Social Assistance | |
| Adult Learning and Training Supports | 0 | -3 |
| Employment Assistance Services | 1 | 0 |
Note: outcomes for active participants in Employment Assistance Services should be interpreted with caution given the small number of participants (n=52 participants).

Text description of Figure 10
| Percentage points | ||
|---|---|---|
| Employment Insurance | Social Assistance | |
| Adult Learning and Training Supports | -10 | -7 |
| Training on the Job | -16 | -5 |
| Employment Assistance Services | -19 | 0 |
The average proportion of participants employed is generally lower after program participation when compared to the before program participation
As shown in Figure 11, active EI claimants of Adult Learning and Training Supports were the only participants who showed an increase in the proportion employed between the pre- and post-participation periods. Participants of the other programs and services displayed decreases in the proportion of participants employed in the post-participation period compared to the pre-participation period. These decreases can be partially explained by the high unemployment levels in Nunavut and the limited employment opportunities, particularly in smaller communities.

Text description of Figure 11
| Average change in earnings | ||
|---|---|---|
| Active claimants | Former claimants | |
| Adult Learning and Training Supports | 2 | -4 |
| Training on the Job | 0 | -6 |
| Employment Assistance Services | -12 | -11 |
Note: outcomes for active participants in Employment Assistance Services should be interpreted with caution given the small number of participants (n=52).
4. Conclusions
Evaluation evidence presented and discussed in this report provided indications that programs and services designed and delivered by Nunavut under the LMDA are generally helping participants to improve their labour market experience after participation. Programs and services contribute to achieving the Government of Nunavut’s priority of self-reliance and optimism through education and training, fulfilling the objective of the Nunavut Adult Learning Strategy and to fulfilling the mandate of the Career Development division of the Department of Family Services to provide services to the public in order to link people with jobs.
With some exceptions, the labour market outcomes demonstrate that participants in LMDA programs and services showed higher average earnings and lower average proportions on EI and social assistance during the five years after program participation when compared to five years prior.
Some participants do not appear to be securing employment following their participation in LMDA programs and services, as reflected in the general decrease in the proportion of participants employed in the post-participation period compared to the pre-participation period. However, employment outcomes should be interpreted with caution taking into consideration the limited employment opportunities in Nunavut, particularly in smaller communities.
Key informants’ interviews with program managers and career development officers as well as the documents reviewed and the questionnaires filled by Nunavut representatives identified challenges and lessons learned in program design and delivery:
Adult Learning and Training Supports
To collect labour market information, representatives from the Department of Family Services regularly attend trade shows, mining symposiums and holding meetings with industry in the area to determine the local labour market demand. The Department also examines what programs, offered by the Nunavut Arctic College, correspond to labour market demand. Program participants are expected to do further research on training options and local labour market demand as part of the application process. This may contribute to program effectiveness.
According to Career Development Officers and managers interviewed as part of the evaluation, the main challenges related to program design and delivery included:
- The perceived insufficient level of some components of financial assistance.
- Maintaining regular contact with participants for monitoring purposes can be difficult for Career Development Officers.
Adult Learning and Training Supports for Apprentices
Existing Canadian literature showed that there is a fairly high non-completion rate among apprentices (40 to 50%)Footnote 10. Furthermore, subject matter literature revealed that despite the growth in apprenticeship registrations in Canada, there has not been a corresponding increase in completionsFootnote 11. According to Career Development Officers and managers involved in apprenticeship delivery drop-out can be is due to factors such as:
- The difficulty associated withrelocation for training purposes
- Low level of essential skills, lack of training and job opportunities
- Financial difficulties
- Lack of housing
- Family issues
- Substance abuse
- Delays in conducting exams following the end of training
Career Development Officers and managers indicated that apprentices can benefit from counselling, tutoring support, and pre-apprenticeship training.
Training on the Job
According to the EI Monitoring and Assessment Reports, the number of new interventions has decreased between 2005 to 2006 and 2013 to 2014. According to Career Development Officers and managers, factors affecting take-up included:
- The reporting burden to employers
- Employers cannot access the program multiple times
- Level of funding is insufficient to encourage employers to participate
- The positions supported usually need to be new jobs
Career Development Officers and managers indicated that outreach activities can improve employer participation.
5. Recommendations
A total of 6 recommendations emerged from the evaluation findings. They are as follows:
The report presents challenges experienced by Adult Learning and Training Supports (including the Apprentice component) participants in general. These challenges are centered on the low levels of literacy and essential skills, low education, lack of work related skills and perceived insufficient level of financial support. As well, labour market statistics demonstrate that Inuit experience significantly higher unemployment rates and lower levels of education compared to the average rates in the territory.
Recommendation 1: The provision of literacy and essential skills training is important in the Nunavut context to support individuals to prepare for vocational training and to reintegrate into the labour market. These measures should be reported separately from other Adult Learning and Training Supports interventions given their unique objectives.
Recommendation 2: Consideration should be given to examine to what extent the level of financial supports provided under the program are sufficient.
Recommendation 3: Consideration should be given to examine to what extent Career Development Officers can increase monitoring and provide additional supports to apprentices.
Outcome analysis results show that the Training on the Job program is improving the earnings of participants and reducing their use of EI and social assistance as well as the dependence on government income support. However, the number of interventions declined between 2005 to 2006 and 2013 to 2014. According to key informants, this is due to the reporting burden on employers, the limitation on using the program multiple times and employers’ capacity to create a new position.
Recommendation 4: Depending on labour market priorities and budget allocation across the various EBSMs, Nunavut may wish to explore ways of removing barriers to employer participation in Training on the Job.
A study carried out across Canada regarding the timing of participation in Employment Assistance Services showed that receiving assistance early after starting an EI claim can lead to better labour market impacts.
Recommendation 5: Consideration should be given by Nunavut to request timely access to data on new EI recipients for targeting purposes, especially if awareness about Employment Assistance Services is also an issue in the territory.
The LMDA evaluation was only able to produce labour market outcomes, given the small number of participants. Labour market outcomes were produced over five years and for the entire population of participants using rich data on EI claimants, EBSM participation data and Canada Revenue Agency taxation files. Some data gaps were identified in order to support future evaluation activities.
Recommendation 6: Improvements in the data collection process are recommended to address key program and policy questions of interest to Canada and Nunavut. Specifically:
- Collect data on whether participants are members of designated groups including Inuit and persons with disabilities.
- Collect data on the type of training funded under Adult Learning and Training Supports and the type of assistance provided under Employment Assistance Services. Nunavut, ESDC and other P/Ts should work together to define common categories for both EBSMs.
- Collect detailed data on the cost of EBSM interventions.
- ESDC and Nunavut should carry out a data assessment regarding the integrity of data uploads and the standardization process of Nunavut data within ESDC.
References
Canada Employment Insurance Commission. Employment Insurance Monitoring and Assessment Reports. 2003 to 2004 to 2013 to 2014.
Coe, Patrick. “Apprenticeship programme requirements and apprenticeship completion rates in Canada.” Journal of Vocational Education and Training. 2013. 65(4): 575 to 605.
Conference Board of Canada. Territorial Outlook. Summer 2016.
Conference Board of Canada. Education and Skills in the Territories. September 2014.
Employment and Social Development Canada. Analysis of EBSM Profile and Outcomes for 2006 to 2008 Participants in Nunavut . Evaluation Directorate. March 2015
Employment and Social Development Canada. Profile, Outcomes and Net Impacts of EBSM Participants in Nunavut . Evaluation Directorate. March 2014
Employment and Social Development Canada. Analysis of EBSMs Profile and Outcomes for EI Claimants Category “Long-Tenured Workers” in Nunavut. Evaluation Directorate. April 2016.
Employment and Social Development Canada. Study on the Adult Learning and Training Supports (ALTS) for Apprentices in Nunavut . Evaluation Directorate. June 2016.
Employment and Social Development Canada. Study on the Adult Learning and Training Supports (ALTS) Program in Nunavut. Evaluation Directorate. April 2016.
Employment and Social Development Canada. Study of the Training on the Job Program: Nunavut. Evaluation Directorate. February 2016.
Government of Canada. Agreement to amend the Canada-Nunavut Labour Market Development Agreement. September 13, 2016. Accessed January 17, 2017.
Natural Resources Canada, GeoAccess Division. Land and freshwater area, by province and territory. Accessed February 15 2017.
Nunavut Bureau of Statistics. Nunavut Quick Facts. Accessed February 15 2017.
Nunavut Department of Family Services. Career Development. Accessed January 17, 2017.
Nunavut Department of Family Services. Employment Assistance Services. Accessed February 6 2017.
Nunavut Department of Family Services. Nunavut Entrepreneurship Incentive program. Accessed February 6 2017.
Government of Nunavut. Sivumut Abluqta: Stepping Forward Together 2014 to 2018. 2014
LaRochelle-Côté, Sébastien and Sharanjit Uppal, "The Financial Well-Being of the Self-Employed," Perspectives on Labour and Income, vol. 23, no. 4, Winter 2011
Red Seal. Apprenticeship Completion, Certification and Outcomes. Ottawa: Red Seal, 2014.
Acronyms
- EBSM
- Employment Benefits and Support Measures
- EI
- Employment Insurance
- ESDC
- Employment and Social Development Canada
- LMDA
- Labour Market Development Agreements
- P/T
- Province/Territory
Appendix A - Methodology
Qualitative data
Qualitative data reported in the Adult Learning and Training Supports (ALTS), Adult Learning and Training Supports for Apprentices (ALTSA), Training on the Job (TOJ) and Employment Assistances Services (EAS) studies were collected from key informant interviews with managers and Career Development Officers and a document/literature review. As well, questionnaires were completed by territorial representatives for the ALTS, ALTSA and TOJ studies. Table A1 below provides the number of key informants interviewed.
Key informant interviews for ALTS, ALTSA and TOJ studies were conducted in 2015.
| Key informants | Studies | ||
|---|---|---|---|
| ALTS | ALTSA | TOJ | |
| Managers and Career Development officers | 4 | 5 | 4 |
Quantitative methods
All quantitative analyses were conducted using linked administrative data from EI Part I (EI claim), EI Part II (EBSM participation data) and T1 and T4 taxation files on up to 100% of participants in Nunavut.
All outcome analyses were conducted using a unit of analysis called the Action Plan Equivalent, which combines all EBSMs given to an individual within no more than six months of each other. For reporting purposes, outcomes were attributed to the longest intervention of the Action Plan Equivalent when ALTS, ALTSA or TOJ was the longest intervention. Impacts for EAS were calculated for Action Plan Equivalent that contained only EAS with no Employment Benefits.
Outcomes were measured for the following indicators:
- Employment/self-employment earnings represent the total earnings an individual had from paid employment and/or self-employment. (This information is available by calendar year and is obtained from T1 and T4 tax return records.)
- Proportion employed/self-employed represents the percentage of participants that have earnings from employment and/or self-employment.
- Amount of EI benefits received represent the average amount of EI benefits received.
- Weeks in receipt of EI benefits represent the average number of weeks during which EI benefits were received.
- Social Assistance benefits represent the average amount of social assistance benefits received. (This information is available by calendar year and is obtained from T1 tax return records.)
- Dependence on income support represents the ratio of participant’s income that came from EI and social assistance benefits (that is, EI benefits + social assistance benefits / (EI benefits + social assistance benefits + earnings from employment/self/employment)).
In addition to all active and all former claimants, outcomes were examined for the following sub-groups of participants:
- Adult workers: individuals 30 years old and older.
- Youth: individuals below 30 years old.
Strengths and limitations from the studies
Overall, the number of key informants interviewed was relatively small in some studies. The key informants’ responses were representative of their own experience and their own region or community but it is unclear if they were fully representative of the entire territory.
The outcome analysis provides an assessment of how the labour market experience of participants evolved over time but does not allow an assessment of the extent to which those changes were due to EBSM participation. For example, increases in employment earnings over the period examined could be partly due to inflation or normal wage increase associated with experience. With that respect, the outcome results should not be interpreted as a direct measure of program effectiveness.
Appendix B - Detailed results Adult Learning and Training Supports
| Active claimants | Former claimants | |||
|---|---|---|---|---|
| 2001 to 2007 | 2006 to 2008 | 2001 to 2007 | 2006 to 2008 | |
| Number of observations | 272 | 137 | 320 | 110 |
| Gender | ||||
| Male | 68% | 80% | 58% | 69% |
| Female | 32% | 20% | 42% | 31% |
| Age | ||||
| Under 25 | 21% | 15% | 8% | 7% |
| 25 to 34 | 41% | 48% | 47% | 51% |
| 35 to 44 | 28% | 25% | 36% | 34% |
| 45 and over | 10% | 12% | 8% | 8% |
| Socio-demographic group | ||||
| Aboriginal individuals* | 83% | 96% | 70% | 96% |
| Persons with disabilities* | 1% | 0% | 1% | 0% |
| Visible minorities* | 2% | 1% | 1% | 1% |
| Immigrants | 0% | 0% | 2% | 0% |
| Marital status | ||||
| Married or common-law | 60% | 58% | 60% | 61% |
| Widow/divorced or separated | 5% | 4% | 8% | 5% |
| Single | 33% | 34% | 29% | 33% |
| Missing data/Unknown | 1% | 4% | 2% | 1% |
| Skills level related to National Occupation Code associated with the last EI claim opened before ALTS participation1 | ||||
| Managerial | 4% | 3% | 3% | 1% |
| University | 9% | 6% | 7% | 5% |
| College or apprenticeship training | 23% | 15% | 22% | 27% |
| Secondary or occupational training | 25% | 34% | 33% | 35% |
| On-the-job training | 39% | 42% | 36% | 32% |
| Key Labour Market indicators in the year preceding the start of participation | ||||
| Earnings2 | $23,343 | $24,2373 | $10,995 | $13,4573 |
| Proportion Employed | 97% | 100% | 84% | 87% |
| Proportion on EI | 50% | 52% | 57% | 49% |
| Proportion on SA | 31% | 38% | 35% | 45% |
Note: Proportions may not add up to 100% due to rounding.
*Status self-reported by participants.
1Skill level corresponds to the type and/or amount of training or education typically required to work in last occupation participants had just prior to opening the last EI claim they had before participating in EBSMs:
-Managerial: Management occupations
-University: Occupations usually requiring university education (that is, University degree at the bachelor's, master's or doctorate level)
-College or apprenticeship training: Occupations usually requiring college or vocational education or apprenticeship training such as 2 to 3 years of post-secondary education at a community college, institute of technology or CEGEP or 2 to 5 years of apprenticeship training or 3 to 4 years of secondary school and more than 2 years of on-the-job training, specialized training courses or specific work experience and/or occupations with supervisory responsibilities and occupations with significant health and safety responsibilities, such as firefighters, police officers and registered nursing assistants.
- Secondary school or occupational training: Occupations usually requiring secondary school and/or occupation-specific training such as one to four years of secondary school education or up to 2 years of on-the-job training specialized training courses or specific work experience.
-On-the-job training: On-the-job training is usually provided for occupations (that is, short work demonstration or on-the-job training or no formal educational requirements).
2Average earnings for all participants including those who reported $0 earnings during that year.
3Earnings have been adjusted according to the Consumer Price Index (CPI), published by Statistics Canada, to the 2000 base year.
| Average outcomes | Pre-program period | Program period | Post-program period | Average annual outcomes pre-1 | Average annual outcomes post-2 | Change3 | |||||||||
|---|---|---|---|---|---|---|---|---|---|---|---|---|---|---|---|
| 5 yrs pre | 4 yrs pre | 3 yrs pre | 2 yrs pre | 1 yr pre | Program start year | 1 yr post start year | 1 yr post | 2 yrs post | 3 yrs post | 4 yrs post | 5 yrs post | ||||
| All active claimants | |||||||||||||||
| 2001 to 2007 participants (n= 272) | |||||||||||||||
| Earnings including $04 | $12,526 | $13,686 | $14,764 | $19,494 | $23,343 | $17,139 | $20,183 | $25,539 | $30,365 | $32,877 | $35,136 | $35,304 | $16,763 | $31,844 | $15,081 |
| Earnings excluding $05 | $14,546 | $15,472 | $16,151 | $20,650 | $23,960 | $17,999 | $21,699 | $27,786 | $33,037 | $36,801 | $39,950 | $40,558 | $18,156 | $35,626 | $17,470 |
| Proportion employed | 80% | 85% | 90% | 95% | 97% | 95% | 93% | 92% | 92% | 89% | 89% | 91% | 89% | 91% | 2pp |
| Proportion on EI | 16% | 18% | 21% | 28% | 50% | 97% | 56% | 29% | 29% | 29% | 25% | 22% | 27% | 27% | 0pp |
| EI benefits | $892 | $869 | $1,134 | $1,402 | $2,201 | $7,623 | $3,573 | $2,005 | $1,791 | $2,463 | $1,921 | $1,673 | $1,300 | $1,970 | $670 |
| Number of weeks on EI | 3.1wk | 3wk | 3.8wk | 4.5wk | 6.8wk | 22.6wk | 10.2wk | 5.4wk | 4.9wk | 6.4wk | 4.7wk | 4wk | 4.3wk | 5.1wk | 0.8wk |
| Proportion on SA | 23% | 25% | 31% | 32% | 31% | 28% | 34% | 31% | 30% | 24% | 22% | 22% | 29% | 26% | -3pp |
| SA benefits | $924 | $882 | $1,094 | $1,240 | $1,031 | $1,109 | $1,390 | $1,352 | $1,464 | $1,121 | $984 | $1,058 | $1,034 | $1,196 | $162 |
| Dependence on income support | 15% | 14% | 16% | 16% | 16% | 40% | 28% | 18% | 17% | 16% | 13% | 13% | 15% | 15% | 0pp |
| 2006 to 2008 participants (n=137) | |||||||||||||||
| Earnings including $04 | $15,743 | $16,683 | $18,810 | $23,250 | $27,225 | $20,536 | $29,586 | $33,054 | $40,211 | $43,340 | - | - | $20,342 | $38,868 | $18,526 |
| Earnings excluding $05 | $16,810 | $17,750 | $19,095 | $23,782 | $27,225 | $21,009 | $30,274 | $34,071 | $41,794 | $44,372 | - | - | $20,933 | $40,079 | $19,146 |
| Proportion employed | 94% | 94% | 99% | 98% | 100% | 98% | 98% | 97% | 96% | 98% | - | - | 97% | 97% | 0pp |
| Proportion on EI | 15% | 20% | 22% | 23% | 52% | 97% | 46% | 37% | 33% | 38% | - | - | 27% | 36% | 9pp |
| EI benefits | $936 | $971 | $1,139 | $1,241 | $2,746 | $8,262 | $3,375 | $2,605 | $2,437 | $3,478 | - | - | $1,407 | $2,840 | $1,433 |
| Number of weeks on EI | 3wk | 3wk | 3wk | 4wk | 8wk | 23wk | 9wk | 6wk | 6wk | 8wk | - | - | 4wk | 7wk | 3wk |
| Proportion on SA | 34% | 32% | 39% | 41% | 38% | 38% | 41% | 32% | 27% | 23% | - | - | 37% | 27% | -10pp |
| SA benefits | $1,403 | $1,356 | $1,759 | $1,878 | $1,487 | $1,593 | $1,745 | $1,447 | $1,185 | $911 | - | - | $1,577 | $1,181 | -$396 |
| Dependence on income support | 18% | 19% | 19% | 18% | 17% | 40% | 22% | 17% | 13% | 17% | - | - | 18% | 15% | -3pp |
| Sub-groups of active claimants | |||||||||||||||
| Adults (30 years old and over) 2001 to 2007 participants (n=160) | |||||||||||||||
| Earnings including $04 | $15,053 | $16,522 | $17,740 | $22,609 | $25,749 | $17,137 | $21,516 | $26,290 | $29,006 | $31,515 | $33,917 | $34,438 | $19,535 | $31,033 | $11,498 |
| Earnings excluding $05 | $16,962 | $18,748 | $19,178 | $23,490 | $26,580 | $18,403 | $23,579 | $29,010 | $31,788 | $35,262 | $36,744 | $39,053 | $20,992 | $34,371 | $13,379 |
| Proportion employed | 89% | 88% | 93% | 96% | 97% | 93% | 91% | 91% | 91% | 89% | 93% | 92% | 93% | 91% | -2pp |
| Proportion on EI | 24% | 23% | 27% | 34% | 56% | 98% | 56% | 34% | 28% | 30% | 30% | 24% | 33% | 29% | -4pp |
| EI benefits | $1,358 | $1,178 | $1,480 | $1,583 | $2,691 | $8,248 | $3,662 | $2,325 | $1,844 | $2,573 | $2,402 | $1,839 | $1,658 | $2,196 | $538 |
| Number of weeks on EI | 4.7wk | 3.9wk | 4.9wk | 5.1wk | 8.1wk | 23.8wk | 10.4wk | 6.3wk | 5.2wk | 6.8wk | 5.9wk | 4.5wk | 5.3wk | 5.7wk | 0.4wk |
| Proportion on SA | 31% | 28% | 33% | 33% | 32% | 30% | 36% | 38% | 34% | 28% | 28% | 22% | 31% | 30% | -1pp |
| SA benefits | $1,224 | $1,073 | $1,152 | $1,282 | $1,055 | $1,232 | $1,578 | $1,698 | $1,783 | $1,399 | $1,087 | $1,067 | $1,157 | $1,407 | $250 |
| Dependence on income support | 19% | 17% | 18% | 16% | 18% | 43% | 27% | 23% | 20% | 17% | 14% | 12% | 18% | 17% | -1pp |
| Youth (under 30 years old) 2001-2007 participants (n=112) | |||||||||||||||
| Earnings including $04 | $8,131 | $9,150 | $10,356 | $14,879 | $19,907 | $17,141 | $18,279 | $24,465 | $32,305 | $34,822 | $36,781 | $36,453 | $12,485 | $32,965 | $20,480 |
| Earnings excluding $05 | $9,974 | $10,281 | $11,531 | $16,231 | $20,269 | $17,452 | $19,133 | $26,096 | $34,790 | $39,001 | $44,814 | $42,614 | $13,657 | $37,463 | $23,806 |
| Proportion employed | 67% | 80% | 87% | 92% | 98% | 98% | 96% | 94% | 93% | 89% | 83% | 89% | 85% | 90% | 5pp |
| Proportion on EI | 5% | 11% | 13% | 20% | 40% | 96% | 55% | 22% | 31% | 28% | 18% | 20% | 18% | 24% | 6pp |
| EI benefits | $225 | $428 | $639 | $1,144 | $1,502 | $6,730 | $3,446 | $1,548 | $1,715 | $2,306 | $1,233 | $1,435 | $788 | $1,648 | $860 |
| Number of weeks on EI | 1wk | 1.8wk | 2.2wk | 3.8wk | 5wk | 20.4wk | 10.1wk | 4.1wk | 4.5wk | 5.9wk | 3.1wk | 3.4wk | 2.7wk | 4.2wk | 1.5wk |
| Proportion on SA | 13% | 21% | 27% | 31% | 30% | 25% | 31% | 21% | 23% | 18% | 14% | 22% | 24% | 20% | -4pp |
| SA benefits | $495 | $609 | $1,012 | $1,181 | $997 | $933 | $1,121 | $857 | $1,009 | $724 | $845 | $1,045 | $859 | $896 | $37 |
| Dependence on income support | 9% | 11% | 13% | 16% | 13% | 36% | 28% | 11% | 12% | 15% | 11% | 14% | 12% | 13% | 1pp |
1Average annual outcome pre-: Represents the average annual outcomes over the pre-participation period
2Average annual outcome post-: Represents the average annual outcomes over the post-participation period
3Change between pre- and post-: Represents the difference between the average annual outcome calculated over the pre-participation period and the average annual outcome calculated over the post-participation period.
4Earnings outcome for all individuals covered by the study.
5Earnings outcomes excluding individuals who reported no earnings in a given year.
pp = percentage points.
| Average outcomes | Pre-program period | Program period | Post-program period | Average annual outcomes pre-1 | Average annual outcomes post-2 | Change3 | |||||||||
|---|---|---|---|---|---|---|---|---|---|---|---|---|---|---|---|
| 5 yrs pre | 4 yrs pre | 3 yrs pre | 2 yrs pre | 1 yr pre | Program start year | 1 yr post start year | 1 yr post | 2 yrs post | 3 yrs post | 4 yrs post | 5 yrs post | ||||
| All former claimants | |||||||||||||||
| 2001 to 2007 participants (n= 320) | |||||||||||||||
| Earnings including $04 | $12,940 | $14,518 | $16,571 | $15,716 | $10,995 | $10,109 | $14,736 | $19,806 | $22,230 | $23,933 | $25,509 | $26,203 | $14,148 | $23,536 | $9,388 |
| Earnings excluding $05 | $14,706 | $15,810 | $17,388 | $16,937 | $13,128 | $11,937 | $16,902 | $22,160 | $25,868 | $28,053 | $30,129 | $31,739 | $15,594 | $27,590 | $11,996 |
| Proportion employed | 85% | 91% | 95% | 93% | 84% | 85% | 87% | 89% | 86% | 85% | 85% | 86% | 90% | 86% | -4pp |
| Proportion on EI | 18% | 24% | 38% | 53% | 57% | 28% | 17% | 27% | 26% | 33% | 29% | 27% | 38% | 28% | -10pp |
| EI benefits | $733 | $1,173 | $1,824 | $2,568 | $3,649 | $1,257 | $998 | $1,544 | $1,856 | $2,268 | $2,098 | $2,074 | $1,989 | $1,968 | -$21 |
| Number of weeks on EI | 2.6wk | 4.5wk | 6.2wk | 8.9wk | 12.2wk | 4wk | 2.9wk | 4.6wk | 5.1wk | 5.9wk | 5.4wk | 5.1wk | 6.9wk | 5.2wk | -1.7wk |
| Proportion on SA | 29% | 26% | 26% | 31% | 35% | 35% | 33% | 25% | 22% | 23% | 23% | 24% | 30% | 23% | -7pp |
| SA benefits | $1,470 | $1,116 | $1,078 | $1,139 | $1,567 | $1,633 | $1,506 | $1,405 | $1,016 | $995 | $1,263 | $1,372 | $1,274 | $1,210 | -$64 |
| Dependence on income support | 19% | 18% | 19% | 25% | 35% | 25% | 15% | 17% | 16% | 17% | 17% | 16% | 23% | 17% | -6pp |
| 2006 to 2008 participants (n=110) | |||||||||||||||
| Earnings including $04 | $15,145 | $19,275 | $19,744 | $16,949 | $15,116 | $16,789 | $22,336 | $26,758 | $28,257 | $32,455 | - | - | $17,246 | $29,157 | $11,911 |
| Earnings excluding $05 | $16,045 | $19,820 | $20,303 | $17,608 | $17,343 | $18,485 | $23,452 | $28,988 | $30,906 | $33,780 | - | - | $18,224 | $31,225 | $13,001 |
| Proportion employed | 94% | 97% | 97% | 96% | 87% | 91% | 95% | 92% | 91% | 96% | - | - | 95% | 93% | -2pp |
| Proportion on EI | 27% | 28% | 48% | 66% | 49% | 19% | 21% | 24% | 27% | 34% | - | - | 44% | 28% | -16pp |
| EI benefits | $1,209 | $1,528 | $3,316 | $4,428 | $3,967 | $990 | $1,379 | $1,848 | $2,526 | $2,847 | - | - | $2,890 | $2,407 | -$483 |
| Number of weeks on EI | 4wk | 5wk | 9wk | 13wk | 11wk | 3wk | 4wk | 4wk | 6wk | 6wk | - | - | 9wk | 5wk | -4wk |
| Proportion on SA | 35% | 36% | 35% | 44% | 45% | 48% | 46% | 34% | 32% | 33% | - | - | 39% | 33% | -6pp |
| SA benefits | $1,475 | $1,061 | $1,396 | $1,601 | $2,503 | $2,389 | $1,846 | $1,798 | $1,613 | $1,412 | - | - | $1,607 | $1,607 | $0 |
| Dependence on income support | 21% | 17% | 23% | 33% | 35% | 23% | 18% | 18% | 22% | 18% | - | - | 26% | 19% | -7pp |
| Sub-groups of former claimants | ||||||||||||||||||||
|---|---|---|---|---|---|---|---|---|---|---|---|---|---|---|---|---|---|---|---|---|
| Adults (30 years old and over) 2001 to 2007 participants (n=212) | ||||||||||||||||||||
| Earnings including $04 | $15,045 | $16,747 | $17,939 | $16,753 | $11,701 | $10,094 | $14,365 | $18,758 | $21,669 | $22,361 | $23,932 | $25,684 | $15,637 | $22,481 | $6,844 | |||||
| Earnings excluding $05 | $17,240 | $17,931 | $18,921 | $18,214 | $14,256 | $12,299 | $17,013 | $21,380 | $25,380 | $27,088 | $28,147 | $31,188 | $17,312 | $26,637 | $9,325 | |||||
| Proportion employed | 87% | 93% | 95% | 92% | 82% | 82% | 84% | 88% | 85% | 83% | 85% | 86% | 90% | 85% | -5pp | |||||
| Proportion on EI | 21% | 24% | 42% | 52% | 53% | 26% | 16% | 26% | 25% | 34% | 31% | 27% | 38% | 29% | -9pp | |||||
| EI benefits | $959 | $1,244 | $2,085 | $2,612 | $3,612 | $1,075 | $1,033 | $1,525 | $1,564 | $2,512 | $2,121 | $2,025 | $2,102 | $1,949 | -$153 | |||||
| Number of weeks on EI | 3.3wk | 4.5wk | 6.8wk | 8.6wk | 11.8wk | 3.4wk | 2.8wk | 4.4wk | 4.1wk | 6.4wk | 5.6wk | 5wk | 7wk | 5.1wk | -1.9wk | |||||
| Proportion on SA | 30% | 24% | 27% | 30% | 37% | 35% | 31% | 24% | 20% | 25% | 21% | 23% | 30% | 23% | -7pp | |||||
| SA benefits | $1,605 | $1,181 | $1,107 | $1,105 | $1,669 | $1,770 | $1,596 | $1,306 | $1,056 | $968 | $1,132 | $1,068 | $1,333 | $1,106 | -$227 | |||||
| Dependence on income support | 20% | 17% | 19% | 24% | 35% | 23% | 16% | 17% | 14% | 17% | 16% | 15% | 23% | 16% | -7pp | |||||
| Youth (under 30 years old) 2001 to 2007 participants (n=108) | ||||||||||||||||||||
| Earnings including $04 | $8,291 | $10,060 | $13,860 | $13,661 | $9,609 | $10,138 | $15,464 | $21,863 | $23,332 | $27,019 | $28,589 | $27,206 | $11,096 | $25,602 | $14,506 | |||||
| Earnings excluding $05 | $9,256 | $11,344 | $14,398 | $14,472 | $11,040 | $11,288 | $16,701 | $23,612 | $26,807 | $29,776 | $34,050 | $32,796 | $12,102 | $29,408 | $17,306 | |||||
| Proportion employed | 80% | 87% | 95% | 94% | 87% | 90% | 93% | 93% | 87% | 91% | 84% | 86% | 89% | 88% | -1pp | |||||
| Proportion on EI | 13% | 24% | 31% | 55% | 63% | 32% | 20% | 29% | 29% | 30% | 26% | 27% | 37% | 28% | -9pp | |||||
| EI benefits | $289 | $1,034 | $1,314 | $2,480 | $3,721 | $1,614 | $928 | $1,580 | $2,430 | $1,788 | $2,053 | $2,171 | $1,767 | $2,004 | $237 | |||||
| Number of weeks on EI | 1.3wk | 4.5wk | 5wk | 9.4wk | 12.9wk | 5.1wk | 3.2wk | 4.9wk | 7.1wk | 4.9wk | 5wk | 5.3wk | 6.6wk | 5.4wk | -1.2wk | |||||
| Proportion on SA | 28% | 30% | 25% | 34% | 32% | 35% | 37% | 27% | 25% | 21% | 26% | 25% | 30% | 25% | -5pp | |||||
| SA benefits | $1,206 | $989 | $1,020 | $1,205 | $1,368 | $1,366 | $1,332 | $1,600 | $936 | $1,046 | $1,517 | $1,957 | $1,158 | $1,411 | $253 | |||||
| Dependence on income support | 17% | 21% | 19% | 28% | 37% | 29% | 15% | 17% | 21% | 17% | 18% | 19% | 24% | 19% | -5pp | |||||
1Average annual outcome pre-: Represents the average annual outcomes over the pre-participation period
2Average annual outcome post-: Represents the average annual outcomes over the post-participation period
3Change between pre- and post-: Represents the difference between the average annual outcome calculated over the pre-participation period and the average annual outcome calculated over the post-participation period.
4Earnings outcome for all individuals covered by the study.
5Earnings outcomes excluding individuals who reported no earnings in a given year.
pp = percentage points.
Appendix C - Detailed results Training on the Job
| Former | |
|---|---|
| 2001 to 2007 | |
| Number of observations | 100 |
| Gender | |
| Male | 71% |
| Female | 29% |
| Age | |
| Under 25 | 16% |
| 25 to 34 | 48% |
| 35 to 44 | 22% |
| 45 to 54 | 10% |
| 55 and over | 4% |
| Socio-demographic group | |
| Aboriginal individuals* | 69% |
| Person with disability* | 2% |
| Visible minority* | 2% |
| Immigrants | 2% |
| Marital status | |
| Married or common-law | 68% |
| Widow / divorced or separated | 6% |
| Single | 25% |
| Missing data / Unknown | 1% |
| Skills level related to National Occupation Code related to the last EI claim opened before EBSM participation1 | |
| Managerial | 4% |
| University | 5% |
| College or apprenticeship training | 29% |
| Secondary or occupational training | 26% |
| On-the-job training | 36% |
| Key Labour Market indicators in the year preceding the start of participation2 | |
| Earnings including $03 | $16,880 |
| Proportion employed | 94% |
| Proportion on EI | 59% |
| EI benefits collected | $3,088 |
| Proportion on SA | 23% |
| SA benefits collected | $791 |
Proportions may not add up to 100% due to rounding
*Status self-reported by participants.
1Skill level corresponds to the type and/or amount of training or education typically required to work in the last occupation participants had before opening the last EI claim they had before participating in EBSMs. A detailed definition is provided in Table B1.
2Excluding individuals who have no link with CRA taxation information.
3Average earnings for all participants including those who reported $0 earnings during that year.
| Average outcomes | Pre-program period | Program period | Post-program period | Average annual outcomes pre-1 | Average annual outcomes post-2 | Change3 | |||||||||
|---|---|---|---|---|---|---|---|---|---|---|---|---|---|---|---|
| 5 yrs pre | 4 yrs pre | 3 yrs pre | 2 yrs pre | 1 yr pre | Program start year | 1 yr post start year | 1 yr post | 2 yrs post | 3 yrs post | 4 yrs post | 5 yrs post | ||||
| All former claimants | |||||||||||||||
| 2001 to 2007 participants (n= 100) | |||||||||||||||
| Earnings including $04 | $13,712 | $15,533 | $18,007 | $17,387 | $16,880 | $22,778 | $28,125 | $28,174 | $30,245 | $31,752 | $34,224 | $34,143 | $16,304 | $31,708 | $15,404 |
| Earnings excluding $05 | $14,626 | $16,536 | $18,758 | $18,496 | $17,958 | $23,242 | $29,920 | $30,960 | $35,582 | $35,677 | $39,338 | $40,882 | $17,275 | $36,488 | $19,213 |
| Proportion employed | 90% | 93% | 96% | 94% | 94% | 98% | 94% | 91% | 85% | 89% | 87% | 85% | 93% | 87% | -6pp |
| Proportion on EI | 27% | 25% | 39% | 59% | 59% | 44% | 29% | 35% | 28% | 25% | 20% | 20% | 42% | 26% | -16pp |
| EI benefits | $1,110 | $1,019 | $1,850 | $2,298 | $3,088 | $1,558 | $1,411 | $1,998 | $1,535 | $1,166 | $1,201 | $1,134 | $1,873 | $1,407 | -$466 |
| Number of weeks on EI | 4.8wk | 4.3wk | 6.7wk | 8.7wk | 10.1wk | 4.9wk | 4.7wk | 6.1wk | 4.6wk | 3.5wk | 3.5wk | 3.3wk | 6.9wk | 4.2wk | -2.7wk |
| Proportion on SA | 23% | 26% | 19% | 15% | 23% | 16% | 14% | 14% | 13% | 21% | 21% | 13% | 21% | 16% | -5pp |
| SA benefits | $1,002 | $802 | $431 | $564 | $791 | $697 | $683 | $760 | $665 | $1,096 | $1,156 | $970 | $718 | $929 | $211 |
| Dependence on income support | 17% | 15% | 14% | 20% | 24% | 11% | 10% | 13% | 13% | 13% | 12% | 10% | 18% | 12% | -6pp |
1Average annual outcome pre-: Represents the average annual outcomes over the pre-participation period
2Average annual outcome post-: Represents the average annual outcomes over the post-participation period
3Change between pre- and post-: Represents the difference between the average annual outcome calculated over the pre-participation period and the average annual outcome calculated over the post-participation period.
4Earnings outcome for all individuals covered by the study.
5Earnings outcomes excluding individuals who reported no earnings in a given year.
pp = percentage points.
Appendix D - Detailed results Employment Assistance Services
| Active | Former | |||
|---|---|---|---|---|
| 2001 to 2007 | 2006 to 2008 | 2001 to 2007 | 2006 to 2008 | |
| Number of observations | 52 | 42 | 677 | 138 |
| Gender | ||||
| Male | 56% | 64% | 45% | 56% |
| Female | 44% | 36% | 55% | 44% |
| Age | ||||
| Under 25 | 6% | 21% | 9% | 11% |
| 25 to 34 | 33% | 33% | 30% | 33% |
| 35 to 44 | 35% | 29% | 35% | 35% |
| 45 to 54 | 13% | 12% | 18% | 18% |
| 55 and over | 13% | 5% | 7% | 4% |
| Socio-demographic group | ||||
| Aboriginal individuals* | 46% | 76% | 14% | 88% |
| Person with disability* | 2% | 2% | 9% | 0% |
| Visible minority* | 2% | 0% | 1% | 1% |
| Immigrants | 2% | 2% | 1% | 1% |
| Marital status | ||||
| Married or common-law | 65% | 57% | 42% | 46% |
| Widow/divorced or separated | 6% | 5% | 19% | 11% |
| Single | 29% | 38% | 34% | 42% |
| Missing data/Unknown | 0% | 0% | 5% | 1% |
| Skills level related to National Occupation Code related to the last EI claim opened before EBSM participation1 | ||||
| Managerial | 4% | 2% | 5% | 4% |
| University | 8% | 10% | 6% | 4% |
| College or apprenticeship training | 19% | 26% | 20% | 30% |
| Secondary or occupational training | 29% | 24% | 38% | 31% |
| On-the-job training | 40% | 38% | 33% | 31% |
| Key Labour Market indicators in the year preceding the start of participation2 | ||||
| Earnings including $03 | $25,403 | $24,941 | $10,518 | $17,367 |
| Proportion employed | 96% | 95% | 80% | 92% |
| Proportion on EI | 56% | 54% | 34% | 46% |
| EI benefits collected | $2,977 | $2,896 | $1,646 | $3,386 |
| Proportion on SA | 14% | 33% | 25% | 47% |
| SA benefits collected | $589 | $737 | $1,138 | $2,492 |
Proportions may not add up to 100% due to rounding
*Status self-reported by participants.
1Skill level corresponds to the type and/or amount of training or education typically required to work in the last occupation participants had before opening the last EI claim they had before participating in EBSMs. A detailed description can be found in Table B1.
2Excluding individuals who have no link with CRA taxation information.
3Average earnings for all participants including those who reported $0 earnings during that year.
| Average outcomes | Pre-program period | Program start year | Post-program period | Average annual outcomes pre-1 | Average annual outcomes post-2 | Change3 | ||||||||
|---|---|---|---|---|---|---|---|---|---|---|---|---|---|---|
| 5 yrs pre | 4 yrs pre | 3 yrs pre | 2 yrs pre | 1 yr pre | 1 yr post start year | 2 yrs post start year | 3 yrs post start year | 4 yrs post start year | 5 yrs post start year | |||||
| All active claimants | ||||||||||||||
| 2001 to 2007 (n=52) | ||||||||||||||
| Earnings including $04 | $16,852 | $16,745 | $18,949 | $25,535 | $25,403 | $17,180 | $22,776 | $26,920 | $24,452 | $24,153 | $23,871 | $20,697 | $23,225 | $2,528 |
| Earnings excluding $05 | $18,350 | $18,978 | $20,528 | $26,556 | $26,419 | $19,853 | $27,543 | $33,330 | $32,602 | $33,051 | $30,967 | $22,166 | $29,558 | $7,392 |
| Proportion employed | 87% | 87% | 92% | 96% | 96% | 87% | 83% | 81% | 75% | 73% | 79% | 92% | 80% | -12pp |
| Proportion on EI | 39% | 33% | 33% | 25% | 56% | 92% | 46% | 21% | 23% | 19% | 23% | 37% | 38% | 1pp |
| EI benefits | $1,954 | $1,690 | $1,606 | $1,394 | $2,977 | $7,346 | $2,510 | $967 | $1,377 | $1,821 | $1,182 | $1,924 | $2,534 | $610 |
| Number of weeks on EI | 7.6wk | 5.9wk | 5.2wk | 4.6wk | 9.3wk | 21.8wk | 7.1wk | 3.4wk | 3.5wk | 4.9wk | 3.5wk | 6.5wk | 7.4wk | 0.9wk |
| Proportion on SA | 14% | 17% | 17% | 17% | 14% | 12% | 19% | 12% | 15% | 19% | 17% | 16% | 16% | 0pp |
| SA benefits | $637 | $512 | $365 | $419 | $589 | $1,139 | $910 | $513 | $702 | $876 | $1,080 | $505 | $870 | $365 |
| Dependence on income support | 17% | 15% | 12% | 10% | 14% | 42% | 21% | 12% | 15% | 18% | 11% | 14% | 20% | 6pp |
| 2006 to 2008 participants (n=42) | ||||||||||||||
| Earnings including $04 | $16,566 | $16,508 | $17,217 | $22,100 | $24,941 | $19,769 | $24,884 | $29,799 | $32,236 | - | - | $19,466 | $28,973 | $9,507 |
| Earnings excluding $05 | $17,986 | $17,965 | $18,613 | $22,666 | $26,289 | $21,290 | $26,305 | $32,151 | $34,849 | - | - | $20,704 | $31,102 | $10,398 |
| Proportion employed | 92% | 92% | 93% | 98% | 95% | 93% | 95% | 93% | 93% | - | - | 94% | 93% | -1pp |
| Proportion on EI | 24% | 22% | 30% | 28% | 54% | 91% | 51% | 32% | 33% | - | - | 31% | 39% | 8pp |
| EI benefits | $968 | $1,183 | $1,927 | $1,466 | $2,896 | $7,060 | $3,802 | $2,312 | $2,938 | - | - | $1,688 | $3,017 | $1,329 |
| Number of weeks on EI | 3wk | 4wk | 6wk | 4wk | 8wk | 20wk | 10wk | 6wk | 7wk | - | - | 5wk | 8wk | 3wk |
| Proportion on SA | 18% | 16% | 23% | 25% | 33% | 21% | 30% | 24% | 30% | - | - | 23% | 28% | 5pp |
| SA benefits | $255 | $286 | $640 | $713 | $737 | $584 | $811 | $744 | $1,139 | - | - | $526 | $898 | $372 |
| Dependence on income support | 9% | 14% | 19% | 16% | 20% | 36% | 19% | 15% | 17% | - | - | 16% | 17% | 1pp |
1Average annual outcome pre-: Represents the average annual outcomes over the pre-participation period
2Average annual outcome post-: Represents the average annual outcomes over the post-participation period
3Change between pre- and post-: Represents the difference between the average annual outcome calculated over the pre-participation period and the average annual outcome calculated over the post-participation period.
4Earnings outcome for all individuals covered by the study.
5Earnings outcomes excluding individuals who reported no earnings in a given year.
pp = percentage points.
| Average outcomes | Pre-program period | Program start year | Post-program period | Average annual outcomes pre-1 | Average annual outcomes post-2 | Change3 | ||||||||
|---|---|---|---|---|---|---|---|---|---|---|---|---|---|---|
| 5 yrs pre | 4 yrs pre | 3 yrs pre | 2 yrs pre | 1 yr pre | 1 yr post start year | 2 yrs post start year | 3 yrs post start year | 4 yrs post start year | 5 yrs post start year | |||||
| All former claimants | ||||||||||||||
| 2001 to 2007 participants (n=677) | ||||||||||||||
| Earnings including $04 | $13,952 | $15,728 | $15,128 | $13,149 | $10,518 | $9,531 | $12,264 | $13,571 | $14,577 | $15,795 | $16,068 | $13,695 | $13,634 | -$61 |
| Earnings excluding $05 | $16,645 | $17,757 | $16,370 | $15,053 | $13,114 | $12,701 | $15,519 | $17,945 | $20,018 | $21,778 | $23,541 | $15,788 | $18,584 | $2,796 |
| Proportion employed | 80% | 87% | 92% | 87% | 80% | 75% | 79% | 76% | 73% | 73% | 69% | 85% | 74% | -11pp |
| Proportion on EI | 21% | 25% | 50% | 55% | 34% | 12% | 17% | 20% | 19% | 20% | 19% | 37% | 18% | -19pp |
| EI benefits | $834 | $835 | $2,165 | $2,173 | $1,646 | $398 | $603 | $698 | $854 | $916 | $823 | $1,530 | $715 | -$815 |
| Number of weeks on EI | 3.4wk | 3.3wk | 8.2wk | 8.5wk | 6.1wk | 1.4wk | 2.3wk | 2.7wk | 3wk | 3wk | 2.7wk | 5.9wk | 2.5wk | -3.4wk |
| Proportion on SA | 25% | 23% | 21% | 19% | 25% | 30% | 25% | 22% | 20% | 20% | 17% | 23% | 23% | 0pp |
| SA benefits | $1,315 | $1,060 | $744 | $783 | $1,138 | $1,461 | $1,266 | $1,234 | $1,181 | $1,241 | $1,094 | $1,008 | $1,246 | $238 |
| Dependence on income support | 19% | 15% | 22% | 27% | 27% | 21% | 18% | 19% | 19% | 19% | 18% | 22% | 21% | -1% |
| 2006 to 2008 participants (n=138) | ||||||||||||||
| Earnings including $04 | $17,948 | $19,683 | $20,918 | $21,271 | $17,367 | $17,606 | $23,304 | $27,079 | $31,038 | - | - | $19,437 | $27,141 | $7,704 |
| Earnings excluding $05 | $19,135 | $20,446 | $21,552 | $22,791 | $18,907 | $19,788 | $25,372 | $29,110 | $35,087 | - | - | $20,566 | $29,856 | $9,290 |
| Proportion employed | 94% | 96% | 97% | 93% | 92% | 89% | 92% | 93% | 89% | - | - | 95% | 91% | -4pp |
| Proportion on EI | 19% | 23% | 43% | 49% | 46% | 21% | 17% | 23% | 23% | - | - | 36% | 21% | -15pp |
| EI benefits | $858 | $1,496 | $2,800 | $3,281 | $3,386 | $989 | $1,077 | $1,730 | $1,672 | - | - | $2,364 | $1,493 | -$871 |
| Number of weeks on EI | 3wk | 4wk | 9wk | 9wk | 9wk | 3wk | 3wk | 4wk | 4wk | - | - | 7wk | 4wk | -3wk |
| Proportion on SA | 31% | 26% | 32% | 41% | 47% | 50% | 43% | 44% | 37% | - | - | 36% | 41% | 5pp |
| SA benefits | $1,117 | $970 | $1,368 | $1,593 | $2,492 | $2,976 | $2,422 | $2,291 | $1,878 | - | - | $1,508 | $2,197 | $689 |
| Dependence on income support | 16% | 14% | 21% | 28% | 32% | 27% | 20% | 22% | 22% | - | - | 22% | 22% | 0pp |
| Sub-groups of former claimants | ||||||||||||||
| Adults (30 years old and over) 2001 to 2007 participants (n=514) | ||||||||||||||
| Earnings including $04 | $15,643 | $17,406 | $16,598 | $13,901 | $10,521 | $9,046 | $11,824 | $13,210 | $14,020 | $15,178 | $14,993 | $14,814 | $13,045 | -$1,769 |
| Earnings excluding $05 | $18,399 | $19,449 | $17,999 | $16,093 | $13,386 | $12,171 | $15,118 | $18,107 | $20,242 | $21,551 | $22,734 | $17,065 | $18,320 | $1,255 |
| Proportion employed | 85% | 90% | 92% | 86% | 79% | 74% | 78% | 73% | 69% | 70% | 66% | 86% | 72% | -14pp |
| Proportion on EI | 24% | 28% | 54% | 56% | 34% | 13% | 18% | 20% | 18% | 19% | 18% | 39% | 18% | -21pp |
| EI benefits | $917 | $955 | $2,329 | $2,339 | $1,746 | $446 | $672 | $684 | $832 | $800 | $838 | $1,657 | $712 | -$945 |
| Number of weeks on EI | 3.7wk | 3.7wk | 8.7wk | 8.7wk | 6.2wk | 1.5wk | 2.6wk | 2.5wk | 2.8wk | 2.5wk | 2.7wk | 6.2wk | 2.5wk | -3.7wk |
| Proportion on SA | 24% | 22% | 21% | 19% | 24% | 30% | 23% | 21% | 20% | 20% | 17% | 22% | 22% | 0pp |
| SA benefits | $1,279 | $949 | $716 | $742 | $1,125 | $1,465 | $1,196 | $1,126 | $1,186 | $1,188 | $1,028 | $962 | $1,198 | $236 |
| Dependence on income support | 19% | 15% | 22% | 28% | 27% | 22% | 17% | 19% | 19% | 17% | 18% | 22% | 20% | -2pp |
| Youth (Under 30 years old) 2001 to 2007 participants (n=163) | ||||||||||||||
| Earnings including $04 | $7,516 | $10,014 | $10,345 | $10,701 | $10,507 | $11,060 | $13,650 | $14,710 | $16,335 | $17,741 | $19,504 | $9,817 | $15,500 | $5,683 |
| Earnings excluding $05 | $9,483 | $11,722 | $11,119 | $11,824 | $12,321 | $14,308 | $16,729 | $17,502 | $19,435 | $22,417 | $25,790 | $11,294 | $19,363 | $8,069 |
| Proportion employed | 66% | 79% | 90% | 91% | 85% | 77% | 82% | 84% | 84% | 79% | 76% | 82% | 80% | -2pp |
| Proportion on EI | 14% | 17% | 38% | 55% | 33% | 10% | 14% | 20% | 21% | 23% | 20% | 31% | 18% | -13pp |
| EI benefits | $571 | $456 | $1,647 | $1,651 | $1,328 | $246 | $384 | $744 | $922 | $1,283 | $776 | $1,130 | $726 | -$404 |
| Number of weeks on EI | 2.4wk | 2.2wk | 6.5wk | 7.8wk | 5.6wk | 1.1wk | 1.4wk | 3.2wk | 3.5wk | 4.4wk | 2.7wk | 4.9wk | 2.7wk | -2.2wk |
| Proportion on SA | 26% | 25% | 20% | 20% | 30% | 29% | 31% | 25% | 21% | 22% | 19% | 24% | 25% | 1pp |
| SA benefits | $1,426 | $1,409 | $833 | $914 | $1,180 | $1,447 | $1,486 | $1,576 | $1,167 | $1,407 | $1,302 | $1,152 | $1,398 | $246 |
| Dependence on income support | 19% | 17% | 20% | 25% | 25% | 19% | 18% | 21% | 19% | 24% | 18% | 21% | 21% | 0pp |
1Average annual outcome pre-: Represents the average annual outcomes over the pre-participation period
2Average annual outcome post-: Represents the average annual outcomes over the post-participation period
3Change between pre- and post-: Represents the difference between the average annual outcome calculated over the pre-participation period and the average annual outcome calculated over the post-participation period.
4Earnings outcome for all individuals covered by the study.
5Earnings outcomes excluding individuals who reported no earnings in a given year.
pp = percentage points.
Appendix E - List of five studies included in this synthesis report
| Study | Evidence included in this summary report | Methods | Reference period | Observation period |
|---|---|---|---|---|
| Profile, outcomes and Net Impacts of EBSM participants in Nunavut (Completed 2014) | Labour market outcomes of participants. Profile and socio-demographic characteristics of participants. | Statistical analysis and profiling | 2001 to 2007 participants | 7 years between 2001 and 2011 (that is, 2 years in program and 5 years post-program) |
| Analysis of EBSM profile and Outcomes for 2006 to 2008 participants in Nunavut (Completed in 2015) | 2006 to 2008 participants | 5 years between 2006 and 2012 (that is, 2 years in-program and 3 years post-program) | ||
| Study on the Adult Learning and Training Supports (ALTS) Program in Nunavut (Completed in 2016) | Program design and delivery Challenges and lessons learned |
|
Design and delivery at the time of the data collection (that is., 2015) | |
| Study of the Training on the Job program (Completed in 2016) |
|
|||
| Study on the Adult Learning and Training Supports (ALTS) for Apprentices in Nunavut (Completed in 2016) |
|
|||