
Evaluation of the Canada – Ontario Labour Market Development Agreement
From: Employment and Social Development Canada
On this page
- Executive summary
- Management response
- 1. Introduction
- 1.1 Labour Market Development Agreement background
- 1.2 Methodology
- 1.3 Overview of the studies summarized in this report
- 2. Evaluation findings
- 2.1 Rationale and Labour Market context
- 2.2 Skills Development
- 2.3 Skills Development-Apprentices
- 2.4 Targeted Wage Subsidies (Job Placement with Incentive)
- 2.5 Self-Employment
- 2.6 Job Creation Partnerships
- 2.7 Employment Assistance Services
- 3. Comparison of key findings by program type
- 4. Conclusions
- 5. Recommendations
- References
- Acronyms
- Appendix A - Methodology
- Appendix B - Detailed results Skills Development
- Appendix C - Detailed results Skills Development-Apprenticeship
- Appendix D - Detailed resultsTargeted Wage Subsidies
- Appendix E - Detailed results Self-Employment Benefit
- Appendix F - Detailed results Job Creation Partnerships
- Appendix G - Detailed results Employment Assistance Services
- Appendix H - List of eight studies included in the synthesis report
Alternate formats

Evaluation of the Canada – Ontario Labour Market Development Agreement Synthesis Report [PDF - 1.15 MB]
Large print, braille, MP3 (audio), e-text and DAISY formats are available on demand by ordering online or calling 1 800 O-Canada (1-800-622-6232). If you use a teletypewriter (TTY), call 1-800-926-9105.
Executive summary
Introduction
Employment and Social Development Canada (ESDC) worked jointly with Ontario and 11 other Provinces and Territories (P/Ts) to undertake the 2012 to 2017 second cycle for the Labour Market Development Agreement (LMDA) evaluation. The first cycle of LMDA evaluation was carried out between 1998 and 2012 and involved the conduct of bilateral formative and summative evaluations in all P/Ts. Under the second cycle, the evaluation work consisted of conducting two to three studies per year on the Employment Benefits and Support Measures (EBSMs) similar programming delivered under these agreements. The studies generated evaluation evidence on the effectiveness, efficiency and design/delivery of EBSMs for Canada overall, for Ontario and for the 11 other P/Ts that opted for a joint evaluation process with Canada.
Under LMDAs, Canada transfers $2.14B annually in Employment Insurance (EI) Part II funds to P/Ts for the design and delivery of programs and services to help unemployed individuals, mainly those eligible under EI, to find and maintain employment.
Programs and services delivered by Ontario correspond to the EBSM categories defined under the EI Act. The following is a short description the programs and services examined in the evaluationFootnote 1 :
- Skills Development (Second Career) helps participants obtain employment skills by giving them financial assistance in order to attend classroom training
- Skills Development- Apprentices program provides financial assistance to EI eligible individuals who are attending full-time apprenticeship training in a classroom setting
- Targeted Wage Subsidies (Job Placement with Incentive) help participants obtain on-the-job work experience by providing employers with a wage subsidy
- Self-Employment (Ontario Self-Employment Benefits) provides financial assistance and business planning advice to participants to help them start their own business
- Job Creation Partnerships (Ontario Job Creation Partnerships) provide participants with opportunities to gain work experience that will lead to ongoing employment. Employment opportunities are provided by projects that contribute to developing the community and the local economy
- Employment Assistance Services (Employment Services) such as counselling, job search skills, job placement services, the provision of labour market information and case management
Three additional programs and services are available under the LMDA and they are: Labour Market Partnerships, Research and Innovation and Targeted Earnings Supplements. They were not evaluated as part of this evaluation. The Targeted Earnings Supplements program is used in one province only while Labour Market Partnerships, and Research and Innovation will be evaluated at a later stage.
Table i provides an overview of the share of funding allocated to the five EBSMs examined under the second cycle for LMDA evaluation and the average cost per participant.
| Program and service | Share of funding 2014 to 2015 | Average cost per participant2002 to 2005 |
|---|---|---|
| Employment Assistance Services | 51% | $840 |
| Skills Development, including apprentices | 34% | $8,686 |
| Self-Employment Benefits | 8% | $17,594 |
| Job Creation Partnerships | 1.3% | $16,940 |
| Targeted Wage Subsidies | 0.6% | $10,372 |
| Labour Market Partnerships | 2.4% | n/a |
| Research and Innovation | 2.7% | n/a |
| Total | 100% | n/a |
Sources: EI Monitoring and Assessment Reports 2002-2003 to 2014-2015.
Note: The average cost per participant was calculated based on the Action Plan Equivalent for active claimant participants.
This report presents a summary of the findings from eight studies produced on Ontario LMDA interventions and participants. Results were produced for active and former EI claimants as well as for long-tenured workersFootnote 2, youth (under 30 years old) and older workers (over 55 years old) when the number of participants was sufficient to conduct quantitative analyses. Active EI claimants were actively on EI at the time of their EBSM participation. Former EI claimants received EI up to three years before staring their EBSM participation.
Key findings
Effectiveness and efficiency of EBSMs
Incremental impacts and cost-benefit analyses addressed EBSM effectiveness and efficiency.
Overall, incremental impacts demonstrate that LMDA programs and services are improving the labour market attachment of active and former EI claimant participants, including youth and older workers. As well, social benefits of participation exceeded the cost of investments for most interventions over time. Finally, providing Employment Assistance Services interventions earlier during an EI claim (first four weeks) produced larger impacts on earnings and employment and facilitated earlier return to work. This demonstrates the importance of targeting early participation of EI active claimants.
Figure i presents the incremental impacts on the incidence of employment for active and former claimants by type of program. The estimates can be interpreted as a change in the probability of being employed following participation. For example, participation in the Skills Development program delivered in the 2002 to 2005 period increases the probability of being employed by 4.4 percentage points for active EI claimants relative to unemployed non- participants.

Text description of Figure i
| Percentage Points | ||
|---|---|---|
| Active Claimants | Former Claimants | |
| Skills Development | 4.4 | 2.6 |
| Targeted Wage Subsidies | 7.2 | 5.7 |
| Job Creation Partnership | 6.4 | 4 |
| Employment Assistance Services | 1.6 | |
Note: The estimates in Figure i represent an arithmetic average of the annual incidence of employment estimates reported in the annexes. All estimates are statistically significant at the 95% confidence level. Results for Skills Development exclude apprentices.
Figure ii presents the cumulative increase in employment earnings for active and former claimants over the 5 years post-participation. It is noted that Employment Assistance Services are relatively modest activities and, by themselves, are not expected to lead to substantial effects on labour market outcomes. In other words, these services aim to support the return to work of unemployed participants and not necessarily to secure a better paying job than pre-participation. However, as demonstrated later in the report, providing Employment Assistance Services earlier during the EI claim (first 4 weeks) produced larger impacts on earnings and employment and facilitated earlier returns to work.

Text description of Figure ii
| Cumulative Gains in Earnings | ||
|---|---|---|
| Active Claimants | Former Claimants | |
| Skills Development | 13026 | 5456 |
| Targeted Wage Subsidies | 17239 | 14210 |
| Job Creation Partnership | 18235 | 8817 |
| Employment Assistance Services | 714* | |
* The estimate is not statistically significant at the 95% confidence level.
Table ii presents the number of years required for the social benefits to exceed program cost. Social benefits to participation exceeded investment costs in a period ranging between the 2nd year of program participation to about 20 years after participation.
| Skills Development | Targeted Wage Subsidies | Job Creation Partnerships | Employment Assistance Services | |
|---|---|---|---|---|
| Active claimants | 7.8 | 3.9 | 8.4 | 9.3 |
| Former claimants | 14.3 | 2 | 19.9 | n/a |
Main challenges about program design and delivery
Key informant interviews with service providers and program managers as well as the documents reviewed and the questionnaires filled by provincial representatives also revealed specific challenges and lessons learned about program design and delivery. Key challenges are highlighted below.
Skills Development program (currently delivered as Second Career)
Key informants identified the following challenges related to the design and delivery of the current Skills Development program (Second Career in Ontario):
- The perceived insufficient level of financial support (7 key informants).
- Participants with multiple barriers have more complex needs and often require additional time for assistance (3 key informants).
Skills Development – Apprentices
As presented in the report, existing Canadian literature showed that there is a fairly high non-completion rate among apprentices in Canada. Furthermore, literature revealed that despite the growth in apprenticeship registrations in Canada, there has not been a corresponding increase in completions. While program data does not provide reliable information on completion and non-completion rates of participants, key informants from Ontario overall agreed with the challenges identified in the literature and confirmed a high dropout rate. They provided the following reasons to explain why some participants drop out of the apprenticeship process:
- Financial barriers (5 key informants)
- Timing and location of training (3 key informants)
- Apprentices are often working for the same pay as journeymen and they are not motivated to write the final exam (3 key informants)
- Lack of ongoing case-management for apprentices (2 key informants)
To deal with these barriers, key informants identified the following supports to help apprentices access and complete their apprenticeship training:
- Pre-apprenticeship training would be beneficial to helping apprentices complete their training and increase the probability of success. The integration of Literacy and Basics Skills and employability skills (job retention, leadership skills, document use, conflict resolution, goal setting, etc.) components in pre-apprenticeship training are key components to ensuring success, especially for persons with multiple barriers (4 key informants).
- Providing handouts to apprentices with detailed information on the available supports and where to get help when needed (3 key informants).
- Increase awareness of the financial supports that are available for apprentices (3 key informants).
- Case managing apprentices for the full duration of the apprenticeship process would be beneficial to increasing the probability of completion (2 key informants).
Key informants were asked about challenges in relation to the design and delivery of the program or apprenticeship training in general and they identified the following challenges:
- Lack of awareness about the financial support available to apprentices (3 key informants).
- The amount of paperwork required when seeking financial support (3 key informants).
- Delays in confirming EI eligibility (3 key informants).
Employment Services
Key informants interviewed identified the following challenges they face with the provision and targeting of Employment Services:
- Challenges in accessing childcare and paying the cost of transportation to training (5 key informants).
- Data collection is challenging for some service providers (5 key informants).
- Lack of funds dedicated for the professional development of staff (4 key informants).
- Insufficient staff capacity can require the use of referrals, prevent the provision of job retention services, result in a waiting list, limit pre-employment services and also limit services to clients with multiple barriers (3 key informants).
Recommendations
Recommendations that emerged from the evaluation findings presented in this report are as followed:
Key informants reported that a lack of essential skills hinders participants from completing training. The relevance of providing literacy, essential skills and high school upgrading is well documented in the Canadian literature. Because these interventions have different objectives and may lead to very different labour market outcomes when compared to vocational or occupational training, reporting them separately is important.
Recommendation 1: It is recommended that these interventions be reported separately under the LMDA from other vocational or occupational training interventions given their unique objectives. Ontario, ESDC and other P/Ts should work together to define common categories Skills Development programming.
Overall, the LMDA evaluation was able to produce a sound assessment of EBSM effectiveness and efficiency because the team had access to rich data on EI claimants, EBSM participation data and Canada Revenue Agency taxation files. However, some data gaps limited the evaluation’s ability to assess how EBSMs operate. For example:
Having access to data on whether participants are members of designated groups including Indigenous peoples, persons with disabilities and recent immigrants would be useful to inform policy development and program design.
Little is also known about the various types of Employment Assistance Services provided under the LMDAs. These services can be very different in nature and it is possible that some may be more effective than others at helping participants to return to employment. For example, having access to a computer for researching jobs on its own may yield different impacts than receiving counselling and assistance to develop a return-to-work action plan.
Recommendation 2: Improvements in the data collection are recommended to address key program and policy questions of interest to the federal and provincial/territorial governments. Specifically:
- Collect data on whether participants are members of designated groups including Indigenous peoples, persons with disabilities and recent immigrants
- Collect data on the various types of services provided under Employment Assistance Services. Ontario, ESDC and other P/Ts should work together to define common categories for these services
- Collect detailed data on the cost of EBSM interventions
The study on the timing of Employment Assistance Services participation showed that receiving assistance early after starting an EI claim can lead to better labour market impacts. However, key informants reported insufficient level of funding to promote the program.
Recommendation 3: Consideration should be given to providing Ontario with timely access to data on new EI recipients for supporting targeting and increasing awareness.
The Job Creation Partnerships program was found to be particularly effective at improving the labour market attachment for active and former EI claimant participants. The evaluation has not yet examined the challenges and lessons learned regarding the design and delivery of this program. Therefore, a lot remains unknown about how this program operates and the factors that contribute to its effectiveness.
Recommendation 4: Consideration should be given to examine the design and delivery of Ontario Job Creation Partnerships in order to better understand how this program operates.
The Targeted Wage Subsidy program was found to be effective at improving the labour market attachment of active and former claimant participants. In Ontario, the number of participants in the program declined between 2003 and 2004 (n = 3,484), 2014 to 2015 (n = 1,806) and 2015 to 2016 (n = 2,677).
Recommendation 5: depending on ongoing labour market priorities and budget allocation across EBSM programs and services, Ontario may wish to explore to what extent challenges and lessons learned identified at the national level are applicable to the unique context in Ontario and if applicable, to explore ways of removing barriers to employer participation in the program.
Management response
Introduction
Ontario worked in close collaboration with the Evaluation Directorate of ESDC during the planning and implementation of the second cycle for the LMDA evaluation. Ontario would like to thank all members of the Evaluation Steering Committee for their dedication and commitment to the success of this evaluation process. These findings are an important source of advice as governments work together to renew the labour market transfer agreements.
Ontario reviewed the findings of the second cycle Evaluation of the Canada-Ontario LMDA, which concluded that:
- Overall, incremental impacts demonstrate that LMDA programs and services are improving the labour market attachment of active and former EI claimant participants, including youth and older workers
- As well, social benefits of participation exceeded the cost of investments for most interventions over time
- Finally, providing Employment Assistance Services interventions earlier during an EI claim (first four weeks) produced larger impacts on earnings and employment and facilitated earlier return to work. This demonstrates the importance of targeting early participation of EI active claimants
As part of the review, Ontario would also like to highlight that qualitative findings from the evaluation (for example, the key informant interviews with the service providers and the program managers) are an important source of information that allow the ministry to understand the depth of issues and benefits related to the program. The limitation is that these qualitative findings are the perception of a small number of key informants and cannot be generalized to the entire province.
Ontario is interested in continuing to build on the positive experience of LMDA cycle II evaluation for the development of the Evaluation Strategy for the new Labour Market Transfer Agreements (LMTAs). The following two practices that were particularly helpful for Ontario that should be maintained are for:
- P/Ts to continue to have an active role in the governance, design and implementation of evaluations to ensure that P/T’s evaluation needs and perspectives are reflected in the evaluation design; and
- ESDC to ensure that the purpose of the evaluations, relevance of selected streams, timing of evaluation and use of evaluation findings are well coordinated to meet the needs of individual P/Ts.
Based on the lessons learned from LMDA cycle II evaluation, Ontario would also like to propose that more mixed methods be used (qualitative and quantitative) in the evaluations to contextually inform the quantitative findings.
Detailed management response
Ontario agrees in principle with the evaluation recommendations and is pleased to submit this management response.
Key informants reported that a lack of essential skills hinders participants from completing training. As well, the relevance of providing literacy, essential skills and high school upgrading is well documented in the Canadian literature these interventions have different objectives and may lead to very different labour market outcomes when compared to vocational or occupational training.
Recommendation 1: It is recommended that these interventions be reported separately under the LMDA from other vocational or occupational training interventions given their unique objectives. Ontario, ESDC and other P/Ts should work together to define common categories for Skills Development programming.
Response: According to the results of Programme for the International Assessment of Adult Competencies (2013), almost half of the Ontario population has low level skills (below Level 3).
In recognition of this, in Budget 2017, the government announced the Ontario Lifelong Learning and Skills Plan, which includes investment in and enhancements to the adult education and essential skills system. Foundational to the plan is the objective to support Ontario’s adults to find their place in an evolving economy that is becoming more technology‐driven and knowledge‐based every day. The investment in Ontario lifelong learning and skills recognizes that strengthened essential skills can open doors — to advancement in the workplace, new opportunities, or enrolment in an education that will help individuals launch into their next career. It also recognizes the importance of essential skills in all facets of adults’ lives. In addition to supporting more adult Ontarians to access programs to improve their literacy and other essential skills, the plan is about working with partners to strengthen the adult education system to better support learners to access programs that match their individual needs, transition between programming, and receive recognition for their prior learning and skills.
The improvement and expansion of the Literacy and Basic Skills program will continue to support the transition of adult learners to their goals of further education, training, employment and independence through learner-centered design; strengthen the connections to Employment Ontario programs, Ministry of Citizenship and Immigration and Ministry of Education to support adult learner pathways; and, revitalize ministry-stakeholder bonds for improved performance management and program accountability as well as learner outcomes.
Ontario is pleased that changes to the LMDA eligibility criteria will make it easier to fund essential skills programming under the agreement.
As part of ongoing Federal/Provincial-Territorial development of the performance measurement strategy under new generation of LMTAs, Ontario worked with ESDC and other P/Ts to define common categories for Skills Development programming that will allow separate tracking and reporting of interventions, including literacy and essentials skills interventions.
Overall, the LMDA evaluation was able to produce a sound assessment of EBSM effectiveness and efficiency because the team had access to rich data on EI claimants, EBSM participation data and Canada Revenue Agency taxation files. However, some data gaps limited the evaluation’s ability to assess how EBSMs operate. For example:
- Having access to data on whether participants are members of designated groups including Indigenous peoples, persons with disabilities and recent immigrants would be useful to inform policy development and program design.
- Little is also known about the various types of Employment Assistance Services provided under the LMDAs. These services can be very different in nature and it is possible that some may be more effective than others at helping participants to return to employment. For example, having access to a computer for researching jobs on its own may yield different impacts than receiving counselling and assistance to develop a return-to-work action plan.
Recommendation 2: Improvements in the data collection is recommended to address key program and policy questions of interest to the federal and provincial/territorial governments. Specifically:
- Collect data on whether participants are members of designated groups including Indigenous peoples, persons with disabilities and recent immigrants
- Collect data on the various types of services provided under Employment Assistance Services. Ontario, ESDC and other P/Ts should work together to define common categories for these services
- Collect detailed data on the cost of EBSM interventions
Response: Ontario worked actively with Federal/Provincial-Territorial counterparts to develop a performance measurement strategy for the new generation of LMTAs. Recommendations to enhance data collection on designated groups and types of Employment Assistance Services are being addressed through this strategy.
The study on the timing of Employment Assistance Services participation showed that receiving assistance early after starting an EI claim can lead to better labour market impacts. However, key informants reported insufficient level of funding to promote the program.
Recommendation 3: Consideration should be given to providing Ontario with timely access to data on new EI recipients for supporting targeting and increasing awareness.
Response: Ontario agrees that timely access to data on new EI recipients for supporting targeting and increasing awareness is important. As per the 2017 LMDA amending agreement currently being negotiated between Ontario and Canada, Ontario intends to implement the Targeting, Referral and Feedback system by 2020.
The Job Creation Partnerships program was found to be particularly effective at improving the labour market attachment for active and former EI claimant participants. The evaluation has not yet examined the challenges and lessons learned regarding the design and delivery of this program. Therefore, a lot remains unknown about how this program operates and the factors that contribute to its effectiveness.
Recommendation 4: Consideration should be given to examine the design and delivery of Ontario Job Creation Partnerships in order to better understand how this program operates.
Response: Ontario is pleased that the report’s findings demonstrate that Ontario Job Creation Partnerships program is particularly effective at improving the labour market attachment for active and former EI claimant participants. Ontario is committed to reviewing and continuously improving client outcomes and ensuring program alignment with current and future labour market demands. In response to recent Ontario Auditor General recommendations, the Ministry of Advanced Education and Skills Development is in the process of developing and implementing new outcome measures for the program. As part of the review of the Performance Management Framework for the Employment Services, the ministry will enhance follow-up with more participants in order to effectively measure, analyze and improve client outcomes. The changes being explored include:
- improving consistency of follow-up requirements across employment and training programs;
- examining roles, responsibilities and accountabilities with respect to participant follow-up; and
- establishing consistent and common definitions for employment status categories across all programs.
Ongoing system-wide improvements, along with regular monitoring of program delivery, will provide increased information on the design and delivery of the Ontario Job Creation Partnerships program in order to ensure the program guidelines are achieving sustainable and long-term employment outcomes for clients. The ministry commits to publish outcome data as part of the government’s commitment to open data as they become available.
The Targeted Wage Subsidy program was found to be effective at improving the labour market attachment of active and former claimant participants. In Ontario, the number of participants in the program declined between 2003 and 2004 (n = 3,484), 2014 to 2015 (n = 1,806) and 2015 to 2016 (n = 2,677).
Recommendation 5: depending on ongoing labour market priorities and budget allocation across EBSM programs and services, Ontario may wish to explore to what extent challenges and lessons learned identified at the national level are applicable to the unique context in Ontario and if applicable, to explore ways of removing barriers to employer participation in the program.
Response: Ontario agrees with the recommendation that exploring the benefits of wage subsidies for the Ontario population is warranted. While research has generally been supportive, evidence on the efficacy of wage subsidies is mixed, particularly as it relates to different target client groups and different policy objectives (for example, building work experience for jobseekers at the beginning of their career paths, versus achieving sustainable employment). In addition to considering challenges and lessons learned from other provinces and territories, Ontario has the opportunity to explore the effects of wage subsidies through the research funded with the Ontario Human Capital Research and Innovation Fund to examine the efficacy of wage subsidies in serving persons with disabilities.
In the meantime, service providers continue to have access to funding to assist with job placements with incentives for jobseekers and employers who require additional support.
1. Introduction
Employment and Social Development Canada (ESDC) worked jointly with Ontario and 11 other Provinces and Territories (P/Ts) to undertake the 2012 to 2017 second cycle for the Labour Market Development Agreement (LMDA) evaluations. The first cycle of LMDA evaluation was carried out between 1998 and 2012 and involved the conduct of bilateral formative and summative evaluations in all P/Ts. Under the second cycle, the evaluation work consisted of conducting two to three studies per year on the Employment Benefits and Support Measures (EBSMs) similar programming delivered under these agreements. The studies aimed to generate evaluation evidence on the effectiveness, efficiency and design/delivery of programs and services for Canada, Ontario and for the 11 other P/Ts that opted for a joint evaluation process with the Government of Canada.
This report presents a summary of the findings from the studies conducted for Ontario. The report is organised as follows:
- Introduction with an overview of the studies summarized in this report including their scope, methodology, and contextual information on the LMDAs
- Findings section with a discussion around the rationale for investing in labour market programming and a summary of evaluation evidence
- Comparison of key findings by program type
- Conclusions
- Recommendations that emerge from the evaluation findings and areas for future investigation
1.1 Labour Market Development Agreement background
LMDAs are bilateral agreements between Canada and each P/T, and were established under Part II of the 1996 Employment Insurance (EI) Act. As part of these agreements, Canada transfers $2.14B annually in EI part II funding to P/Ts in order to design and deliver programs and services to assist individuals to prepare for, obtain and maintain employment. Ontario receives approximately $525M annually in EBSM funding.
The Canada-Ontario LMDA was signed on November 23, 2005. The agreement transferred responsibility to Ontario for the design and delivery of programs and servicesFootnote 3 classified under two categories: 1) Employment Benefits and 2) Support Measures.
Employment Benefits
Employment Benefits are offered to unemployed individuals who 1) are actively on EI (active claimants); 2) ended their benefit period within three years before participating (former claimants); or 3) established a claim for maternity or parental benefits within the past five years and are returning to the labour force for the first time (former claimants)Footnote 4. Employment Benefits include the following categories:
- Skills Development (Second Career) helps participants obtain employment skills by giving them financial assistance that enables them to select, arrange and pay for classroom training
- Skills Development- Apprentices program provides financial assistance to EI eligible individuals who are attending full-time apprenticeship training in a classroom setting
- Targeted Wage Subsidies (Job Placement with Incentive) help participants obtain on-the-job work experience by providing employers with financial assistance to help with the wages of participants
- Self-Employment (Ontario Self-Employment Benefits) provides financial assistance and business planning advice to EI-eligible participants to help them start their own business. This financial assistance is intended to cover personal living expenses and other expenses during the initial stages of the business
- Job Creation Partnerships (Ontario Job Creation Partnerships) provide participants with opportunities to gain work experience that will lead to ongoing employment. Employment opportunities are provided by projects that contribute to developing the community and the local economy
- Targeted Earnings Supplements encourage unemployed persons to accept employment by offering them financial incentives. This program was not covered by the evaluation given the fact that it was delivered in one province only
Support measures
Support Measures are available to all unemployed individuals including those not eligible to receive EI and include:
- Employment Assistance Services (Employment Services) such as individual counselling, action planning, help with job search skills, job-finding clubs, job placement services, the provision of Labour Market Information (LMI), and case management and follow-up
- Labour Market Partnerships provide funding to help employers, employee and employer associations, and communities improve their capacity to deal with human resource requirements and implement labour force adjustments. These partnerships involve developing plans and strategies, and implementing labour force adjustment measures. This support measure was not covered by the evaluation
- Research and Innovation supports activities that identify better ways of helping people prepare for or keep employment and be productive participants in the labour force. Funds are provided to eligible recipients to enable them to carry out demonstration projects and research for this purpose. This support measure was not covered by the evaluation
Table 1 provides an overview of the share of funding allocated to the five programs and services examined under the second cycle for LMDA evaluation and the average cost per participant. It is noted that the average cost per participant was calculated based on the 2002 to 2005 data from the EI Monitoring and Assessment Reports. The 2002 to 2005 period corresponds to the cohort of participants selected for incremental impacts and cost-benefit analysis in the LMDA evaluation.
| Program and service | Share of funding 2014 to 2015 | Average cost per participant 2002 to 2005* |
|---|---|---|
| Employment Assistance Services | 51% | $840 |
| Skills Development, including apprentices | 34% | $8,686 |
| Self-Employment Benefits | 8% | $17,594 |
| Job Creation Partnerships | 1.3% | $16,940 |
| Targeted Wage Subsidies | 0.6% | $10,372 |
| Labour Market Partnerships | 2.4% | n/a |
| Research and Innovation | 2.7% | n/a |
| Total | 100% | n/a |
*The average cost per participant was calculated based on the Action Plan Equivalent for active claimant participants. The Action Plan Equivalent regroups all interventions taken by participants in the 2002 to 2005 period.
Sources: EI Monitoring and Assessment Reports 2002 to 2003 to 2014 to 2015.
1.2 Methodology
This section presents key aspects of the quantitative analyses carried out as part of the LMDA studies, while a more detailed description of the methodology is provided in Appendix A.
All quantitative analyses were based on administrative data from the EI part I (EI claim data) and Part II (EBSM participation data collected by Ontario and transferred to ESDC) databanks, linked to the T1 and T4 taxation files from the Canada Revenue Agency. Incremental impact analyses and the cost-benefit analyses were based on up to 100% of participants in the reference period selectedFootnote 5.
Incremental impacts analysis
Four studies assessed program effectiveness by estimating incremental impacts from EBSM participation on participants’ labour market experience (for example, earnings from employment/self-employment, incidence of employment, use of EI or Social Assistance (SA) and dependence on income support) after participation. The role of the incremental impact analysis is to isolate the effects of participation from other factors such as the economic cycle. In order to achieve this, the incremental impact analyses compared the labour market experience of participants before and after their participation with that of non-participants (see the example of incremental impact calculation in Figure 1).
The matching of participants and comparison group members used up to 75 socio-demographic and labour market variables observed over five years before participation. Two different comparison groups were used to measure impacts for active and former EI claimants. For active claimants, the incremental impacts were measured relative to a comparison group of active claimants who were eligible to, but did not, participate in EBSMs during the reference period.
Former claimants can be underemployed and unable to requalify for EI, out of the labour force for various reasons or on social assistance. Based on previous evaluation methodologies, on expert advice and given the difficulty in generating a suitable comparison for former claimants using administrative data alone, the comparison group for former claimants was created using individuals who participated in Employment Services only during the reference period. This is a conservative approach given the fact that participation in Employment Assistance Services can lead to limited effects on labour market outcomes. In other words, the experience of former claimants who received Employment Benefits (that is, Skills Development, Targeted Wage Subsidies, Self-employment Benefits and Job Creation Partnerships) was compared to the experience of former claimants who received low intensity employment services (that is, Employment Assistance Services only). Due to this difference in measurement, incremental impacts estimated for active claimant participants should not be directly compared to those of former claimant participants .

Text description of Figure 1
Presents an example of the approach used to estimate the incremental impacts on earnings.
Program efficiency was assessed through a cost-benefit analysis which compared the cost of participating in the program for the participants and the cost of delivering the program for the government to the benefits generated by the program. Overall, this analyses provided insights on the extent to which the program is efficient for the society (in other words, for both the participants and the government). The costs and benefits accounted for in the calculations were as follows (see detailed definitions in Appendix A):
- Program cost: includes program and administration costs paid by the government
- Marginal social costs of public funds: represent the loss incurred by society when raising additional revenues such as taxes to fund government programs
- Employment earnings: consists of incremental impacts on participants’ earnings during and after participation. The calculation accounts for the participant’s forgone earnings during participation (in other words, opportunity cost). Employment earnings were also increased by 15% to account for fringe benefits such as the employer-paid health, life insurance and pensions contributions
Strengths and limitations of the studies
One of the key strengths from the studies is that all quantitative analyses were based on administrative data rather than survey responses. Compared to survey data, administrative data are not subject to recall errors or response bias.
The propensity score models used to match participants and non-participants for the incremental impact analyses are judged to be robust in part because they were based on five years of pre-participation data and on a vast array of variables including socio-demographic characteristics, location, skills level related to last occupation and indicators of labour market attachment. Sensitivity analysis and the use of alternative estimation methods have increased confidence in the incremental impact estimates. However, one limitation with the propensity score matching techniques is that no one can be fully sure the impacts were not influenced by factors not captured in the data.
It should also be noted that it is not possible to produce an analysis of the incremental impacts of Skills Development-Apprentices participation. Assessing these impacts poses a methodological challenge because program participants are already employed and are expected to return to their employment after completing their training. Therefore, expected labour market impacts cannot be examined using a similar approach as for other EBSMs, which are expected to help participants return to employment. As well, the data available does not permit the identification of a proper comparison group since program participants alternate between work and training and no other potential counterfactuals have similar employment and training patterns. In this context, it is possible to provide an analysis of labour market outcomes associated with program participants but not possible to produce estimates of program effectiveness. While outcomes can provide some insights about the labour market experience of participants before and after participation, it is not possible to attribute the change observed in the outcomes to program participation. For example, a change in average annual earnings from before to after participation could be due to program participation or to other factors such as the maturation effect of youth, the economic cycle, lay off, etc.
When interpreting qualitative findings, readers should keep in mind that these are based on the perception of a small number of key informants (ranging between 7 and 16) who are directly involved in the design or delivery of the program. Their perception may be representative of their own region or community but not necessarily of the entire province.
1.3 Overview of the studies summarized in this report
Findings presented in this report were drawn from eight separate studies carried out on Ontario LMDA interventions and participants. These studies examined issues related to program effectiveness, efficiency, design/delivery and used a mix of qualitative and quantitative methods. Each study examined evaluation issues in relation to active and former EI claimants.
Table H1 in Appendix H presents an overview of these studies, including the type of evidence generated, the methods used, the reference period and the length of the post-program period over which program effects were observed.
2. Evaluation findings
2.1 Rationale and labour market context
Active labour market programs aim to help unemployed or underemployed individuals find and maintain employment. These programs are fairly similar across the Organization for Economic Co-operation and Development countries and consist of skills training in a classroom setting, work experience with employers (often subsidized) or in the public/non-profit sector, return-to-employment assistance and self-employment assistance. In Ontario, the Ministry of Advanced Education and Skills Development (formerly the Ministry of Training, Colleges and Universities) administers a range of active labour market programming targeted at various groups of individuals including EI claimants and social assistance recipients. Employment Services and Job Placement with Incentive are delivered by third party service providers while the Second Career program is delivered by third party service providers and the Ministry. As of 2016, the Ontario Self-Employment Benefit program is no longer offered in Ontario. Programs and services offered to active and former EI claimants are mainly funded under the LMDA.
The 2016 to 2017 plan for Ontario’s Ministry of Advanced Education and Skills Development has the following priorities related to EBSMs:
- Continue delivery of quality employment and training, apprenticeship, literacy and labour market programs
- Continue support directed at employers, apprentices and training institutions to promote access to and completion of apprenticeships – including enhanced support for special apprenticeship programs
- Ensure the employment and training system connects job seekers with employers and helps Ontarians find the jobs that are right for them
- Introduce a new, more consistent approach to assessing clients’ unique barriers to employment and tracking clients’ journeys through the system
- Make changes to the Second Career program that will ensure support for all eligible clients while enabling the government to invest in other key employment programsFootnote 6
Overall, impacts found in the LMDA evaluation and discussed in this report demonstrated that LMDA funded programs and services delivered in Ontario are generally helping participants to improve their labour market experience after participation. As such, evaluation evidence suggests that LMDA funded programming contributing to meet the key labour market priorities of the Ministry of Advanced Education and Skills.
2.2 Skills Development
2.2.1 Program description
Based on a document review and 8 key informant interviews completed in summer 2015
During the 2002 to 2005 period, the federal government was delivering the Skills Development program in Ontario. In January 2007, Ontario assumed responsibility for the LMDA design and delivery, including the Ontario Skills Development Program. Ontario’s Skills Development program is called Second Career and was introduced in 2008. As such, quantitative findings presented in this section are attributable to the Skills Development program delivered by the federal government in 2002 and 2005 and to the Ontario Skills Development program which was delivered by Ontario in the 2007 to 2008 period. Qualitative findings apply to the Second Career program.
The objective of Second Career is to assist laid-off, unemployed individuals in obtaining the skills they need for employment in occupations with demonstrated labour market prospects in Ontario.
The program provides up to $28,000 in financial assistance to eligible learners to cover expenses related to:
- Training, including tuition
- Disability needs
- Books
- Financial hardship support
- Basic living expenses and allowance
- Equipment
- Living away from home allowance
- Transportation and parking
- Dependent care
- Tutoring
The level of financial support provided under the program is determined through an assessment of the participant’s needs. Participants may be required to financially contribute to their training to demonstrate their commitment to the training plan. The proportion of the participant’s contribution is determined based on their annual household income and household size.
The types of training supported under Second Career must be vocational in nature. The program generally supports training activities that are up to two years in length as well as one additional year for literacy and basic skills training and second language training in English or French. For persons with disabilities, the literacy and basic skills training, language training and skills training duration may be extended to meet the special needs of these individuals.
2.2.2 Program delivery
Based on a document review and 8 key informant interviews completed in summer 2015
Individuals interested in skills training must meet with caseworkers at a third-party Service provider and complete an employment service assessment. The needs assessment looks at the participant’s work history, skills and barriers to employment. If skills training is identified as the most appropriate way to address an individual’s employment needs, it must be specified in an employment service plan, which must also include a confirmation that individuals have demonstrated that they have completed a thorough job search. The application and approval process can take from 5 days to 3 months, depending on training start dates and the length of time required for each individual to progress through the application process.
The Ministry of Advanced Education and Skills Development reviews and approves applications. The Ministry is responsible for administering Second Career participant agreements, which includes the monitoring of individuals’ progress and financial activity. The frequency of monitoring depends on the duration of the training program. Service providers do not maintain contact with most participants during training, rather, they follow-up with individuals experiencing challenges. Some key informants identified that they conduct follow-up with participants during training on a monthly basis or once per semester. After the completion of training, service providers do follow-up with participants at 3, 6 and 12 months in order to determine their current status (such as, satisfaction with services received, employment status, etc.) and whether they need any additional assistance.
2.2.3 Targeting to labour market demand
Based on a document review and 8 key informant interviews completed in summer 2015
To be approved for Second Career, applicants must demonstrate that their desired training will lead to employment opportunities. Evidence of good employment prospects includes one or more of the followingFootnote 7 :
- The occupation is on the list entitled Labour Market Indicators for Second Career
- Submission of currently advertised job opportunities
- Submission of attestations from employers that they are hiring for the occupation
- Evidence of future job opportunities (for example, future plant or a new employer)
Key informants explained that prospective participants must conduct research on training institutions as part of their Second Career application. As well, key informants mentioned that participants may need to conduct informational interviews with potential employers or individuals employed in their chosen field. Finally, service providers use information from the employment prospect ratings of Ontario Job Futures and other sources of labour market information in their discussions with participants.
Table 2 presents the top 5 occupations that program participants were trained for in 2014 and 2015.
| Occupation | Number of participants | Proportion of participants |
|---|---|---|
| Transport Truck Drivers | 1,213 | 13% |
| Early Childhood Educators and Assistants (includes Home Support Workers and Housekeepers) | 835 | 9% |
| Accounting and Related Clerks (includes Payroll Clerks and Bookkeepers) | 688 | 8% |
| Heavy Equipment Operators (Except Crane) | 600 | 7% |
| Medical Administrative Assistants | 439 | 5% |
| Social and Community Service Workers | 425 | 5% |
2.2.4 Profile of participants
As shown in Table B1 in Appendix B, active claimants who started participation in 2002 to 2005 were equally split between male (51%) and female (48%), while those who started between 2007 and 2008 were less likely to be male (44%) than female (56%). Sixty-five percent (65%) of those who started participation in 2002 and 2005 and 62% of those who started participation in 2007 and 2008 were between the ages of 25 and 44. As well, 41% of participants from the 2002 to 2005 cohort and 45% of participants from the 2007 to 2008 cohort held occupations requiring secondary school or occupational training before participation.
Former claimants who started participation between 2002 and 2005 were equally split between female (51%) and male (48%), while those who started in 2007 to 2008 had more female (62%) than male (38%) participants. Sixty-eight percent (68%) of those who started participation in 2002 to 2005 and 67% of those who started participation in 2007 to 2008 were between the ages of 25 and 44. As well, 42% of participants from the 2002 to 2005 cohort and 45% of participants from the 2007 to 2008 cohort held occupations requiring secondary school or occupational training prior to participation.
2.2.5 Incremental impacts
Active claimants
As shown in Table B2 in Appendix B, active claimants who started program participation between 2002 and 2005 had gains in earnings and incidence of employment in each of the five years after participation. As shown in Figure 2, earnings increased over time, ranging from $817 in the first year after participation to $3,711 in the fifth year. The increases in incidence of employment ranged between 3.8 percentage points and 5.1 percentage points after participation.
Gains in employment earnings and incidence of employment were accompanied by decreases in the use of EI (cumulative of $1,116 or 3.6 weeks) and social assistance benefits in years 4 and 5 after participation by $65 and $85 respectively. As well, the level of dependence on income support decreased between 1.4 and 2.4 percentage points throughout the post-program period.
Active claimants who started program participation in 2007 and 2008 increased their incidence of employment and decreased the use of EI and social assistance as well as the level of dependence on income support. The incremental impacts on earnings were mixed with a decrease in year 1 followed by an increase in year 3 after participation.
Overall, active claimants increased their labour market attachment through increases in earnings, incidence of employment and a decrease in the level of dependence on government income support (use of EI and social assistance).

Text description of Figure 2
| Gains in Earnings | ||
|---|---|---|
| Active Claimants | Former Claimants | |
| Year 1 Post-Program | 817 | 659 |
| Year 2 Post-Program | 2190 | 1029 |
| Year 3 Post-Program | 2940 | 1205 |
| Year 4 Post-Program | 3368 | 1398 |
| Year 5 Post-Program | 3711 | 1164 |
The results for sub-groups of active claimants were as follows:
- Youth (under 30 years old) who started program participation in the 2002 and 2005 period had incremental gains in earnings and incidence of employment in each year after participation. As well, youth decreased their use of EI and social assistance as well as their dependence on income support over the 5 post-program years
- Older workers (55 years old and over) who started program participation in the 2002 and 2005 period had incremental increases in earnings and incidence of employment during the post-program period. However, their use of EI increased over the entire post-program period and their dependence on income support increased in every post-program year. Impacts on the use of social assistance increased in the first year after the program, but were otherwise not statistically significant. The increase in EI use reflects the inability of some older workers to retain the employment secured following Skills Development participation
- Long-tenured workers who started program participation between 2007 and 2009 had a decrease in earnings in the first year after participation, followed by an increase in the third year after participation. Incidence of employment increased every year following participation. This increase was complemented by decreases in EI use and dependence on income support throughout the post-participation period and a decrease in social assistance use in the third year after participation
Former claimants
Former claimants who started their participation between 2002 and 2005 had incremental gains in earnings in each year after participation, ranging from $659 to $1,398 (see Table B3 in Appendix B). There were also increases in the incidence of employment ranging between 2.2 and 3 percentage points. Participants’ use of social assistance decreased by a cumulative of $910 in the five years following participation while the dependence on income support decreased between 1.4 and 2.3 percentage points annually.
Program participants increased the use of EI by a cumulative of $497. This indicates the inability of some former claimants to maintain the employment secured in the short-term. It can also be argued that the increase in EI use is an indication of increase labour market attachment for this client group since they did experience increases in employment earnings and incidence of employment as well as a decrease in the use of social assistance. As a reminder, former claimants are participants for whom the EI benefit period ended up to three years pre-participation.
Former claimants who started their participation in the 2007 to 2008 period had a decrease in earnings in the first year following participation, with non-statistically significant findings in the remaining years. Participants experienced increases in the incidence of employment and decreases in social assistance use as well as dependence on income support. The incremental impacts on the use of EI were mixed with a decrease in year 1 and an increase in year 3 following participation.
The results for sub-groups of former claimants were as follows:
- Youth (under 30 years old) who started their participation in the 2002 and 2005 period experienced incremental gains in earnings and incidence of employment in all years after participation. As well, they decreased the use social assistance and their dependence on income support over most post-program years. Youth increased the use of EI indicating the inability for some youth participants to maintain the employment secured following participation.
- Older workers (55 years old and over) who started their participation in the 2002 and 2005 period had incremental increases in earnings during the total post-program period. The incidence of employment increased in the fourth and fifth year after participation. The remaining results were not statistically significant.
- Long-tenured workers who started program participation between 2007 and 2009 decreased their earnings in the first year after participation, but also experienced a decrease in EI use and dependence on income support in the same year. In addition, these participants experienced increases in the incidence of employment and decreases in social assistance use in each year following participation. Other years did not have statistically significant results for earnings, EI use and dependence on income support.
2.2.6 Cost-benefit results
As shown in Table B4 in Appendix B, in order to recover the costs, benefits of the program for society would need to be maintained for 7.8 years after participation for active claimants and 14.3 years for former claimants.
2.2.7 Challenges and lessons learned about Skills Development design and delivery
Based on 8 key informant interviews completed in summer 2015
Key informants identified the following challenges related to the design and delivery of the current Skills Development program (Second Career):
- The perceived insufficient level of financial support (7 key informants)
- Participants with multiple barriers have more complex needs and often require additional time for assistance (3 key informants)
Key informants identified the following lessons learned in terms of the design and delivery of the program:
- The communication and coordination between stakeholders was strong (4 key informants)
- Ensuring that the participant is well supported by caseworkers through each step (4 key informants)
- Guidelines on estimating financial supports for participants are important to ensure accurate and consistent levels of support are provided (3 key informants)
2.3 Skills Development-Apprentices
2.3.1 Program description
Based on a document review and 7 key informant interviews completed in summer 2015
Under the Ontario Skills Development-Apprentices program, the Ministry of Advanced Education and Skills Development provides financial assistance to EI eligible individuals who are attending full-time apprenticeship training in a classroom setting. Funding is provided to apprentices enrolled in full-time training which is generally 8 to 10 weeks in length.
Eligible costs include weekly basic living cost, child care, transportation, travel and overnight accommodation, living away from home allowance and disability allowance.
During the 2003 to 2005 period, the federal government was delivering the Skills Development – Apprentices program in Ontario. Ontario assumed responsibility for the design and delivery of the program in January 2007.
2.3.2 Program delivery
Based on a document review and 7 key informant interviews completed in summer 2015
Apprentices are not required to develop a Return to Work Action Plan and they are not case managed because they generally have an employer attachment before and after the classroom training. Employers usually complete an Apprentice application and approval is made at the regional level in Ontario. The Ministry of Advanced Education and Skills Development carries out discussions with schools and considerations are given for trades categories that are in demand based on the number of registered apprentices.
Apprentices are contacted to attend training through a letter issued by the Ministry. After receiving confirmation of the apprentice’s intention to attend the classroom training, they are invited to a documentation session usually during the first week of training. Staff from the Ministry’s apprenticeship division evaluate eligibility for financial support from the program and determine the level of support needed. Service providers can advise clients on apprenticeship training and provide pre-apprenticeship training, but they have no role to play in schools and apprenticeship training.
Staff from the Ministry visit final level apprenticeship classes to encourage participants to write their final exam. They also work on arranging a one week training aiming for preparing clients for exams and to increase success rates.
2.3.3 Profile of Skills Development- Apprentices participants
As shown in Table C1 in Appendix C, the majority of active claimants who started participation in 2003 to 2005 and 2013 to 2014 were male (96% and 97% respectively). Eighty-eight percent (88%) of apprentices who started participation in 2003 to 2005 were under 34 years old, while 82% of apprentices who started participation in 2013 to 2014 were between 25 and 44 years of age. As well, 87% of apprentices from the 2003 to 2005 cohort and 88% of apprentices from the 2013 to 2014 cohort held employment requiring college or apprenticeship training before participation.
The majority of former claimants who started participation in 2003 to 2005 and 2013 to 2014 were male (91% and 92%). Seventy-four percent (74%) of apprentices from the 2003 to 2005 cohort were under 34 years old, compared to 76% for apprentices from the 2013 to 2014 cohort. As well, 48% of apprentices from the 2003 to 2005 cohort and 72% of apprentices from the 2013 to 2014 cohort held employment requiring college or apprenticeship training before participation.
2.3.4 Outcomes
The labour market outcomes were based on individuals who began their participation during the 2003 to 2005 period. Statistics presented in Tables C2 and C3 in Appendix C focused on 5 years prior and 7 years after the program start year.
Active claimants
As shown in Figure 3, employment earnings for active participants increased from $14,654 in the 5th pre-program year to $55,135 in the 7th post-program year. The average proportion of participants employed remained almost unchanged and declined slightly from 97% before to 96% after participation.

Text description of Figure 3
| 5 yrs pre-program | 14654 |
|---|---|
| 4 yrs pre-program | 17697 |
| 3 yrs pre-program | 20035 |
| 2 yrs pre-program | 23852 |
| 1 yrs pre-program | 29370 |
| Program start year | 27936 |
| 1 yrs post-program | 34211 |
| 2 yrs post-program | 39664 |
| 3 yrs post-program | 45768 |
| 4 yrs post-program | 50284 |
| 5 yrs post-program | 50796 |
| 6 yrs post-program | 52758 |
| 7 yrs post-program | 55135 |
Former claimants
As shown in Figure 4, employment earnings for former participants increased from $15,456 in the 5th pre-program year to $37,838 in the 7th post-program year. In contrast to the increase in earnings, the average annual proportion of participants employed decreased by 5 percentage points, from 93% to 88%. This decrease should be interpreted with caution given the small number of participants (n=327). A decrease of 5 percentage points in the proportion employed represent 16 participants.

Text description of Figure 4
| Employment Earnings | |
|---|---|
| 5 yrs pre-program | 15456 |
| 4 yrs pre-program | 18292 |
| 3 yrs pre-program | 19044 |
| 2 yrs pre-program | 20947 |
| 1 yrs pre-program | 16779 |
| Program start year | 17852 |
| 1 yrs post-program | 24550 |
| 2 yrs post-program | 29368 |
| 3 yrs post-program | 33465 |
| 4 yrs post-program | 34533 |
| 5 yrs post-program | 33624 |
| 6 yrs post-program | 36091 |
| 7 yrs post-program | 37838 |
2.3.5 Challenges and lessons learned about Ontario Skills Development-Apprentices design and delivery
Based on a document review and 7 key informant interviews completed in summer 2015
Existing literature has shown that there is a fairly high non-completion rate among apprentices in Canada (40-50%)Footnote 9. Furthermore, subject matter literature revealed that despite the growth in apprenticeship registrations in Canada, there has not been a corresponding increase in completionsFootnote 10. Key informants overall agreed with the barriers and challenges identified in the literature above and they confirmed a high dropout rate. They provided the following reasons to explain why some participants drop out of the apprenticeship process:
- Financial barriers (5 key informants)
- Timing and location of training (3 key informants)
- Apprentices are often working for the same pay as journeymen and they are not motivated to write the final exam (3 key informants)
- Lack of ongoing case-management for apprentices (2 key informants)
To deal with these barriers, key informants identified the following supports to help apprentices access and complete their apprenticeship training:
- Pre-apprenticeship training would be beneficial to helping apprentices complete their training and increase the probability of success. The integration of Literacy and Basics Skills and employability skills (job retention, leadership skills, document use, conflict resolution, goal setting, etc.) components in pre-apprenticeship training are key components to ensuring success, especially for persons with multiple barriers (4 key informants)
- Providing handouts to apprentices with detailed information on the available supports and where to get help when needed (3 key informants)
- Increase awareness of the financial supports that are available for apprentices (3 key informants).
- Case managing apprentices for the full duration of the apprenticeship process would be beneficial to increasing the probability of completion (2 key informants)
Key informants were asked about challenges in relation to the design and delivery of the program or apprenticeship training in general and they identified the following challenges:
- Lack of awareness about the financial support available to apprentices (3 key informants)
- The amount of paperwork required when seeking financial support (3 key informants)
- Delays in confirming EI eligibility (3 key informants)
2.4 Targeted Wage Subsidies (Job Placement with Incentive)
The targeted Wage Subsidy program was delivered by the federal government in the 2002 to 2005 period. Ontario assumed responsibility for program delivery in January 2007.
The current program, called Job Matching, Placement and Incentives, matches client skills and interests with employment opportunities and employer needs. Clients using this component need a work experience or on-the-job training placement. Job Placements include “job test and hire”, work experience, and community volunteer positions.
2.4.1 Profile of Targeted Wage Subsidies participants
As shown in Table D1 in Appendix D, active claimants who started participation between 2002 to 2005 and 2007 to 2008 had higher proportions of male than female participants (57% and 53% respectively). Two-thirds of participants (65% and 66% respectively) from both cohorts were above 35 years old. Before participation, active claimants in both cohorts held occupations requiring secondary or occupational training (38% and 36% respectively) or college or apprenticeship training (29% and 32% respectively).
Former claimants who started participation in 2002 to 2005 and 2007 to 2008 had higher proportions of male than female participants (56% and 52% respectively). Both cohorts were evenly distributed among age groups:
- 25 to 34 years old (32% of the 2002 to 2005 cohort and 28% of the 2007 to 2008 cohort).
- 35 to 44 years old (30% of the 2002 to 2005 cohort and 28% of the 2007 to 2008 cohort).
- 45 to 54 years old (21% of the 2002 to 2005 cohort and 24% of the 2007 to 2008 cohort).
As well, 37% of participants from the 2002 to 2005 cohort and 38% of participants from the 2007 to 2008 cohort held occupations requiring secondary school or occupational training prior to participation.
2.4.2 Incremental impacts
Active claimants
As shown in Table D2 in Appendix D, active claimants who started participation between 2002 and 2005 had gains in earnings and incidence of employment in each of the five years after participation. As shown in Figure 5, participants’ gains in earnings ranged from $2,223 to $4,507. Increases in the incidence of employment ranged between 6.7 percentage points and 7.4 percentage points. The incremental impacts on the use of EI, social assistance and the dependence on income support were not statistically significant.

Text description of Figure 5
| Gains in Earnings | ||
|---|---|---|
| Active Claimants | Former Claimants | |
| Year 1 Post-Program | 2223 | 2800 |
| Year 2 Post-Program | 2816 | 2662 |
| Year 3 Post-Program | 4507 | 2858 |
| Year 4 Post-Program | 3657 | 3010 |
| Year 5 Post-Program | 4035 | 2880 |
Active claimants who started participation in 2007 to 2008 had a cumulative increase in incremental earnings over the three years following participation. As well, they had incremental increases in the incidence of employment and a cumulative decrease in the use of social assistance benefits over the three years following participation. Incremental impacts on the use of EI and the level of dependence on government income support were not statistically significant.
Overall, active claimants improved their labour market attachment through increases in earnings and incidence of employment.
The results for sub-groups of active claimants were as follows:
- Youth (under 30 years old) who started participation in the 2002 to 2005 period generally experienced incremental gains in earnings and incidence of employment after participation. The use of EI, social assistance and the dependence on income support decreased only in the first year after participation, while the remaining results were not statistically significant.
- Older workers (55 years old and over) who started participation in the 2002 to 2005 period experienced incremental increases in earnings and incidence of employment during the post-program period. However, there was an increase in EI benefits and dependence on income support following participation. This reflects the inability of some older workers to retain the employment secured in the post-program period.
- Long-tenured workers who started participation between 2007 and 2009 decreased their earnings in the first year after participation, but also decreased their EI and the dependence on income support in this same year. Other results were not statistically significant. The decrease in earnings during program participation and in year one afterward may reflects the inability of long-tenured workers to retain the job secured under the program, to find a subsequent employment or to secure an employment long enough to build new entitlements for EI.
Former claimants
As shown in Table D3 in Appendix D, former claimants who started their participation between 2002 and 2005 experienced incremental gains in earnings in each year after participation. As show in Figure 5, those gains ranged from $2,662 to $3,010. There were also incremental increases in the incidence of employment ranging between 5.1 and 6.3 percentage points over the five-year post-program period. While use of EI use increased by a cumulative of $1,515 or 4.3 weeks, the use of social assistance decreased by a cumulative of $1,412 and the dependence on income support also decreased between 2.1 to 2.7 percentage points following participation.
Overall, former claimants increased their use of EI following participation. This indicates the inability of some former claimants to maintain the employment secured in the short-term. It can also be argued that the increase in EI use is an indication of increase labour market attachment for this client group since they did experience increases in employment earnings and incidence of employment as well as decreases in the use of social assistance and dependence on income support. As a reminder, former claimants are participants for whom the EI benefit period ended up to three years pre-participation.
Former claimants who started their participation in the 2007 to 2008 period also experienced increased earnings, incidence of employment, and use of EI, along with decreased social assistance use. The results for dependence on income support were not statistically significant.
The results for sub-groups of former claimants were as follows:
- Youth (under 30 years old) who started participation in the 2002 to 2005 period experienced incremental gains in earnings and incidence of employment in most years after participation. The use of EI increased while the use of social assistance and the dependence on income support decreased following participation
- Older workers (55 years old and over) who started participation in the 2002 to 2005 period generally experienced incremental increases in earnings and incidence of employment following participation. Older workers increased the use of EI and decrease the use of social assistance over the entire five years following participation
- Long-tenured workers who started participation between 2007 and 2009 increased their earnings and incidence of employment after participation. The use of social assistance and the level of dependence on income support decreased in most years following participation. Results for the use of EI were not statistically significant
2.4.3 Cost-benefit results
As shown in Table D4 in Appendix D, for active claimants, the benefits of Employment Service-Job Placement with Incentive for society exceeded the costs 3.9 years after participation. For former claimants, the benefits exceeded the costs 2 years after participation.
2.5 Self-Employment
2.5.1 Program description
Based on information available on the website of the Ministry of Advanced Education and Skills DevelopmentFootnote 11
During the 2002 to 2005 period, the federal government was delivering the Self-Employment program in Ontario. Ontario assumed responsibility for the design and delivery of the program in January 2007.
This Ontario Self-Employment Benefit program did sunset in 2016 and the information below refers to the period of time when this program was active in Ontario. The program provided entrepreneurial skills development support to approved participants to help them develop and implement a business plan and become self-employed. The program allowed participants to concentrate on building a sustainable business by providing them with financial assistance while they receive business advice and support.
Key elements of Ontario Self-Employment Benefit were:
- Information sessions for eligible and interested individuals
- Orientation and support sessions to enable individuals to assess risk and opportunities of self-employment, personal suitability and develop a business concept
- Eligibility and suitability assessment including a feasibility assessment of the proposed business concept
- A mechanism for independent review of the feasibility of the proposed business concept and subsequent business plan. An independent review may include staff and recognized individuals in the community or an organization that can provide an objective opinion on the feasibility of the business concept
- Entrepreneurial skills development support to enable approved participants to develop and implement a business plan (including but not limited to workshops, coaching, mentoring, etc.)
- The provision of financial assistance by the Ministry of Advanced Education and Skills Development
Financial assistance covered basic living allowance, dependent care costs, disability needs and transportation costs.
2.5.2 Program delivery
Based on information available on the website of the Ministry of Advanced Education and Skills DevelopmentFootnote 12
The Ministry of Training, Colleges and Universities (now Ministry of Advanced Education and Skills Development) was responsible for confirming eligibility, reviewing the suitability and business feasibility assessment completed by coordinators as well as approving program participation and financial assistance. Third party service providers were responsible for completing the employment service needs assessment, employment service plan and referring individuals to coordinators. Coordinators of the program are responsible for assessing the eligibility and suitability of applicants.
Assessment is based on individual eligibility, the eligibility of business activities and the suitability and feasibility of the business concept.
2.5.3 Profile of Self-Employment participants
Active claimants who started participation in 2002 to 2005 included more male (56%) than female (43%) participants, while those who started participation in 2007 to 2008 had more female (57%) than male (43%) participants. As shown in Table E1 in Appendix E, 70% of those who started participation in 2002 to 2005 and in 2007 to 2008 were above 35 years old. As well, 35% of participants in both cohorts had occupations requiring college or apprenticeship training before participation.
Former claimants who started participation between 2002 and 2005 were evenly split between female (49%) and male (50%) participants, while those who started participation in 2007 to 2008 had more female (61%) than male (39%) participants. Sixty-nine percent (69%) of those who started participation in 2002 to 2005 and 70% of those who started participation in 2007 to 2008 were 35 years old and over. Participants in both cohorts held occupations requiring secondary school or occupational training (31% and 32%) or college or apprenticeship training (29% and 30%) prior to participation.
2.5.4 Incremental impacts
Like other EBSMs, incremental impacts were estimated for Self-Employment participants in the 2002 to 2005 and 2007 to 2008 periods. Results showed large decreases in employment/self-employment earnings and decreases in the incidence of employment. As well, compared to similar non-participants, participants decreased their use of EI and social assistance and also reduced their dependence on government income support.
Detailed estimates are presented in Tables E2 and E3 in Appendix E. However, they are not discussed in the report since they may not provide an accurate depiction of the financial well-being of participants in the post-program period. Impacts were examined using individual earnings reported in the T1 and T4 taxation files from Canada Revenue Agency, and measured relative to active claimants who did not participate in the Self-Employment program and may have been in any employment/unemployment situation following participation (for example, unemployed, paid employee or self-employed).
According to a study from Statistics Canada, self-employed individuals in Canada have a lower average annual income than paid employees ($46,200 versus $52,400 in 2009), but the average net worth of their households is 2.7 times greater than that of the paid employee households, which indicates that some self-employed individuals may leave funds within their business for reinvestment purposesFootnote 13. Overall, this suggests that looking at individual earnings alone, without taking the net worth into consideration, may not provide a fair assessment of how well participants are doing financially after participation.
Finally, readers should also be aware that little is currently known about the design and delivery of this program. In particular, there is a lack of understanding around the role played by this program in helping future entrepreneurs to implement viable business plans and to develop their entrepreneurship skills. Overall, it is not clear whether participant’s success in improving their labour market attachment through self-employment is more closely associated with their business idea and their entrepreneurship skills than the assistance provided under the program.
2.6 Job Creation Partnerships
2.6.1 Program description and delivery
Based on information available on the website of the Ministry of Advanced Education and Skills DevelopmentFootnote 14
During the 2002 to 2005 period, the federal government was delivering the Job Creation Partnerships program in Ontario. Ontario assumed responsibility for the design and delivery of the program in January 2007.
The Ontario Job Creation Partnerships program provides work experience to unemployed job seekers within projects that benefit the community or local economy. Participants who complete the program will have gained recent work experience and additional skills to add to their résumés, increasing their chances of finding long-term employment.
Eligible organizations include businesses, non-profit organizations, crown corporations, municipalities or provincial/territorial governments, First Nations councils and public health and educational institutions.
The following are criteria for projects that are eligible for the program:
- Finite in nature and incremental to the sponsors’ normal activities
- Provides a benefit to the community or the local economy
- Provides participants with a meaningful work experience
- Within their ability to do so, sponsors share in the cost of the project
2.6.2 Profile of Job Creation Partnerships participants
As shown in Table F1 in Appendix F, active claimants who started participation in 2002 to 2005 and 2007 to 2008 included more female than male participants (58% and 64% respectively). Nearly half of participants in both cohorts were between 35 and 54 years old (47% and 49% respectively). As well, participants between 25 and 34 years old represented 36% and 32% respectively of participants in both cohorts. One-third of participants in both cohorts (33% and 35% respectively) held occupations requiring secondary or occupational training before participation.
Former claimants who started participation in 2002 to 2005 and 2007 to 2008 included more female (52% and 61% respectively) than male (47% and 39% respectively) participants. Half of participants in both cohorts were between 35 and 54 years old (49% and 50% respectively). As well, participants between 25 and 34 years old represented 33% and 35% respectively of participants in both cohorts. Thirty-two percent (32%) of participants from the 2002 to 2005 cohort and 37% of participants from the 2007 to 2008 cohort held occupations requiring secondary school or occupational training before participation.
2.6.3 Incremental impacts
Active claimants
As shown in Table F2 in Appendix F, active claimants who started participation in Job Creation Partnerships between 2002 and 2005 had incremental increases in earnings and incidence of employment following participation. As shown in Figure 6, gains in earnings ranged between $2,396 and $5,155. As well, gains in the incidence of employment ranged between 5.2 and 8 percentage points. Active claimants had short-term decrease in EI use but they increased their overall use of EI by a cumulative of 2.3 weeks over the five post-participation years. Most of the incremental impacts on the use of social assistance were non-statistically significant, while the level of dependence on income support decreased in two of the five post-participation years.

Text description of Figure 6
| Gains in Earnings | ||
|---|---|---|
| Active Claimants | Former Claimants | |
| Year 1 Post-Program | 2396 | 1217 |
| Year 2 Post-Program | 2931 | 1658 |
| Year 3 Post-Program | 3413 | 1835 |
| Year 4 Post-Program | 4339 | 2017 |
| Year 5 Post-Program | 5155 | 2090 |
Active claimants who started participation between 2007 and 2008 similarly had gains in earnings and incidence of employment in the post-program period. Participants decreased their overall use of EI by a cumulative of 3.4 weeks over the five post-participation years, while the level of dependence on income support decreased in year 1 post-participation. Incremental impacts on the use of social assistance were not statistically significant.
Overall, active EI claimants who participated in the Job Creation Partnerships program in 2002 to 2005 and 2007 to 2008 improved their labour market attachment through increases in earnings and incidence of employment following participation. Participants also had short-term decrease in the use of EI and in the level of dependence on government income support.
Long-tenured workers who started participation between 2007 and 2009 increased their incidence of employment following participation. No other results were statistically significant.
Incremental impacts for youth and older workers who participated in the program in 2002 to 2005 were not produced due to their small numbers.
Former claimants
As shown in Table F3 in Appendix F, former claimants who started program participation in 2002and 2005 had incremental increases in earnings, ranging from $1,217 to $2,090, over the five post-program years. As well, participants had incremental increases in the incidence of employment that ranged between 3.6 to 4.2 percentage points over the five post-program years. The use of EI increased in the second ($259) and fifth year ($210) after participation. However, social assistance use decreased in every year after participation, ranging from $221 to $306, and dependence on income support decreased in the first four years after participation (ranging between 2.4 to 3.8 percentage points).
Similar to participants who started in 2002and 2005, former claimants who started participation in 2007 and 2008 increased their earnings and incidence of employment following participation. They also decreased their social assistance use and dependence on income support, while results on EI use were not statistically significant.
Overall, former claimants increased their labour market attachment through increases in employment earnings and incidence of employment as well as a decrease in the use of social assistance and in the level of dependence on government income support.
The results for sub-groups of active claimants were as follows:
- Youth (under 30 years old) who started participation in the 2002 and 2005 period experienced incremental gains in earnings. They also decreased their use of social assistance in every year after participation and decreased their dependence on income support in the first and third year following participation. Other results were not statistically significant.
Incremental impacts for youth and long-tenured workers were not produced due to their small numbers.
2.6.4 Cost-benefit results
As shown in Table F4 in Appendix F, the benefits of the program for active claimants would need to be maintained over 8.4 years after the end of participation to match the costs. For former claimants, the benefits would need to persist over 19.9 years after the end of participation to match the costs.
Overall, when interpreting cost-benefit results for Job Creation Partnerships, it should also be acknowledged that program funding contributes to develop the community and the local economy and none of these benefits were accounted for in the calculations as they are difficult to quantify.
2.7 Employment Assistance Services
2.7.1 Program description and delivery
Based on 16 key informant interviews completed in summer 2013
During the 2002 to 2005 period, the federal government was delivering Employment Assistance Services in Ontario. Ontario assumed responsibility for the design and delivery of these services in January 2007.
The current program delivered by Ontario is called Employment Services. These services aim to assist job seekers with securing sustainable employment by providing access to all Employment Ontario programs and services. A network of 171 third-party service providers offer planning and coordination of client services; resources and information; job search assistance; job matching, placement and incentives and job and training retention services. Assistance and coaching is provided for resumes, cover letters, online applications, connecting with employers, preparing for interviews and much more. Services are tailored to meet the individual employment and training needs of each participant.
2.7.2 Profile of Employment Assistance Services participants
As shown in Table G1 in Appendix G, active claimants who started their participation in Employment Assistance Services between 2002 and 2005 had more male (54%) than female (45%) participants, while participants who started between 2007 and 2008 were more likely to be female (58%) than male (42%). Both cohorts were evenly distributed among the age groups above 25 years old:
- 25 to 34 years old (28% of the 2002 to 2005 cohort and 26% of the 2007 to 2008 cohort).
- 35 to 44 years old (32% of the 2002 to 2005 cohort and 30% of the 2007 to 2008 cohort).
- 45 to 54 years old (22% of the 2002 to 2005 cohort and 26% of the 2007 to 2008 cohort).
Thirty-eight percent (38%) of participants from the 2002 to 2005 cohort and 41% of participants from the 2007 to 2008 cohort held occupations requiring secondary or occupational training.
Former claimants who started their participation in Employment Assistance Services between 2002 and 2005 included more male (52%) than female (47%) participants, while participants in the 2007 to 2008 cohort included more female (59%) than male (41%) participants. Participants in both cohorts were generally distributed among the age groups above 25 years old:
- 25 to 34 years old (29% of the 2002 to 2005 cohort and 28% of the 2007 to 2008 cohort).
- 35 to 44 years old (32% of the 2002 to 2005 cohort and 29% of the 2007 to 2008 cohort).
- 45 to 54 years old (22% of the 2002 to 2005 cohort and 24% of the 2007 to 2008 cohort).
Thirty-nine percent (39%) of participants from the 2002 to 2005 cohort and 41% of participants from the 2007 to 2008 cohort held occupations requiring secondary or occupational training.
Labour market barriers faced by Employment Assistance Services participants
Based on 16 key informant interviews completed in fall 2013
Key informants provided examples of specific barriers faced by participants. These include:
- Lack of certification, low educational attainment and literacy issues
- Lack of transferable skills and recent work experience
- Lack of motivation, self-esteem and interpersonal skills
- Lack of self-marketing skills and lack of job search skill such as resume writing.
- Mismatch between available skills and expectations from both employers and unemployed
- Having a criminal record, especially in a small community
- Stability issues (for example, homelessness, mental health issues and addiction)
- Transportation
- Seasonal employment and employment opportunities being limited, especially in rural areas
- Lack of access to affordable childcare
Individuals belonging to some socio-demographic groups also experience particular labour market challenges. The key informants interviewed identified barriers that are specifically faced by immigrants, older workers and youth:
- Immigrants may be facing difficulties in integrating into the labour market due to language barriers, lack of Canadian work experience, lack of credential recognition and unfamiliarity with Canadian work culture. It was also mentioned that discrimination by employers could be a barrier. Barriers to employment faced by immigrants also include issues at the more personal level such as culture shock or lack of self-esteem due to isolation from not understanding the language or the culture.
- Older workers are often dealing with outdated skills and a lack of computer skills.
- Youth often have low educational attainment. As well, youth and new graduates lack job experience and many tend to hold temporary jobs.
2.7.3 Incremental impacts
Incremental impacts were produced only for active claimants since former claimants who participated only in Employment Assistance Services were used as a comparison group for former claimants who participated in other EBSMs.
As shown in Table G2 in Appendix G, active claimants who started participation in the 2002 to 2005 period increased their incidence of employment between 1.4 and 1.7 percentage points after participation (see Figure 7). As well, they decreased the use of EI by a cumulative of $1,248 or 4.1 weeks, and the level of dependence on government income support in years 1 and 2 following program participation. Participants experienced a decrease in employment earnings in year 1 following program participation ($1,036), but gains in earnings increased in years 4 and 5 following participation by $657 and $802, respectively.

Text description of Figure 7
| Percentage Points | |
|---|---|
| Year 1 Post-Program | 1.5 |
| Year 2 Post-Program | 1.4 |
| Year 3 Post-Program | 1.7 |
| Year 4 Post-Program | 1.6 |
| Year 5 Post-Program | 1.7 |
Results for active claimants who exclusively participated in Employment Services in 2007and 2008 mirrored those of the 2002 to 2005 cohort. Participants experienced an incremental increase in the incidence of employment and decreases in EI use and in the level of dependence on government income support. The use of social assistance decreased in year 1 post program while estimates in years 2 and 3 were not statistically significant. As well, participants experienced a decrease in employment earnings in year 1 following program participation, but gains in earnings increased in years 2 and 3 following participation.
Overall, active claimants who participated in Employment Assistance Services increased their labour market attachment by increasing their incidence of employment, their employment earnings over time and decreasing the use of EI. To contextualise these results, it should be noted that Employment Assistance Services are short-term, low intensity measures that are not focused on human capital development. It mostly includes services such as counselling, help with job search, development of return-to-work action plans and (in some cases) very short training such as First Aid. In this context, it may not be reasonable to expect that participating only in Employment Services would result in improved participant earnings. Rather, the results for incidence of employment and EI use suggest that active claimants are returning into employment after participation.
The results varied based on the sub-groups examined:
- Youth (under 30 years old) who started participation between 2002 and 2005 increased their earnings and incidence of employment in four of the five post-program years. The also decreased their use of EI and dependence on income support.
- Older workers (over 55 years old) who started participation in 2002 to 2005 increased their incidence of employment in the five years following participation. They also increased their earnings in three of the five post-program years. Older workers decreased the use of EI in the short-term but generally increased the use of social assistance.
- Long-tenured workers who started participation between 2007 and 2009 increased their incidence of employment in the three years following participation. They generally decreased the use of EI and the level of dependence on government income support. The use of social assistance increased over the entire three post-program years. Long-tenured workers also experienced a decrease in employment earnings following participation.
Earlier participation in Employment Assistance Services improves participants’ labour market outcomes
The study on the effects related to the timing of participation showed that the incremental impacts of program participation on earnings and employment were larger for individuals who participated in Employment Services early during their EI claim compared to non-participants and to individuals who remained on EI for longer periods before receiving these services (see Figure 8 below and Table G3 in Appendix G). Specifically, individuals who started their participation within four weeks following the start of their EI benefit period had a cumulative gain in earnings of $10,624 over five post-program years. These early starters also experienced annual gains in their incidence of employment that ranged between 1.2 and 2.2 percentage points in four of the five post-program years.

Text description of Figure 8
| Cumulative Gains in Earnings | |
|---|---|
| 1-4 weeks | 10624 |
| 5-8 weeks | 3984 |
| 9-12 weeks | 3299 |
| 2nd quarter | 65* |
| 3rd quarter | -5502 |
| 4th quarter | -3430 |
* The incremental impact on earnings for participants who started Employment Services during the 2nd quarter after the start of their EI claim is not statistically significant at the 95% confidence level.
As shown in Table G4 in Appendix G, the study also looked at the difference between the number of EI weeks unused by participants and their comparison group in order to determine the effect of the timing of participation in Employment Services on the return to employment. Those who started participation within the first 4 weeks of their claim returned to employment more quickly than the comparison group. Specifically, those who started within 4 weeks returned to employment 2.9 weeks earlier than the comparison group.
Among all participants who started in the 2002 to 2005 period, 22,869 received assistance within the first 4 weeks of establishing an EI claim. With average weekly EI benefits of $324 during this period, the 22,869 participants did not use $21,487,712 in EI benefits (22,869 claimants * $324 * 2.9 weeks). The average cost of Employment Services interventions in the 2002 to 2005 period was $840. This represents a cost of $19,209,960 (22,869 claimants * $840) for a net savings of $2,277,752 ($21,487,712 - $19,209,960).
2.7.4 Cost-benefit results
As shown in Table G5 in Appendix G, if the benefits of this program were maintained, it would take 9.3 years after the end of participation for the benefits to recover the costs.
2.7.5 Challenges and lessons learned about Employment Services design and delivery
Based on 16 key informant interviews completed in summer 2013
Key informants interviewed identified the following challenges they face with the provision and targeting of the program:
- Challenges in accessing childcare and paying the cost of transportation to training (5 key informants)
- Data collection is challenging for some service providers (5 key informants)
- Lack of funds dedicated for the professional development of staff (4 key informants).
- Insufficient staff capacity can require the use of referrals, prevent the provision of job retention services, result in a waiting list, limit pre-employment services and also limit services to clients with multiple barriers (3 key informants).
Key informants interviewed identified the following best practices and lessons learned:
- Establishing relationships and communicate with other service providers, community organizations and employers (9 key informants)
- Centralizing services in one location and ensuring that the service offices are strategically located to improve access to other services (7 key informants)
- Recruiting and training qualified staff (4 key informants)
- Monitoring participant satisfaction, program outcomes and staff performance as well as having a good data collection system can improve the understanding and delivery of the program (3 key informants)
- Providing a participant-centered approach to counselling by ensuring that the same counsellors are providing services to the same individual over time and providing services that suit the client’s needs (3 key informants)
3. Comparison of key findings by program type
This section provides an overview of the key findings from the incremental impact analysis for Skills Development, Targeted Wage Subsidies, Job Creation Partnerships and Employment Assistance Services for both active and former EI claimant participants who started participation in the 2002 to 2005 period.
Overall, incremental impacts demonstrate that LMDA programs and services are improving the labour market attachment of participants, including youth and older workers. As well, social benefits of participation exceeded the cost of investments for most interventions over time. Finally, providing Employment Assistance Services interventions earlier during an EI claim (first four weeks) produced larger impacts on earnings and employment and facilitated earlier return to work. This demonstrates the importance of targeting early participation of EI active claimants.
Program participants have a higher probability of being employed than comparison group members
As shown in Figure 9, active EI claimants who participated in Skills Development, Targeted Wage Subsidies, Job Creation Partnerships and Employment Assistance Services had a higher probability of being employed (in other words, increased their incidence of employment) compared to similar non-participants. As well, former EI claimants who participated in Skills Development, Targeted Wage Subsidies, Job Creation Partnerships had a higher probability of being employed compared to former EI claimants who received low intensity interventions under Employment Assistance Services.

Text description of Figure 9
| Percentage Points | ||
|---|---|---|
| Active Claimants | Former Claimants | |
| Skills Development | 4.4 | 2.6 |
| Targeted Wage Subsidies | 7.2 | 5.7 |
| Job Creation Partnership | 6.4 | 4 |
| Employment Assistance Services | 1.6 | |
Increased earnings for participants compared to comparison group members
As shown in Figure 10, active claimants who participated in Skills Development, Targeted Wage Subsidies and Job Creation Partnerships increased their employment earnings compared to similar non-participants. Former EI claimants who participated in Skills Development, Targeted Wage Subsidies and Job Creation Partnerships also increased their employment earnings compared to former claimants who participated in Employment Assistance Services exclusively.
It is noted that Employment Assistance Services are relatively modest activities and, by themselves, are not expected to lead to substantial effects on labour market outcomes. In other words, Employment Assistance Services aims to support the return to work of unemployed participants and not necessarily to secure a better paying job than pre-participation. However, as demonstrated in the report, providing Employment Assistance Services earlier during the EI claim (first 4 weeks) generates significantly greater returns (see Figure 8).

Text description of Figure 10
| Cumulative Gains in Earnings | ||
|---|---|---|
| Active Claimants | Former Claimants | |
| Skills Development | 13026 | 5456 |
| Targeted Wage Subsidies | 17239 | 14210 |
| Job Creation Partnership | 18235 | 8817 |
| Employment Assistance Services | 714* | |
* The cumulative incremental impact on earnings for active Employment Assistance Services participants is not statistically significant at the 95% confidence level. Participants experienced a decrease in employment earnings in year 1 following program participation ($1,036), but gains in earnings were observed in years 4 and 5 following participation by $657 and $802, respectively
LMDA are also improving the probability of employment and the earnings for most youth and older worker participants
Incremental impacts that are available demonstrate that active and former EI claimants who were youth and older workers, and who participated in Skills Development, Targeted Wage Subsidies and Employment Assistance Services increased the probability of employment compared to comparison group members. Results for Job Creation Partnership participants were not statistically significant.
As well, active and former EI claimants who were youth and older workers, and who participated in Skills Development, Targeted Wage Subsidies, Job Creation Partnerships and Employment Assistance Services increased their employment earnings compared to comparison group members (see Figures 11 and 12).

Text description of Figure 11
| Cumulative Gains in Earnings | ||
|---|---|---|
| Active Claimants | Former Claimants | |
| Skills Development | 15787 | 8662 |
| Targeted Wage Subsidies | 17260 | 14293 |
| Job Creation Partnership | 12735 | |
| Employment Assistance Services | 2606 | |

Text description of Figure 12
| Cumulative Gains in Earnings | ||
|---|---|---|
| Active Claimants | Former Claimants | |
| Skills Development | 14030 | 13032 |
| Targeted Wage Subsidies | 21397 | 10917 |
| Employment Assistance Services | 4665 | |
The use of EI is reduced for most active claimants. While EI use increased for former claimants, it can be argued that this reflects an increase in labour market attachment since the incremental impacts on employment earnings and incidence of employment are positive and given the decrease in the use of social assistance.
As shown in Figure 13, active EI claimants who participated in Skills Development and Employment Assistance Services decreased their use of EI compared to similar non-participants. These two programs account for 90% of current LMDA investments and the majority of participants. Results for the use of social assistance benefits by active claimants were not statistically significant.
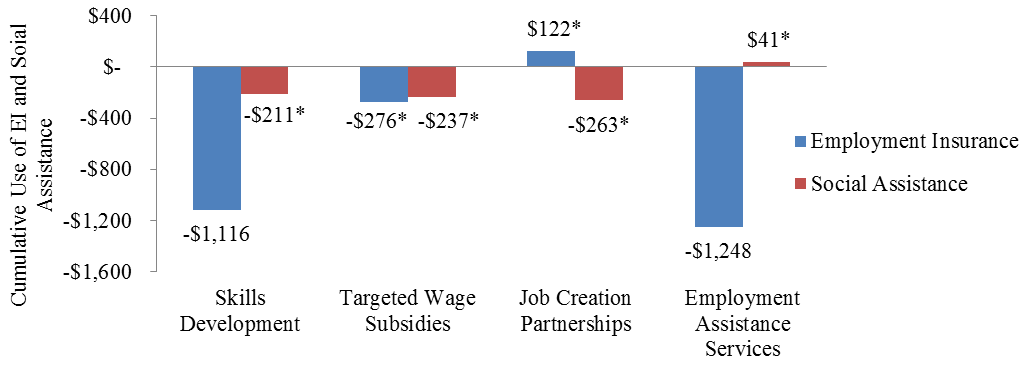
Text description of Figure 13
| Cumulative Use of EI and Social Assistance | ||
|---|---|---|
| Employment Insurance | Social Assistance | |
| Skills Development | -1116 | -211* |
| Targeted Wage Subsidies | -276* | -237* |
| Job Creation Partnership | 122* | -263* |
| Employment Assistance Services | -1248 | 41* |
* The estimates are not statistically significant at the 95% confidence level.
As shown in Figure 14, former claimants who participated in Skills Development and Targeted Wage Subsidies between 2002 and 2005 increased their use of EI following participation. This indicates the inability of some former claimants to maintain the employment secured in the short-term. It can also be argued that the increase in EI use is an indication of increase labour market attachment for this client group since they did experience increases in employment earnings and incidence of employment as well as a decrease in the use of social assistance. As a reminder, former claimants are participants for whom the EI benefit period ended up to three years pre-participation.

Text description of Figure 14
| Cumulative Use of EI and Social Assistance | ||
|---|---|---|
| Employment Insurance | Social Assistance | |
| Skills Development | 497 | -910 |
| Targeted Wage Subsidies | 1515 | -1412 |
| Job Creation Partnership | 657* | -1320 |
* The estimate is not statistically significant at the 95% confidence level.
Social benefits of participation exceeded costs of investments for most interventions.
As shown in Table 3, social benefits to participation exceeded investment costs in a period ranging between the 2nd year of program participation to about 20 years after participation.
| Skills Development | Targeted Wage Subsidies | Job Creation Partnerships | Employment Assistance Services | |
|---|---|---|---|---|
| Active claimants | 7.8 | 3.9 | 8.4 | 9.3 |
| Former claimants | 14.3 | 2 | 19.9 | n/a |
4. Conclusions
The evaluation evidence presented and discussed in this report demonstrated that programs and services currently designed and delivered by the federal government (in the 2002 to 2005 period) and Ontario (starting in January 2007) under the LMDA are generally helping participants improve their labour market experience after participation. As such, evaluation evidence suggests that LMDA funded programming contributes to achieving Ontario’s strategic priorities.
Overall, incremental impacts demonstrate that programs and services are improving the labour market attachment of participants, including youth and older workers. As well, social benefits of participation exceeded the cost of investments for all interventions over time. Finally, providing Employment Assistance Services earlier during an EI claim (first four weeks) produced larger impacts on earnings and employment and facilitated earlier return to work. This demonstrates the importance of targeting early participation of EI active claimants.
Key informant interviews with service providers and program managers as well as the documents reviewed and the questionnaires filled by provincial representatives also revealed specific challenges and lessons learned about program design and delivery. Key challenges are highlighted below.
Skills Development program (currently delivered as Second Career)
Key informants identified the following challenges related to the design and delivery of the current Skills Development program (Second Career in Ontario):
- The perceived insufficient level of financial support (7 key informants)
- Participants with multiple barriers have more complex needs and often require additional time for assistance (3 key informants)
Skills Development –Apprentices
As presented in the report, existing Canadian literature showed that there is a fairly high non-completion rate among apprentices in Canada. Furthermore, literature revealed that despite the growth in apprenticeship registrations in Canada, there has not been a corresponding increase in completions. While program data does not provide reliable information on completion and non-completion rates of participants, key informants from Ontario overall agreed with the challenges identified in the literature and confirmed a high dropout rate. They provided the following reasons to explain why some participants drop out of the apprenticeship process:
- Financial barriers (5 key informants)
- Timing and location of training (3 key informants)
- Apprentices are often working for the same pay as journeymen and they are not motivated to write the final exam (3 key informants)
- Lack of ongoing case-management for apprentices (2 key informants)
To deal with these barriers, key informants identified the following supports to help apprentices access and complete their apprenticeship training:
- Pre-apprenticeship training would be beneficial to helping apprentices complete their training and increase the probability of success. The integration of Literacy and Basics Skills and employability skills (job retention, leadership skills, document use, conflict resolution, goal setting, etc.) components in pre-apprenticeship training are key components to ensuring success, especially for persons with multiple barriers (4 key informants).
- Providing handouts to apprentices with detailed information on the available supports and where to get help when needed (3 key informants).
- Increase awareness of the financial supports that are available for apprentices (3 key informants).
- Case managing apprentices for the full duration of the apprenticeship process would be beneficial to increasing the probability of completion (2 key informants).
Key informants were asked about challenges in relation to the design and delivery of the program or apprenticeship training in general and they identified the following challenges:
- Lack of awareness about the financial support available to apprentices (3 key informants)
- The amount of paperwork required when seeking financial support (3 key informants)
- Delays in confirming EI eligibility (3 key informants)
Employment Services
Key informants interviewed identified the following challenges they face with the provision and targeting of Employment Services:
- Challenges in accessing childcare and paying the cost of transportation to training (5 key informants)
- Data collection is challenging for some service providers (5 key informants)
- Lack of funds dedicated for the professional development of staff (4 key informants)
- Insufficient staff capacity can require the use of referrals, prevent the provision of job retention services, result in a waiting list, limit pre-employment services and also limit services to clients with multiple barriers (3 key informants)
5. Recommendations
Recommendations that emerged from the evaluation findings presented in this report are as followed:
Key informants reported that a lack of essential skills hinders participants from completing training. The relevance of providing literacy, essential skills and high school upgrading is well documented in the Canadian literature. Because these interventions have different objectives and may lead to very different labour market outcomes when compared to vocational or occupational training, reporting them separately is important.
Recommendation 1: It is recommended that these interventions be reported separately under the LMDA from other vocational or occupational training interventions given their unique objectives. Ontario, ESDC and other P/Ts should work together to define common categories Skills Development programming.
Overall, the LMDA evaluation was able to produce a sound assessment of EBSM effectiveness and efficiency because the team had access to rich data on EI claimants, EBSM participation data and Canada Revenue Agency taxation files. However, some data gaps limited the evaluation’s ability to assess how EBSMs operate. For example:
- Having access to data on whether participants are members of designated groups including Indigenous peoples, persons with disabilities and recent immigrants would be useful to inform policy development and program design.
- Little is also known about the various types of Employment Assistance Services provided under the LMDAs. These services can be very different in nature and it is possible that some may be more effective than others at helping participants to return to employment. For example, having access to a computer for researching jobs on its own may yield different impacts than receiving counselling and assistance to develop a return-to-work action plan.
Recommendation 2: Improvements in the data collection are recommended to address key program and policy questions of interest to the federal and provincial/territorial governments. Specifically:
- Collect data on whether participants are members of designated groups including Indigenous peoples, persons with disabilities and recent immigrants
- Collect data on the various types of services provided under Employment Assistance Services. Ontario, ESDC and other P/Ts should work together to define common categories for these services
- Collect detailed data on the cost of EBSM interventions
The study on the timing of Employment Assistance Services participation showed that receiving assistance early after starting an EI claim can lead to better labour market impacts. However, key informants reported insufficient level of funding to promote the program.
Recommendation 3: Consideration should be given to providing Ontario with timely access to data on new EI recipients for supporting targeting and increasing awareness.
The Job Creation Partnerships program was found to be particularly effective at improving the labour market attachment for active and former EI claimant participants. The evaluation has not yet examined the challenges and lessons learned regarding the design and delivery of this program. Therefore, a lot remains unknown about how this program operates and the factors that contribute to its effectiveness.
Recommendation 4: Consideration should be given to examine the design and delivery of Ontario Job Creation Partnerships in order to better understand how this program operates.
The Targeted Wage Subsidy program was found to be effective at improving the labour market attachment of active and former claimant participants. In Ontario, the number of participants in the program declined between 2003 to 2004 (n = 3,484), 2014 to 2015 (n = 1,806) and 2015 to 2016 (n = 2,677).
Recommendation 5: depending on ongoing labour market priorities and budget allocation across EBSM programs and services, Ontario may wish to explore to what extent challenge and lessons learned identified at the national level are applicable to the unique context in Ontario and if applicable, to explore ways of removing barriers to employer participation in the program.
References
Canada Employment Insurance Commission. Employment Insurance Monitoring and Assessment Reports. 2003 to 2004 to 2013 to 2014.
Coe, Patrick. “Apprenticeship programme requirements and apprenticeship completion rates in Canada.” Journal of Vocational Education and Training. 2013. 65(4): 575 to 605.
Employment and Social Development Canada. Analysis of Employment Benefits and Support Measures (EBSM) Profile, Outcomes and Incremental Impacts for 2007 to 2008 Participants in Ontario. Evaluation Directorate. January 23, 2015.
Employment and Social Development Canada. Analysis of Employment Benefits and Support Measures (EBSM) Profile, Outcomes and Incremental Impacts for the EI Claimant Category “Long-Tenured Workers” in Ontario. Evaluation Directorate. January 26, 2016.
Employment and Social Development Canada. Cost-Benefit Analysis of Employment Benefits and Support Measures Delivered in Ontario. Evaluation Directorate. November 13, 2015.
Employment and Social Development Canada. Effects of the Timing of Participation in Employment Assistance Services in Ontario. Evaluation Directorate. December 5, 2014.
Employment and Social Development Canada. Profile, Outcomes and Net Impacts of Employment Benefits and Support Measures (EBSM) Participants in Ontario. Evaluation Directorate. May 2014.
Employment and Social Development Canada. Stream 1 Study for 2013 to 2014: National Level Analysis of EBSM Incremental Impacts: Methodology Report. Evaluation Directorate. September 2013.
Employment and Social Development Canada. Study on Employment Services in Ontario. Evaluation Directorate. September 10, 2014.
Employment and Social Development Canada. Study on Skills Development – Apprenticeship in Ontario. Evaluation Directorate. June 20, 2016.
Employment and Social Development Canada. Study on the programming offered under the Skills Development Funding Stream in Ontario. Evaluation Directorate. June 14, 2016.
Government of Ontario. Published Plan and Annual Report: Ministry of Training, Colleges and Universities. 2016 to 2017.
Government of Ontario. Second Career Guidelines: Ministry of Training, Colleges and Universities. 2012.
LaRochelle-Côté, Sébastien and Sharanjit Uppal, "The Financial Well-Being of the Self-Employed," Perspectives on Labour and Income, vol. 23, no. 4, Winter 2011
Red Seal. Apprenticeship Completion, Certification and Outcomes. Ottawa: Red Seal, 2014.
Acronyms
| EBSM | Employment Benefits and Support Measures |
| EI | Employment Insurance |
| ESDC | Employment and Social Development Canada |
| LMDA | Labour Market Development Agreements |
| LMTA | Labour Market Transfer Agreements |
| P/Ts | Provinces and Territories |
Appendix A – Methodology
Qualitative data
Qualitative data reported in the Second Career, Ontario Skills Development- Apprentices and Employment Services studies were collected from key informant interviews with managers and service providers and a document/literature review. As well, questionnaires were completed by Ontario representatives for the Second Career and Ontario Skills Development- Apprentices studies. Table A1 provides the number of key informants interviewed.
Key informant interviews for the Employment Services study were conducted in 2013 while those for the Second Career and Ontario Skills Development- Apprentices studies were conducted in 2015.
| Studies | |||
|---|---|---|---|
| Number of key informant interviews (Managers and service providers) | Second Career | Ontario Skills Development- Apprentices | Employment Services |
| 8 | 7 | 16 | |
Quantitative methods
All quantitative analyses were conducted using linked administrative data from EI Part I (EI claim), EI Part II (EBSM participation data) and T1 and T4 taxation files for 100% of the participants in Ontario.
Incremental impacts
The incremental impact analysis compared the labour market experience of participants before and after their participation with that of a comparison group. The goal was to determine the direct effect of program participation on key labour market indicators (see Figure 1 in the introduction section).
For active claimants, incremental impacts were measured relative to a comparison group of active claimants who could have participated in the EBSMs but did not. Former claimants can be underemployed and unable to requalify for EI, out of the labour force for various reasons or on Social Assistance. Based on previous evaluation methodologies, on expert advice and given the difficulty in generating a suitable comparison for former claimants using administrative data alone, the comparison group for former claimants was created using individuals who participated in low-intensity Employment Assistance Services only during the reference period. This is a conservative approach given the fact that participation in Employment Assistance Services can lead to limited effects on labour market outcomes.
Participants and non-participants were matched based on a wide array of variables including age, sex, location, skill level required by the last occupation held prior to participation, reason for separation from employment, industry in which they were previously employed as well as employment earnings and use of EI and social assistance for each of the five years before participation.
All analyses were conducted using a unit of analysis called the Action Plan Equivalent, which combines all EBSMs given to an individual within no more than six months of each other. For reporting purposes, incremental impacts were attributed to the longest intervention of the Action Plan Equivalent when Skills Development, Targeted Wage Subsidies, Job Creation Partnerships or Self-Employment Benefit was the longest intervention. Impacts for Employment Assistance Services were calculated for Action Plan Equivalent that contained only Employment Assistance Services with no employment benefits.
The incremental impact estimates were produced using non-experimental methods, namely propensity score matching, using the Kernel Matching method, along with Difference-in-Differences method to estimate program impacts. Alternative matching techniques (such as, the Nearest Neighbour and the Inverse Propensity Weighting) were also used for validation purposes.
Incremental impacts were measured for the following indicators:
- Employment/self-employment earnings represent the total earnings an individual had from paid employment and/or self-employment. (This information is available by calendar year and is obtained from T1 and T4 tax return records.)
- Incidence of employment/self-employment represents the incidence of having earnings from employment and/or self-employment
- Amount of EI benefits received represents the average amount of EI benefits received
- Weeks in receipt of EI benefits represents the average number of weeks during which EI benefits were received
- SA benefits represent the average amount of social assistance benefits received. (This information is available by calendar year and is obtained from T1 tax return records.)
- Dependence on income support represents the ratio of participant’s income that came from EI and social assistance benefits (in other words, EI benefits + social assistance benefits / (EI benefits + social assistance benefits + earnings from employment/self/employment))
Incremental impacts were estimated for different cohorts of participants:
- All active and all former claimants as well as youth (under 30 years old) and older workers (55 years old and over) who started their EBSM participation between April 1, 2002 and March 31, 2005
- All active and all former claimants who stated their EBSM participation between January 1, 2007 and December 31, 2008
- Active and former claimants who were long-tenured workers and who started their EBSM participation between January 1, 2007 and December 31, 2009. The long-tenured workers covered in this study are individuals who have established an EI regular or fishing benefit claimants and who had paid at least 30% of the annual maximum employee EI premiums in seven of the ten years preceding their EI claim and who had collected 35 or fewer weeks of EI regular or fishing benefits in the five years preceding their claim. This definition is similar to the EI claimant category long-tenured workers introduced under Connecting Canadians with Available Jobs.
Cost-benefit analysis
The cost-benefit analysis compared how much it cost for individuals to participate in the programs and how much it costs the government to deliver those programs with the benefits both the participants and the government drew from those programs. The analysis was carried out from the society perspective which combines the costs and the benefits for both the participants and the government.
Costs and benefits included in the calculations were as follows:
- Program costs included the administration cost and the direct cost of the EBSMs. The cost for each EBSM was calculated at the Action Plan Equivalent level. The costs were determined based on the average composition of the Action Plan Equivalent.
- The Marginal Social Cost of Public Funds represented the loss incurred by society when raising additional revenues such as taxes to fund government spending. The value was estimated as 20% of the program cost, sales taxes, income taxes, impacts on EI and impacts on social assistance paid or collected by the government.
- Employment earnings consisted of incremental impacts on participants’ earnings during and after participation. The calculation accounts for the participant’s forgone earnings during participation (in other words, opportunity cost). These are based on incremental impacts for the 2002 to 2005 participants.
- Fringe benefits included benefits such as employer-paid health and life insurance as well as pension contributions. The rate used to calculate the fringe benefits was 15% of the incremental impact on earnings.
The program effects on EI and social assistance use, and the sale and income tax revenues were not included in the calculations since these costs and benefits cancel each other out from the social perspective by definition. For example, while EI and social assistance are benefits received by participants, they represent a cost for the government. However, as indicated above, these effects are accounted for in the calculation of the Marginal Social Cost of Public Funds.
When producing the results, to bring all costs and benefits to a common base and to account for inflation and interest on foregone government investment, the estimates for the second year of participation and up to the sixth year post-program were discounted by 5% per year. As well, when the benefits were still lower than the costs six years after program end, the payback period was calculated by assuming that the average benefit or cost measured over the fifth and six year post-program would persist over time (discounted at a 5% annual rate).
Strengths and limitations from the studies
Overall, the number of key informants interviewed was relatively small in some studies. The key informants’ responses were representative of their own experience and their own region but it is unclear if they were fully representative of the entire province.
The matching process led to the creation of comparison groups closely matched to the LMDA participants in terms of their background characteristics. Results obtained with Kernel Matching were validated with the use of two other techniques (Inverse Propensity Weighting and Nearest Neighbour), increasing the level of confidence in the results. However, readers should be aware that incremental impacts may be affected by factors not captured by the matching process. For example, the motivation to seek employment was not directly measured except to the extent it was captured in prior income and labour market attachment patterns.
Readers should also keep in mind that it is not possible to compare the results obtained for each claimant type since the results for active claimants represent the effects of the EBSMs relative to non-participation while the results for former claimants represents the Employment Benefits relative to a limited treatment (in other words, those who participated exclusively in Employment Assistance Services).
The definition of long-tenured workers used in this report differs from the definition used in the literature as it does not consider the number of years the worker remained employed with the same employer.
The cost-benefit analysis was limited in the sense that it only took into account the quantifiable benefits and costs that were directly linked to EBSM delivery and participation and that could be estimated using available administrative data and the EI Monitoring and Assessment Report. The analysis did not capture “intangible”, non-pecuniary and indirect benefits. It did not consider the multiplier effect that improving participant’s income may have on the economy and did not account for the effect of EI Part II investment on sustaining a service delivery infrastructure and creating jobs among the governmental program service providers. As well, this analysis did not consider the displacement effect where participants may take away jobs that would otherwise be filled by other unemployed individuals. Finally, this analysis did not consider the possible effect of EBSMs on increasing skill prices.
Appendix B - Detailed result Skills DevelopmentFootnote 16
| Active claimants | Former claimants | |||
|---|---|---|---|---|
| 2002 to 2005 | 2007 to 2008 | 2002 to 2005 | 2007 to 2008 | |
| Number of observations | 29,496 | 17,015 | 7,909 | 4,634 |
| Gender | ||||
| Male | 51% | 44% | 48% | 38% |
| Female | 48% | 56% | 51% | 62% |
| Age | ||||
| Under 25 | 11% | 8% | 10% | 6% |
| 25-34 | 31% | 26% | 35% | 30% |
| 35-44 | 34% | 36% | 33% | 37% |
| 45-54 | 19% | 24% | 17% | 21% |
| 55 and over | 4% | 5% | 4% | 6% |
| Skills level related to National Occupation Code associated with the last EI claim opened before program participation1 | ||||
| Managerial | 4% | 5% | 3% | 4% |
| University | 6% | 4% | 8% | 4% |
| College or apprenticeship training | 22% | 22% | 19% | 20% |
| Secondary school or occupational training | 41% | 45% | 42% | 45% |
| On-the-job training | 26% | 25% | 28% | 28% |
| Keylabour market indicators in the year preceding the start of participation | ||||
| Earnings including $02 | $22,903 | $24,3283 | $9,748 | $11,7033 |
| Proportion Employed | 97% | 99% | 79% | 82% |
| Proportion on EI | 39% | 38% | 66% | 69% |
| Proportion on SA | 6% | 4% | 22% | 15% |
Proportions may not add up to 100% due to rounding
1Skill level corresponds to the type and/or amount of training or education typically required to work in the last occupation participants had before opening the last EI claim they had before participating in EBSMs:
-Managerial: Management occupations
-University: Occupations usually requiring university education (i.e., University degree at the bachelor's, master's or doctorate level)
-College or apprenticeship training: Occupations usually requiring college or vocational education or apprenticeship training such as 2 to 3 years of post-secondary education at a community college, institute of technology or CEGEP or 2 to 5 years of apprenticeship training or 3 to 4 years of secondary school and more than 2 years of on-the-job training, specialized training courses or specific work experience and/or occupations with supervisory responsibilities and occupations with significant health and safety responsibilities, such as firefighters, police officers and registered nursing assistants.
-Secondary or occupational training: Occupations usually requiring secondary school and/or occupation-specific training such as one to four years of secondary school education or up to 2 years of on-the-job training specialized training courses or specific work experience.
-On-the-job training: On-the-job training is usually provided for occupations (i.e., short work demonstration or on-the-job training or no formal educational requirements).
2The average earnings includes participants who reported $0 earnings during that year.
3Earnings have been adjusted according to the Consumer Price Index, published by Statistics Canada, to the 2002 base year.
| Indicators | In-program period | Post-program period | Total in- and post-program | ||||||
|---|---|---|---|---|---|---|---|---|---|
| Program start year | Additional year | 1st year | 2nd year | 3rd year | 4th year | 5th year | Total post | ||
| All active claimants | |||||||||
| 2002-2005 participants (n= 20,647 or 80% of participants) | |||||||||
| Employment earnings ($) | -$5,679*** | -$3,447*** | $817*** | $2,190*** | $2,940*** | $3,368*** | $3,711*** | $13,026*** | $3,899*** |
| Incidence of employment (percentage points) |
-4.2*** | -0.5*** | 3.8*** | 4.4*** | 4.4*** | 4.5*** | 5.1*** | n/a | n/a |
| EI benefits ($) | $2,475*** | $437*** | -$469*** | -$255*** | -$181*** | -$100*** | -$111*** | -$1,116*** | $1,797*** |
| EI weeks (weeks) | 7.8*** | 1.4*** | -1.6*** | -0.8*** | -0.6*** | -0.3*** | -0.4*** | -3.6*** | 5.6*** |
| Social Assistance benefits ($) | $17 | $108*** | $20 | -$33 | -$47* | -$65** | -$85*** | -$211* | -$86 |
| Dependence on income support (percentage points) | 17.7*** | 6.2*** | -2.4*** | -1.9*** | -1.6*** | -1.4*** | -1.5*** | n/a | n/a |
| 2007 to 2008 participants (n=17,015) | |||||||||
| Employment earnings ($) | -$7,062*** | -$7,883*** | -$1,959*** | $379 | $1,607*** | - | - | $14 | -$14,909*** |
| Incidence of employment (percentage points) |
-5.7*** | -5.9*** | 4.2*** | 5.4*** | 6.0*** | - | - | n/a | n/a |
| EI benefits ($) | $2,152*** | -$155** | -$799*** | -$233*** | -$187*** | - | - | -$1,219*** | $778*** |
| EI weeks (weeks) | 5.4*** | -1.1*** | -2.3*** | -0.6*** | -0.5*** | - | - | -3.4*** | 1.0* |
| Social Assistance benefits ($) | $87*** | $43* | $2 | -$58** | -$69** | - | - | -$125* | $5 |
| Dependence on income support (percentage points) | 18.1*** | 8.0*** | -4.1*** | -1.3*** | -1.1*** | - | - | n/a | n/a |
| Sub-groups of active claimants | |||||||||
| Youth (below 30 years old) – 2002 to 2005 participants (n=7,600) | |||||||||
| Employment earnings ($) | -$4,440*** | -$2,400*** | $1,597*** | $3,020*** | $3,481*** | $3,809*** | $3,880*** | $15,787*** | $8,947*** |
| Incidence of employment (percentage points) |
-3*** | 0.6*** | 3.4*** | 3.7*** | 3.8*** | 3.5*** | 3.6*** | n/a | n/a |
| EI benefits ($) | $2,017*** | $306*** | -$477*** | -$272*** | -$176*** | -$56 | -$77 | -$1,057*** | $1,266*** |
| EI weeks (weeks) | 7*** | 1.3*** | -1.6*** | -0.8*** | -0.6*** | -0.2 | -0.3** | -3.4*** | 4.9*** |
| Social Assistance benefits ($) | -$41** | -$6 | -$71*** | -$102*** | -$92*** | -$104*** | -$118*** | -$487*** | -$534*** |
| Dependence on income support (percentage points) | 15.2*** | 4.6*** | -3.4*** | -2.3*** | -1.6*** | -1.1*** | -2*** | n/a | n/a |
| Older Workers (55 years old and over) - 2002 to 2005 participants (n=1,240) | |||||||||
| Employment earnings ($) | -$5,520*** | -$2,629*** | $1,301** | $2,494*** | $2,974*** | $3,415*** | $3,847*** | $14,030*** | $5,881 |
| Incidence of employment (percentage points) |
-2.3* | 0.5 | 7.6*** | 9.3*** | 11.4*** | 11.8*** | 11.5*** | n/a | n/a |
| EI benefits ($) | $3,030*** | $488*** | -$189** | $105 | $316*** | $357*** | $425*** | $1,016*** | $4,533*** |
| EI weeks (weeks) | 9.1*** | 1.2*** | -0.7*** | 0.5*** | 1.0*** | 1.2*** | 1.3*** | 3.2*** | 13.5*** |
| Social Assistance benefits ($) | -$90** | $157*** | $105** | $106* | $91 | $107* | $85 | $494* | $561* |
| Dependence on income support (percentage points) | 18.1*** | 5.8*** | 0.9*** | 2.5*** | 2.8*** | 3.9*** | 5.1*** | n/a | n/a |
| Long-Tenured Workers - 2007 to 2009 participants (n=17,879) | |||||||||
| Employment earnings ($) | -$10,282*** | -$9,342*** | -$2,472*** | $438 | $1,865*** | - | - | -$169 | -$19,793*** |
| Incidence of employment (percentage points) |
-5.7*** | -4.1*** | 3.5*** | 4.7*** | 5.9*** | - | - | n/a | n/a |
| EI benefits ($) | $3,658*** | $1,018*** | -$561*** | -$239*** | -$136** | - | - | -$937*** | $3,739*** |
| EI weeks (weeks) | 8.1*** | 1.8*** | -1.5*** | -0.6*** | -0.4** | - | - | -2.4*** | 7.5*** |
| Social Assistance benefits ($) | -$7 | $8 | $7 | -$30* | -$41** | - | - | -$64 | -$62 |
| Dependence on income support (percentage points) | 21.5*** | 9.6*** | -3.1*** | -2.2*** | -1.6*** | - | - | n/a | n/a |
Significance level *** 1%; ** 5%; * 10%
| Indicators | In-program period | Post-program period | Total in- and post-program | ||||||
|---|---|---|---|---|---|---|---|---|---|
| Program start year | Additional year | 1st year | 2nd year | 3rd year | 4th year | 5th year | Total post | ||
| All active claimants | |||||||||
| 2002 to 2005 participants (n=7,909) | |||||||||
| Employment earnings ($) | -$2,566*** | -$2,093*** | $659*** | $1,029*** | $1,205*** | $1,398*** | $1,164*** | $5,456*** | $797 |
| Incidence of employment (percentage points) |
-11.3*** | -2.2*** | 3.0*** | 2.8*** | 2.3*** | 2.5*** | 2.2*** | n/a | n/a |
| EI benefits ($) | $353*** | -$83*** | -$51 | $113*** | $158*** | $135*** | $142*** | $497*** | $767*** |
| EI weeks (weeks) | 1.2*** | -0.5*** | -0.3*** | 0.3*** | 0.4*** | 0.3** | 0.2* | 0.9** | 1.6*** |
| Social Assistance benefits ($) | $92** | $16 | -$141*** | -$183*** | -$197*** | -$181*** | -$208*** | -$910*** | -$802*** |
| Dependence on income support (percentage points) | 9.7** | 0.1 | -2.3*** | -1.5*** | -1.6*** | -1.4*** | -1.8*** | n/a | n/a |
| 2007 to 2008 participants (n=4,634) | |||||||||
| Employment earnings ($) | -$3,553*** | -$5,096*** | -$1,549*** | -$196 | $432 | - | - | -$1,334 | -$9,997*** |
| Incidence of employment (percentage points) |
-14.3*** | -7.2*** | 2.4*** | 3.5*** | 4.3*** | - | - | n/a | n/a |
| EI benefits ($) | $536*** | -$241*** | -$348*** | $79 | $161*** | - | - | -$108 | $187 |
| EI weeks (weeks) | 1.5*** | -1.1*** | -1.3*** | 0.2 | 0.3* | - | -0.8* | -0.4 | |
| Social Assistance benefits ($) | -$115*** | -$159*** | -$247*** | -$225*** | -$211*** | - | - | -$682*** | -$960*** |
| Dependence on income support (percentage points) | 10.2*** | -0.5 | -5.1*** | -2.0*** | -1.1* | - | - | n/a | n/a |
| Sub-groups of active claimants | |||||||||
| Youth (below 30 years old) – 2002 to 2005 participants (n=2,193) | |||||||||
| Employment earnings ($) | -$1,842*** | -$930*** | $1,386*** | $1,811*** | $1,901*** | $1,904*** | $1,661*** | $8,662*** | $5,890*** |
| Incidence of employment (percentage points) |
-9*** | 0.1 | 3.2*** | 4.4*** | 3.0*** | 3.7*** | 3.9*** | n/a | n/a |
| EI benefits ($) | $365*** | -$8 | -$24 | $76 | $280*** | $160* | $65 | $557** | $913*** |
| EI weeks (weeks) | 1.1*** | -0.5** | -0.4* | 0.0 | 0.5** | 0.0 | -0.2 | -0.2 | 0.4 |
| Social Assistance benefits ($) | $132** | -$24 | -$136** | -$237*** | -$243*** | -$188** | -$271*** | -$1,075*** | -$967** |
| Dependence on income support (percentage points) | 7.6*** | -1.6** | -2.4*** | -3.2*** | -1.9** | -1.7* | -3.1*** | n/a | n/a |
| Older Workers (55 years old and over) - 2002 to 2005 participants (n=323) | |||||||||
| Employment earnings ($) | -$2,813*** | -$1,417 | $1,292 | $2,245** | $2,634** | $3,582*** | $3,278*** | $13,032** | $8,802 |
| Incidence of employment (percentage points) |
-8.7*** | -0.9 | 3.7 | 4.5 | 3.4 | 6.3** | 9.4*** | n/a | n/a |
| EI benefits ($) | $492** | -$194 | -$70 | $108 | $37 | $111 | $262 | $448 | $746 |
| EI weeks (weeks) | 1.6** | -0.8** | -0.3 | 0.5 | 0.1 | 0.1 | 0.5 | 0.9 | 1.7 |
| Social Assistance benefits ($) | $32 | $76 | -$128 | -$64 | $23 | $93 | $14 | -$63 | $45 |
| Dependence on income support (percentage points) | 10.8*** | -0.5 | -2.3 | 0.1 | 0.9 | 0 | 1.1 | n/a | n/a |
| Long-Tenured Workers - 2007 to 2009 participants (n=3,520) | |||||||||
| Employment earnings ($) | -$4,481*** | -$5,756*** | -$1,273** | $114 | $552 | -- | -- | -$606 | -$10,841*** |
| Incidence of employment (percentage points) |
-14.3*** | -5.3*** | 3.3*** | 5.0*** | 3.5*** | -- | -- | n/a | n/a |
| EI benefits ($) | $527*** | -$176** | -$265*** | $125 | $79 | -- | -- | -$60 | $291 |
| EI weeks (weeks) | 1.3*** | -0.9*** | -0.8*** | 0.4 | 0.2 | -- | -- | -0.3 | 0.2 |
| Social Assistance benefits ($) | -$246*** | -$171*** | -$168*** | -$119** | -$122** | -- | -- | -$409** | -$826*** |
| Dependence on income support (percentage points) | 11.0*** | -1.6** | -4.4*** | -1.2 | -0.5 | -- | -- | n/a | n/a |
Significance level *** 1%; ** 5%; * 10%
| Total costs and benefits over participation (1 to 2 years) and 6 years post-program | Active claimants (n=20,647)1 |
Former claimants(n=7,909) |
|---|---|---|
| Program cost | -$8,686 | -$8,272 |
| Marginal social costs of public funds | -$1,969 | -$1,525 |
| Employment earnings (including participant’s forgone earnings) | $4,379 | $1,166 |
| Fringe benefit | $657 | $175 |
| Net present value (By how much do the benefits exceed the costs within 6 years after participation?) |
-$5,619 | -$8,456 |
| Cost-benefit ratio (How much does it cost in EI part II funds to achieve $1 in benefit 6 years after participation?) |
$2.80 | Negative benefits |
| Payback period (How many years after participation would it take for the benefits to recover the costs?) |
7.8 years after participation | 14.3 years after participation |
1Random sample of approximately 80% of participants.
Appendix C - Detailed results Skills Development-Apprentices
| Active claimants | Former claimants | |||
|---|---|---|---|---|
| 2003 to 2005 | 2013 to 2014 | 2003 to 2005 | 2013 to 2014 | |
| Number of observations | 11,765 | 2,236 | 370 | 220 |
| Gender | ||||
| Male | 96% | 97% | 91% | 92% |
| Female | 4% | 3% | 9% | 6% |
| Age | ||||
| Under 25 | 50% | 13% | 30% | 16% |
| 25-34 | 38% | 60% | 44% | 60% |
| 35-44 | 10% | 22% | 19% | 20% |
| 45-54 | 2% | 5% | 7% | 3% |
| 55 and over | 0% | 1% | 1% | 1% |
| Skills level related to National Occupation Code associated with the last EI claim opened before program participation1 | ||||
| Managerial | 0% | 0% | 1% | 0% |
| University | 1% | 0% | 2% | 0% |
| College or apprenticeship training | 87% | 88% | 48% | 72% |
| Secondary school or occupational training | 4% | 3% | 21% | 10% |
| On-the-job training | 8% | 8% | 28% | 17% |
| Key labour market indicators in the year preceding the start of participation | ||||
| Earnings including $02 | $26,891 | $32,9063 | $16,535 | $23,7883 |
| Proportion Employed | 100% | 100% | 89% | 97% |
| Proportion on EI | 19% | 41% | 52% | 56% |
| Proportion on SA | 1% | 2% | 7% | 11% |
Proportions may not add up to 100% due to rounding.
1Skill level corresponds to the type and/or amount of training or education typically required to work in the last occupation participants had before opening the last EI claim they had before participating in EBSMs:
-Managerial: Management occupations
-University: Occupations usually requiring university education (that is, university degree at the bachelor's, master's or doctorate level)
-College or apprenticeship training: Occupations usually requiring college or vocational education or apprenticeship training such as 2 to 3 years of post-secondary education at a community college, institute of technology or CEGEP or 2 to 5 years of apprenticeship training or 3 to 4 years of secondary school and more than 2 years of on-the-job training, specialized training courses or specific work experience and/or occupations with supervisory responsibilities and occupations with significant health and safety responsibilities, such as firefighters, police officers and registered nursing assistants.
- Secondary or occupational training: Occupations usually requiring secondary school and/or occupation-specific training such as 1 to 4 years of secondary school education or up to 2 years of on-the-job training specialized training courses or specific work experience.
-On-the-job training: On-the-job training is usually provided for occupations (that is, short work demonstration or on-the-job training or no formal educational requirements).
2The average earnings include participants who reported $0 earnings during that year.
3Earnings for 2013 to 2014 participants have been adjusted according to the Consumer Price Index published by Statistics Canada, to the 2002 base year.
| Average outcomes | Pre-program period | After the program start year | Average annual outcomes pre- | Average annual outcomes post- | Change | |||||||||||
|---|---|---|---|---|---|---|---|---|---|---|---|---|---|---|---|---|
| 5 year pre | 4 year pre | 3 year pre | 2 year pre | 1 year pre | Program start year | 1 year | 2 year | 3 year | 4year | 5 year | 6 year | 7 year | ||||
| 2003 to 2005 participants (n=9,129)1 | ||||||||||||||||
| Earnings including $0 | $14,654 | $17,697 | $20,035 | $23,852 | $29,370 | $27,936 | $34,211 | $39,664 | $45,768 | $50,284 | $50,796 | $52,758 | $55,135 | $21,122 | $46,945 | $25,824 |
| Earnings excluding $02 | $15,509 | $18,422 | $20,670 | $24,291 | $29,419 | $28,058 | $34,630 | $40,374 | $47,350 | $52,605 | $53,794 | $56,311 | $59,242 | $21,662 | $49,187 | $27,524 |
| Proportion employed | 95% | 96% | 97% | 98% | 100% | 100% | 99% | 98% | 97% | 96% | 94% | 94% | 93% | 97% | 96% | -1% |
| Proportion on EI | 14% | 18% | 23% | 21% | 21% | 99% | 65% | 56% | 40% | 31% | 30% | 28% | 25% | 19% | 39% | 20% |
| EI benefits | $447 | $595 | $859 | $736 | $680 | $3,537 | $2,559 | $2,231 | $1,704 | $1,454 | $1,766 | $1,620 | $1,373 | $663 | $1,815 | $1,152 |
| Number of weeks on EI | 1.65 | 2 | 2.78 | 2.33 | 2.1 | 10.67 | 7.24 | 5.96 | 4.39 | 3.6 | 4.28 | 3.88 | 3.1 | 2.17 | 4.64 | 2.46 |
| Proportion on social assistance | 4% | 3% | 2% | 2% | 1% | 1% | 1% | 1% | 1% | 2% | 2% | 2% | 2% | 2% | 2% | -1% |
| SA benefits | $135 | $95 | $71 | $54 | $27 | $14 | $30 | $37 | $46 | $68 | $88 | $86 | $114 | $76 | $67 | -$9 |
| Dependence on income support | 4% | 4% | 5% | 4% | 3% | 13% | 9% | 7% | 6% | 5% | 6% | 6% | 5% | 4% | 6% | 2% |
| Proportion self employed | 8% | 10% | 11% | 16% | 24% | 29% | 31% | 31% | 32% | 33% | 33% | 34% | 35% | 14% | 33% | 19% |
1Excluding individuals with no CRA data for the 5 years before participation.
2Earnings outcomes excluding individuals who reported no earnings in a given year.
| Average outcomes | Pre-program period | After the program start year | Average annual outcomes pre- | Average annual outcomes post- | Change | |||||||||||
|---|---|---|---|---|---|---|---|---|---|---|---|---|---|---|---|---|
| 5 year pre | 4 year pre | 3 year pre | 2 year pre | 1 year pre | Program start year | 1 year | 2 year | 3 year | 4year | 5 year | 6 year | 7 year | ||||
| 2003 to 2005 participants (n=327)1 | ||||||||||||||||
| Earnings including $0 | $15,456 | $18,292 | $19,044 | $20,947 | $16,779 | $17,852 | $24,550 | $29,386 | $33,465 | $34,533 | $33,624 | $36,091 | $37,838 | $18,104 | $32,784 | $14,680 |
| Earnings excluding $02 | $16,875 | $19,451 | $19,675 | $22,212 | $19,020 | $19,663 | $26,868 | $32,057 | $37,238 | $39,059 | $39,098 | $41,328 | $44,460 | $19,447 | $37,158 | $17,712 |
| Proportion employed | 92% | 94% | 97% | 94% | 88% | 91% | 91% | 92% | 90% | 88% | 86% | 87% | 85% | 93% | 88% | -5% |
| Proportion on EI | 18% | 28% | 42% | 45% | 53% | 35% | 43% | 48% | 42% | 38% | 42% | 39% | 41% | 37% | 42% | 5% |
| EI benefits | $796 | $1,016 | $1,643 | $1,790 | $2,950 | $1,409 | $1,786 | $2,141 | $2,021 | $2,236 | $2,773 | $2,451 | $2,589 | $1,639 | $2,285 | $646 |
| Number of weeks on EI | 2.66 | 3.66 | 5.74 | 5.92 | 9.01 | 4.39 | 5.42 | 5.98 | 5.17 | 5.43 | 6.76 | 5.71 | 5.03 | 5.40 | 5.64 | 0.24 |
| Proportion on social assistance | 12% | 8% | 7% | 6% | 7% | 11% | 10% | 5% | 6% | 7% | 12% | 9% | 10% | 8.0% | 8.4% | 0.4% |
| SA benefits | $576 | $342 | $246 | $208 | $259 | $426 | $359 | $298 | $334 | $443 | $594 | $608 | $598 | $326 | $462 | $136 |
| Dependence on income support | 11% | 9% | 12% | 12% | 23% | 14% | 11% | 10% | 12% | 12% | 15% | 14% | 17% | 13% | 13% | 0% |
| Proportion self employed | 10% | 12% | 12% | 16% | 16% | 22% | 26% | 26% | 33% | 30% | 32% | 33% | 37% | 13% | 31% | 18% |
1Excluding individuals with no CRA data for the 5 years before participation.
2Earnings outcomes excluding individuals who reported no earnings in a given year.
Appendix D - Detailed results Targeted Wage Subsidies
| Active claimants | Former claimants | |||
|---|---|---|---|---|
| 2002 to 2005 | 2007 to 2008 | 2002 to 2005 | 2007 to 2008 | |
| Number of observations | 4,497 | 2,530 | 4,685 | 1,875 |
| Gender | ||||
| Male | 57% | 53% | 56% | 52% |
| Female | 42% | 47% | 43% | 48% |
| Age | ||||
| Under 25 | 8% | 8% | 9% | 9% |
| 25-34 | 28% | 25% | 32% | 28% |
| 35-44 | 34% | 29% | 30% | 28% |
| 45-54 | 24% | 27% | 21% | 24% |
| 55 and over | 7% | 10% | 7% | 10% |
| Skills level related to National Occupation Code associated with the last EI claim opened before program participation1 | ||||
| Managerial | 6% | 8% | 6% | 6% |
| University | 8% | 5% | 8% | 6% |
| College or apprenticeship training | 29% | 32% | 26% | 29% |
| Secondary school or occupational training | 38% | 36% | 37% | 38% |
| On-the-job training | 19% | 18% | 24% | 21% |
| Key labour market indicators in the year preceding the start of participation | ||||
| Earnings including $02 | $24,018 | $26,1233 | $13,755 | $14,8883 |
| Proportion Employed | 96% | 99% | 84% | 86% |
| Proportion on EI | 41% | 42% | 62% | 66% |
| Proportion on SA | 5% | 4% | 12% | 11% |
Proportions may not add up to 100% due to rounding.
1Skill level corresponds to the type and/or amount of training or education typically required to work in the last occupation participants had before opening the last EI claim they had before participating in EBSMs:
-Managerial: Management occupations
-University: Occupations usually requiring university education (that is, university degree at the bachelor's, master's or doctorate level)
-College or apprenticeship training: Occupations usually requiring college or vocational education or apprenticeship training such as 2 to 3 years of post-secondary education at a community college, institute of technology or CEGEP or 2 to 5 years of apprenticeship training or 3 to 4 years of secondary school and more than 2 years of on-the-job training, specialized training courses or specific work experience and/or occupations with supervisory responsibilities and occupations with significant health and safety responsibilities, such as firefighters, police officers and registered nursing assistants.
- Secondary or occupational training: Occupations usually requiring secondary school and/or occupation-specific training such as 1 to 4 years of secondary school education or up to 2 years of on-the-job training specialized training courses or specific work experience.
-On-the-job training: On-the-job training is usually provided for occupations (that is, short work demonstration or on-the-job training or no formal educational requirements).
2The average earnings includes participants who reported $0 earnings during that year.
3Earnings for 2007-2008 participants have been adjusted according to the Consumer Price Index, published by Statistics Canada, to the 2002 base year.
| Indicators | In-program period | Post-program period | Total in- and post-program | ||||||
|---|---|---|---|---|---|---|---|---|---|
| Program start year | Additional year | 1st year | 2nd year | 3rd year | 4th year | 5th year | Total post | ||
| All active claimants | |||||||||
| 2002 to 2005 participants (n= 4,496) | |||||||||
| Employment earnings ($) | -$2,103*** | $1,868*** | $2,223*** | $2,816*** | $4,507*** | $3,657*** | $4,035*** | $17,239*** | $17,004*** |
| Incidence of employment (percentage points) |
4.8*** | 8.7*** | 7.1*** | 7.3*** | 7.4*** | 6.7*** | 7.3*** | n/a | n/a |
| EI benefits ($) | $604*** | -$539*** | -$89* | -$79*** | -$149 | $37 | $5 | -$276* | -$210 |
| EI weeks (weeks) | 1.6*** | -1.6*** | -0.1 | -0.1 | -0.4*** | 0.2 | 0.1 | -0.3 | -0.3 |
| Social Assistance benefits ($) | -$40 | -$45 | -$65** | -$39 | -$42 | -$43 | -$48 | -$237* | -$322* |
| Dependence on income support (percentage points) | 3.0*** | -4.8*** | -0.1 | -0.3 | -0.8 | 0.2 | -0.4 | n/a | n/a |
| 2007 to 2008 participants (n=2,530) | |||||||||
| Employment earnings ($) | -$1,675** | $1,611 | $2,176* | $2,439* | $2,650* | - | - | $7,437** | $7,576 |
| Incidence of employment (percentage points) |
3.5** | 6.7*** | 7.3*** | 11.3*** | 8.6*** | - | - | n/a | n/a |
| EI benefits ($) | -$84 | -$147 | $442* | $61 | -$104 | - | - | $399 | $169 |
| EI weeks (weeks) | -1.3 | -0.6 | 1.4* | 0.2 | 0.0 | - | - | 1.7 | -0.2 |
| Social Assistance benefits ($) | -$46* | -$46 | -$74** | -$88** | -$36 | - | - | -$211** | -$308** |
| Dependence on income support (percentage points) | -1.1 | -2.1 | 2.2 | -0.5 | 1.3 | - | - | n/a | n/a |
| Sub-groups of active claimants | |||||||||
| Youth (below 30 years old) – 2002 to 2005 participants (n=947) | |||||||||
| Employment earnings ($) | -$993*** | $3,025*** | $2,318*** | $2,122*** | $7,430* | $2,234*** | $3,156*** | $17,260*** | $19,292*** |
| Incidence of employment (percentage points) |
3.2*** | 6.6*** | 4.3*** | 2.8** | 2.9** | 2.5* | 3.3** | n/a | n/a |
| EI benefits ($) | -$70 | -$876*** | -$354*** | -$76 | -$171 | $272* | $144 | -$185 | -$1,131*** |
| EI weeks (weeks) | -0.6* | -2.9*** | -0.9*** | -0.1 | -0.4 | 0.7* | 0.4 | -0.3 | -3.9*** |
| Social Assistance benefits ($) | $21 | -$31 | -$115** | -$47 | -$87 | -$66 | -$84 | -$398 | -$408 |
| Dependence on income support (percentage points) | -2.2** | -9.3*** | -2.7*** | -0.8 | -1.3 | 1.1 | -0.8 | n/a | n/a |
| Older Workers (55 years old and over) – 2002 to 2005 participants (n=318) | |||||||||
| Employment earnings ($) | -$2,959*** | $1,446 | $3,078*** | $4,477*** | $5,147*** | $4,374*** | $4,322*** | $21,397*** | $19,884*** |
| Incidence of employment (percentage points) |
6.1*** | 11.8*** | 13.2*** | 14.4*** | 16.6*** | 16.4*** | 15.9*** | n/a | n/a |
| EI benefits ($) | $1,934*** | $150 | $317* | $280 | $506*** | $998*** | $721*** | $2,821*** | $4,905*** |
| EI weeks (weeks) | 5.3*** | 0.5* | 1.1** | 1.2*** | 1.6*** | 3.3*** | 2.7*** | 9.8*** | 15.6*** |
| Social Assistance benefits ($) | -$28 | $53 | $140 | $281** | $129 | $106 | $52 | $708 | $732 |
| Dependence on income support (percentage points) | 5.9*** | -3.2 | 1.6 | 0.9 | 1.0 | 5.9*** | 4.9*** | n/a | n/a |
| Long-Tenured Workers - 2007 to 2009 participants (n=4,428) | |||||||||
| Employment earnings ($) | -$4,021*** | -$3,126*** | -$1,105*** | -$461 | $153 | -- | -- | -$1,365 | -$8,482** |
| Incidence of employment (percentage points) |
3.3*** | -0.4 | 0.5 | 1.3* | 1.3* | -- | -- | n/a | n/a |
| EI benefits ($) | $1,345*** | $572*** | -$217*** | -$58 | -$21 | -- | -- | -$296** | $1,620*** |
| EI weeks (weeks) | 2.7*** | 1.1*** | -0.5*** | -0.1 | -0.1 | -- | -- | -0.7** | 3.1*** |
| Social Assistance benefits ($) | $14 | $40** | $6 | -$3 | -$11 | -- | -- | -$8 | $45 |
| Dependence on income support (percentage points) | 4.9*** | 3.9*** | -0.9** | -0.5 | -0.3 | -- | -- | n/a | n/a |
Significance level *** 1%; ** 5%; * 10%
| Indicators | In-program period | Post-program period | Total in- and post-program | ||||||
|---|---|---|---|---|---|---|---|---|---|
| Program start year | Additional Year | 1st year | 2nd year | 3rd year | 4th year | 5th year | Total post | ||
| All former claimants | |||||||||
| 2002 to 2005 participants (n= 4,682) | |||||||||
| Employment earnings ($) | $3,579*** | $4,519*** | $2,800*** | $2,662*** | $2,858*** | $3,010*** | $2,880*** | $14,210*** | $22,307*** |
| Incidence of employment (percentage points) |
13.3*** | 10.0*** | 5.7*** | 6.3*** | 5.1*** | 5.8*** | 5.8*** | n/a | n/a |
| EI benefits ($) | $573*** | $586*** | $473*** | $313*** | $232*** | $261*** | $236*** | $1,515*** | $2,674*** |
| EI weeks (weeks) | 0.9*** | 2.1*** | 1.5*** | 0.9*** | 0.6*** | 0.8*** | 0.5*** | 4.3*** | 7.3*** |
| Social Assistance benefits ($) | -$359*** | -$431*** | -$303*** | -$260*** | -$266*** | -$292*** | -$291*** | -$1,412*** | -$2,202*** |
| Dependence on income support (percentage points) | -8.6*** | -2.2*** | -0.5 | -2.1*** | -2.5*** | -2.4*** | -2.7*** | n/a | n/a |
| 2007 to 2008 participants (n=1,875) | |||||||||
| Employment earnings ($) | $3,530*** | $4,916*** | $3,550*** | $3,300*** | $3,435*** | - | - | $10,320*** | $18,790*** |
| Incidence of employment (percentage points) |
13.0*** | 14.0*** | 9.1*** | 8.1*** | 7.9*** | - | - | n/a | n/a |
| EI benefits ($) | $426*** | $691*** | $729*** | $417*** | $246*** | - | - | $1,392*** | $2,510*** |
| EI weeks (weeks) | 0.5* | 2.0*** | 2.0*** | 0.9*** | 0.5** | - | - | 3.3*** | 5.9*** |
| Social Assistance benefits ($) | -$392*** | -$619*** | -$516*** | -$434*** | -$313*** | - | - | -$1,263*** | -$2,274*** |
| Dependence on income support (percentage points) | -7.7*** | -3.5*** | -0.4 | -1.4 | -1.3 | - | - | N/a | N/a |
| Sub-groups of active claimants | |||||||||
| Youth (below 30 years old) – 2002 to 2005 participants (n=1,189) | |||||||||
| Employment earnings ($) | $3,123*** | $3,881*** | $2,188*** | $2,750*** | $2,888*** | $3,311*** | $3,155*** | $14,293*** | $21,297*** |
| Incidence of employment (percentage points) |
9.6*** | 6.2*** | 0.9 | 3.3*** | 2.2 | 3.9*** | 3.8*** | n/a | n/a |
| EI benefits ($) | $437*** | $469*** | $292*** | $106 | $219** | $187 | $142 | $946*** | $1,852*** |
| EI weeks (weeks) | 0.8** | 1.8*** | 0.8** | 0.1 | 0.6* | 0.6 | 0.3 | 2.3** | 4.9*** |
| Social Assistance benefits ($) | -$418*** | -$456*** | -$308*** | -$230*** | -$255*** | -$317*** | -$401*** | -$1,512*** | -$2,386*** |
| Dependence on income support (percentage points) | -8.8*** | -3.7*** | -0.8 | -3.3*** | -2.6*** | -3.1*** | -4.2*** | n/a | n/a |
| Older Workers (55 years old and over) – 2002 to 2005 participants (n=342) | |||||||||
| Employment earnings ($) | $3,768*** | $5,124*** | $3,219*** | $2,958*** | $2,632** | $1,102 | $1,006 | $10,917** | $19,809*** |
| Incidence of employment (percentage points) |
17.3*** | 16.9*** | 8.0*** | 6.9*** | 3.8 | 3.8 | 2.6 | n/a | n/a |
| EI benefits ($) | $667** | $986*** | $653*** | $350* | $241 | $512** | $323* | $2,080*** | $3,732*** |
| EI weeks (weeks) | 1.1 | 3.5*** | 2.2*** | 1.0 | 0.8 | 1.5** | 0.6 | 6.0*** | 10.6*** |
| Social Assistance benefits ($) | -$268*** | -$295*** | -$226** | -$201* | -$189** | -$215 | -$144 | -$974** | -$1,536** |
| Dependence on income support (percentage points) | -4.9*** | 2.9*** | 4.3** | -0.7 | -1.1 | 2.2 | -0.1 | n/a | n/a |
| Long-Tenured Workers – 2007 to 2009 participants (n=1,417) | |||||||||
| Employment earnings ($) | $5,244*** | $6,303*** | $4,157*** | $3,381*** | $3,696*** | -- | -- | $11,229*** | $22,774*** |
| Incidence of employment (percentage points) |
10.2*** | 9.4*** | 3.9*** | 3.9*** | 4.9*** | -- | -- | n/a | n/a |
| EI benefits ($) | -$357** | $176 | $153 | -$15 | -$160 | -- | -- | -$22 | -$204 |
| EI weeks (weeks) | -0.7 | 0.6 | 0.4 | -0.1 | -0.5 | -- | -- | -0.3 | -0.4 |
| Social Assistance benefits ($) | -$247*** | -$395*** | -$236*** | -$192*** | -$140* | -- | -- | -$568*** | -$1,208*** |
| Dependence on income support (percentage points) | -8.2*** | -3.5*** | -1.5 | -2.1** | -2.6** | -- | -- | n/a | n/a |
Significance level *** 1%; ** 5%; * 10%
| Total costs and benefits over participation (1 to 2 years) and 6 years post-program | Active claimants(n=4,496) | Former claimants(n=4,682) |
|---|---|---|
| Program cost | -$10,372 | -$7,733 |
| Marginal social costs of public funds | -$1,478 | -$836 |
| Employment earnings (including participant’s forgone earnings) | $16,866 | $21,362 |
| Fringe benefit | $2,530 | $3,204 |
| Net present value (By how much do the benefits exceed the costs within 6 years after participation?) |
$7,546 | $15,997 |
| Cost-benefit ratio (How much does it cost in EI part II funds to achieve $1 in benefit 6 years after participation?) |
$0.60 | $0.30 |
| Payback period (How many years after participation would it take for the benefits to recover the costs?) |
3.9 years after participation | 2nd year after participation |
Appendix E - Detailed results Self-Employment Benefit
| Active claimants | Former claimants | |||
|---|---|---|---|---|
| 2002 to 2005 | 2007 to 2008 | 2002 to 2005 | 2007 to 2008 | |
| Number of observations | 6,822 | 3,731 | 3,258 | 1,936 |
| Gender | ||||
| Male | 56% | 43% | 50% | 39% |
| Female | 43% | 57% | 49% | 61% |
| Age | ||||
| Under 25 | 2% | 3% | 3% | 3% |
| 25 to 34 | 27% | 26% | 28% | 28% |
| 35 to 44 | 38% | 34% | 37% | 36% |
| 45 to 54 | 25% | 27% | 24% | 24% |
| 55 and over | 8% | 9% | 8% | 10% |
| Skills level related to National Occupation Code associated with the last EI claim opened before program participation1 | ||||
| Managerial | 12% | 14% | 10% | 12% |
| University | 14% | 11% | 16% | 13% |
| College or apprenticeship training | 35% | 35% | 29% | 30% |
| Secondary school or occupational training | 28% | 29% | 31% | 32% |
| On-the-job training | 11% | 11% | 14% | 13% |
| Key labour market indicators in the year preceding the start of participation | ||||
| Earnings including $02 | $29,548 | $27,3233 | $12,122 | $12,0983 |
| Proportion Employed | 98% | 99% | 79% | 80% |
| Proportion on EI | 41% | 44% | 75% | 69% |
| Proportion on SA | 3% | 3% | 8% | 10% |
Proportions may not add up to 100% due to rounding.
1Skill level corresponds to the type and/or amount of training or education typically required to work in the last occupation participants had before opening the last EI claim they had before participating in EBSMs:
-Managerial: Management occupations
-University: Occupations usually requiring university education (that is, university degree at the bachelor's, master's or doctorate level)
-College or apprenticeship training: Occupations usually requiring college or vocational education or apprenticeship training such as 2 to 3 years of post-secondary education at a community college, institute of technology or CEGEP or 2 to 5 years of apprenticeship training or 3 to 4 years of secondary school and more than 2 years of on-the-job training, specialized training courses or specific work experience and/or occupations with supervisory responsibilities and occupations with significant health and safety responsibilities, such as firefighters, police officers and registered nursing assistants.
-Secondary or occupational training: Occupations usually requiring secondary school and/or occupation-specific training such as 1 to 4 years of secondary school education or up to 2 years of on-the-job training specialized training courses or specific work experience.
-On-the-job training: On-the-job training is usually provided for occupations (that is, short work demonstration or on-the-job training or no formal educational requirements).
2The average earnings include participants who reported $0 earnings during that year.
3Earnings for 2007 to 2008 participants have been adjusted according to the Consumer Price Index, published by Statistics Canada, to the 2002 base year.
| Indicators | In-program period | Post-program period | Total in- and post-program | ||||||
|---|---|---|---|---|---|---|---|---|---|
| Program start year | Additional year | 1st year | 2nd year | 3rd year | 4th year | 5th year | Total post | ||
| All active claimants | |||||||||
| 2002 to 2005 participants (n= 6,822) | |||||||||
| Employment earnings ($) | -$10,350*** | -$15,789*** | -$12,499*** | -$10,773*** | -$9,467*** | -$8,588*** | -$7,794*** | -$49,121*** | -$75,261*** |
| Incidence of employment (percentage points) |
-15.4*** | -33.2*** | -23.7*** | -19.1*** | -16.5*** | -16.0*** | -14.3*** | n/a | n/a |
| EI benefits ($) | $4,886*** | $3,542*** | -$1,037*** | -$808*** | -$648*** | -$590*** | -$578*** | -$3,662*** | $4,766*** |
| EI weeks (weeks) | 12.5*** | 9.1*** | -3.2*** | -2.3*** | -1.8*** | -1.6*** | -1.5*** | -10.4*** | 11.3*** |
| Social Assistance benefits ($) | $40*** | -$10 | $31 | $39 | $12 | $23 | $9 | $114 | $144 |
| Dependence on income support (percentage points) | 28.4*** | 35.2*** | -3.4*** | -3.7*** | -2.6*** | -2.3** | -2.4** | n/a | n/a |
| 2007 to 2008 participants (n=3,731) | |||||||||
| Employment earnings ($) | -$8,615*** | -$14,275*** | -$10,930*** | -$9,433*** | -$8,575*** | - | - | -$28,937*** | -$51,828*** |
| Incidence of employment (percentage points) |
-11.7*** | -32.2*** | -23.9*** | -18.4*** | -14.5*** | - | - | n/a | n/a |
| EI benefits ($) | $2,158*** | -$909*** | -$1,681*** | -$1,099*** | -$794*** | - | - | -$3,573*** | -$2,325*** |
| EI weeks (weeks) | 4.8*** | -3.0*** | -4.7*** | -2.9*** | -2.0*** | - | - | -9.6*** | -7.9*** |
| Social Assistance benefits ($) | -$38 | -$151*** | -$112*** | -$89** | -$96** | - | - | -$297*** | -$486*** |
| Dependence on income support (percentage points) | 20.1*** | 6.3*** | -9.3*** | -5.9*** | -4.8*** | - | - | n/a | n/a |
| Sub-groups of active claimants | |||||||||
| Youth (below 30 years old) – 2002 to 2005 participants (n=877) | |||||||||
| Employment earnings ($) | -$9,424*** | -$13,988*** | -$10,850*** | -$9,772*** | -$8,229*** | -$7,568*** | -$7,122*** | -$43,541*** | -$66,953 |
| Incidence of employment (percentage points) |
-19.0*** | -36.9*** | -27.0*** | -24.7*** | -21.2*** | -20.8*** | -19.7*** | n/a | n/a |
| EI benefits ($) | $4,522*** | $3,108*** | -$1,357*** | -$1,008*** | -$790*** | -$619*** | -$709*** | -$4,482*** | $3,147*** |
| EI weeks (weeks) | 11.6*** | 7.7*** | -4.3*** | -2.9*** | -2.1*** | -1.8*** | -1.8*** | -12.9*** | 6.5*** |
| Social Assistance benefits ($) | $6 | -$79** | -$33 | -$86* | -$101** | -$68 | -$106* | -$394*** | -$467*** |
| Dependence on income support (percentage points) | 26.8*** | 32.7*** | -6.5*** | -5.3*** | -3.9*** | -3*** | -2.8*** | n/a | n/a |
| Older Workers (55 years old and over) – 2002 to 2005 participants (n=554) | |||||||||
| Employment earnings ($) | -$8,205*** | -$11,342*** | -$8,053*** | -$6,153*** | -$4,302*** | -$3,476*** | -$1,829* | -$23,813*** | -$43,360*** |
| Incidence of employment (percentage points) |
-9.6*** | -23.4*** | -16.7*** | -12.9*** | -9.8*** | -9.8*** | -2.0 | n/a | n/a |
| EI benefits ($) | $4,669*** | $3,355*** | -$690*** | -$708*** | -$538*** | -$387*** | -$372*** | -$2,695*** | $5,329*** |
| EI weeks (weeks) | 12.2*** | 8.3*** | -2.2*** | -2.1*** | -1.6*** | -1.1*** | -0.9*** | -7.8*** | 12.7*** |
| Social Assistance benefits ($) | -$79** | -$62 | -$44 | $72 | $14 | -$13 | $22 | $51 | -$90 |
| Dependence on income support (percentage points) | 24.6*** | 32.5*** | -0.9 | -0.7 | -1.6 | -1.4 | -0.1 | n/a | n/a |
| Long-Tenured Workers – 2007 to 2009 participants (n=2,292) | |||||||||
| Employment earnings ($) | -$11,388*** | -$16,262*** | -$14,145*** | -$12,610*** | -$11,604*** | -- | -- | -$38,358*** | -$66,008*** |
| Incidence of employment (percentage points) |
-13.2*** | -32.2*** | -26.6*** | -22.8*** | -19.3*** | -- | -- | n/a | n/a |
| EI benefits ($) | $3,218*** | -$323*** | -$1,280*** | -$883*** | -$401*** | -- | -- | -$2,564*** | $332 |
| EI weeks (weeks) | 7.2*** | -1.3*** | -3.3*** | -2.2*** | -0.9*** | -- | -- | -6.4*** | -0.6 |
| Social Assistance benefits ($) | $4 | -$128*** | -$146*** | -$76** | -$113*** | -- | -- | -$335*** | -$459*** |
| Dependence on income support (percentage points) | 24.5*** | 10.9*** | -7.3*** | -4.7*** | -2.2*** | -- | -- | n/a | n/a |
Significance level *** 1%; ** 5%; * 10%
| Indicators | In-program period | Post-program period | Total in- and post-program | ||||||
|---|---|---|---|---|---|---|---|---|---|
| Program start year | Additional Year | 1st year | 2nd year | 3rd year | 4th year | 5th year | Total post | ||
| All former claimants | |||||||||
| 2002 to 2005 participants (n= 3,258) | |||||||||
| Employment earnings ($) | -$6,730*** | -$10,003*** | -$7,909*** | -$6,625*** | -$6,045*** | -$5,375*** | -$5,051*** | -$31,005*** | -$47,739*** |
| Incidence of employment (percentage points) |
-26.8*** | -29.3*** | -20.1*** | -16.5*** | -13.5*** | -11.9*** | -10.4*** | n/a | n/a |
| EI benefits ($) | $769*** | -$517*** | -$602*** | -$402*** | -$286*** | -$339*** | -$299*** | -$1,929*** | -$1,677*** |
| EI weeks (weeks) | 2.0*** | -1.9*** | -2.0*** | -1.3*** | -0.9*** | -1.0*** | -0.9*** | -6.1*** | -6.0*** |
| Social Assistance benefits ($) | -$450*** | -$431*** | -$222*** | -$175*** | -$127*** | -$132*** | -$174*** | -$830*** | -$1,712*** |
| Dependence on income support (percentage points) | 13.6*** | -6.1*** | -5.9*** | -3.6*** | -2.8*** | -2.7*** | -3.0*** | n/a | n/a |
| 2007 to 2008 participants (n=1,936) | |||||||||
| Employment earnings ($) | -$6,908*** | -$10,162*** | -$8,211*** | -$7,147*** | -$6,942*** | - | - | -$22,300*** | -$39,394*** |
| Incidence of employment (percentage points) |
-23.2*** | -28.6*** | -19.3*** | -15.8*** | -13.2*** | - | - | n/a | n/a |
| EI benefits ($) | $657*** | -$752*** | -$1,047*** | -$562*** | -$458*** | - | - | -$2,067*** | -$2,162*** |
| EI weeks (weeks) | 1.7*** | -2.3*** | -3.1*** | -1.5*** | -1.2*** | - | - | -5.8*** | -6.4*** |
| Social Assistance benefits ($) | -$506*** | -$604*** | -$409*** | -$406*** | -$342*** | - | - | -$1,158*** | -$2,267*** |
| Dependence on income support (percentage points) | 10.2*** | -6.5*** | -8.2*** | -5.0*** | -3.5*** | - | - | n/a | n/a |
| Sub-groups of former claimants | |||||||||
| Youth (below 30 years old) – 2002 to 2005 participants (n=453) | |||||||||
| Employment earnings ($) | -$5,661*** | -$8,758*** | -$7,403*** | -$5,332*** | -$5,421*** | -$4,041*** | -$4,826*** | -$27,024*** | -$41,443*** |
| Incidence of employment (percentage points) |
-28.5*** | -31.8*** | -20.6*** | -15.2*** | -13.1*** | -14.5*** | -13.8*** | n/a | n/a |
| EI benefits ($) | $708*** | -$684*** | -$596*** | -$359*** | -$282*** | -$658*** | -$582*** | -$2,477*** | -$2,452*** |
| EI weeks (weeks) | 1.6*** | -2.4*** | -2.0*** | -1.2*** | -0.9* | -1.8*** | -1.3*** | -7.2*** | -7.9wk*** |
| Social Assistance benefits ($) | -$664*** | -$642*** | -$416*** | -$303*** | -$354*** | -$448*** | -$406*** | -$1,927*** | -$3,233*** |
| Dependence on income support (percentage points) (pp) | 11.9*** | -8.8*** | -7.8*** | -5.0*** | -2.8* | -5.7*** | -3.8** | n/a | n/a |
| Long-Tenured Workers – 2007 to 2009 participants (n=787) | |||||||||
| Employment earnings ($) | -$7,870*** | -$11,709*** | -$9,432*** | -$8,042*** | -$7,891*** | -- | -- | -$25,358*** | -$44,930*** |
| Incidence of employment (percentage points) |
-25.1*** | -28.8*** | -21.8*** | -17.7*** | -16.5*** | -- | -- | n/a | n/a |
| EI benefits ($) | $686*** | -$687*** | -$846*** | -$549*** | -$362*** | -- | -- | -$1,757*** | -$1,757*** |
| EI weeks (weeks) | 1.6*** | -1.9*** | -2.5*** | -1.5*** | -0.8** | -- | -- | -4.8*** | -5.1*** |
| Social Assistance benefits ($) | -$367*** | -$362*** | -$313*** | -$133 | -$173** | -- | -- | -$619*** | -$1,348*** |
| Dependence on income support (percentage points) | 12.3*** | -4.4*** | -7.0*** | -4.6*** | -3.0*** | -- | -- | n/a | n/a |
Significance level *** 1%; ** 5%; * 10%
Appendix F - Detailed results Job Creation Partnerships
| Active claimants | Former claimants | |||
|---|---|---|---|---|
| 2002 to 2005 | 2007 to 2008 | 2002 to 2005 | 2007 to 2008 | |
| Number of observations | 1,644 | 668 | 1,384 | 724 |
| Gender | ||||
| Male | 41% | 36% | 47% | 39% |
| Female | 58% | 64% | 52% | 61% |
| Age | ||||
| Under 25 | 12% | 10% | 8% | 6% |
| 25 to 34 | 36% | 32% | 33% | 35% |
| 35 to 44 | 28% | 24% | 29% | 26% |
| 45 to 54 | 19% | 25% | 20% | 24% |
| 55 and over | 5% | 8% | 9% | 8% |
| Skills level related to National Occupation Code associated with the last EI claim opened before program participation1 | ||||
| Managerial | 9% | 10% | 9% | 9% |
| University | 13% | 12% | 15% | 12% |
| College or apprenticeship training | 28% | 28% | 27% | 26% |
| Secondary or occupational training | 33% | 35% | 32% | 37% |
| On-the-job training | 18% | 14% | 18% | 17% |
| Key labour market indicators in the year preceding the start of participation | ||||
| Earnings2 | $20,621 | $20,1993 | $9,357 | $9,9143 |
| Proportion Employed | 98% | 99% | 79% | 83% |
| Proportion on EI | 50% | 45% | 71% | 69% |
| Proportion on SA | 5% | 6% | 13% | 14% |
Proportions may not add up to 100% due to rounding
1Skill level corresponds to the type and/or amount of training or education typically required to work in the last occupation participants had before opening the last EI claim they had before participating in EBSMs:
-Managerial: Management occupations
-University: Occupations usually requiring university education (that is, University degree at the bachelor's, master's or doctorate level)
-College or apprenticeship training: Occupations usually requiring college or vocational education or apprenticeship training such as 2 to 3 years of post-secondary education at a community college, institute of technology or CEGEP or 2 to 5 years of apprenticeship training or 3 to 4 years of secondary school and more than 2 years of on-the-job training, specialized training courses or specific work experience and/or occupations with supervisory responsibilities and occupations with significant health and safety responsibilities, such as firefighters, police officers and registered nursing assistants.
-Secondary or occupational training: Occupations usually requiring secondary school and/or occupation-specific training such as one to four years of secondary school education or up to 2 years of on-the-job training specialized training courses or specific work experience.
-On-the-job training: On-the-job training is usually provided for occupations (that is, short work demonstration or on-the-job training or no formal educational requirements).
2The average earnings includes participants who reported $0 earnings during that year.
3Earnings for 2007 to 2008 participants have been adjusted by the Consumer Price Index published by Statistics Canada, using 2002 as the base year.
| Indicators | In-program period | Post-program period | Total in- and post-program | ||||||
|---|---|---|---|---|---|---|---|---|---|
| Program start year | Additional year | 1st year | 2nd year | 3rd year | 4th year | 5th year | Total post | ||
| All active claimants | |||||||||
| 2002 to 2005 participants (n= 1,644) | |||||||||
| Employment earnings ($) | -$5,669** | -$1,963*** | $2,396*** | $2,931*** | $3,413*** | $4,339*** | $5,155*** | $18,235*** | $10,603*** |
| Incidence of employment (percentage points) |
n/a | n/a | 5.9*** | 5.7*** | 5.2*** | 7.2*** | 8.0*** | n/a | n/a |
| EI benefits ($) | $3,993*** | $1,211*** | -$422*** | -$2 | $274*** | $114 | $157 | $122 | $5,326*** |
| EI weeks (weeks) | 10.7*** | 1.8*** | -0.9*** | 0.4 | 1.1*** | 0.7** | 0.8*** | 2.3** | 14.8wk*** |
| Social Assistance benefits ($) | $22 | $75** | $9 | -$30 | -$69 | -$79* | -$95** | -$263 | -$166 |
| Dependence on income support (percentage points) | 23.9*** | 7.1*** | -2.9*** | -1.3* | 0.4 | -1.7** | -0.8 | n/a | n/a |
| 2007 to 2008 participants (n=668) | |||||||||
| Employment earnings ($) | -$4,788*** | -$869 | $2,248* | $3,513*** | $3,290** | - | - | $9,051** | $3,394 |
| Incidence of employment (percentage points) |
n/a | n/a | 7.3*** | 7.2*** | 5.8*** | - | - | n/a | n/a |
| EI benefits ($) | $842*** | -$938*** | -$518* | -$381 | $70 | - | -$829 | -$925 | |
| EI weeks (weeks) | 2.8*** | -3.0*** | -1.9*** | -1.2* | -0.3 | - | -3.4** | -3.5 | |
| Social Assistance benefits ($) | $11 | $50 | -$111 | -$119 | -$137 | - | -$367 | -$306 | |
| Dependence on income support (percentage points) | 8.0*** | -3.7* | -4.4** | -3.3* | -2.7 | - | n/a | n/a | |
| Sub-groups of active claimants | |||||||||
| Long-Tenured Workers – 2007 to 2009 participants (n=343) | |||||||||
| Employment earnings ($) | -$8,478*** | -$3,639*** | $846 | $840 | $288 | -- | -- | $1,974 | -$10,143* |
| Incidence of employment (percentage points) |
n/a | n/a | 8.8*** | 8.4*** | 6.1** | -- | -- | n/a | n/a |
| EI benefits ($) | $2,148*** | -$394 | -$259 | -$17 | $34 | -- | -- | -$242 | $1,512* |
| EI weeks (weeks) | 4.7*** | -1.4* | -0.5 | 0.1 | 0.1 | -- | -- | -0.4 | 2.9 |
| Social Assistance benefits ($) | $43 | $177** | $41 | $58 | $84 | -- | -- | $183 | $404 |
| Dependence on income support (percentage points) | 17.8*** | -0.1 | -1.5 | -0.4 | 0.1 | -- | -- | n/a | n/a |
Significance level *** 1%; ** 5%; * 10%
| Indicators | In-program period | Post-program period | Total in- and post-program | ||||||
|---|---|---|---|---|---|---|---|---|---|
| Program start year | Additional year | 1st year | 2nd year | 3rd year | 4th year | 5th year | Total post | ||
| All former claimants | |||||||||
| 2002 to 2005 participants (n= 1,384) | |||||||||
| Employment earnings ($) | -$3,125*** | -$1,274*** | $1,217** | $1,658*** | $1,835*** | $2,017*** | $2,090*** | $8,817*** | $4,418 |
| Incidence of employment (percentage points) |
n/a | n/a | 3.6*** | 4.2*** | 4.2*** | 3.8*** | 4.1*** | n/a | n/a |
| EI benefits ($) | $368*** | -$211*** | -$52 | $259*** | $30 | $210* | $210** | $657* | $814* |
| EI weeks (weeks) | 0.3 | -1.2*** | -0.4 | 0.6** | -0.1 | 0.4 | 0.3 | 0.9 | 0.0 |
| Social Assistance benefits ($) | -$432*** | -$368*** | -$247*** | -$280*** | -$306*** | -$265*** | -$221*** | -$1,320*** | -$2,120*** |
| Dependence on income support (percentage points) | 3.6*** | -5.4*** | -3.7*** | -2.5*** | -3.8*** | -2.4** | -2* | n/a | n/a |
| 2007 to 2008 participants (n=724) | |||||||||
| Employment earnings ($) | -$3,585*** | -$229 | $2,001*** | $1,284* | $1,953** | - | - | $5,235** | $1,418 |
| Incidence of employment (percentage points) |
n/a | n/a | 4.0** | 3.6** | 3.8** | - | - | n/a | n/a |
| EI benefits ($) | $180 | -$428*** | $186 | $237 | $154 | - | - | $577* | $330 |
| EI weeks (weeks) | 0.0 | -1.4*** | 0.2 | 0.5 | 0.2 | - | - | 1.0 | -0.4 |
| Social Assistance benefits ($) | -$467*** | -$637*** | -$520*** | -$496*** | -$480*** | - | - | -$1,496*** | -$2,599*** |
| Dependence on income support (percentage points) | 2.9* | -7.6*** | -4.1*** | -3.7*** | -4.6*** | - | - | n/a | n/a |
| Sub-groups of former claimants | |||||||||
| Youth (below 30 years old) – 2002 to 2005 participants (n=344) | |||||||||
| Employment earnings ($) | -$3,280*** | -$564 | $1,880** | $2,911*** | $2,700** | $2,398* | $2,846** | $12,735*** | $8,891* |
| Incidence of employment (percentage points) |
n/a | n/a | 3.2 | 2.4 | 2.2 | 0.9 | 4 | n/a | n/a |
| EI benefits ($) | $343** | -$145 | $128 | $330* | $24 | $305 | $170 | $958 | $1,157 |
| EI weeks (weeks) | 0.6 | -0.8 | 0.5 | 1.1* | 0.3 | 0.9 | 0.5 | 3.3* | 3.1 |
| Social Assistance benefits ($) | -$531*** | -$505*** | -$419*** | -$483*** | -$524*** | -$522*** | -$472*** | -$2,420*** | -$3,455*** |
| Dependence on income support (percentage points) | 5.0** | -7.4*** | -3.5** | -3.1* | -4.4** | -2.8 | -3.7* | n/a | n/a |
Significance level *** 1%; ** 5%; * 10%
| Total costs and benefits over participation (1 to 2 years) and 6 years post-program | Active claimants (n=1,644) |
Former claimants (n=1,384) |
|---|---|---|
| Program cost | -$16,940 | -$15,899 |
| Marginal social costs of public funds | -$3,827 | -$2,539 |
| Employment earnings | $10,344 | $3,758 |
| Fringe benefit | $1,552 | $564 |
| Net present value (By how much do the benefits exceed the costs within 6 years after participation?) |
-$8,871 | -$14,116 |
| Cost-benefit ratio (How much does it cost in EI part II funds to achieve $1 in benefit 6 years after participation?) |
$2.10 | $8.90 |
| Payback period (How many years after participation would it take for the benefits to recover the costs?) |
8.4 years after participation | 19.9 years after participation |
Appendix G - Detailed results Employment Assistance Services
| Active claimants | Former claimants | |||
|---|---|---|---|---|
| 2002 to 2005 | 2007 to 2008 | 2002 to 2005 | 2007 to 2008 | |
| Number of observations | 120,722 | 70,604 | 45,508 | 34,528 |
| Gender | ||||
| Male | 54% | 42% | 52% | 41% |
| Female | 45% | 58% | 47% | 59% |
| Age | ||||
| Under 25 | 8% | 9% | 8% | 9% |
| 25 to 34 | 28% | 26% | 29% | 28% |
| 35 to 44 | 32% | 30% | 32% | 29% |
| 45 to 54 | 22% | 26% | 22% | 24% |
| 55 and over | 9% | 9% | 8% | 9% |
| Skills level related to National Occupation Code associated with the last EI claim opened before Employment Assistance Services participation1 | ||||
| Managerial | 6% | 6% | 4% | 5% |
| University | 9% | 5% | 8% | 5% |
| College or apprenticeship training | 26% | 25% | 22% | 23% |
| Secondary or occupational training | 38% | 41% | 39% | 41% |
| On-the-job training | 21% | 22% | 27% | 27% |
| Key labour market indicators in the year preceding the start of participation | ||||
| Earnings2 | $25,398 | $23,5353 | $11,955 | $12,1573 |
| Proportion Employed | 97% | 99% | 81% | 84% |
| Proportion on EI | 37% | 39% | 60% | 59% |
| Proportion on SA | 5% | 6% | 19% | 20% |
Proportions may not add up to 100% due to rounding
1Skill level corresponds to the type and/or amount of training or education typically required to work in the last occupation participants had before opening the last EI claim they had before participating in EBSMs:
-Managerial: Management occupations
-University: Occupations usually requiring university education (that is, University degree at the bachelor's, master's or doctorate level)
-College or apprenticeship training: Occupations usually requiring college or vocational education or apprenticeship training such as 2 to 3 years of post-secondary education at a community college, institute of technology or CEGEP or 2 to 5 years of apprenticeship training or 3 to 4 years of secondary school and more than 2 years of on-the-job training, specialized training courses or specific work experience and/or occupations with supervisory responsibilities and occupations with significant health and safety responsibilities, such as firefighters, police officers and registered nursing assistants.
- Secondary or occupational training: Occupations usually requiring secondary school and/or occupation-specific training such as one to four years of secondary school education or up to 2 years of on-the-job training specialized training courses or specific work experience.
-On-the-job training: On-the-job training is usually provided for occupations (that is, short work demonstration or on-the-job training or no formal educational requirements).
2The average earnings includes participants who reported $0 earnings during that year.
3Earnings for 2006 to 2008 participants have been adjusted by the Consumer Price Index published by Statistics Canada, using 2002 as the base year.
| Indicators | In-program period | Post-program period | Total in- and post-program | |||||
|---|---|---|---|---|---|---|---|---|
| 1st year | 2nd year | 3rd year | 4th year | 5th year | Total post | |||
| All active claimants | ||||||||
| 2002 to 2005 participants (n= 24,103 or a random sample of 20% of participants) | ||||||||
| Employment earnings ($) | -$3,062*** | -$1,036*** | $39 | $252 | $657** | $802*** | $714 | -$2,348** |
| Incidence of employment (percentage points) |
0.5 | 1.5*** | 1.4*** | 1.7*** | 1.6*** | 1.7*** | n/a | n/a |
| EI benefits ($) | $991*** | -$389*** | -$338*** | -$188*** | -$225*** | -$108*** | -$1,248*** | -$257*** |
| EI weeks (weeks) | 2.7*** | -1.4*** | -1.1*** | -0.6*** | -0.7*** | -0.4*** | -4.1*** | -1.4*** |
| Social Assistance benefits ($) | $15 | $47*** | $11 | -$3 | -$2 | -$13 | $41 | $55 |
| Dependence on income support (percentage points) | 6.1*** | -1.4*** | -1.2*** | -0.5* | -0.6* | -0.3 | n/a | n/a |
| 2007 to 2008 participants (n=35,302 or a 50% random sample of participants) | ||||||||
| Employment earnings ($) | -$3,508*** | -$654*** | $465*** | $895*** | - | - | $706 | -$2,803*** |
| Incidence of employment (percentage points) |
0.7*** | 2.8*** | 3.1*** | 3.3*** | - | - | n/a | n/a |
| EI benefits ($) | $937*** | -$669*** | -$280*** | -$162*** | - | - | -$1,111*** | -$174** |
| EI weeks (weeks) | 2.0*** | -2.2*** | -0.7*** | -0.5*** | - | - | -3.3*** | -1.3*** |
| Social Assistance benefits ($) | $41*** | $72*** | $10 | -$6 | - | - | $76* | $118*** |
| Dependence on income support (percentage points) | 5.9*** | -2.7*** | -1.2*** | -0.7*** | - | - | n/a | n/a |
| Sub-groups of active claimants | ||||||||
| Youth (below 30 years old) – 2002 to 2005 participants (n=26,158) | ||||||||
| Employment earnings ($) | -$2,359*** | -$275** | $327** | $677*** | $852*** | $1,025*** | $2,606*** | $248 |
| Incidence of employment (percentage points) |
-0.4 | 1.2*** | 0.7** | 0.8** | 0.7** | 0.6 | n/a | n/a |
| EI benefits ($) | $562*** | -$621*** | -$356*** | -$236*** | -$249*** | -$127*** | -$1,588*** | -$1,026*** |
| EI weeks (weeks) | 1.8*** | -2.1*** | -1.0*** | -0.7*** | -0.6*** | -0.3*** | -4.7*** | -2.9*** |
| Social Assistance benefits ($) | -$12 | $39*** | $6 | $4 | $8 | $18 | $76 | $64 |
| Dependence on income support (percentage points) | 4.3*** | -3.5*** | -1.5*** | -1.1*** | -0.9*** | -0.5** | n/a | n/a |
| Older Workers (55 years old and over) – 2002 to 2005 participants (n=10,485) | ||||||||
| Employment earnings ($) | -$3,391*** | -$1,226*** | $528* | $1,229*** | $2,010*** | $2,125*** | $4,665*** | $1,274 |
| Incidence of employment (percentage points) |
0.6 | 2.9*** | 4.5*** | 6.4*** | 7.1*** | 6.8*** | n/a | n/a |
| EI benefits ($) | $1,324*** | -$193*** | -$193*** | -$31 | $25 | $61 | -$331*** | $994*** |
| EI weeks (weeks) | 3.7*** | -0.8*** | -0.6*** | -0.1 | 0.2 | 0.2* | -1.1** | 2.6*** |
| Social Assistance benefits ($) | -$33*** | $26* | $42*** | $37** | $39** | $40** | $183** | $150*** |
| Dependence on income support (percentage points) | 7.1*** | -1.0* | -1.0*** | -0.3 | 0.2 | 0.5 | n/a | n/a |
| Long-Tenured Workers – 2007 to 2009 participants (n=44,159) | ||||||||
| Employment earnings ($) | -$4,649*** | -$1,948*** | -$360** | $160 | -- | -- | -$2,148*** | -$6,798*** |
| Incidence of employment (percentage points) |
0.4** | 1.5*** | 2.1*** | 1.9*** | -- | -- | n/a | n/a |
| EI benefits ($) | $1,408*** | -$83** | -$283*** | -$141*** | -- | -- | -$507*** | $900*** |
| EI weeks (weeks) | 2.7*** | -0.6*** | -0.7*** | -0.3*** | -- | -- | -1.7*** | 1.1*** |
| Social Assistance benefits ($) | $28*** | $52*** | $44*** | $22** | -- | -- | $117*** | $145*** |
| Dependence on income support (percentage points) | 6.2*** | -0.3 | -1.2*** | -0.5** | -- | -- | n/a | n/a |
Significance level *** 1%; ** 5%; * 10%
| Cohorts (start of ES after start of an EI claim) |
n= | In-program | Post-program period | Total impact post-program |
Total impact in- and post- program | ||||
|---|---|---|---|---|---|---|---|---|---|
| 1 year | 2 years | 3 years | 4 years | 5 years | |||||
| Employment Earnings ($) | |||||||||
| 1 to 4 weeks | 22,869 | -$552*** | -$59 | $1,765*** | $2,493*** | $3,076*** | $3,349*** | $10,624*** | $10,072*** |
| 5 to 8 weeks | 24,379 | -$2,407*** | -$1,218*** | $401*** | $1,171*** | $1,813*** | $1,816*** | $3,984*** | $1,577* |
| 9 to 12 weeks | 18,358 | -$3,612*** | -$962*** | $256 | $1,003*** | $1,455*** | $1,548*** | $3,299*** | -$313 |
| 2nd quarter | 25,210 | -$5,476*** | -$1,215*** | -$273* | $157 | $595*** | $801*** | $65 | -$5,410*** |
| 3rd quarter | 11,238 | -$8,783*** | -$1,838*** | -$1,546*** | -$873*** | -$532** | -$712*** | -$5,502*** | -$14,285*** |
| 4th quarter | 6,791 | -$8,856*** | -$1,268*** | -$1,336*** | -$497 | -$164 | -$165 | -$3,430** | -$12,286*** |
| Incidence of Employment (percentage points) | |||||||||
| 1 to 4 weeks | 22,869 | 3.1*** | 2.2*** | 1.9*** | 1.8*** | 1.2*** | 0.6* | n/a | n/a |
| 5 to 8 weeks | 24,379 | 2.2*** | 0.6* | 0.5* | 0.2 | -0.3 | -1.2*** | n/a | n/a |
| 9 to 12 weeks | 18,358 | 1.1*** | 0.2 | 0.4 | 0.6* | 0.2 | -0.6 | n/a | n/a |
| 2nd quarter | 25,210 | -1.2*** | 0.4 | 0.1 | 0.3 | -0.2 | -0.7* | n/a | n/a |
| 3rd quarter | 11,238 | -5.8*** | 0.2 | -0.8* | -1.0** | -0.9* | -1.5*** | n/a | n/a |
| 4th quarter | 6,791 | -7.5*** | 0.0 | -1.3** | -0.5 | -0.8 | -0.7 | n/a | n/a |
| EI Benefits ($) | |||||||||
| 1 to 4 weeks | 22,869 | $521*** | $152*** | -$209*** | -$99*** | -$92*** | -$37*** | $284** | -$236*** |
| 5 to 8 weeks | 24,379 | $1,566*** | $218*** | -$139*** | -$94*** | -$107*** | $60** | -$62 | $1,504*** |
| 9 to 12 weeks | 18,358 | $1,842*** | -$269*** | -$228*** | -$148*** | -$113*** | -$59*** | -$817*** | $1,025* |
| 2nd quarter | 25,210 | $2,146*** | -$800*** | -$314*** | -$140*** | -$151*** | -$86*** | -$1,490*** | $656*** |
| 3rd quarter | 11,238 | $2,499*** | -$1,624*** | -$320*** | -$236*** | -$164*** | -$44 | -$2,387*** | $112 |
| 4th quarter | 6,791 | $2,140*** | -$1,987*** | -$349*** | -$262*** | -$157*** | $22 | -$2,734*** | -$594*** |
Significant at 10%; ** significant at 5%; *** significant at 1%
| Cohorts (start of ES after start of an EI claim) |
U1 (1st month) |
U2 (2nd month) |
U3 (3rd month) |
U6 (2nd quarter) |
U9 (3rd quarter) |
U12 (4th quarter) |
|---|---|---|---|---|---|---|
| (N=22,869) | (N=24,379) | (N=18,358) | (N=25,210) | (N=11,238) | (N=6,791) | |
| Time of Return to Employment (in weeks) | 2.9*** | -0.6*** | -1.6*** | -3.1*** | -3.1*** | -2.9*** |
* Significant at 10%; ** significant at 5%; *** significant at 1%
| Total costs and benefits over 1 year participation period and 6 years post-program | Active claimants (n=24,103)1 |
|---|---|
| Program cost | -$840 |
| Marginal social costs of public funds | -$323 |
| Employment earnings (including participant’s forgone earnings) | -$1,555 |
| Fringe benefit | -$233 |
| Net present value (By how much do the benefits exceed the costs within 6 years after participation?) |
-$2,952 |
| Cost-benefit ratio (How much does it cost in EI part II funds to achieve $1 in benefit 6 years after participation?) |
Negative benefits |
| Payback period (How many years after participation would it take for the benefits to recover the costs?) |
9.3 years after participation |
1A random sample of 20% of participants was used.
Appendix H - List of eight studies included in the synthesis report
| Study | Evidence included in this summary report | Methods | Reference period | Observation period |
|---|---|---|---|---|
| Profile, Outcomes and Net Impacts of Employment Benefits and Support Measures (EBSM) Participants in Ontario (Completed in 2014) | - Incremental impacts for participants including youth and older workers - Profile and socio-demographic characteristics of participants |
- Non-experimental method using propensity score matching in combination with Difference-in-Differences - Statistical profiling |
2002 to 2005 participants | 7 years between 2002 and 2011 (that is, 2 years in program and 5 years post-program) |
| Effects of the Timing of Participation in Employment Assistance Services in Ontario (Completed in 2014) | - Incremental impacts | - Non-experimental method using propensity score matching in combination with Difference-in-Differences - Statistical profiling |
||
| Cost-Benefit Analysis of Employment Benefits and Support Measures Delivered in Ontario (Completed in 2016) | - Cost-benefit analysis | - Non-experimental method using propensity score matching in combination with Difference-in-Differences - Cost analysis |
8 years between 2002 and 2013 (that is, 2 years in-program and 6 years post-program) |
|
| Analysis of Employment Benefits and Support Measures (EBSM) Profile, Outcomes and Incremental Impacts for 2007 to 2008 Participants in Ontario (Completed in 2015) | - Incremental impacts - Profile and socio-demographic characteristics of participants |
- Non-experimental method using propensity score matching in combination with Difference-in-Differences - Statistical profiling |
2007 to 2008 participants | 5 years between 2007 and 2012 (that is, 2 years in-program and 3 years post-program) |
| Analysis of EBSMs Profile, Outcomes, and Incremental Impacts for EI Claimants Category “Long-Tenured Workers” in Ontario (Completed in 2016) | - Incremental impacts - Statistical profile of socio-demographic characteristics |
- Propensity score matching and Difference-in-Differences - Statistical profiling |
2007 to 2009 participants | 5 years between 2007 and 2013 (that is, 2 years in-program and 3 years post-program) |
| Study on Employment Assistance Services (Completed in 2014) | - Program design and delivery - Challenges and lessons learned |
- 12 to 16 key informants interviews - Literature and document review |
Design and delivery at the time of the data collection (that is, 2013) | |
| Study on the programming offered under the Skills Development Funding Stream in Ontario (Completed in 2016) |
- Program design and delivery - Challenges and lessons learned |
- 8 key informants interviews - Literature and document review -Questionnaire filled by Ontario officials |
Design and delivery at the time of the data collection (that is, 2015) | |
| Study of Skills Development – Apprentices in Ontario (Completed in 2016) | - Program design and delivery - Challenges and lessons learned |
- 7 key informants interviews - Literature and document review - Questionnaire filled by Ontario officials |
||
During the 2002-2005 period, the federal government was delivering the Skills Development program in Ontario. When Ontario assumed responsibility for the LMDA design and delivery in January 2007, the Ontario Skills Development Program was delivered by the province of Ontario. The Second Career program was introduced in 2008 and merged with the Ontario Skills Development program in 2009.
During the 2003 to 2005, the Skills Development – Apprentices program was delivered by the federal Government.