
Summative Evaluation : Canada Student Loans Program, June 2011
Official Title: Summative Evaluation of the Canada Student Loans Program - June 2011
List of Abbreviations
- ASETS - Access and Support to Education and Training Survey
- CAG - Canada Access Grants
- CESP - Canada Education Savings Program
- CMSF - Canada Millennium Scholarship Foundation
- CSFAA - Canada Student Financial Assistance Act
- CSG - Canada Study Grants
- CSL - Canada Student Loans
- CSLA - Canada Student Loans Act
- CSLP - Canada Student Loans Program
- DARS - Default and Recovery System
- DPR - Departmental Performance Report
- DRR - Debt Reduction in Repayment
- EIR - Extended Interest Relief
- HRSDC - Human Resources and Skills Development Canada
- ICCSFA - Intergovernmental Consultative Committee on Student Financial Assistance
- LAD - Longitudinal Administrative Database
- LFS - Labour Force Survey
- NARS - Need Assessment Reports
- OECD - Organization for Economic Co-operation and Development
- OSFI - Office of the Superintendent of Financial Institutions
- OSAP - Ontario Student Assistance Program
- PCP - Pre-Consolidation Program
- PSE - Post-secondary education
- RAP - Repayment Assistance Plan
- RAP-PD - Repayment Assistance Plan for Borrowers with a Permanent Disability
- RESP - Registered Education Savings Plan
- RMAF - Results-based Management and Accountability Framework
- SFA - Student Financial Aid
- SHS - Survey of Household Spending
- YITS-A - Youth in Transition Survey, cohort A
Executive Summary
The Summative Evaluation of the Canada Student Loans Program (CSLP) has been undertaken over the 2006 to 2010 period using an approach of conducting a set of small studies during each year of the evaluation. This report provides a summary of the results of 32 studies conducted for the summative evaluation. The studies used a variety of methods including literature reviews, international comparisons, surveys, focus groups, key informant interviews, administrative data analyses and econometric analyses. As well, other external studies were used to complement the 32 studies completed specifically for this evaluation.
Evaluation Findings
Program Rationale
The rationale for the CSLP is still valid because the benefits to society of having an educated population go beyond the economic costs and because financial barriers would otherwise exist for many more students without the program, especially those from low-income families. Students are often unable to borrow from the private sector for their post-secondary education (PSE) due to the lack of collateral, as well as the inability of financial institutions to assess future income. The literature review and the international comparison provided evidence that the credit constraints are sufficient to warrant government action. As well, key informants were unanimous on the need for a program in some form.
The two main arguments for action by the federal government in this area are equality of access across the country and historical precedent. However, the rationale for some detailed features of the CSLP requires a re-examination, specifically the loan system for part-time students.
Needs Assessment
Although the needs assessment used for the CSLP is complex, most key informants and focus group participants agreed that those who need a loan get a loan. Analysis conducted for the evaluation demonstrated that the current allowances for student expenses are adequate in terms of meeting average monthly total student expenditures for the majority of students (66%). However, a number of areas were identified for improvement: 1) although some changes have been made to the parental contribution rules, further adjustments appear to be needed; 2) consider ways to improve student comprehension of the needs assessment process; and 3) improving the quality of the needs assessment data files.
Post-Secondary Education (PSE) Access
According to the 2007-2008 CSLP Annual Report the mandate of the CSLP is to "promote access to post-secondary education through the provision of financial assistance in the form of loans and/or grants to qualified students based on financial need, regardless of province or territory of residence." The program appears to be achieving this objective. The literature review, key informants and empirical studies demonstrated that the program is reducing financial constraints. Five studies provided estimates of the impact of the CSLP on PSE access. Overall, the estimates showed that each $1,000 increase in student loans limits increases the enrolment of low-income students by 0.4 to 1 percentage points. Non financial barriers continue to play a key role in explaining PSE access issues.
Debt Repayment
The average student loan debt at consolidation time was $9,348 in 1998-1999, increased slightly to $9,655 in 2000-2001, and increased further to $12,881 by 2007-2008. Accounting for inflation (which averaged 2.4% over this period) this represents an increase in average student loan debt of about $1,030. Although the majority of student borrowers are able to repay their loans with or without government assistance, approximately 16% of borrowers defaulted in 2007-2008 (i.e. were behind on their loan repayment by 3 or more months following the loan consolidation date). This was down by more than ten percentage points from the earlier part of the decade. The literature review and analysis of CSLP administrative data indicated that many factors influence the default rate such as scholastic results, graduation rates, employment income, unemployment rates, debt levels, gender, age, and institution characteristics.
The changes to the Interest Relief and Debt Reduction in Repayment provisions in 1997, 1998 and 2003 generally helped to reduce the default rate. Although key informant interviews and focus groups indicated that these two provisions (subsequently replaced by the Repayment Assistance Plan in 2009) helped lowered lower the default rate, the use of a more pro-active pre-consolidation counselling approach could be further explored by the department to help borrowers understand debt management measures and to further reduce the default rate.
Management Response
Introduction
The benefits associated with high rates of post-secondary education (PSE) are well established. PSE provides Canadians with access to better job prospects and opportunities for personal growth. Canadians understand the importance of post-secondary education in today's competitive world; in fact, Canada leads all Organization for Economic Co-operation and Development (OECD) countries in the proportion of the population with a college or university education.
This impressive achievement is, in part, the result of the Government of Canada's commitment through the Canada Student Loans Program (CSLP) to ensure that Canadians are able to access PSE. The CSLP provides government funded loans and grants to eligible Canadians pursuing a post-secondary degree, diploma or certificate program at a designated educational institution. The main clients are low- and middle-income Canadians, students with disabilities, and students with dependents. The CSLP also provides assistance to borrowers who are having difficulties repaying their student loans.
Since the inception of the CSLP in 1964, the Government of Canada has provided close to $32 billion in student loans to more than 4.3 million students. According to the Office of the Chief Actuary Footnote1 , approximately 36% of all full-time PSE students in the nine provinces and one territory that participate in the CSLP Footnote2 received a Canada Student Loan in the 2008-2009 loan year.
A summative evaluation of the CSLP was conducted between 2006 and 2011 and focussed on the loan period from 2000 to 2008. Since this evaluation period, there have been a number of significant initiatives announced by the Government of Canada to enhance student financial assistance. In Budget 2008, the Government of Canada announced a series of wide-ranging measures, which have subsequently been implemented:
- The Canada Student Grants Program that provides low- and middle-income students with consistent and up-front funding to help pay for PSE;
- The Repayment Assistance Plan (RAP) that assists borrowers who are having difficulty repaying their loans by making it easier to manage their debt by paying back what they can reasonably afford. RAP replaced the Interest Relief and Debt Reduction in Repayment programs, and under this new plan, thousands of additional borrowers will qualify for assistance each year; and
- The Repayment Assistance Plan for Borrowers with a Permanent Disability (RAP-PD) is available to borrowers with a permanent disability having difficulty meeting their loan repayment obligations. Like RAP, RAP-PD makes it easier for eligible student loan borrowers to manage their debt by paying back what they can reasonably afford.
In addition to these initiatives, the Government of Canada has also introduced changes to increase support to full-time students in certain circumstances. In the past, full-time students received interest subsidies provided that they remained in school and were eligible to defer payments on their loans until six months after they completed their studies. However, in cases where students exceeded the maximum allowable number of weeks of student financial assistance, the student would be required to begin making payments on their student loans before they finished their studies. As part of Budget 2008, full-time student borrowers that reach their the maximum weeks of assistance are now able to continue their studies without having to begin repaying their loans until six months after they finish school.
With respect to part-time students, Budget 2008 included significant enhancements by more than doubling the maximum lifetime loan amount and improving the terms of repayment of student loans. Like full-time students, part-time students are now able to defer payment on their loan principal and accumulated interest until six months after their studies are complete. (Prior to this change, part-time students were responsible for making interest payments on their loans while in study.)
Given that these significant changes to student financial assistance occurred after the timeframe of this summative evaluation (2000 to 2008), a supplementary evaluation plan is being developed to capture the impact of these new initiatives.
In addition, the CSLP continues to work in collaboration with provincial and territorial partners to implement a number of initiatives to modernize the delivery of student financial assistance. These initiatives include a master student financial assistance agreement, electronic confirmation of enrolment, and a single on-line application for repayment assistance, all of which are designed to significantly simplify the process for the borrower throughout the student loan lifecycle.
Key Findings
Overall, the evaluation found that the rationale for the CSLP was valid and that there continues to be a clear need for the financial assistance it provides to students. The evaluation further concluded that the Program was achieving its objectives by reducing financial barriers, improving access to PSE, and addressing the financial needs of students by increasing loan limits and developing policies to support them in repayment.
We agree with these key findings and are pleased to present the following management response to the specific recommendations in the report. The CSLP Directorate within the Learning Branch of HRSDC has responsibility for proposed actions. The recommendations essentially pertain to four broad areas:
- Eligibility for Student Financial Assistance;
- Student Financial Assistance for Part-Time Study;
- Repayment following completion of PSE, and
- Default Management.
For purposes of clarity, HRSDC's responses to the recommendations outlined in the summative evaluation have been categorized using these four broad areas.
Recommendations
Eligibility for Student Financial Assistance
To qualify for a Canada Student Loan, a student must satisfy the criteria prescribed by the Canada Student Financial Assistance Act and Regulations, and demonstrate a financial need. This needs assessment process is undertaken on behalf of the Government of Canada by participating provincial and territorial student financial assistance programs. Among the elements that are considered during the needs assessment process are the student's category (single or married, dependent or independent), the student's PSE expenses (including tuition, fees, books, and living expenses) and their financial resources (including a student's income, savings and assets, parental or spousal contributions). Based on these criteria, a student's eligibility as well as the amount of student financial assistance is determined.
Recommendations 1, 5, and 6 of the evaluation report address specific issues with respect to needs assessment:
Recommendation #1: That CSLP look for ways to simplify the needs assessment process in order to help students better understand the process.
We agree with this recommendation. In collaboration with provincial and territorial partners, via the Intergovernmental Consultative Committee on Student Financial Assistance (ICCSFA), the needs assessment process is periodically reviewed to identify ways to further improve and simplify the process. ICCSFA is a federal-provincial body that meets regularly to examine policy and programming elements relating to student financial assistance in Canada.
Part of this collaboration centers around developing a series of communication tools for students to help them better understand the needs assessment process. For example, on-line calculators have been developed to assist students to estimate the amount of funding they can expect to receive so that they can plan for their education and the associated costs prior to submitting a student loan application. On-line application processes are also available to students to help them navigate though the application process. Financial aid offices at PSE institutions and provincial/territorial student financial assistance offices have the capacity to respond to student inquiries related to needs assessment.
Communication and outreach activities are undertaken to encourage students with financial need to apply for student assistance under the CSLP. Given the importance of understanding what obstacles may exist to prevent students from applying for support, HRSDC is currently conducting an experiment in fifty high schools in British Columbia with low secondary-to-post-secondary transition rates, to examine the impact of providing students with hands-on counseling on PSE options. Counseling includes support in completing applications for PSE admission and for student financial assistance. A final report on the results of this initiative is expected in 2012 and will enable the CSLP to examine the application process to ensure it is meeting the needs of applicants.
Recommendation #5: Although the needs assessment system seems to work well, the provincial uniform cost-of-living allowances should be rethought because some expenses (especially shelter) can vary significantly from the average provincial expenses, depending on whether students live in large urban centres, small urban centres, or rural communities.
We agree that the needs assessment system works well. In collaboration with our provincial and territorial student financial assistance partners, needs assessment criteria are reviewed by the Government of Canada on a regular basis so that adjustments may be considered to reflect increases in student costs over time.
The current CSLP methodology for calculating cost of living allowances within a province is based on the largest (most expensive) urban centre in each province. As noted in the evaluation report, this approach can result in students from low-cost regions of the province receiving cost of living allowances that exceed their actual needs. However, in our view, the administrative complexity and associated costs of introducing variable cost of living allowances within a province would more than offset any benefits.
Recommendation #6: Parental contributions were identified as an issue in the 1997 evaluation and in studies since that time. Although HRSDC has modified some rules related to parental contributions, evidence collected for the current evaluation indicates that some further adjustments should be made to the parental contribution rules.
We agree with this recommendation. Given that parental contributions are a key component in determining entitlement to student financial assistance, examination of issues in this area is undertaken on an ongoing basis as part of the work of ICCSFA.
Parental contributions have been adjusted several times in recent years. In 2004 and 2006, expected parental contributions were lowered in relation to family income and province of residence, thereby making thousands more students from middle-income families eligible to benefit from Canada Student Loans.
For applicants who dispute the assessment of their financial situation, including their expected parental contribution, an appeal process is in place to allow for a reconsideration of their assessment by provincial/territorial student aid authorities. This appeal mechanism seeks to maintain a balance between ensuring that program funds are issued on the basis of financial need and that students with demonstrated financial need are not denied access to support required to pursue PSE study.
Student Financial Assistance for Part-Time Study
While students in full-time study are the main beneficiaries of the CSLP, the Program does offer support to those whose circumstances are such that they participate in PSE on a part-time basis.
Recommendation 4 addresses the participation rate in the CSLP for students in part-time study:
Recommendation #4: There is a need to improve the understanding of the part-time loans program and possibly make changes because the coverage is quite limited (e.g. the number of participants has declined by 50% since 2000). For example, the rationale is not very clear and does not seem to respond to the current part-time student situation.
We agree with this recommendation. A number of measures were announced by the Government of Canada in Budget 2008 to enhance student financial assistance for part-time students. These measures include:
- An increase in the lifetime maximum part-time loan amount from $4,000 to $10,000;
- Elimination of the requirement to make payments on part-time loans while in school; and
- Deferral of repayment until six months following completion of studies.
These recent enhancements, implemented in 2009, significantly improve the support to part-time students. Since these changes were implemented, the number of part-time students who have benefited from the Program has increased by 94% for loans and 22% for grants. The CSLP will continue to monitor the impact of these changes. The Program will also analyze data and results of Statistics Canada's Access and Support to Education and Training Survey (ASETS) to assess the extent to which the needs of part-time students are aligned with the current support available under the part-time program.
Repayment Following Completion of PSE
The Government of Canada is committed to helping students throughout the lifecycle of their student loans. Following completion of study programs, Canada Student Loan borrowers are required to enter into consolidation agreements to repay their loans. For the majority of borrowers, this is their first experience with loan management. As such, a concerted effort is made by the Government of Canada to communicate with borrowers prior to consolidation of their loans to ensure that they are fully aware of their responsibilities as well as the repayment options that are available to them, including repayment assistance programs.
To better assist borrowers experiencing difficulty in repayment, in 2009, the Government of Canada replaced the Interest Relief and Debt Reduction in Repayment programs with the new Repayment Assistance Plan (RAP). The underlying principle of the RAP is that borrowers should not be required to make a student loan payment above an affordable level and that the repayment period should not exceed fifteen years. Following the calculation of an affordable payment, which takes into account family income, family size, and the amount of loan balance, borrowers may receive support under the RAP if their monthly student loan payment exceeds an affordable payment level. For borrowers who qualify, the Government of Canada assumes portions of their interest and/or principal and they are required to make reduced or no payments on their loans during approved periods.
During the 2009-2010 loan year, more than 155,000 borrowers benefited from RAP, of which approximately 90% were not required to make any payments on their student loan. In comparison, during the 2008-09 loan year, approximately 130,000 borrowers received Interest Relief (IR) and approximately 2,500 benefited from Debt Reduction in Repayment (DRR).
In addition to RAP, the Government of Canada has also introduced the Repayment Assistance Plan for Borrowers with a Permanent Disability (RAP-PD). Like RAP, RAP-PD makes it easier for student loan borrowers to manage their debt by paying back what they can reasonably afford. Under RAP-PD, eligible borrowers make loan payments based on income and ability to pay, including consideration of disability accommodation costs.
A variety of key communication channels, including student financial assistance offices at PSE institutions, are used to disseminate information about the repayment options available to students, including support under RAP and RAP-PD. In 2008-2009, the redesign of the CanLearn.ca site provided for clear messaging about repayment options and support measures.
The evaluation draws attention, under Recommendations 2 and 3, to the awareness level of CSLP recipients upon entering into the repayment phase:
Recommendation #2: That the program improve student awareness of the support available to them at loan consolidation time.
We agree with this recommendation. Given that a student loan is often a borrower's first experience with loan management, the Government of Canada works on an ongoing basis to improve communication with borrowers at the time of consolidation.
In collaboration with student financial assistance partners, the CSLP undertakes regular outreach activities to disseminate information about repayment options and repayment support. These activities include exhibits, campaigns, online resources, toolkits, publications, as well as repayment seminars at educational institutions.
Each year, the CSLP, via the Service Provider Footnote3 , pro-actively contacts over 180,000 student borrowers who are approaching repayment to discuss repayment options and support. In addition, counselling sessions are targeted to address borrowers with a high statistical probability of encountering repayment difficulties, including those who have withdrawn early from their programs of study and have not continued their post-secondary education. The CSLP has also developed two online modules to inform borrowers about student loan repayment. These modules provide information to borrowers who are about to take their first Canada Student Loan and those who are about to begin repayment of their Canada Student Loan.
These initiatives, among others, have resulted in positive outcomes in terms of borrower awareness. According to the most recent CSLP Client Satisfaction Survey, in 2009-2010, 83% of borrowers found their repayment options to be clear.
Recommendation #3: That CSLP explore the idea of changing the name of the grace period, because the use of this term often leads to confusion for students about whether interest accrues during this six month period.
We agree that the term "grace period" may be confusing to some borrowers, and will continue to work with our provincial/territorial partners to explore a more effective way to communicate how the student loan program works. The "grace period" refers to the fact that borrowers are entitled to defer their student loan payments for six months following the completion of PSE studies, but that interest on Canada Student Loans will continue to accrue during this period. However, the confusion on the part of some borrowers may stem from the fact that some provinces do not require interest to accrue on provincial student loans during this six-month period. To mitigate any confusion, the CSLP undertakes to effectively communicate this term in all appropriate communication to borrowers, including student loan documents, on the CanLearn website, and through the Service Provider call centre.
Default Management
Given the negative consequences of loan default for both students and government, the CSLP seeks to improve repayment rates as part of a comprehensive approach to the effective management of the student loan portfolio.
CSLP's strategy with respect to default prevention includes: the provision of non-repayable grants, which reduces debt balances; effective and targeted communication with borrowers prior to their completion of PSE; repayment assistance for borrowers experiencing difficulty in repayment; and a performance-based contract with the Service Provider which provide incentives for improved student loan repayment rates.
To receive Canada Student Loans, students must be enrolled in PSE institutions which have been designated as eligible by provincial/territorial governments. Designation criteria are an important tool in pursuing objectives to reduce loan default rates and ensure that PSE investments are protected.
Recommendation 7 addresses the importance of continuing to undertake research and analysis of the student loan default rate, including the impacts of repayment support measures:
Recommendation #7: A policy research study should be conducted on the optimal default rate that takes into account the costs of repayment assistance programs. For example, the research should examine whether it is always beneficial to the government to increase assistance through repayment assistance programs in order to reduce student loan default rates. Similarly, a more pro-active pre-consolidation counselling approach could be further explored by the department to help borrowers understand debt management measures and reduce the default rate.
We agree with this recommendation and are continuing to use the latest research and analysis to build on our understanding of repayment assistance programs and their relationship to default rates.
The CSLP constantly monitors the student loan repayment portfolio to ensure that loans are being repaid, and not entering default. The vast majority of student borrowers repay their loans on-time and in full. In it most recent report (as of July 31, 2009) the Office of the Chief Actuary reported that more than 87% of loans disbursed are repaid.
The CSLP uses a 3-year cohort default rate as a main indicator of the portfolio's performance. Since the Government of Canada took over the lending of student loans in 2000, the default rate fell significantly between 2001-2002 and 2008-2009, from 38% to 14%. This decline was observed across all institution types, and was most significant for borrowers at private institutions (a decline of 28%).
The CSLP has developed a comprehensive Portfolio Management Strategy aimed at improving the management of the Canada Student Loan Portfolio as a whole. The Strategy is designed to improve repayment rates, increase the amount collected from defaulted loans, and reduce overall costs to the Program. There are initiatives in place which focus on each of the four phases of the loan life-cycle: application and disbursement, in-study account management, repayment and debt management, and collections. This includes a number of initiatives targeted at reducing risk to the Direct Loans portfolio. For example, the CSLP uses its service provider to contact borrowers who are statistically more likely to default to offer them loan counselling before their first scheduled payment.
There are additional integrity and performance improvement measures which include: oversight tools such as audits and risk assessments; fraud or abuse investigations which focus on situations that have been flagged for additional scrutiny; and a pan-Canadian designation policy framework which supports governments in working with educational institutions to improve the performance of the student loans portfolio.
Conclusion
HRSDC is committed to ensuring that the CSLP is fully responsive to the needs of Canada's post-secondary students, and will continue to explore ways to improve and enhance the design and delivery of the Program in collaboration with partners and stakeholders. The findings and recommendations of this evaluation will inform and support that work and contribute to a more effective and efficient Program for the future.
1. Introduction
This report presents a summary of the findings and conclusions of the summative evaluation of the Canada Student Loans Program (CSLP). The CSLP is intended to promote access to post-secondary education (PSE) for students with demonstrated financial need.
The last summative evaluation of the CSLP was completed in 1997. Since then, the CSLP has undergone significant changes such as the replacement of the risk-shared loan regime with the direct loan regime in 2000. A formative evaluation of the direct loan regime was completed in 2004. The formative evaluation was focused on examining issues of program relevance, design and delivery, but did not assess the impact of the CSLP on access to PSE.
1.1 Methodology and Limitations
Given the size and complexity of the CSLP, the evaluation framework developed for the summative evaluation proposed a series of smaller studies over a five-year period, rather than the more standard one large evaluation over the course of two years. As well, as stipulated in the evaluation framework, each year was focused on and addressed a specific theme Footnote4 . The intention was to build up a body of knowledge and encourage a year-to-year exchange with the program area. Conducting the evaluation over a five-year period also gave more flexibility to adjust the evaluation Footnote5 .
The evaluative activities were organized around a set of evaluation questions that included questions regarding program rationale, program objective and achievement, impacts and effects, cost-effectiveness, and program delivery issues and communications. The full list of evaluation questions can be found in Appendix 1 (which also indicates where each question is answered in the report and the lines of evidence used).
A total of 32 studies were conducted to address the evaluation questions. The range of methods used in addition to the literature reviews and international comparisons included:
- Surveys – a survey of 1,582 student loan decliners and an examination of existing surveys (the 2007 CSLP Client Satisfaction survey and the 2007 Omnibus survey).
- Focus Groups – a total of 16 two-hour focus groups in four cities (Halifax, Toronto, Calgary and Vancouver) with (i) borrowers in study or recent graduates; (ii) borrowers who have consolidated their loans and never used debt management measures nor defaulted; (iii) borrowers who were on or had received Interest Relief (IR); and (iv) borrowers who defaulted on their loan. The key issues addressed in the focus group sessions were whether the need assessment accurately reflects a student's financial needs, whether repayment structures and income limits for extended IR are reasonable, the extent to which students make use of other sources of funding, and the existence of program delivery and communications issues.
- Key informant interviews – a total of 45 key informant interviews with respondents from academic institutions, non-governmental organizations, student associations, provincial and territorial government employees, and federal government employees. The purpose of the interviews was to investigate the ongoing relevance of the CSLP, the perceived effectiveness of the program in meeting its objectives, the perceived short- and mid-range impacts and effects of the program, areas where the program has been successful, and areas where the program can be improved.
- Administrative data analyses and econometric analyses of a linked database consisting of CSLP administrative data and the Longitudinal Administrative Database (LAD) from Statistics Canada.
A summary of the 32 studies is provided in Appendix 3 Footnote6 . In addition, other academic studies were used to complement the work done for this evaluation.
The summative evaluation was focused on the direct loan period from 2000 to 2008 (a period containing more accurate administrative data), although references to the last years of the risk-shared regime (1998 and 1999) are included for comparison purposes. As well, the evaluation was focused on the nine provinces and one territoryand one territory that participate in the CSLP Footnote7 . Readers should also note that all amounts presented in this report are expressed in nominal terms except where otherwise indicated and that all amounts reported represent the federal portion only.
There are a few limitations with the summative evaluation:
- The evaluation focused more on the student loans aspect of the CSLP and devoted less attention to examining student grants, as loans comprise the bulk of CSLP annual expenditures. Similarly, there is more analysis of full-time PSE students than part-time PSE students.
- Findings related to the impact of loan repayment assistance measures on student loan default rates should be interpreted with caution due to a lack of multiple robust lines of evidence.
- Due to insufficient reliable evidence for some evaluation questions, 8 of the 71 questions have been left unanswered (see Appendix 1 for more detail).
1.2 Organization of Document
Section 2 of this report examines the program's rationale, objective and various activities. Section 3 examines the extent to which the program achieves its objectives of reducing financial barriers and improving PSE access. Section 4 examines program costs including cost-effectiveness. Section 5 examines the indirect impacts of the CSLP, such as its macroeconomic impacts, interactions with other programs, and repayment issues. Section 6 focuses on some program delivery issues. The last section summarizes the overall conclusions and identifies the recommendations arising from the evaluation.
2. Background
This section begins with a short history of the CSLP, and then examines the program's rationale, objectives and various activities (such as the provision of student loans and grants, and loan repayment assistance).
The history of the CSLP can be divided into three main periods:
- The guaranteed loan regime;
- The risk-shared loan regime; and
- The direct loan regime.
The initial period of the CSLP is often referred to as the guaranteed loan regime. The CSLP was created in 1964 under the Canada Student Loans Act (CSG) to promote access to PSE. Under the CSLA , the CSLP provided 100% government-guaranteed loans through banks and credit unions to students with demonstrated financial need. The participating provincial and territorial governments Footnote8 assumed the general administration of the program.
The period between 1995 and 2000 is often referred to as the risk-shared loan regime. In 1994, the Canada Student Financial Assistance Act (CSFAA) was introduced. It replaced the guaranteed loan regime with a risk-shared loan system starting in 1995/96. Under the risk-shared system, participating financial institutions were paid a risk premium for loans going into repayment each year. The CSFAA also established Canada Study Grants (CSGs), which provide non-repayable financial assistance to PSE students with particularly high levels of need and to women enrolled in doctoral programs.
The current period of the CSLP is referred to as the direct loan regime. When the majority of financial institutions opted out of participating in a proposed new agreement on the delivery of the CSLP, the Government of Canada announced on August 1, 2000 that it would assume the full responsibility for financing and administering the program. The responsibility was transferred to the Government of Canada through a corresponding amendment to the CSFAA. Since then, student loans have been provided directly by the federal government with a 60/40 federal/provincial cost-sharing arrangement with participating provinces Footnote9 . It should be noted that Human Resources and Skills Development Canada (HRSDC) is still managing borrower files from previous regimes and will do so until 2028 Footnote10 .
2.1 Program Rationale
The mandate of the CSLP is "to promote accessibility to post-secondary education for students with demonstrated financial need. The CSLP lowers financial barriers through the provision of loans and grants which help ensure that Canadians have an opportunity to develop their knowledge and skills to participate in the economy and in society." Footnote11
The CSLP seeks to promote PSE access for students with demonstrated financial need by:
- Providing loans and grants to eligible individuals;
- Developing and implementing policies that balance requirements for accountability, integrity and responsiveness to the changing needs of students and society;
- Providing information to help students and their families make informed choices;
- Enhancing and improving the delivery of services, resulting in high client satisfaction;
- Ensuring the development and renewal of a valued, knowledgeable, motivated workforce within the CSLP; and
- Building on and improving collaborative partnerships with federal, provincial and territorial partners, stakeholders and student organizations.
The Government of Canada has also highlighted the importance of PSE. For example, the 2008 Speech from the Throne stated "Our Government will strengthen Canada's workforce for the future by continuing to support student financial assistance and taking measures to encourage skilled trades and apprenticeships. Footnote12 "
The discussion that follows looks at the rationale of the CSLP by examining:
- The need for governments to facilitate access to PSE;
- The need for a student loan program; and
- Reasons for the involvement of the federal government in student loans.
2.1.1 A Need for Government Intervention in PSE
The main arguments for government support for PSE can be described as increasing access to PSE, generating positive social benefits that go beyond the economic benefits to the individual and promoting a more equitable society. There is evidence regarding the continued value of PSE because, for example, educated individuals usually earn more as a result of their education.
The basic economic rationale for government intervention to facilitate access to PSE is that the benefits to society from having an educated population go beyond the economic benefits to the individual. For example, Riddell (2006) describes some of the potential social benefits of having an educated workforce. These benefits include an increased overall level of knowledge, improved knowledge creation (e.g. more ideas will be generated), better lifestyle choices (better health), reduced criminal activity and increased civic participation.
Government intervention to facilitate access to PSE in the case of students with demonstrated financial need can also promote a more equitable society and ensure that individuals can choose their optimal level of education. Some students are more likely than others to face financial barriers, particularly students from low-income families. Student financial assistance programs can be designed to reduce the financial burden for those with credit constraints (tuition and living expenses) and concerns about debt.
2.1.2 Why Student Loans?
The argument for providing a student loan program to facilitate access to PSE is that students are often unable to borrow from the private sector to pay for their PSE due to a lack of collateral as well as the inability of financial institutions to assess future income Footnote13 . Key informants were unanimous on the need for some form of government program. They were convinced that a significant number of students would not be able to attend PSE if the CSLP did not exist. As well, the literature review showed that all of the reviewed countries have at least some form of student loan or grant regime. This indicates a general consensus that the credit constraints are sufficient to warrant government action.
The literature review suggests there is also a consensus that multiple forms of student assistance increase PSE enrolment levels. For example, Singell (2001) found that needs-based grants, subsidized loans, and work study programs encouraged enrolment in a large public university. Nevertheless, there is less evidence that loans have a positive impact on overall PSE enrolment (perhaps with the exception of the Dynarski (2003) study). For example, the review suggested that if an existing student aid program switches from providing primarily loans to providing primarily grants or a combination of loans and grants, then there appears to be no statistically significant enrolment response except for low-income students.
It should also be noted that studies have found both positive and no enrolment effects associated with federal grant programs in the U.S. (Section 3.4.3 provides a further discussion of efforts to measure the impact of student loans and grants on access to PSE).
2.1.3 Involvement of the Federal Government
In most provinces and territories, the student loan regime is a shared responsibility of the federal and provincial governments. In the case of a non-participating province or territory, the federal government transfers funds so that the non-participating jurisdiction can operate its own program Footnote14 . The main arguments for the involvement of the federal government in student loans to facilitate PSE are equality of access across the country and historical precedent, as discussed below.
Key informants unanimously agreed that there was a need for a federal program designed to help key targetdifferent groups access PSE. In general, there was a strong consensus that the federal government should play some role in student loans, although there were differences of opinion on what the optimal split of responsibility should be. Some key informants suggested that the current 60/40 federal/provincial cost-sharing arrangement with participating provinces could be adjusted depending on the needs of each jurisdiction. However, student groups and institutions had no problem with the current split.
From a historical perspective, the literature review described how the federal government has played a role in providing student loans since the late 1930s, when student loans were seen as a way to help students deal with the economic hardships of the Depression. The literature review noted that all of the provinces had joined the Dominion-Provincial Student Aid Program by 1944 which, along with the Veterans Rehabilitation Act (1945), were the precursors to the CSLP (established in 1964).
International comparisons showed that there are several other countries where loans are issued by the central government, such as the Federal Stafford Loans in the United States and Germany's student loan program.
2.2 Description of the Program
Since 1964, the activities of the CSLP have evolved considerably. For instance, the government announced many changes to the CSLP under the 1998 Canadian Opportunities Strategy, which included the creation of new grants (CSGs) for full-time students with dependants, the creation of the Debt Reduction in Repayment (DRR) provision, as well as enhancements to the Interest Relief (IR) provision.
Since the shift to the direct loan regime (in 2000), more changes have been incorporated into the CSLP such as a new CSG for high-needs students with permanent disabilities (2002), changes to in-study exemptions (2003), and new amendments to the IR and DRR provisions (2003).
Some additional changes were announced in the 2004 Budget (which came into effect on August 1, 2005). These changes included increasing the loan limits and the allowances for computer-related costs, reducing expected parental contributions, increasing the income threshold for IR eligibility, increasing the amount of DRR, and implementing new grants (Canada Access Grants).
In the 2005 Budget, it was announced that eligibility for loan forgiveness for direct loans would be extended in the event of death or permanent disability. The 2006 Budget announced that parental contributions would be further reduced starting on August 1, 2007. Further changes were announced in the 2008 Budget, but those changes are beyond the scope of this evaluation.
The current evaluation is focused on examining CSLP activities under the following structure:
- Canada Student Loans (CSLs);
- Canada Study Grants (CSGs) and Canada Access Grants (CAGs); and
- Loan repayment assistance.
2.2.1 Canada Student Loans (CSL)
Under the current legislation, the CSLP provides financial assistance in the form of direct loans to students with demonstrated financial need Footnote15 . These loans are available to students enrolled in full-time or part-time studies at a designated PSE institution Footnote16 .
In order to receive financial assistance in the form of a CSL, students must satisfy initial eligibility criteria Footnote17 . Upon establishing eligibility, a needs assessment is conducted to determine the amount of each student's financial need. The needs assessment process is designed to take into account provincial differences and the additional needs of certain groups (e.g. students with dependents, students living away from home, students who relocated to pursue PSE).
Provincial and territorial government partners determine both eligibility and level of need using federal criteria. From 1995 to 2004, the maximum weekly federal loan limit that could be received by a student was $165. The federal loan limit was increased to $210 per week at the start of the 2005-2006 loan year.
While a student borrower is pursuing full-time studies, the federal government (through the CSLP) the federal government (through the CSLP) subsidizes the interest that would otherwise accumulate on the loan principal. The borrower is required to begin repayment of the loan within six months after ceasing full-time studies. However, the interest subsidy does not apply to the six month post-study period. This six-month period is called the "grace period". Students studying part-time might be eligible for the part-time student loans program. The conditions for these loans differ from the full-time student loans program.
2.2.2 Canada Study Grants (CSGs) and Canada Access Grants (CAGs)
Up until 2008, the CSLP provided non-repayable financial assistance in the form of CSGs and CAGs to PSE students with particularly high levels of need who qualified for loans (these two grant programs were discontinued and replaced by the Canada Student Grants Program in 2009).
- CSGs assisted students with permanent disabilities, high-need students with permanent disabilities, high-need part-time students, students with dependants, students from low-income families and female students in doctoral programs in which women are traditionally under-represented.
- CAGs assisted first-year students from low-income families and students with permanent disabilities.
Eligibility for the grants was determined by provincial and territorial partners using federal criteria.
Key informants generally agreed that most of the targeted groups should receive grants because the need of these groups was high (due to a variety of circumstances). However, some argued that it was difficult to find an explicit rationale for the grant for female students in doctoral programs in non-traditional fields. Key informants felt that since females now make up a greater percentage of university students than males, it is likely that any disparity in the numbers of doctoral students will resolve itself. Their views are supported by available data which show that the 17-to-29 year-old full-time participation rate was 15.3% for females compared to 11.4% for males in 2005-2006 Footnote18 . As well, a Canadian Education Statistics Council study showed that the doctorate graduate rate for males was 1.1% in 1994 and in 2005, while the doctorate graduate rate for females increased from 0.5% to 0.9% during the same period Footnote19 . Additional information from the Statistics Canada Survey of Earned Doctorates indicates that the proportion of women graduating from Canadian doctoral programs was just over 50% in 2004-2005. In addition, given that many Canadian universities now offer guaranteed funding to doctoral students, it seems unlikely that this group is facing particularly high financial needs.
2.2.3 Loan Repayment Assistance
In addition to providing assistance for access to PSE in the form of loans and grants, the CSLP provides a variety of assistance to student loan borrowers who are having difficulties meeting their repayment obligations. Although IR and loan forgiveness existed prior to 1998, some loan repayment assistance measures were introduced in the 1998 Budget, and most were extended in the 2003 and 2004 Budgets (the Repayment Assistance Plan introduced in 2009 replaced the existing loan repayment assistance provisions).
- Borrowers experiencing financial hardship in repaying their loans could bewere eligible for up to 30 months of IR during the lifetime of their loans. Under IR, the government paidys the interest on the loan and the borrower wasis not required to make any payments on the principal or interest.
- Following 30 months of IR and during the first five years after leaving school, borrowers continuing to experience financial hardship could an apply for an additional 24 months of Extended Interest Relief (EIR). This would bring the total to 54 months during which no payment of interest or principal wasis required.
- Borrowers experiencing financial hardship in repaying their loans couldan ask for a revision of the terms of repayment.
- Borrowers still experiencing financial difficulties after five years of leaving full-time or part-time study, and who hadve exhausted IR and EIR, could apply to have their loan principal reduced through DRR. Currently, an individual couldan receive up to three reductions on their loan principal during their lifetime, for a total of up to $26,000 (depending on their financial circumstances).
- A borrower with a permanent disability couldmay request that their loans be forgiven should were they be unable to repay the loan without exceptional hardship due to their disability. Loan forgiveness couldmay also occur in the case of death.
Key informants had a positive view towards debt management measures such as IR and DRR. They believed that these measures reduced the likelihood of complete default by the borrower. Key informants also believed that borrowers present a high short-term risk while they are looking for employment after PSE, but present a much lower long-run risk. Therefore, measures that help the borrower get over this initial hurdle will ultimately lead to higher loan repayment overall. Indeed, most studies confirmed that default occurred within three years after loan consolidation.
3. Achievement of Program Objectives
As noted in Section 2.1, the objective of the CSLP is to "promote accessibility to post-secondary education for students with demonstrated financial need. The CSLP lowers financial barriers through the provision of loans and grants which help ensure that Canadians have an opportunity to develop their knowledge and skills to participate in the economy and in society."
An estimate of the potential PSE population for the 2005-2006 academic year (based on the October 2005 Labour Force Survey) indicates that there were about 2,229,600 potential university, community college, CEGEP Footnote20 and other PSE students in Canada, or approximately 7% of Canada's population (this includes Quebec). However, the CSLP program does not target every potential PSE student (i.e. is not a universal program), but focuses on students with demonstrated financial needs. As well, full-time PSE students and part-time PSE students face different CSLP rules (as noted in Section 2.2.1). Therefore, to assess whether the CSLP achieved its objective, this section examines:
- The coverage of the program and the characteristics of program participants in the case of full-time PSE enrolment and part-time PSE enrolment; Footnote21
- The needs assessment approach used by the CLSP; and
- Access to PSE under the CSLP.
3.1 Full-Time PSE Enrolment
The actuarial reports of the Office of the Superintendent of Financial Institutions provide an estimate of the full-time PSE enrolment population each year, which is also used in the CSLP annual reports. These reports indicated that the full-time PSE enrolment population was about one million students in 2007-2008, an increase of 243.6% since 2000-2001 Footnote22 .
Table 1 shows the number of PSE students enrolled full-time (using both actuarial reports from the Office of the Superintendent of Financial Institutions (OSFI) and the Labour Force Survey) and the number of full-time student borrowers to whom loans were disbursed by the CSLP since the 2000-2001 loan year. This information shows that the number of borrowers was relatively stable over the period (with an overall increase of 2.7% between 2000-2001 and 2007-2008), while the CSLP coverage of full-time PSE students declined between 2000-2001 and 2007-2008 (from 41.82.4% to 34.4%5.2%). This reduction in coverage may be partially explained by a change in the socio-economic status of PSE students. The Canadian Education Statistics Council study showed that 50% of university graduates (40% of public college graduates) borrowed from a government student loan program in 2005, a proportion that has been fairly stable since 2000 Footnote23 .
Table 1 also shows the average loan size since the 2000-2001 loan year. It is worth noting that the average loan size increased by about $800 in 2005-2006, as a result of an increase in the loan limit (as mentioned in Section 2.2.1). Nevertheless, a study done by The Brondesbury Group indicated that the amount of federal disbursement has declined in constant (i.e. inflation-adjusted) dollar terms over the period.
| Loan Year | Number of PSE Students Enrolled Full-Time (OSFI) | Number of PSE Students Enrolled Full-Time (LFS) Reference ** is located after the table | Number of CSLP Borrowers | % of CSLP Participants (% of OFSI) | Average Loan Size |
|---|---|---|---|---|---|
| 2000-2001 | 822,040 | 914,068 | 343,588 | 41.80% | $4,554 |
| 2001-2002 | 865,452 | 945,137 | 328,674 | 37.98% | $4,586 |
| 2002-2003 | 904,763 | 996,768 | 328,991 | 36.36% | $4,695 |
| 2003-2004 | 981,425 | 1,053,795 | 340,203 | 34.66% | $4,830 |
| 2004-2005 | 998,61 | 1,087,688 | 337,256 | 33.77% | $4,829 |
| 2005-2006 | 1,003,841 | 1,103,925 | 343,638 | 34.23% | $5,631 |
| 2006-2007 | 1,001,676 | 1,112,731 | 343,261 | 33.93% | $5,614 |
| 2007-2008 | 1,024,182 | 1,108,300 | 352,708 | 34.44% | $5,706 |
-
Source from the above table Source: OSFI Actuarial Reports, CSLP Annual Reports, Statistics Canada Labour Force Survey.
Note: Reference ** from the above table LFS figures for 2000/01 loan year reflect the average of 2001 in-school months (January to April and September to December), figures for 2001-2002 loan year reflect the average of 2002 in-school months, etc.
3.1.1 Gender
A trend analysis study conducted for this summative evaluation showed that PSE enrolment has increased slightly for both genders, although the increase in the enrolment rate for females was greater Footnote24 . Another study showed that, compared to males, young females had a higher full-time PSE participation rate (by 8 percentage points) and a higher CSLP take-up rate (by 5 percentage points) in 2000 Footnote25 . This situation continued in 2007-2008, with females comprising 54.6% of all PSE students and close to 60% of all CSLP recipients.
The CSLP annual data showed that the increase in the number of CSLP participants from 1998-1999 to 2007-2008 has been entirely due to an increase in female participants (which increased by 12%), while the number of male participants decreased by 5.3%. The study done by The Brondesbury Group corroborated this finding, showing that there have been slightly more female CSLP participants than male participants since 1993.
3.1.2 Provinces
Kapsalis (2006) reported that, in 2000, the average PSE enrolment rate (approximately 30%) was similar in most Canadian regions. The exception was Ontario (36%). The study indicated that the Atlantic region had the highest CSLP take-up rate (45%) compared to the other regions (between 28% and 31%). Since 1998-1999, most of the provinces show minor changes in the number of CSLP participants, with the exception of a major decline (-51%) in Newfoundland, as well as declines in Saskatchewan (-20.7%) and Manitoba (-17.5%) Footnote26 . The number of Ontario CSLP participants has increased by more than 60,000 since 2001-2002.
The trend analysis study provides a partial explanation for these provincial changes in CSLP take-up rates, especially in Newfoundland and Ontario. It showed that the number of full-time PSE students decreased by 18% between 1998 and 2006 in Newfoundland (according to the Labour Force Survey), while the number of PSE students in Ontario increased by 17% over the same period. Other factors that may help to explain the large decline in the number of CSLP participants in Newfoundland is a drop in tuition fees of $1,174 over the 1998-1999 to 2006-2007 period and a 30% increase in the median income (12 percentage points higher than all of Canada). This issue is examined further in Section 3.3.2.
3.1.3 Age and Marital Status
Data from the 2005 Labour Force Survey indicated that the majority (86.0%) of the full-time PSE population in Canada is less than 30 years old. A review of the annual CSLP reports showed that most participants (about 80%) are below the age of 25. As well, the proportion of participants 30 years of age and older declined significantly (from 15% to 10%) from 1998-1999 to 2007-2008. The trend analysis study conducted for this evaluation corroborated this finding and indicated that "the age of borrowers seems to have slightly decreased between 1998 and 2005."
The Brondesbury Group study reported that the younger age group (18 to 22 year olds) was less likely to take student loans than the older group (23 to 26 year olds). It is possible that the younger age group is more likely to rely on their family as a source of financing, while the older group has workforce experience and is more likely to be making independent financing decisions. Evidence in the study indicated that those who collected Employment Insurance benefits during the preceding year were more likely to apply for student loans. Since Employment Insurance is only available to those with workforce experience, it may support the explanation above.
In 2005, the proportion of single PSE students was 71%, married or common law couples 26%, and all others 3% (based on the Labour Force Survey). The review of CSLP annual reports shows that since 2002-2003, the number of single participants has increased by 13.3%, while married or other types of students have both decreased by more than 20%.
As well, the non-singles groups accounted for a declining proportion of all CSLP participants. Between 2002-2003 and 2007-2008, their shares of CSLP participants dropped from 10% to 7.3% and from 6.7% to 4.7% respectively, while the single student proportion rose from 83.3% to 87.9%. The assessment of the needs for couples (married or in a common law relationship) might explain the difference between their proportion of the PSE population and their proportion of all CSLP participants.
3.1.4 Type of Institution
The trend analysis study showed that college enrolment between 1998 and 2006 declined slightly, while the full-time enrolment rate in university increased over this period Footnote27 . The population of CSLP participants also changed in terms of the type of institution. Over the decade, participants studying in university increased by 18.2% (the share of CSLP participants studying in university increased by 6.7 percentage points), while the proportion of participants studying in college remained constant. Those studying in private institutions fell by 27.6%. In 2007-2008, 59.3% of all university students were CSLP recipients, compared to 53% of all PSE students.
A possible explanation for the increased enrolment in university compared to college might be related to expected earnings. For example, in Drewes (2006) it was noted that "Past studies...have found real earnings of college graduates... from the 1985 cohort through to the 1995 cohort...to be in the order of 78% to 82% of university graduates". Similar results were found in the trend analysis study, which showed that the earning premium for university graduates over college graduates increased from 19% to 26% for males and from 27.6% to 34.9% for females between 1992 and 2002. As the earnings difference increased during the period, it is possible that students made an adjustment in favour of universities.
There were also changes in the proportion of CSLP recipients by study level. For instance, those studying at the undergraduate level and at the Masters level increased by 21.4% and 19.9% respectively over the 2000-2001 to 2007-2008 period, while those studying at the non-degree level (i.e. completing degree level courses for professional or personal interest) decreased by 18%. Those studying at the Doctorate level declined slightly over the period.
3.1.5 Those in Financial Need
The first objective of the CSLP is to lower the financial barriers to PSE for students with demonstrated financial need. Evidence from the trend analysis study, other studies and key informants confirmed that the CSLP appears to be is properly targeted towardslowering financial barriers for students from low-income families.
Some previous studies have indicated that full-time PSE enrolments are sensitive to parental income and parental education (Drolet 2005; Lambert et al. 2004). Similarly, the Labour Force Survey shows that, in general, PSE enrolment rates increase with the income level of the parents, especially in the case of university enrolment.
As expected, there is a negative relationship between parental income and CSLP take-up and the average loan received. For instance, 60% of students with parental income of less than $40,000 were CSLP recipients in 2000. The percentages decline significantly as parental income increases, rising from 51% for students from families with parental income between $40,000 and $60,000, to 5.5% for students with parental income of more than $100,000. The average loan for CSLP participants with parental income under $60,000 was fairly constant at around $4,000 per year. Overall, the trend analysis study concluded: "While participation in post-secondary education was found to increase with parental income, CSL eligibility was found to decrease with parental income. The CSLP seems, therefore, consistent with its goal of improving equity in post-secondary access."
In the case of independent students Footnote28 , student loans are not conditional on the income of parents. Therefore, the average loan received by independent students was constant across all parental income groups Footnote29 . As well, among independent students, the incidence of receiving loans was constant for low- and middle-income students (close to 40% for those with parental income under $60,000). At the $60,000 parental income threshold, however, the use of the CSLP among independent students started to decline, perhaps reflecting a correlation between student and parent resources.
Kapsalis (2006) provided corroborating evidence that the CSLP is well-targeted towardssucceeds in lowering financial barriers for students from lower-income families, especially in the case of dependent students. Participation in the program falls off dramatically as family income rises. Many key informants also corroborated this finding, indicating that the program is effective for low-income students. Nevertheless, some key informants felt that dependent students from middle-income families were underserved by the program. In particular, these key informants felt that the expected parental contributions from middle-income parents are too high, implying that some students from middle-income families whose parents don't contribute are denied the required student loan funding (the issues of parental contributions is discussed further in Section 3.3.3).
3.2 Part-Time PSE Enrolment and Part-Time Programs
Although there is no reference to an estimate of the part-time PSE population in the actuarial reports, a report developed for this evaluation using the Labour Force Survey estimated that the part-time PSE population was 460,000 in 2005 Footnote30 . As well, the estimated part-time PSE population has been fairly constant since 2000. Similarly, the fourth edition of the Price of Knowledge estimated part-time PSE enrolment to be 410,000 in 2005, excluding students enrolled in private career colleges Footnote31 .
Part-time CSLP loan recipients are a small percentage of the estimated total part-time PSE population (less than 0.5%), as shown in Table 2. This means that the part-time group also accounts for a small percentage of all CSLP loan recipients, as well as a small proportion of total program disbursements. Looking at the part-time group over time indicates that the number of part-time CSLP recipients decreased by more than 50% (from 2,980 to 1,436) between 2000-2001 and 2007-2008, while the average loan size remained fairly stable, even though loan limits increased in 2005-2006.
| Loan Year | Number of Borrowers | Average Loan Size |
|---|---|---|
| 2000-2001 | 2,980 | $1,812 |
| 2001-2002 | 2,867 | $1,717 |
| 2002-2003 | 2,772 | $1,649 |
| 2003-2004 | 2,779 | $1,680 |
| 2004-2005 | 2,572 | $1,798 |
| 2005-2006 | 2,127 | $1,795 |
| 2006-2007 | 1,863 | $1,880 |
| 2007-2008 | 1,436 | $1,948 |
- Source from the above table Source: CSLP Annual Reports.
The low level of CSLP participation among part-time PSE students may raise some uncertainty about the rationale and the achievement of CSLP objectives for part-time PSE students. Some could argue that the rationale for providing loans and grants for part-time students is weaker than for full-time students because part-time students might have more resources. However, it is possible that some of these students may not have enough collateral to get a private loan for studying.
Many key informants questioned the rationale behind having separate policy approaches for part-time and full-time students. They pointed out that part-time students were not as well served as full-time students by the part-time program and that the program is not meeting the objective of promoting "accessibility to post-secondary education for students with demonstrated financial need". As well, many key informants suggested that the part-time program should be thoroughly evaluated because the profile of part-time students has changed significantly since the inception of the program. They said that in today's environment, many students are often studying part-time because of other obligations such as family and work. They also said that these students should be encouraged to attend PSE, for the benefit of the students and for the benefit of society, and that any policy approach fostering part-time enrolment in PSE should be explored.
Key informants also felt that part-time students should not be charged interest during their studies. They were also generally opposed to the idea of changing the program so that it would reward students with a higher academic standing. They felt that there were already enough incentives in the system to encourage students to have high marks, and that the CSLP was not an appropriate vehicle to do this. However, a vast majority of key informants did support the idea of financial incentives for students to complete their studies.
It should be noted that the 2008 Budget implemented some changes in order to make loans more attractive to part-time students, but these changes are beyond the scope of this evaluation. Overall, the evidence presented above suggests that further work is needed to assess the rationale and effectiveness of the part-time program in greater detail.
3.3 Needs Assessment Approach Used by the CSLP
The CSLP operates on the basic principle that the cost of PSE is a shared responsibility between students, parents or spouses, and the government. Students and their families are expected to contribute based on their ability to pay, while government assistance is supplemental and based on the student's needs. Full-time loans are therefore provided on a needs-tested basis that takes into account both the student's available resources and the costs of PSE attendance. This needs assessment process is performed by provincial and territorial levels of government who apply the CSLP criteria with some variations. Many countries providing non-universal loans are using a similar system of needs-based assessments.
Needs assessments are highly individualized, because a large number of factors are involved in the determination of needs (e.g. the level of tuition fees, cost of living, marital status, living arrangements, student income, parental and spousal resources and family size). While this complexity has the advantage of providing more fairness in the determination of needs, some provincial officials interviewed during the 2004 formative evaluation found the needs assessment process to be complicated, especially from the students' perspective.
A needs assessment is performed for every eligible full-time PSE student who applies for the CSLP in any participating jurisdiction. The needs assessment process consists of four main steps:
- Identifying the student's category: single dependent, single independent, married or common-law, and single parent, and permanently disabled;
- Assessing the student's costs of PSE;
- Determining the resources available to the student; and
- Calculating the student's needs.
The focus group analysis indicated that, overall, the needs assessment process for loans was reasonably clear to the focus group participants. For example, there was recognition that financial need drives program eligibility and that the program uses multiple criteria to determine the amount of the student loan. Focus group participants had mixed views on the fairness of the needs assessment process, however. They felt that the overall categories of expenses and resources that are taken into consideration in the needs assessment process were generally acceptable, but they were less willing to accept the assumption of parental contributions.
Key informants generally held the view that, because the program is needs-tested, most of those who need a loan get a loan. They added that there will always be some gap between intended and actual beneficiaries and that the system can never be perfect. They indicated that the program generally does a good job and that overall the funding is well targeted.
The maximum loan limit was identified as an issue by some key informants and focus groups. Some of the key informants said that many student needs were unmet because many loans were capped at a certain amount. Given the capping of loans, even though students were assessed as needing more aid, they did not get it because of loan limits. Similarly, some in the focus groups felt that the borrowing limit could be increased to enable students to achieve a better balance between their work and school commitments. However, many of these focus group participants were uncertain whether they would have borrowed more even if the opportunity had been available to them, given their experience with repayment responsibilities and the costs of borrowing.
As mentioned earlier (in Section 2.2.1), the maximum loan limit was increased from $165 per week to $210 per week at the start of the 2005-2006 loan year. The actuarial reports showed that the percentage of students receiving the maximum loan was 42.6% in 2000-2001, increased to 52.9% in 2004-2005, and then fell to around 35% after the maximum limits were increased. These results suggest that the maximum limit was revised on time and probably addressed the issue raised by key informants and focus group participants. As evidence, a report completed for this evaluation showed that the percentage of borrowers with unmet needs declined after the increase in the loan limit. The loan limit might also partially explain the stable average loan amount for dependent students with parental income under $60,000 (as reported in Section 3.1.5). If so, then that situation could also have changed following the revision of the maximum loan limit Footnote32 .
3.3.1 Assessing the Cost of PSE
Student costs are assessed for the entire academic year in which the student is enrolled (number of assessed weeks) and include tuition and fees, books and supplies, living allowances (accommodation, food, transportation, and miscellaneous expenses), return transportation, and child care costs. As well, discretionary allowances can apply to any student who faces special circumstances.
The student expenses study conducted for this evaluation compared the student allowances with the associated student expenses in order to measure their adequacy. Overall, the study indicated that student allowances were roughly in-line with student expenses. Looking at different expenses, the report provided the following findings.
- Accommodation: The allowances seem to suit the needs of most students. However, single students in Alberta spent more than the allowable limit by about $61 each month – only students in Nova Scotia also spent more than the monthly allowance (by less than $5). In addition, some students pay rent to their parents, although it is not included in the loan calculation.
- Food: On average, each type of student in every province spent less than the allowance.
- Transportation: Given that the allowance is meant to cover only the costs of public transportation and that 36% of students (up to 50% in Alberta and Saskatchewan) own or lease a car, many students spent much more on transportation than the allowance. It should be noted, however, that students without a car spent less than the allowance. Public transportation might not be an option for students who attend school in more rural communities. However, car expenses may be included in the calculation of other allowances in the cases of students living at home who do not have access to public transportation and must drive a car to school (CSLP policy procedure).
- Miscellaneous expenses: Footnote33 When compared with the CSLP allowance, on average, loan recipients and all students spent below their allowance by an average of $15 and $33, respectively, without any major difference by province or type of student.
- Childcare: There was no significant difference between the allowance and the average spending on childcare.
- Books and supplies: Most students spent within the maximum allowance. In fact, only 6.7% of all students reported expenses that exceeded the maximum allowance.
The student expenses study also examined expenses that are not recognized by the CSLP but that could be seen as being a current expense for students. Examples of these types of expenses include meals in restaurants, entertainment expenses and other living expenses that are not captured in any other category. The "unrecognized" expenses category is relatively consistent across provinces and student types, amounting to approximately $170 per month. Many key informants and focus group participants felt that some student expenses were not properly covered, such as computers, internet access, books and other supplies (which are often more expensive than originally estimated).
Although student focus group participants generally did not feel that student loans are sufficient in light of the real costs associated with PSE, the student expenses study indicated that the current allowances are adequate in terms of meeting average monthly total student expenditures for the majority of students (66%). The allowances were, on average, approximately $85 per month higher than the average total expenditures.
The analysis by category of students revealed that the allowances for single students were slightly lower than their monthly expenditures by a range of $13 to $40 per month. Married students (with and without children) and single parents had a significantly lower level of expenditures than their living allowances.
3.3.2 Provincial Differences
Among Provinces
The living allowance provided through the CSLP is adjusted based on a provincial/territorial average cost associated with shelter, local transportation, food and miscellaneous personal expenses. Consequently, there are wide variations in the cost of living and the corresponding allowances among the provinces.
The cost of living study conducted for this evaluation confirmed that there were differences in cost among the provinces. In addition, the student expenses study indicated that the living allowances, on average, were slightly above the student expenses in almost all provinces with the exception of Alberta, where average expenditures were slightly above the allowances. As could be expected, Alberta had the highest proportion of students (40%) having expenses greater than the allowances.
Within Provinces
Although the living allowance provided through the CSLP is adjusted among the provinces, there is no variation in the cost-of-living allowance within a province. This means that the same costs are assumed within a given province regardless of the location (rural areas, urban areas and major urban areas). The 2004 formative evaluation reported that some of the provincial key informants suggested that the cost-of-living differentials could be considered regionally, within a province, rather than provincially. Some key informants for the current summative evaluation repeated the view that the standard of living calculations should be revised in many cases across jurisdictions. They suggested that regional disparity should be part of the calculation. Focus group participants indicated that they would generally approve of a system of living cost maximums that would be both sensitive to provincial differences and differences within provinces.
The cost of living study confirmed that there were differences in cost within each province. The study reported that, in each province, the average living allowances do not accurately reflect the average living costs for most of the student types. Living cost estimates for residents in larger urban areas were, in general, greater than the provincial averages by as much as 11%, mainly due to differences in the price of shelter. The study concluded that the current needs assessment methodology does not adequately account for differences in the cost of living associated with the size of the urban area. It should be noted that the study did not take into account that public transportation is often not available in rural areas, and that students in areas without public transportation would often need to use a car. Overall, however, these findings suggest that variation in the cost of living within provinces should be explored to determine how to better reflect differences in current student expenses within a province. These findings should not be confused with the findings presented in Section 3.1, which included education-related costs such as tuition, books, supplies and computer equipment.
3.3.3 Resources and Parental Income
As mentioned at the beginning of Section 3.3, determining the resources available to the student is essential when determining student needs. However, although targeting is good, it is not without risks. This step, specifically determining the parental contribution, raised concerns in the 2004 formative evaluation of the CSLP and in the 1997 summative evaluation of the CSLP. Similarly, the current evaluation also found that many key informants and focus group participants raised concerns about determining the parental contributions.
Key informants reiterated the view that dependent students are underserved by the CSLP and often have no control over their parent's ability to contribute. For example, some dependent students do not qualify for loans based on their parents' income, although their parents do not necessarily contribute to their education expenses. At the same time, however, many federal and provincial key informants pointed out that there is an established appeals process. Most key informants suggested that the expected parental contributions of dependent students were too high because some financial factors were not taken into consideration such as debt carried by the family and the relationship between parents and the student.
Student focus group participants across all locations raised concerns about the issue of parental contributions. Many participants noted situations where the assumed parental contribution either did not match the parents' ability to contribute or did not take into account that parents may simply not be willing to contribute. They cited reasons similar to those provided by key informants to explain smaller than expected parental contributions such as other family financial obligations and the nature of the relationship between parents and the student, as well as the parents' philosophy and values about PSE or their child's choice of school or program. Several focus group participants suggested that there should be some flexibility in the rules related to parental contributions to account for these situations.
Although HRSDC has modified some rules related to parental contributions Footnote34 , the evidence discussed above suggests that this issue should remain under examination.
3.4 Access to PSE under the CSLP
As indicated in Section 2, the most important goal of the CSLP is to promote access to PSE for students with demonstrated financial need. Also, as discussed in Section 2.1.2, belief in the need for this type of program appears to be essentially universal. At the theoretical level, the literature review showed that there is widespread agreement that a student loan regime should help to remove credit constraints. In doing so, it would reduce barriers to participation in PSE and increase access. Key informants were unanimous in their view that the CSLP was crucial and that a large portion of CLSP participants would be unable to attend PSE without their student loans. Similarly, the international literature showed that each of the examined countries had either a loan or a grant program (even those countries with no tuition fees).
To assess whether the CSLP is working to promote access to PSE as intended, the following discussion examines:
- The existence of financial barriers to PSE;
- Alternative ways a student might pay for PSE; and
- Evidence of the impacts of CSLP on PSE enrolment.
3.4.1 Existence of Financial Barriers
Table 3 shows the PSE participation rate of students in colleges or universities based on the income of their parents. It clearly shows that university participation increases with parental income levels. On the other hand, the connection between parental income and PSE participation is less pronounced for college attendance.
| Family After-Tax
Income Quartile |
PSE Participation Rate | |
|---|---|---|
| University | College | |
| Lowest | 21% | 30% |
| Lower-middle | 25% | 32% |
| Upper-middle | 30% | 37% |
| Highest | 38% | 30% |
| Overall | 29% | 32% |
- The source from the above table Source: 2005-2006 Departmental Performance Report.
The trends analysis study conducted for this evaluation found similar results. In particular, the study showed no relationship between full-time enrolment in college and parental income, but a pronounced relationship between university enrolment and parental income. About 27% of youth with a family income under $60,000 attended a university, and the proportion increased with income (up to 39% for students with parental income of $100,000 or more). This means there was a gap of 12 percentage points in university enrolment between students from the lowest and the highest income categories. To obtain a better understanding of the impact of the CSLP on PSE and university attendance, a key question is what would the gap have been in the absence of the CSLP? This includes asking what would students have done without the assistance of CSLP? These questions are examined in part below, in Section 3.4.2 and in Section 3.4.3.
The literature review showed that many studies have provided suggestive evidence of the existence and effects of credit constraints for students in a Canadian context.
- For example, the review cited Coelli (2004), Frenette (2005) and Neill (2006) as showing that youth from low-income households are more responsive to changes in tuition than youth from high-income households.
- Frenette (2006) used the Youth in Transition Survey to measure the number of youth at age 15 who wanted to attend university in the future, but who at 19 had not attended and cited finances as a reason. He found that 12% of the university attendance gap between the lowest and highest income quartiles is due to credit constraints. He found the rest of the difference to be explained by other factors such as standardized test scores in reading, school marks, parental influence and high school quality. Frenette's findings were derived under the current system, which includes the CSLP.
- The results of Frenette (2006) are similar to the findings of Carmichael and Finnie (2007). They found that family income was only relatively weakly related to "non-participation due to financial barriers", which led the authors to conclude that the financial aid system works to remove financial barriers. In the absence of the financial aid system, the prevalence of credit constraints for students might be much higher.
The study conducted for this evaluation to examine the impacts of being denied a student loan provided further evidence that the system in place reduces financial barriers and is well targeted Footnote35 . The study found that 48% of rejected applicants were from families earning $75,000 or more, while 54% of approved loans were from families earning less than $50,000. The probabilities of attending PSE were estimated at 94% for applicants who were approved and at 84% for applicants who were rejected. These results suggest that loan denial reduced the probability of attending PSE by roughly ten percentage points.
3.4.2 Alternative Ways to Pay for PSE
Many PSE students are working while attending school. During the 2008-2009 academic year, 48% of full-time PSE students between the ages of 20 and 24 worked at some point during the school year Footnote36 .
- Part-time PSE students were more likely to work, with 91% of those between the ages of 20-29 being employed during the course of their degree. This result is consistent with the view that most part-time students are working while studying and that further examination of the part-time program under the CSLP might be needed.
- Full-time PSE students who work do so for an average of 15 hours per week, while part-time students work more than 30 hours per week.
- Female students report working more than their male counterparts. In 2008, female students were 25% more likely to be employed during the academic year Footnote37 .
Among students who said that they would have studied without access to a student loan, the CSLP surveys Footnote38 revealed that working (83%) and getting money from parents or friends (69%) were mentioned as the most common potential means of financing PSE. Bank loans and lines of credit (57%) were also mentioned along with using a credit card (41%) and studying closer to home (41%). Some students indicated that they would have changed their study program. In the absence of the CSLP, 39% of students would have reduced their course load and 27% would have studied part-time instead of full-time. Some borrowers included in the focus groups indicated that without their student loan they would have deferred their education, reduced their course load, taken a private loan or increased their hours of employment.
Additional evidence from the Omnibus Survey indicated that, of those who did not get a student loan but still attended a PSE institution, 59% received money from parents/ guardians and/or friends, 55% found a job, 37% studied closer to home, 34% used credit cards, 22% used a line of credit, 17% borrowed money from a bank, 12% reduced their course load and remained a full-time student, 10% studied part-time instead of full-time, 6% studied in a different program, and 4% studied at a different institution.
The Omnibus Survey also confirmed that non-borrowers were much more likely to have worked full-time (19%) than CSLP borrowers (4%). Overall, non-borrowers (68%) were more likely to have worked full-time or part-time than borrowers (59%). Similarly, findings from the 2002 Post-Secondary Education Participation Survey indicated that 64.3% of PSE students said they were able to work less or not at all during the school year because of their student loans.
Available evidence indicates that students are accumulating debt from multiple sources, but that the government is often either the sole source of the loans or is used in combination with other sources.
- The Canadian Student Survey indicated that PSE students are accumulating debt from government, family and private sources. About 40% of the debt is solely from government sources, 30% is solely from family or private sources, 24% is from government and family or private sources, and 5% is accumulated debt from all three of these sources.
- A study by Bayard and Greenlee (2009) corroborated this finding, indicating that nearly half of all graduates in 2005 that did not pursue further education had some form of student debt upon graduation Footnote39 . The percentage with government debt ranged from 74% for Masters level graduates to 80% for those graduating with a Bachelor degree. About 11% owed debt only to non-government sources.
The above evidence suggests that the CSLP reduces financial barriers to PSE and reduces the need to work while in study.
3.4.3 Impacts of CSLP on PSE Enrolment
Given that there is widespread agreement that PSE students can face credit constraints, a key question is what empirical proof exists that loan programs increase access to PSE? When examining this question, it is important to bear in mind that the impact of a student loans program might be a change in the composition of students, rather than an increase the total number of students. For example, some have argued that the number of university and college places should be considered as fixed. Therefore an increase in student loans would simply increase the number of students from low-income families and displace less capable students from high-income families Footnote40 . Similarly, Swail and Heller (2004) pointed out that supply and demand adjustments in the case of higher education are different from other goods and services because the price is less flexible, the supply is more fixed, and the demand may be determined by many factors. For example, the Canadian PSE supply is primarily driven by government funding and, to a lesser extent, by tuition fees. Mueller and Rockerbie (2005) corroborated this understanding of supply and demand in the case of PSE, indicating that enrolment is usually controlled through admission standards rather than tuition rates since "tuition rates are too low to equate demand and supply".
The literature review showed that numerous studies have been undertaken to try to quantify the extent to which student aid programs increase access to PSE. Most of the studies are from the United States, however, and the number of Canadian studies is limited. Nonetheless, these studies shed some light on the state of the debate. Often, authors of the studies look for overall enrolment increases when, as described above, it is possible that only changes in the composition of the student body will occur. Of the studies that focused specifically on the impacts on low-income youth, many found that targeted loans and grant programs had a positive impact on PSE attendance. However, the range of quantitative estimates was quite large.
Econometric studies conducted for this evaluation provided estimates of the impact of CSLP on the number of PSE students (enrolment). An aggregate study on student financial assistance demonstrated that each additional $1,000 of student financial assistance increases the enrolment in the lowest income tricile (i.e. the lowest third of the income distribution) by about 0.5 percentage points (or roughly 1,650 students) Footnote41 . Alternative scenarios did not alter the baseline results. Another study using more sophisticated econometric techniques corroborated these results Footnote42 . The latter study showed that loans have a significant positive impact on the university enrolment level of students with low parental income. Specifically, a 1% increase in loans led to an increase in the enrolment rate of the low-income group of between 0.096% and 0.207%.
Three additional studies using microdata also provided some estimates of the impacts of the CSLP.
- One study reported that a $1,000 increase in loan limits is estimated to increase enrolment rates by around 0.4 percentage points for male students with low parental income and by 0.8 percentage points for female students in the same category Footnote43 . In addition, the study confirmed previous results that there is little evidence that increasing the "generosity" of the loan program has any substantial effect on enrolment rates of students with higher parental income.
- A second study done by Neill (2009) reported that the effect of a $1,000 increase in grants provided under the student loan program led to an increase in enrolment rates of 0.9 to 1.0 percentage points Footnote44 . For students living outside of their parents' home, a $1,000 increase in grants increased enrolment rates by 1.1 to 1.4 percentage points.
- A third study found that each additional $1,000 in total student aid increased the PSE attendance rate in the lowest parental-income quartile by about one percentage point Footnote45 .
Overall, the estimates developed for this evaluation demonstrate that each additional $1,000 of loans increases the enrolment of students from low-income families in a range of 0.4 to 1 percentage points.
It is possible that some students receiving loans would still attend PSE without the loans. In the study "Do Increases in Student Loan Limits Increase Access to PSE?" Finnie reported that 27.8% said their student loan was not required for them to access PSE, based on findings from the 2002 Post-Secondary Education Participation Survey.
As noted earlier, the key informants interviewed for this summative evaluation emphasized that many of the students receiving loans through the CSLP would not have been able to attend PSE without their loan. They felt that the system was crucial to increasing PSE access. Results from the study undertaken for this evaluation to examine the impact of being denied a loan seemed to corroborate the key informants' impressions. That study showed that a CSLP applicant being denied a loan (21% of applicants between January 2002 and December 2003) reduced the probability of attending university by 4.1 percentage points (from 28.5% to 24.4%) and attending another type of PSE by 5.5 percentage points (from 65.1% to 59.6%).
The survey of students who declined a CSLP loan showed that declining a CSLP loan might also slightly reduce the probability of attending a PSE institution. Although not a frequent situation (2.9% of loans were declined in 2007-2008), the majority (69.4%) of CSLP applicants declining their loans decided to continue their PSE, either immediately or after a delay. As well, another 13.4% were still planning to do so at some point. Overall, 85% of decliners who found their loan amount too small either went ahead and attended PSE or intended to do so. On the other hand, approximately 16% of decliners had not pursued PSE and expressed no intention of pursuing PSE in the future.
The evidence provided by the empirical studies, key informant interviews and the survey of students who declined a CSLP loan shows that CSLP has an impact on PSE enrolment, and this impact seems more significant for students from low-income families than for students from other income groups.
4. Cost of Objectives Achievement
With the introduction of the direct loan regime, the Office of the Superintendent of Financial Institutions was given the mandate to conduct an actuarial review to provide a precise assessment of the current costs of the CSLP, a long-term (25 years) forecast of these costs, a portfolio projection, as well as a discussion of all the assumptions underlying the results of the review. The results are presented on a yearly basis in the Actuarial Reports on the CSLP. The analysis reported in this section does not intend to supplant work done by the Office of the Superintendent of Financial Institutions, but rather to group the information collected over the last 10 years in order to provide an overall assessment of the cost of the CSLP and its various components.
4.1 Cost of CSLP Components
In 2007-2008, the CSLP disbursed $2 billion in loans to 352,708 full-time students and $2.8 million in loans to 1,436 part-time students. As of March 31, 2008, the total value of the CSLP portfolio for all loans held by borrowers who were in school or who were repaying their loan was $12 billion, an increase of $409 million over the previous fiscal year. As shown in Table 4, the cost of supporting students during their study and repayment periods included the interest subsidies ($362.8 million), IR ($93.2 million), DRR ($14.3 million), loans forgiven ($17 million), as well as the CSGs and CAGs ($161.5 million), for total expenses of $648.8 million in 2007-2008.
| Fiscal Year | Loans | CSLP Program-Related Expenses | |||||
|---|---|---|---|---|---|---|---|
| Grants | Interest Subsidies | IR | DRR | Claims Paid and
Loans Forgiven |
Total | ||
| 2000-2001 | 1,570 | 56.6 | 180.7 | 107.4 | 2.0 | 72.2 | 418.9 |
| 2001-2002 | 1,512 | 69.7 | 196.2 | 85.6 | 4.2 | 76.0 | 431.7 |
| 2002-2003 | 1,549 | 54.5 | 219.7 | 74.6 | 7.4 | 40.7 | 396.9 |
| 2003-2004 | 1,648 | 66.8 | 244.1 | 73.8 | 10.7 | 34.8 | 430.2 |
| 2004-2005 | 1,634 | 64.5 | 276.5 | 63.2 | 27.1 | 27.7 | 459.0 |
| 2005-2006 | 1,939 | 129.7 | 282.8 | 67.2 | 31.4 | 24.8 | 535.9 |
| 2006-2007 | 1,931 | 146.4 | 342.2 | 84.2 | 20.1 | 24.2 | 617.1 |
| 2007-2008 | 2,015 | 161.5 | 362.8 | 93.2 | 14.3 | 17.0 | 648.8 |
- Source from the above table Source: CSLP Annual Reports from 2000-2001 to 2007-2008.
Table 4 also provides an overview of the costs of the CSLP components from 2000-2001 (before the introduction of the direct loan regime) to 2007-2008.
- Over the period, the government disbursed loans amounting to $1.57 billion in 2000-2001, rising slightly to $1.63 billion in 2004-2005, and then increasing to $2.02 billion by 2007-2008. These expenditures show that the value of loans disbursed remained fairly stable until the loan limit was increased from $165 to $210 per week in 2005-2006, which has resulted in an increase of more than $300 million annually.
- Based on the fiscal year, grant expenditures have varied significantly over the period, most notably doubling from $64.5 million in 2004-2005 to $129.7 million in 2005-2006 following the implementation of the CAG for low-income families and those having permanent disabilities.
- Interest subsidies represent the cost to the Government of Canada of paying interest on loans while borrowers are still in school. As the expenditure is determined by the number of CSLP participants, the loan amounts and interest rates, there is significant variation from one year to the next. Over the period, the amount that the government spent on interest subsidies ranged from $180.7 million in 2000-2001 to $362.8 million in 2007-2008.
- The federal government spent $107.4 million in 2000-2001 on IR. The cost of this component declined to $63.2 million in 2004-2005. Since 2004-2005, its cost has increased mainly due to the higher income threshold for IR eligibility, which makes IR accessible to more borrowers. Although DRR spending increased to $31.4 million in 2005-2006, it has decreased since then to $14.3 million in 2007-2008, even with the increase in the maximum amount of DRR assistance to $26,000. It is important to note that there is an inverse relationship between IR and DRR expenses – as one goes up, the other goes down and vice versa.
- The amount of claims paid and loans forgiven declined significantly over the period, from $72.2 million in 2000-2001 to $17 million in 2007-2008 due to the phasing-out of guaranteed loans.
Overall, total program-related expenses dropped from $418.9 million in 2000-2001 to $396.9 million in 2002-2003 (equivalent to 25.6% of loan disbursements for that year). As explained above, this was mainly due to a decrease in claims paid and loans forgiven, as well as a decline in IR costs. Since 2002-2003, total program-related expenses have increased to $648.8 million (or 32.2% of loan disbursements). This change was brought about mainly by increases in interest subsidies and grants paid.
4.2 Other Costs Related to Providing Direct Loans
Following the shift from the risk-shared regime to the direct loan regime (in 2000), there was a transfer of responsibilities and associated costs such as collection costs, and other administrative costs. Implementing the direct loan regime also involved assuming the total burden of the default cost. In 2004, the CSLP formative evaluation indicated: "It was too soon after the shift to the direct loan provision to ascertain actual changes in the program's administrative costs... For example, the costs of making the transition from the risk-shared loan program to the direct loan program inflated the administrative costs... In addition the program's own analysis suggests that administrative costs are not likely to settle until 2004-2005." Accordingly, this summative evaluation included an examination of these costs.
Collection costs were different under the two regimes.
- Under the risk-shared regime, there was no direct collection cost to the government because the government paid a risk premium to lending institutions participating in the regime (who incurred the collection costs). The risk premium was 5% of the value of loans being consolidated (i.e. value of loans issued to students). In return, the lenders assumed the risk associated with non-repayment of these loans.
- Under the direct loan regime, the collection costs represent the cost of using private collection agencies to collect defaulted CSL (as was the case under the guaranteed loan regime). As of August 1, 2005, the CRA undertook the responsibility for the administration of the collection activities of the guaranteed, risk-shared and direct student loans Footnote46 .
As shown in Table 5, the collection costs have remained stable since 2000-2001, while the risk premium has decreased significantly following the introduction of direct loans. Today, these costs have almost disappeared.
| Fiscal Year | Loans | Total Program-Related Expenses | Administrative Costs | ||||
|---|---|---|---|---|---|---|---|
| Collection | Risk Premium | Service Bureau | Other Administrative | Total | |||
| 2000-2001 | 1,570 | 418.9 | 16.8 | 88.1 | 1.3 | 79.1 | 185.2 |
| 2001-2002 | 1,512 | 431.7 | 14.3 | 51.0 | 27.9 | 25.7 | 118.9 |
| 2002-2003 | 1,549 | 396.9 | 12.8 | 23.0 | 41.2 | 14.2 | 91.3 |
| 2003-2004 | 1,648 | 430.2 | 13.4 | 11.7 | 41.0 | 13.1 | 79.2 |
| 2004-2005 | 1,634 | 459.0 | 14.8 | 5.5 | 46.0 | 13.6 | 79.9 |
| 2005-2006 | 1,939 | 535.9 | 13.6 | 2.7 | 50.2 | 18.2 | 84.7 |
| 2006-2007 | 1,931 | 617.1 | 12.4 | 1.8 | 65.6 | 19.4 | 99.2 |
| 2007-2008 | 2,015 | 648.8 | 14.4 | 1.3 | 70.8 | 17.5 | 104.0 |
-
Source and reference from the above tableSource: CSLP Annual Reports from 2000-2001 to 2007-2008.
Note: Transition payments from the shared-loan regime to the direct loan regime were paid in 2000-2001 and 2001-2002
Under the direct loan regime, new costs were introduced such as the Service Bureau (provider) costs. Beginning on March 1, 2001, the CSLP uses a third-party provider to administer direct loans disbursement, in-study loan management, post-study repayment activities, and debt management. Since the implementation of the direct loan regime, the annual Service Bureau costs have increased from $1.3 million in 2000-2001 to $70.8 million in 2007-2008.
Other costs related to the three regimes include a paid fee to finance the administration of the CSLP by the participating provinces and territories. This expense was fairly stable over time except in 2000-2001 and 2001-2002, as transition payments were paid.
Overall, as shown in Table 5, total administrative costs remained stable over the period, with the costs in 2007-2008 ($104 million) being similar to 2000-2001 ($91.3 million). As noted earlier, provinces choosing not to participate in the CSLP are entitled to receive alternative payments to assist in the cost of delivering similar student financial assistance programs. These types of payments are made to Quebec, the Northwest Territories and Nunavut.
4.3 Bad Debt Costs
As mentioned above, one major change with the direct loan regime is that the federal government owns the loans and the associated risks. Consequently, the government must record them as assets. As a result, a provision has to be made for potential future losses associated with the loans based on generally accepted accounting principles. The provision is made the year the loans are issued, although the losses may occur several years later. Consequently, an annual expense against the provisions for bad debt and DRR has been reported since 2000-2001 based on a percentage of the value of loans issued in a year and on historical information. Starting in 2000-2001, the provision was established at $169.9 million Footnote47 . Since then, it has grown almost every year (with the exception of 2004 2005), to $318.1 million in 2007-2008 (as shown in Table 6) Footnote48 .
Although the direct loan regime has generated several new costs, the regime has also generated more revenue from loans. Since the introduction of direct loans, revenue from the CSLP for the federal government has almost multiplied by five, increasing from $126 million in 2000-2001 to $612.6 million in 2007-2008. This is due to a maturing portfolio with a greater percentage of students in repayment each year, who This increase is mainly due to interest revenue from direct loans as borrowers pay interest (at a variable rate of prime plus 2.5% or a fixed rate of prime plus 5%) to the government on their loans once they leave full-time studies. There is also some revenue coming from recoveries of loans under previous regimes.
| Fiscal Year (A) | Loans (B) | Total Student's Program Expenses (C1) | Total Admin. Costs (C2) | Alternative Payment (C3) | Bad Debt and DRR Provisions (C4) | Total Revenue (D) | Final Net Operating Results (C-D) |
|---|---|---|---|---|---|---|---|
| 2000-2001 | 1,570 | 418.9 | 185.2 | 138.9 | 169.9 | 126.0 | 786.9 |
| 2001-2002 | 1,512 | 431.7 | 118.9 | 144.9 | 182.0 | 172.1 | 705.4 |
| 2002-2003 | 1,549 | 396.9 | 91.3 | 76.0 | 186.6 | 222.8 | 528.0 |
| 2003-2004 | 1,648 | 430.2 | 79.2 | 244.8 | 204.8 | 275.2 | 683.8 |
| 2004-2005 | 1,634 | 459.0 | 79.9 | 175.8 | 467.7 | 313.8 | 868.6 |
| 2005-2006 | 1,939 | 535.9 | 84.7 | 158.2 | 310.5 | 395.6 | 693.7 |
| 2006-2007 | 1,931 | 617.1 | 99.2 | 91.3 | 270.0 | 523.1 | 554.5 |
| 2007-2008 | 2,015 | 648.8 | 104.0 | 113.9 | 318.1 | 612.6 | 572.2 |
- The source from the above table Source: CSLP Annual Reports from 2000-2001 to 2007-2008.
Administrative data indicates that after accounting for the benefits provided to students (e.g. in-study subsidies, repayment assistance, etc.), administrative costs (e.g. service provider costs, administrative fees, etc.) and bad debt, each $1 in student loans issued by the government to new borrowers costs approximately 30 cents Footnote49 . It should be noted, however, that any new initiatives which do not increase the level of administrative work (i.e. do not generate new borrowers or require system changes), would reduce the cost for each $1 in student loans issued. For example, an initiative which only increases the amount of funding to students, like raising the loan limit, would not impact the administrative cost, as no new students are added to their portfolio and there would be no new systems costs.
4.4 Cost-Effectiveness and Program Alternatives
The international comparison study conducted for this evaluation indicates the use of some alternative approaches. For example, many countries such as Denmark, Norway, Sweden, the United Kingdom, Australia and New Zealand provide student loans without income testing. In the case of Australia, the system involves deferring tuition payments until after graduation. Although universal grant programs are less common than universal loan programs, a few countries also provide non-repayable aid without taking into account parental income.
Comparing the total government contribution of each country as a percentage of the total costs (education and tuition costs, living costs) per PSE attendee, Canada ranks in the middle with Australia and the United Kingdom. Given Canada's middle ranking, it could be argued that the total contribution in Canada is generally providing adequate student financial assistance.
At the time of the evaluation, there was no evidence to indicate whether the alternative programs in other countries were being provided in a more or a less cost-effective way than the CSLP. Nevertheless, providing more loans is more cost-effective than reducing tuition fees both in terms of increasing einequality and labour productivity (as reported in Section 5.1).
5. Indirect Impacts and Effects of the CSLP
The final outcome of the CSLP was described in Section 2.1 and Section 2.2 as "promoting accessibility to post-secondary education for students with demonstrated financial need. The CSLP lowers financial barriers through the provision of loans and grants which help ensure that Canadians have an opportunity to develop their knowledge and skills to participate in the economy and in society."
This section assesses the indirect impacts and effects of the CSLP by examining:
- The results for productivity and the distribution of income;
- Program interactions;
- Student loan repayment and debt;
- The use of IR and DRR; and
- Defaulting.
5.1 Productivity and Inequality (Income Distribution)
An economic simulation model was used to estimate the possible impacts of the CSLP on the economy as a whole. Although this approach is subject to possible bias due to the nature of the model, it is accepted as a possible way to link an individual program to the broader economy Footnote50 . To minimize the potential bias, five separate scenarios were explored. All five scenarios assumed that the government introduced a policy that raised total government expenditures on PSE by 5%. The increase in PSE expenditures was kept the same across the five scenarios in order to make the policies comparable Footnote51 .
- The first scenario consisted of an increase in the maximum possible loan amount from $14,000 to $17,405. The model estimated that the share of the general population that are PSE graduates would increase by a couple percent. Also, GDP would increase slightly and the measure of inequality (income distribution) would decrease. One factor contributing to the limited size of these effects is the model's assumption of balancing the government's budget. Specifically, an increase in government spending on PSE implies an increase in taxes, which lowers the gain from the PSE investment.
- The second scenario estimated the impact of a reduction in education fees from $8,220 to $7,606 (same total cost as in first scenario). The model showed more limited impacts, with a smaller increase in the share of the general population that are PSE graduates, as well as a smaller increase in GDP and a lower reduction in inequality. Comparing these results with the first scenario indicates that an increase in loan limits could be a better policy choice than a reduction in tuition in terms of its aggregate effects on the share of PSE graduates, increasing productivity and reducing inequality.
- Two other scenarios were based on different policies for discounting the outstanding loan amount: (i) a discount which is given uniformly to all students and (ii) a discount that is based on the academic attainment of the student, with students achieving higher grades receiving a larger discount. The two discounts performed better than any other scenarios in terms of aggregate effects on PSE graduates and in terms of increasing productivity and reducing inequality.
- The last scenario, a pure ability-based grant policy, had the most limited effects on the aggregate variables, since it is not students in financial need who received the grant but those who performed well at school.
Consequently, the results from the general equilibrium study indicate that the CSLP is pursuing the appropriate approach in terms of general effects by increasing the loan limits and by developing policies to assist borrowers after PSE. Furthermore, these two policies seem to be more cost-effective than the alternatives, since all five scenarios were developed assuming the same overall cost for the government.
5.2 Program Interactions
For program evaluation, one area of interest is the extent to which the evaluated program is interacting with other government programs. There are a number of programs with goals similar to the CSLP, such as the Registered Education Savings Plan (RESP), the Canadian Education Savings Grant, the Canada Learning Bond, the Canada Millennium Scholarship Foundation (which ended in 2010), education-related tax credits (tuition fees, education amount, textbook amount), and the student loan interest tax deduction. This section examines the program interactions between the CSLP and some of these programs Footnote52 .
The Canada Millennium Scholarship Foundation (CMSF) had the goal of increasing access to PSE as well as reducing student debt. Millennium scholarships were provided to students with a high assessed need, based on the needs assessment of the province and the CSLP. In most cases, the Millennium scholarship simply reduced the student's debt. For example, if a student received $10,000 in student loans and received a $3,000 Millennium scholarship, the student would owe $7,000 on their student loan. This means that while the CMSF clearly reduced debt, it is unclear how much it impacted PSE access, as the student did not receive more total dollars in aid to attend a PSE institution. This might explain the results found in two studies done for the Millennium Foundation that the CMSF probably had no impact on PSE participation Footnote53 .
The RESP is a tax-sheltered education savings account for PSE. Although the contributions are not tax deductible (as in the case of a Registered Retirement Savings Plan), the accumulated interest is not subject to income tax. Once a student (the beneficiary) is enrolled full-time or part-time in a qualifying PSE institution, withdrawals from the RESP are possible under certain conditions. Moreover, the government announced in the 1998 Budget that the Canadian Education Savings Grant (the government contribution equal to 20% of an individual's annual RESP contribution) was created in order to provide an incentive for parents (or relatives) to save for their children's PSE. In the 2004 Budget, the government expanded the Canadian Education Savings Grant for low-income families (increasing the government contribution) and established the Canada Learning Bond (a lump sum government RESP contribution). Both government contributions are deposited directly into RESPs in order to encourage low-income families to save for their children's PSE.
Expected PSE student withdrawals from an RESP (in the form of an Educational Assistance Payment) are considered to be income for the student and are, therefore, subject to income tax and enter into the calculation for student loansare taxable for the student and are treated as in-study income at the time of applying for a student loan. Accordingly, the primary interaction with the CSLP occurs at the needs assessment stage, where money saved and accumulated in the RESP is considered to be part of the income contribution and, as a result, leads to a reduction in a student's loan amount equal to 80% of the net income during the study period. This means that most parental RESP contributions and government contributions through the Canadian Education Savings Grant and Canada Learning Bond result in a reduction in the amount of the student loan. It should be noted, however, that these contributions also reduce the accumulated student loan debt that PSE students would have to repay.
5.3 Repayment and Debt
The student loan repayment period is a critical period for student borrowers. Although students borrow from non-governmental sources (as indicated in Section 3.4.2), this section focuses on the repayment of CSLs only. On average, government student loan debt (both provincial and federal) for graduates accounts for 60% of total student debt, as indicated in the 2009 Canadian University Consortium report Footnote54 .
Full-time student CSL borrowers must begin repaying their student loans six months after completing their studies. Loans are typically scheduled to be repaid through monthly payments over 10 years (including the 6 month grace period), but often borrowers choose to repay their loan more quickly, especially in the event of small amounts. In some cases, the loan repayment period can be extended to a period of up to 15 years.
The international study indicated that each country varies in how and when they expect students to repay debt, but most can be categorized into two types: a fixed-term repayment plan, and an income-contingent repayment plan. Most countries (including Canada) are using the fixed-term method, which is similar to a "mortgage-style" method. A few other countries, such as New Zealand, Australia and the United Kingdom, are using the income-contingent repayment method. In those countries, payments are required once income reaches a certain threshold.
5.3.1 Debt Level
The total amount of loans in repayment in 2007-2008 was around $7 billion, up from $5.5 billion in 2000-2001 (the year the direct loan regime was introduced) Footnote55 . In order to have a more accurate idea of the changes in overall debt level over time, Graph 1 shows the amount of student loans in repayment in constant dollars (2002 = 100).
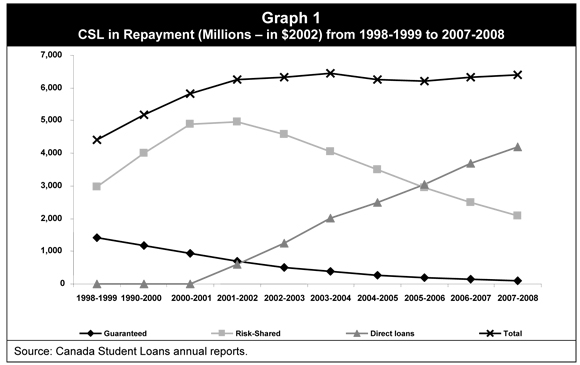
Text Version of the figure: Graph 1 CSL in Repayment (Millions - in $2002) from 1998-1999 to 2007-2008
| In repayment | 1998/99 | 1999/00 | 2000/01 | 2001/02 | 2002/03 | 2003/04 | 2004/05 | 2005/06 | 2006/07 | 2007/08 |
|---|---|---|---|---|---|---|---|---|---|---|
| Guaranteed | 1,301 | 1,088 | 886 | 680 | 514 | 386 | 287 | 217 | 159 | 117 |
| Risk-Shared | 2,719 | 3,719 | 4,672 | 4,849 | 4,575 | 4,162 | 3,657 | 3,166 | 2,720 | 2,317 |
| Direct loans | 0 | 0 | 0 | 582 | 1,247 | 2,079 | 2,603 | 3,256 | 4,034 | 4,691 |
| Total | 4,020 | 4,807 | 5,558 | 6,111 | 6,336 | 6,628 | 6,547 | 6,636 | 6,913 | 7,125 |
- Source from the above table Source: Canada Student Loans annual reports.
As expected, Graph 1 clearly shows that the proportion of direct loans increases every year, while the proportion of loans under previous regimes declines. Since 1998-1999, the total amount of loans in repayment has increased by 45%. Since the introduction of the direct loan regime in 2000-2001, however, the graph shows the CSL amount in repayment has remained almost constant (i.e. increasing by 10% since 2000-2001). It should be noted that the increase in the maximum loan amount in 2005-2006 might only be partially captured in Graph 1, because many students affected by the increase may not have completed their studies by 2007-2008.
The total amount of loans in repayment is expected to continue to grow in the next few years, especially due to the bigger loans provided to students since the increase in the maximum loan limits.
As might be expected, the average debt per borrower (in nominal terms) who began repayment has also risen significantly over the period. The average debt at consolidation time was $9,348 in 1998-1999, went up to $10,263 in 2002-2003, and then up to $12,881 in 2007-2008. In 2007-2008, more than 20% of borrowers who began repayment had a CSLP debt higher than $20,000, including 6% with student loan debt of more than $30,000.
The average debt figures were also expressed in constant dollars (all figures in the table indexed to 2002 prices) in order to measure the real growth over the period (see Table 7). The average debt in constant dollars was $10,121 in 2000-2001. By 2007-2008, the average debt in constant dollars had increased to $11,552, as shown in Table 7. This represents an increase of 14.1% since the introduction of direct loans.
| Loan Year | Canada | NL | PE | NS | NB | ON | MB | SK | AB | BC | Yukon |
|---|---|---|---|---|---|---|---|---|---|---|---|
| 2000-2001 | 10,121 | 11,806 | 10,307 | 11,317 | 10,797 | 10,682 | 7,867 | 9,753 | 8,939 | 8,881 | 6,379 |
| 2001-2002 | 9,754 | 10,726 | 9,584 | 11,234 | 10,060 | 10,353 | 8,002 | 9,771 | 9,014 | 8,952 | 7,798 |
| 2002-2003 | 10,265 | 11,367 | 11,177 | 11,768 | 10,419 | 10,537 | 8,530 | 10,428 | 9,713 | 9,623 | 9,176 |
| 2003-2004 | 10,339 | 11,504 | 11,516 | 12,048 | 10,746 | 10,354 | 8,653 | 10,937 | 9,932 | 9,942 | 10,610 |
| 2004-2005 | 10,555 | 11,818 | 12,440 | 12,713 | 11,088 | 10,297 | 9,317 | 11,110 | 10,130 | 10,513 | 10,713 |
| 2005-2006 | 10,582 | 11,816 | 12,416 | 12,806 | 11,541 | 10,181 | 8,952 | 11,234 | 10,087 | 10,902 | 10,563 |
| 2006-2007 | 11,212 | 12,015 | 13,445 | 13,504 | 11,922 | 10,647 | 9,453 | 12,100 | 11,034 | 11,879 | 12,101 |
| 2007-2008 | 11,552 | 11,651 | 13,932 | 13,794 | 11,929 | 11,055 | 9,879 | 12,613 | 11,502 | 12,354 | 11,787 |
| % change | 14.1% | -1.3% | 35.2% | 21.9% | 10.5% | 3.5% | 25.6% | 29.3% | 28.7% | 39.1% | 84.8% |
- Source from the above table Source: Canada Student Loans Annual Reports and Statistics Canada Consumer Price Index.
Looking at the different factors that might explain the increase in average student debt loads, the province of residence appears to be a significant factor. As Table 7 shows, the growth of a borrower's debt varies significantly by province (from -1.3% in Newfoundland to more than 39% in British Columbia), which likely reflects tuition policy in each province.
Other factors such as gender, type of institution and age also seem to have influenced the average level of debt. For example, female borrowers had a higher average debt load than male borrowers by over $900 in 2007-2008 (it is worth noting that females also have higher repayment rates) Footnote56 . Over the years, the gap has slightly broadened – likely due to a greater presence of females attending university. Indeed, borrowers attending university tend to have higher debt loads (60% higher) than borrowers attending colleges and private colleges, likely due to university program durations being longer and university tuition costs being higher. The age of the borrower also seems to be positively correlated with the average level of student debt, although the general pattern of age has not changed since 2000-2001.
The average debt levels in Table 7 reflect the amount borrowers owe once they begin repayment, which includes any interest that may have accrued in the six months between the time borrowers complete their studies and consolidate their loan. The study done by the Canada Education Statistics Council shows that 27% of the 2005 PSE graduates still had government student loan debt two years after graduation. In comparison, 33% of graduates were in the same situation in 2000.
5.3.2 Grace Period
In Canada, interest begins to accrue on a student loan starting at the time the borrowers complete their studies, but no payment is required until the end of a six-month grace period. For loans issued prior to August 1993, no interest accrues during the grace period Footnote57 .
Almost all countries provide a grace period and most of those countries have interest accumulating for at least part of the grace period.
- The length of the grace period varies by country, ranging from 6 months (Canada and the U.S.) to 5 years (Germany). As noted earlier, there are also countries (Australia, New Zealand, England and Sweden) where payment is only required when income reaches a certain threshold.
- In the case of countries that have a grace period, there are only two (U.S. and Germany) where no interest accrues during the grace period. Finland, Estonia, Latvia, Norway and Denmark have interest accumulating on the loan for most of the grace period, but not necessarily during the first month after the end of studies.
The vast majority of provincial and federal key informants felt that the six-month grace period is sufficient, and many felt that students should start paying as soon as possible to enforce good financial habits. Several provincial and federal informants indicated that six months was too much, particularly since interest accrued during this time. Other groups of key informants were evenly split on the question.
Regardless of what key informants thought about the length of the grace period, most of them felt that interest should not accrue during this period. As well, the vast majority felt that the name "grace period" was contributing to confusion among borrowers because many borrowers understand a grace period to be a period that is interest free. Many students participating in the focus groups confirmed this view. These students indicated that they were unaware that interest accrues during the grace period and that they only became aware of this when they began repayment. In fact, some only learned of this during their focus group discussions. Similarly, the 2007 CSLP Survey showed that only 35% of borrowers were aware that interest accrues during the grace period. Another study done with data from the Canadian Student Survey revealed that only 23% of graduates were aware that interest begins to accrue during the grace period. Even the majority of those who were aware of the grace period thought that interest only accrues after 6 months Footnote58 .
5.4 Interest Relief (IR) and Debt Reduction in Repayment (DRR) Use
Most students succeed in paying off their student loans without major difficulties. However, the study by Bayard and Greenlee (2009) reported that more than 25% of college and university graduates with government debt at graduation experienced hardship in repaying their loans. For those who do face difficulties in meeting their student loan obligations, the government offers support through loan repayment assistance programs (as discussed in Section 2.2.3).
The rationale study (HRSDC 2007) conducted for this evaluation reported that repayment assistance programs may increase the participation rate in PSE, because the fear of going into debt and being unable to pay off that debt could act as a deterrent to the use of student loans and PSE enrolment. This view was corroborated by the survey of those who declined student loans, which found that 8.7% of the decliners cited "fear of debt/did not want to go into debt" as one of the main reasons for declining their student loan. This suggests that the proportion of decliners would have been greater without the repayment assistance programs. Also, the international comparison showed that student loans programs in other countries are typically accompanied by loan repayment assistance measures. For example, several countries offer income-contingent repayment plans. Most of the other studied countries provide interest assistance, partial debt reduction (e.g. due to occupation, the presence of children and financial hardship) or debt cancellation.
In Canada, the two main programs for that assisteding borrowers in financial hardship to make payments for their student loans (prior to the introduction of the Repayment Assistance Plan in 2009) weare the IR and DRR. As noted in Section 2.2.3, IR existed prior to 1998 but was enhanced in that year along with the introduction of DRR. These provisions were extended through amendments announced in the 2003 and 2004 Budgets. For example, the 2004 Budget increased the income threshold for IR eligibility and increased the amount of DRR.
This section examines whether IR and DRR are workeding into helping to promote access to PSE by assisting low-income borrowers after PSE and reducing the loan default rate. Specifically it examines:
- The profile of IR and DRR users; and
- Evidence on the effects of repayment assistance programs.
5.4.1 Profile of IR and DRR Users
The IR provision wasis the first program that eligible borrowers couldan make use of when facing temporary financial difficulties. Over the 2001-2002 to 2007-2008 period, the number of IR users has declined from roughly 140,000 users to about 116,000 users. IR users tended to have a higher debt (25% to 30% higher) than the average student loan debt at loan consolidation time. The Brondesbury Group study corroborated this finding.
Table 8 shows that females accounted for a greater share of IR users than males, comprising close to two-thirds of users in 2007-2008. Since the introduction of direct loans, their share has increased continuously. It is possible that these results reflect the fact that the average debt of females wasis slightly higher than the average debt of males (see Section 5.3.1). As well, greater use of IR by females may also have explained their lower default rates.
Table 8 also shows that the type of institutions that IR users attended has changed over the period. In 2001-2002, 38.8% of IR users attended colleges, while 34.1 % attended universities and 27.1% attended private institutions. By 2007-2008, however, 46.3% of IR users attended university, while 37.7% attended colleges and 16.1% attended private institutions. These new percentages seem to reflect, in part, the changes in the distribution of CSLP participants. The variation by province also seems to be correlated with the CSLP participation in each province and may also be correlated with the average cumulative debt (due to tuition levels in the different provinces).
The Brondesbury Group study on CSLP repayment assistance showed that the proportion of borrowers seeking IR roseises with age, although it wasis virtually identical for the 27 to 30 age group and for the group that is 31 years of age or older. Younger age groups have always had a smaller proportion of IR users, although the gap in the different proportions among age groups has narrowed since 2001.
| 2001-2002 | 2007-2008 | % Change | ||||
|---|---|---|---|---|---|---|
| CSLP | IR | CSLP | IR | CSLP | IR | |
| Total | 343,588 | 140,461 | 352,888 | 116,530 | 2.7% | -17.0% |
| Gender | ||||||
| - Female | 57.4% | 63.3% | 59.9% | 66.1% | 7.0% | -12.8% |
| - Male | 42.6% | 36.7% | 40.1% | 33.9% | -3.6% | -23.1% |
| Institution Type | ||||||
| - Universities | 51.4% | 34.1% | 59.3% | 46.3% | 18.5% | 14.0% |
| - Colleges | 35.3% | 38.8% | 31.0% | 37.7% | -10.0% | -18.4% |
| - Private | 13.3% | 27.1% | 9.7% | 16.1% | -25.1% | -50.2% |
| Province | ||||||
| - NL | 4.6% | 6.4% | 2.4% | 4.8% | -46.3% | -36.2% |
| - PEI | 0.9% | 0.8% | 0.9% | 1.1% | 8.2% | 13.1% |
| - NS | 4.9% | 8.1% | 4.3% | 6.0% | -9.4% | -37.9% |
| - NB | 4.6% | 6.4% | 4.4% | 6.2% | -1.7% | -17.3% |
| - ONT | 46.1% | 44.7% | 58.9% | 55.1% | 31.2% | 4.0% |
| - MAN | 3.2% | 3.1% | 2.3% | 2.1% | -24.4% | -42.0% |
| - SASK | 4.8% | 4.6% | 3.1% | 3.2% | -32.8% | -41.8% |
| - ALT | 12.6% | 8.6% | 9.4% | 6.8% | -23.4% | -33.3% |
| - BC | 18.3% | 17.2% | 14.2% | 14.7% | -20.6% | -27.8% |
| - YK | 0.1% | 0.1% | 0.1% | 0.0% | -20.7% | -38.2% |
-
Source and a note from the above table Source: Canada Student Loans Annual Reports.
Note: For 2001-2002 and 2007-2008, 'CSLP' refers to the number of loans issued in the given fiscal year, while 'IR' refers to the number of IR recipients in the given fiscal year.
Since 2004/05, IR seems to bewas used by an increasing share of low-income borrowers every year Footnote59 . At this point, it is not clear why there wasis such a change in the distribution. A detailed statistical analysis might provide additional insight into this change.
A study done by Situ (2006) for Statistics Canada showed that about 35% of borrowers in repayment in 2000 were estimated to be eligible for IR, but less than 45% of them took advantage of the program, resulting in a 16% utilization rate for IR. This study confirmed that borrowers using IR have a lower income than those who did not use IR. As well, IR take-up was higher among borrowers in the first year of repayment, those who were older, those coming from the Atlantic region, and those who studied at a university. At the same time, there weare groups with high financial difficulty for whom the take-up was low, such as borrowers on social assistance or with large families. The multivariate analysis done in The Brondesbury Group study also confirmed that the likelihood of seeking IR declines with employment income and increaseds with the number of years that the student borrowed. The study also corroborated the finding that students with a higher risk of defaulting (i.e. the unemployed, disabled, or in need of child care) were more likely to use IR.
Borrowers who have exhausted IR and continued to have exceptional financial difficulty in repaying their loans may bewere eligible for DRR. Since DRR was implemented, the number of beneficiaries increased from 44 in 1998-1999 to 5,029 in 2004-2005, but declined to 2,808 in 2007-2008. The significant increase during the middle of the decade was due to a large wave of borrowers with guaranteed and risk-shared loans who had exhausted their IR and became eligible for DRR.
The profile of DRR users wasis very similar to the profile of IR users. The use of DRR tendeds to increase with age, females, those with no employment income and higher debt.
5.4.2 Evidence on the Effects of Repayment Assistance Programs
The following discussion provides some preliminary evidence on the effects of the IR and DRR on student loan default and savings for government. The following discussion also highlights the potential importance of pre-consolidation counselling.
Effects of IR and DRR
In a study conducted for this evaluation, modelling was done for three main sets of changes to the IR and DRR programs (i.e. the changes implemented in 1997, 1998 and 2003, as discussed in Section 2.2.3) to measure their effect on the cost of default Footnote60 . The study found that the three program changes significantly lowered the CSLP default rate by 16 to 19 percentage points. The effect of the three combined changes showed a reduction of $14 million to $39 million in the costs of default (based on findings from three separate statistical models that controlled for business cycle effects). As well, by reducing the default costs and default rate, these programs are likely to reduced the collection costs for the government.
The positive results of the modelling analysis were corroborated by the focus groups and key informants. In general, the student focus group participants and key informants perceived debt management measures to be important elements of the CSLP. For example, focus group participants who had received IR indicated that the program was effective in preventing them from defaulting on their loan. Similarly, key informants were almost unanimous in their view that the main benefit to having debt management measures was a lower rate of default and a greater proportion of students who are able to pay the full cost of their loans. Some key informants said that debt management measures also help borrowers to avoid poor credit ratings. Most key informants also felt that the government could increase take-up if communications and awareness were improved.
Analysis presented in the 2001 CSLP annual report indicated that IR recipients hadve a 22% default rate, which was comparable to the default rate of borrowers in repayment. It could be argued that, given that IR recipients weare more likely to be in financial difficulty, a default rate comparable to the overall default rate provides further evidence that the IR provision wais working to assist low-income borrowers after PSE.
As a cautionary note, however, another internal study showed that the CSLP policy shifts introduced in 2003 and 2004 had a small impact on default, reducing the probability of default by 0.5% Footnote61 . Similarly, the study from The Brondesbury Group indicated that "there is some indication that the IR program impacteds default, but that relationship wasis affected by economic conditions. Debt relief hads such low uptake, that attributing impact is not feasible". Therefore, although the work conducted for this evaluation has provided some preliminary findings on the effects of IR and DRR on student loan default and savings for the government, more technical studies would be needed to obtain additional evidence of the effects of IR and DRR.
A review of the U.S. literature on student loan default provides some further evidence that assistance programs have positive effects on loan repayment and often reduce the student loan default rate. A study by Woo (2002) showed that those who had used a deferment or forbearance were less likely to default, perhaps because borrowers who were organized enough to use deferments were also better able to handle repayment in general. Using deferments might be an effective way in the short-term that borrowers can use to postpone a default claim. However, it is unclear whether such a program had an impact over a long-term period. Choy (2006) reported that most borrowers who deferred or had periods of forbearance were able to recover financially and did not subsequently default. On the other hand, Meyer (1998) demonstrated that with a 6 1/2 year timeframe, borrowers with deferred loans defaulted almost as often as borrowers who never deferred.
Pre-Consolidation Initiatives
Another aspect of the U.S. experience regarding repayment assistance programs is related to the effect of financial counselling for student loan borrowers. Seifert (2004) provided solid evidence of the positive effects that an early intervention program can have on the default behaviour of student borrowers Footnote62 . The study indicated that the average default rate for those receiving the intervention was significantly lower than the average for the sample of the population. Even two years after the intervention there was still a significant effect on default rates. Steiner (2003 & 2005) indicated that borrowers who did not receive an in-person exit counselling session had a probability of default that was eight percentage points higher than borrowers who received exit counselling.
The 2003-2004 CSLP annual report announced a pilot program called the Pre-Consolidation Program (PCP) to assist medium and high-risk borrowers in public institutions. These borrowers were contacted by the National Student Loans Service Centre prior to their first payment due date and received a telephone counselling session. It was reported in the 2004-2005 CSLP annual report that the PCP was effective in decreasing delinquency.
The 2005-2006 CSLP annual report indicated that the department has developed an econometric model to pre-emptively identify borrowers who might miss their first payment once they have entered repayment. These borrowers were called by the departmental service providers and received information on repayment obligations, repayment options and other assistance programs. The 2005-2006 CSLP annual report showed that the first payment delinquency rate continues to improve as a result of this initiative. However, a completed assessment of this initiative would be required to determine its effectiveness.
As well, an exit information session is available to students on the website of the National Student Loans Service Centre (the session has a duration that is 15 to 20 minutes, but is not mandatory). Some key informants suggested assigning a debt management specialist to students in order to advise them of their options before they default. Focus groups participants also suggested that the government should be more proactive (like financial institutions) in identifying borrowers' obligations and laying out the process for repayment.
Overall, the American experience and the preliminary experience in Canada with pre-consolidation initiatives suggest that these kinds of pre-consolidation counselling approaches should continue to be investigated by the department to help borrowers understand various debt management measures and to help reduce default rates.
5.5 Defaulting
Although the majority of student loan borrowers are able to repay their loans with or without government assistance, approximately 16% of borrowers defaulted in 2007-2008 Footnote63 .
The default rate decreased from 28.7% for the 2002-2003 cohort to 16% for the last two cohorts in 2006-2007 and 2007-2008 (as shown in Table 9). There was a spike in the default rate in 2001-2002 (at 37.7%) following the switch to the direct loan regime. In 2007-2008, the default rate was the highest in Prince Edward Island (at 28%), followed by Nova Scotia (at 20%), while the lowest default rates were in Alberta and Manitoba (at 11% and 13% respectively).
| Loan Year | Canada | NL | PE | NS | NB | ON | MB | SK | AB | BC |
|---|---|---|---|---|---|---|---|---|---|---|
| 2000-2001 | 23.1 | 21.1 | 31.5 | 24.6 | 23.7 | 23.2 | 21.9 | 20.5 | 24.5 | 25.5 |
| 2001-2002 | 37.7 | 45.3 | 35.2 | 40.4 | 39.3 | 35.7 | 41.1 | 38.4 | 34.4 | 40.3 |
| 2002-2003 | 28.7 | 22.4 | 28.3 | 35.2 | 25.4 | 27.6 | 30.5 | 32.5 | 25.6 | 32.6 |
| 2003-2004 | 28.0 | 26.0 | 23.0 | 32.0 | 31.0 | 34.0 | 28.0 | 30.0 | 31.0 | 25.0 |
| 2004-2005 | 19.0 | 20.0 | 18.0 | 25.0 | 27.0 | 17.0 | 21.0 | 21.0 | 17.0 | 23.0 |
| 2005-2006 | 17.0 | 18.0 | 16.0 | 22.0 | 21.0 | 15.0 | 17.0 | 19.0 | 13.0 | 18.0 |
| 2006-2007P | 16.0 | 18.0 | 14.0 | 21.0 | 22.0 | 15.0 | 15.0 | 19.0 | 12.0 | 17.0 |
| 2007-2008F | 16.0 | 18.0 | 28.0 | 20.0 | 19.0 | 16.0 | 13.0 | 16.0 | 11.0 | 17.0 |
-
Source and a note from the above table Source: Canada Student Loans Annual Reports.
Note: The results for 2006-2007 are preliminary (P) and the results for 2007-2008 are forecasted (F). Older versions of the Annual Reports provided figures with decimal places, while more recent versions do not.
The U.S. uses a different definition of student loan default rate, making it difficult to compare the Canadian and American results. Although the U.S. Cohort Default Rate was 6.7% in 2007, the U.S. default rate definition (i.e. be in default by 270 days or more within a two-year window period) was narrower than the CSLP definition Footnote64 Footnote65 .
5.5.1 Factors Explaining the Default Rate
A U.S. literature review that was developed for this evaluation examined the factors and predictors of student loan default. The examination focused on a series of aspects such as student debt levels, academic success, program completion, employment income, student characteristics and institution characteristics. Most of the U.S. studies demonstrated that school success (borrowers with a high grade point average (GPA)) and graduation (completing the study program) were the two most significant factors in lowering the default rate. Other factors such as employment income, the unemployment rate, debt levels, attitudes toward loans, gender, age, and the number of student loans had a modest effect on the default rate. At the same time, most of the U.S. studies showed that PSE institution characteristics had little or no effect on defaulting.
An internal study using CSLP administrative data identified some of the determinants of CSLP loan default.
- The study reported that males were about five percentage points more likely to default than females and that married borrowers were roughly five percentage points less likely to default than single borrowers.
- Other factors such as the type of institution also influenced the default rate. Borrowers studying at private institutions were more likely to default than those studying at college or university (43.3%, 28% and 16% respectively).
- Some fields of study also appeared to affect the probability of defaulting. For example, borrowers studying medicine were less likely to default (7% default rate) than any other field of study, while borrowers studying trades and administration were more likely to default than any other field of study (39% versus 29% respectively).
- Borrowers who obtained a Masters degree (9.3%) were less likely to default than borrowers in any other program, especially compared to those with a diploma or a certificate (33.5%).
- Defaulting borrowers were about the same age as non-defaulters (27 years old).
- The study also examined the correlation between the amount of the CSLP loan and the default rate. The results showed that the amount of the CSLP loan slightly increases the probability of default, which could be expected because a larger loan means a larger amount to be paid off from borrowers.
Another study suggested that the income of borrowers is a much more important factor in defaulting than the amount of the loan. Footnote66 That study (Kapsalis 2006) reported that: "Regardless of the amount of the loan, the percentage of students defaulting within three years drops by about 1.2 percentage point for each $1,000 increase in own income." Kapsalis concluded that: "the choice of field of study, employment opportunities for new labour market entrants, and general income trends will be the key determinants in the ability of students to repay their loans".
A study using published default rate data in Ontario also confirmed that institution characteristics have an impact on default rates. Specifically, the study found that private colleges had a higher default rate than public colleges, while universities had a lower default rate. The study also reported that the field of study, the location of the PSE institution, the number of loans issued to students at a PSE institution, the number of programs offered by a PSE institution, and labour market conditions were other factors that may have had an impact on default rates. In discussing the limitations of its analysis, the study noted that individual characteristics were not available and, therefore, not included in the model.
Another study (Data Probe 2008) looked at repayment patterns and the default rate Footnote67 . The study indicated that borrowers with small indebtedness (under $4,000) and university borrowers have the strongest repayment performance. After three years, they had repaid 37.1% of their loans and defaulted on 7.8% of their initial indebtedness. By contrast, private borrowers, college borrowers in arts and sciences, borrowers from the Atlantic Provinces or Saskatchewan, and divorced or separated borrowers had the weakest repayment performance. After three years, they had repaid 17.4% of their loans and defaulted on 24.5% of the initial indebtedness.
6. Program Delivery Issues
This summative evaluation was focused on examining the outcomes of the CSLP for the clients. The actual delivery of the program was not examined in detail. There are, however, some basic findings regarding program delivery that can contribute to an overall understanding of the program. Accordingly, this section presents findings on:
- Client awareness and satisfaction;
- Complexity of needs assessment delivery; and
- Performance reporting.
6.1 Client Awareness and Satisfaction
In general, the Government of Canada does well in comparison to other countries in terms of delivering programs and its use of technology Footnote68 .
As discussed in Section 2.2.4, the CSLP engaged the cooperation of the provinces to make some program changes. Since 2001, the Government of Canada has signed separate integration agreements with Ontario, Saskatchewan, Newfoundland, and New Brunswick. The goal of the integration agreements was to have federal and provincial student loans programs operate with a common set of rules, principles, and assistance measures, so that students could receive financial assistance as a single loan product.
The 2007 Omnibus Survey (which was a random sample of 1,205 individuals between the ages of 17 and 30) showed that 43% were aware of the CSLP, which includes those not enrolled in PSE. CSLP awareness levels were similar in integrated provinces and in non-integrated provinces. This level of awareness may simply be a federal branding issue and not an overall student loan awareness problem. For example, in Ontario, students aware of the Ontario Student Assistance Program (OSAP) may not know that in applying for an OSAP loan, they are automatically considered for a CSLP loan.
The 2007 CSLP Client Satisfaction Survey (which randomly sampled 1,010 borrowers in study, in repayment and in grace, and 400 individuals in collection) showed that almost 70% of borrowers who had been in contact with the CSLP in the previous six months were satisfied with the service they received. The level of satisfaction among those in collection was significantly lower, with 44% satisfied.
It should be emphasized that students who applied for a loan but did not qualify were excluded from the Client Satisfaction Survey as well as those who sought information but did not apply. Including the first group would likely have reduced the overall satisfaction level. Consequently, since the Omnibus Survey included non-borrowers and those who applied for a student loan but didn't receive one, satisfaction levels were much lower (40% indicated they were satisfied). Not surprisingly, the level of satisfaction among respondents who applied for but never received a loan was far lower (15%) than among those who received a loan (44%) Footnote69 .
With the exception of borrower status (receiving or not receiving a loan), the statistical analysis of both the Omnibus and the Client Satisfaction Surveys showed that the satisfaction level did not vary across group (gender, marital status, presence of child, urban/rural, income). The evidence also showed no significant difference in client satisfaction between provinces with integrated loans and provinces with non-integrated loans.
Satisfaction with the program was moderate among all focus group participants, but had a tendency to be lower among those who borrowed under the risk-shared regime. Focus group participants who had difficulty in repayment were also more likely to express less satisfaction with the program.
Comparing the CSLP to other programs delivered by HRSDC, the level of satisfaction reported in the CSLP Client Satisfaction Survey (70%) was lower than the levels of satisfaction reported among clients of all 7 programs included in the 2008 Service Canada Client Satisfaction Survey. Among the 7 programs included in the survey, client satisfaction levels ranged from 72% for Apprenticeship Incentive Grant clients to 90% for 1-800 O-Canada clients.
Almost 70% of survey respondents felt that the repayment options were clear to them at the time of loan consolidation and 79% were clear about the total loan amount they owed. However, the percentage of borrowers in collection who said that they found their options clear was much lower (55%) than among borrowers in the grace period or in repayment (72%).
Borrowers' knowledge of their CSL obligations at the time of the survey was lower, however. Specifically, 57% of the borrowers were clear about the number of years needed to pay back their loan, 59% were clear about the interest rate, and 53% were clear about the options available if they could not make their loan payments. This latter percent was, unexpectedly, much lower among borrowers in collection (36%). Females, low-income borrowers, and those in collection were statistically less likely to be clear about their obligations.
As part of client relations, the CSLP is responsible for communicating information to CSL borrowers, potential applicants, and the Canadian public in general. The CanLearn website was launched in 1999 as a method of improving communications with borrowers and potential applicants. For example, the CanLearn website provides information about saving, planning and paying for PSE as well information about the website of the National Student Loans Service Centre. The satisfaction levels with the CSLP websites were relatively low (53%) compared to provincial websites (69%), which suggests that provincial websites could be looked at for ways of improving service delivery.
The majority of focus group participants indicated that students do not have a sufficient initial understanding of their obligations as borrowers. For most students, a government student loan would be their first experience with a significant financial transaction. Many admitted that they did not fully appreciate the significance of their obligations under this contract or the implications for them financially in the future. The greatest frustration seemed to occur around completing and returning paperwork to the office. Utilization of the CanLearn tools appears to have achieved a moderate level of satisfaction, with some users noting that they found the information they needed, while others were more critical of the site design.
6.2 Complexity of Needs Assessment Delivery
As discussed earlier, CSLP delivery is based on the student's needs assessment. Essentially, there is a trade-off between having a process that is simple and easily understood, (but which does not take into account as many details of the student's situation), or having a process that takes into account more individual details at the expense of more complexity for students.
Students are currently faced with a long application form when applying. As well, it is very difficult for students to understand how changes in the variables (e.g. their own earnings) will affect the amount of their loan. Full-time students can, however, use the CanLearn Student Loan Estimator to estimate their total student loan and how much they could potentially receive from the CSLP and provincial funding authorities.
The general feeling among most key informants was that the needs assessment process is currently too complicated. They felt that the program should be simplified and made more universal. Some suggested that there should be bands of eligibility, resulting in less need for various levels of detail. As well, several key informants added that there should be some mechanism to deal with unique circumstances. A similar statement also came from the focus groups, which indicated that the awareness among borrowers of the reassessment process varied across locations.
6.3 Performance Reporting
This summative evaluation included a review of the performance measurement and results reporting of the program.
The bulk of the performance information on the CSLP is reported in the Departmental Performance Report (DPR) and in the CSLP annual reports. As it currently stands, the DPR provides only a few high-level indicators of CSLP performance. These indicators include basic information such as the number of students receiving a loan and the default rate. Otherwise, most of the information is reported in the CSLP annual reports. While the annual report does a good job of describing the program, it does not report on all of the performance indictors listed in the program's Results-based Management and Accountability Framework (RMAF).
In the 2007 Client Satisfaction Survey, the majority of respondents reported that they received their loans in time to pay their tuition fees without penalty. However, for 27% of borrowers the loan did not arrive in time (there was no significant difference between integrated and non-integrated loans). This result was significantly lower than the target developed in the RMAF, which was described as "90th percentile response time".
6.3.1 Possible Improvements
A study done by Jones (2007) reviewed the performance indicators listed in the RMAF and provided a number of overall suggestions for improving the program's performance indicators as well as specific recommendations for some indicators Footnote70 .
- The study noted the difficulty in creating a performance measurement system given that some of the goals of the program may potentially conflict. For example, improving PSE access may be in conflict with the goal of lowering the default rate, because it is possible that less credit-worthy people may get a loan.
- Some indicators are in absolute numbers. Therefore, it can be difficult to appreciate whether higher values of the indicator are positive or negative. Consequently, indicators should be presented as a percentage of the potential population.
- There were also some measures listed in the RMAF that were perceived as being either not useful or not measurable. These indicators included such things as "sustain relationships with provinces, territories and service providers" and "research/analysis reports in progress." While maintaining relationships is certainly important, there is no obvious way of quantifying the program's success at meeting these objectives. Similarly, measuring the number of reports produced is not a good indicator of the quality of the research undertaken.
- It was also emphasized that an additional indicator should be included. As a natural supplement to measuring "the percentage of students who would not have gone to school without a CSL", the additional indicator should measure "the percentage of non-CSL recipients who would have gone on to PSE if they had been able to access a CSL." Currently, the RMAF indicator that does exist is "the percentage of the 17-24 year-old population not enrolled in PSE because of financial constraints," but it was noted that financial constraints do not exactly match with non-receipt of a CSL.
7. Conclusions and Recommendations
The summative evaluation of the CSLP has been undertaken over the last five years using the new approach of conducting a series of 32 smaller studies over that period. Overall, the work of the summative evaluation found that the rationale for the CSLP is still valid. The evaluation also clearly demonstrated that the program achieved its objectives by reducing financial barriers and improving PSE access. The macroeconomic results seem to indicate that the CSLP is pursuing the appropriate approach in terms of general effects (e.g. GDP and equity) by increasing loan limits and by developing policies that assist borrowers after PSE. In addition, the evaluation shows that the main changes to the IR and DRR programs generally reduced the default rate. At the same time, however, there is room for improvement and perhaps changes to some features of the program.
7.1 Recommendations
- Look for ways to simplify the needs assessment process in order to facilitate student comprehension of the processhelp students better understand the process.
- Improve student awareness of the support available to them at loan consolidation time.
- Explore the idea of changing the name of the grace period, because the use of this term often leads to confusion for students about whether interest accrues during this six month period.
- There is a need to improve the understanding of the part-time loans program and possibly make changes because the coverage is quite limited (e.g. the number of participants has declined by 50% since 2000). For example, the rationale is not very clear and does not seem to respond to the current part-time student situation.
- Although the needs assessment system seems to work well, the provincial uniform cost-of-living allowances should be rethought because some expenses (especially shelter) can vary significantly from the average provincial expenses, depending on whether students live in large urban centres, small urban centres, or rural communities.
- Parental contributions were identified as an issue in both the 1997 and 2004 evaluations. Although HRSDC has modified some rules related to parental contributions, evidence collected for the current evaluation indicates that some further adjustments should be made to the parental contribution rules.
- A policy research study should be conducted on the optimal default rate that takes into account the costs of repayment assistance programs. For example, the research should examine whether it is always beneficial to the government to increase assistance through repayment assistance programs in order to reduce student loan default rates? Similarly, a more pro-active pre-consolidation counselling approach could be further explored by the department to help borrowers understand debt management measures and reduce the default rate.
References
Caponi, Vincenzo, 2007, "The General Equilibrium Long-Term Effects of Canadian Education Policies".
Data Probe, 2008A, "Analysis of the Canada Student Loans Program (CSLP): Does the Expected Parental Contribution Affect the Marginal Tax Rate in a Reasonable Way?".
Data Probe, 2008B, "Estimating the Impact of Student Financial Aid on Post-Secondary Enrolments: Trends".
Data Probe, 2009, "Impact of Students Loans and Grants on University Enrolment: Evidence from Aggregate Data".
Data Probe, 2010, "The Generosity of Student Financial Aid Programs in Canada and their University Enrolment Effects".
Educational Policy Institute, 2008, "Does the Calculation of Total Need Include All Relevant Factors?".
Educational Policy Institute, 2009, "International Comparison – Student Financial Aid and Population Education".
EKOS, 2008, "Focus Groups for the Summative Evaluation of the Canada Student Loans Program (CSLP)".
Finnie, Hango, & Wismer, 2010, "Do Increases in Student Loan Limits Increase Access to Post-Secondary Education?".
Fleishman Hillard, 2007, "Expert Interviews for the Evaluation of the Canada Student Loans Program".
Gray and McDonald, 2011, "Burden of Repaying", FORTHCOMING.
HRSDC, 2006A, "Evaluation Framework for the Summative Evaluation of the Canada Student Loans Program".
HRSDC, 2006B, "An Assessment of the Data in the CSLP DARS Files".
HRSDC, 2007A, "Summative Evaluation of the Canada Student Loans Program: Interim Synthesis Report 2006/07".
HRSDC, 2007B, "Trends in Post-Secondary Education and Canada Student Loans Use".
HRSDC, 2007C, "International Comparison of Direct Financial Assistance to Post-Secondary Students".
HRSDC, 2007D "A Discussion of the Rationale of the Student Loans Program".
HRSDC, 2008A, "Post-Secondary Access and Student Financial Aid".
HRSDC, 2008B, "An Assessment of the Data in the CSLP Needs Assessment Reports".
HRSDC, 2008C, "An Assessment of the Data in the CSLP Disbursement Files".
HRSDC, 2008D, "An Assessment of the Data in the CSLP Repayment Files".
HRSDC, 2008E, "Post-Secondary Access and Student Financial Aid: A Historical Overview and Literature Review".
HRSDC, 2008F, "In-Depth Study of the Canada Student Loans Program Needs Assessment Reports (NARS)".
HRSDC, 2009, "Estimation of the Impact of CSLP Generosity on PSE Participation".
HRSDC, 2010A, "Analysis of 2007 Canada Student Loans Program (CSLP) Public Opinion Surveys".
HRSDC, 2010B, "Additional Statistical Analysis for the Impact of Students Loans and Grants on University Enrolment: Evidence from Aggregate Data".
HRSDC, 2010C, "U.S. Literature Review: Default Rates".
HRSDC, 2010D, "The Impact of Student Loan Denial".
HRSDC, 2010E, "Internal Statistical Analysis of the Impact of Ontario Educational Institutions on Default Rates: Aggregate Data".
HRSDC, 2010F, "Evaluation of the Impact of CSLP Policy Reforms on Student Loan Default".
Jones, Stephen, 2007, "Comments on the Performance Measurement Strategy of the Canada Student Loans Program".
Malatest, 2009, "Survey of the Canada Student Loans Program (CSLP) – Applicants who were Approved for a Government Student Loan but Declined their Loan".
SP Consulting, 2008, "Technical Report: Analysis of the Canada Student Loans Program (CSLP): Does the Needs Assessment Reflect the Geographic Differences in Living Costs?".
The Brondesbury Group, 2010, "Examination of Extended Interest Relief (IR) and Debt Reduction in Repayment (DRR)".
TNS Canadian Facts, 2010, "Analysis of the CSLP Default Rate: Program Level Data".
TNS Canadian Facts, 2011, "Analysis of the CSLP Default Rate: Personal Level Data", FORTHCOMING.
Other studies
Accenture (2005), "Leadership in Customer Service – Building the Trust".
Bayard and Greenlee (2009), "Graduating in Canada: Profile, Labour Market Outcomes and Student Debt of the Class of 2005", Statistics Canada, 81-595.
Berger, Motte, & Parkin, (2009), "The Price of Knowledge: Access and Student Finance in Canada", Fourth Edition, Canada Millennium Scholarship Foundation.
Canadian Student Survey (2010), "Next Steps: Upper-Year Canadian PSE Students' Future Plans and Debt", March 2010.
Canadian University Consortium Report (2009), "Graduating Students Survey: June 2009".
Carmichael & Finnie (2007), "Grants or Loans: Theoretical Issues regarding Access and Persistence in Post-Secondary Education", MESA working paper.
Choy & al. (2006), "Dealing with Debt: 1992–93 Bachelor's Degree Recipients 10 Years Later", US Department of Education, National Center for Education Statistics.
Coelli, M (2004), "Tuition Increases and Inequality in Post-Secondary Education Attendance in Canada" University of British Columbia.
Data Probe (2008C), "Repayment of CSLP Direct Loans".
DBRS, "Residential Mortgage and Securitization in Canada: Overview of the Mortgage Market", May 2007.
Drewes, (2006), "Returns to College Education: Evidence from the 1990, 1995, and 2000 National Graduates Surveys" HRSDC.
Drolet, M. (2005), "Participation in Post-Secondary Education in Canada: Has the Role of Parental Income and Education Changed over the 1990s?" Statistics Canada.
Dynarski, Susan M. (2003) "Loans, Liquidity, and Schooling Decisions" Working Paper, Harvard University, Kennedy School of Government and NBER, August 2003.
Finnie, Usher, and Vossensteyn, (2004) "Meeting the Need: A New Architecture for Canada's Student Aid System", IRPP.
Finnie, Ross (2005), "A Simple Model of Access and Capacity for Post-Secondary Schooling in Canada," Queen's University School of Policy Studies Working Paper No. 40, (February).
Frenette, M (2005) "The Impact of Tuition Fees on University Access: Evidence from a Large-Scale Price Deregulation in Professional Programs", Statistics Canada Catalogue no.11F0019MIE.
Frenette, M (2006) "Why are Youth from Lower-Income Families Less Likely to Attend University? Evidence from Academic Abilities, Parental Influences, and Financial Constraints", Statistics Canada Catalogue NO. 11F0019MIE.
Human Resource Development Canada, 1997, "Evaluation of the Canada Student Loans Program".
Human Resources and Skills Development Canada, 2004, "Formative Evaluation of the Canada Student Loans Program".
Human Resources and Skills Development Canada, 2001-2002 to 2007-2008, "Canada Student Loans Program: Annual Report", HRSDC.
Human Resources and Skills Development Canada, 1998-1999 to 2000-2001, "Review of the Government of Canada's Student Financial Assistance Programs", HRSDC.
Human Resources and Skills Development Canada, "2005/06 Departmental Performance Report", HRSDC.
Kapsalis, Costa (2006) "Who Gets Student Loans?" Perspectives, Statistics Canada catalogue No. 75-001-XIE, March.
Kapsalis, Costa (2006b), "Factors Affecting the Repayment of Student Loans", Statistics Canada, No. 81-595-MIE, March 2006.
Kramer, Rogers & Usher, (2010), "The Illiteracy of the Literate: The Lack of Financial Aid Knowledge among Canadian Post-Secondary Students", Canadian Alliance of Student Associations.
Lambert & al., (2004), "Who Pursues Post-Secondary Education, Who Leaves and Why: Results from the Youth-in-Transition Survey", Statistics Canada.
Lavalle & Backus (2007), "Impact of CMSF Bursaries on PSE Persistence, Completion, and Debt Levels", Vestimetra International Inc.
Meyer, D. & Arnold, A, (1998), "Student Loan Defaults in Texas: Yesterday, Today and Tomorrow", Austin, TX: Texas Guaranteed Student Loan Corporation.
Mueller, R, & Rockerbie, D. (2005), "Determining Demand for University Education in Ontario by Type of Student", Economics of Education Review, 24, 469–483.
Neill, C (2006) "Tuition Fees and the Demand for University Places", Waterloo, Ontario: Wilfrid Laurier University, July 2006.
Neill, C (2008) "Can We Say Whether the Canada Millennium Scholarship Bursaries Have Affected Post-Secondary Enrolments?" Wilfrid Laurier University.
Neill, C. (2009) "Tuition Fees and the Demand for University Places," Economics of Education Review, 28(5): pages 561-570.
Office of the Chief Actuary, 2001-2009 "Actuarial Report on the Canada Student Loans Program", Office of the Superintendent of Financial Institutions Canada, OSFI.
Riddell Craig W. (2006), "The Impact of Education on Economic and Social Outcomes: An Overview of Recent Advances in Economics", Canada Policy Research Networks.
Sage Research Corporation, (2007), "Canada Student Loans Program Consolidation Package Research".
Secretary of State, 1981, "Report of the Federal-Provincial Task Force on Student Assistance", Minister of Supply and Services Canada.
Situ Jerry, 2006, "Canada Student Loans Repayment Assistance: Who Does and Does Not Use Interest Relief?" Statistics Canada, July 2006. Cat no, 81-595-MIE2006047.
Statistics Canada, "Post-Secondary Enrolment Trends to 2031", catalogue 81-595-MIE, November 2007.
Statistics Canada, "Canadian Education Statistics Council, Education Indicators in Canada", Catalogue 81-582, December 2007.
Steiner, M., & Teszler, N. (2003), "The Characteristics Associated with Student Loan Default at Texas A&M University", Texas Guaranteed Student Loan Corporation.
Steiner, M., & Teszler, N. (2005), "Multivariate Analysis of Student Loan Defaulters at Texas A&M University, Austin", TX: Texas Guaranteed Student Loan Corporation.
Swail, W., & Heller, D. (2004). "Changes in Tuition Policy: Natural Policy Experiments in Five Countries", Canada Millennium Scholarship Foundation. Woo, Jennie H. (2002), "Factors Affecting the Probability of Default: Student Loans in California", Journal of Student Financial Aid 32 (2): 5-25.
Appendix 1 - Evaluation Questions
| Section of this report or Available in Technical Report (TR) | Source Documents | |
|---|---|---|
| Rationale | ||
| 1. Is there a need for government to facilitate access to post-secondary education? | 2.1.1 | HRSDC 2008E |
2. Does providing loans to students make sense as a way to encourage post-secondary education?
|
2.1.2 TR 2.1.2 2.1.3 |
HRSDC 2008E HRSDC 2007C Key Informants HRSDC 2007D HRSDC 2008E Key Informants HRSDC 2008E International Comparison HRSDC 2007D Key Informants |
| 3. What is an appropriate mix between loans and grants? | 2.1.2 |
HRSDC 2007D
Key Informants |
4. Does it make sense to restrict the loan program to students with demonstrated financial need?
|
3.3
3.3.1 3.3.2 2.3.1, 2.3.2 3.3.3 |
International Comparison
Key Informants Focus Groups Focus Groups Students Expenses, EPI 2008 Key informants Cost Living Students Expenses, EPI 2008 Key informants Focus Groups Key Informants |
| 5. How detailed should the needs assessment be in context of results and costs? | NA | NA |
| 6. Is there a reason to do more than the standard practice of loan collection?
(i.e. - in-study subsidies; DRR, interest relief etc.) What role should debt management play? |
2.3.3 | Key informants |
7. Is it appropriate to have a payment deferral (grace) period? Should it vary by financial need?
|
5.3.2
5.3.2 NA |
International Comparison
Key Informants Key Informants Focus Groups NA |
8. Does it make sense to have a separate program for part-time students?
|
2.3.1, 3.2
NA NA |
HRSDC 2007D
Key informants NA NA |
| 9. Should the program design include additional elements that would better motivate program completion, more rapid graduation, and completion with good academic standing? | 2.3.1
TR |
Key Informants
Focus Groups |
| Objective and Achievements | ||
10. What is the detailed profile of CSLP and CSG participants?
|
3.1
3.1.1 to 3.1.4 NA |
Brondesbury Group
HRSDC 2007B CSLP Annual Reports Kapsalis (2006) Brondesbury Group HRSDC 2007B NA |
11. What percentage of those eligible for CSLP does not receive it?
|
3.3
TR 3.4.1, 3.4.3 |
Key Informants HRSDC 2010D HRSDC 2010D HRSDC 2010D |
| 12. What percentage of CSLP recipients didn't need it? What factors explain why they do not need CSLP? | 3.4.3 |
CSLP Decliners Survey CSLP Increase PSE? – Finnie |
| 13. Are there those who are in need of assistance to attend PSE but who are not eligible for CSLP? | 3.1, 3.4.3 | Key Informants CSLP Decliners Survey HRSDC 2010D |
14. What are the long-term trends in participation in PSE and CSLP and to what extent can changes be attributed to the various program changes versus external influences?
|
3.4.3
TR |
Data Probe 2008B Data Probe 2008B |
15. Does the needs-assessment accurately reflect a student's financial needs (costs less resources) during the school year?
|
3.3
3.3.2 TR 3.3.1 3.3.3 |
Key Informants
Focus Groups Student Expenses, EPI 2008 Key Informants Student Expenses, EPI 2008 Cost of Living, SP Cons Focus Groups Student Expenses, EPI 2008 Key Informants Focus Groups Student Expenses, EPI 2008 Key Informants Focus Groups |
| 16. Are income limits reasonable for extended interest relief? | TR | Focus Groups |
| 17. Are the repayment structures reasonable? | 2.3.3, 5.4 | Key informants International Comparison |
| Program Impacts and Effects | ||
18. Did CSLP, including Canada Study Grants and Canada Access Grants, facilitate access to PSE for students with demonstrated financial need?
|
3.4.3
3.4.3 |
HRSDC 2008E Data Probe 2009 Data Probe 2010 HRSDC 2010B HRSDC 2009 |
19. What are the macroeconomic impacts of the CSLP?
|
5.1
5.1 5.1 |
Caponi (2007)
Caponi (2007) Caponi (2007) |
20. To what extent would private loans or other financing be available to students if the CSLP did not exist?
|
3.4.2
TR 3.4.2 5.2 |
HRSDC 2010A
HRSDC 2010D HRSDC 2010A Data Probe 2008B HRSDC 2010D HRSDC 2007D |
| 21. Are CSLP recipients staying in school longer? | 3.4.3 | Decliners, Malatest 2009
HRSDC 2010A |
| 22. Are CSLP recipients more or less likely to work part-time during the school year and does affect academic achievement? | 3.4.2 |
HRSDC 2010A
Data Probe (2008) |
| 23. Are debt management measures such as Interest Relief, Debt Reduction in Repayment, and revision of terms working as intended? To what extent do they reduce the default rate? |
5.4, 5.4.2 | Decliners, Malatest 2009
The Brondesbury Group U.S. literature review TNS Canadian Facts 2010 HRSDC 2010F |
| Cost Effectiveness / Program Alternatives | ||
24. What is the cost of the CSLP overall and its various components?
|
4.1
4.2 4.3 |
CSLP Annual reports
CSLP Annual reports CSLP Annual reports |
| 25. Is the current CSLP a cost-effective program (relative to previous regimes) and are there more cost-effective alternatives? | 4.4 | International Comparison |
| 26. To what extent do students make use of other sources of funding? | 3.4.2 |
HRSDC 2010A
HRSDC 2007B |
| 27. What are the costs of the Interest Relief (IR) and the Debt Reduction in Repayment (DRR) provisions? | 4.1 | CSLP Annual reports |
| 28. Who is making use of the IR and DRR provisions? | 5.4.1 | The Brondesbury Group |
| 29. What are the long-term trends in the default rate and to what extent can they be attributed to various changes in the program? | 5.5, 5.5.1 |
CSLP Annual reports
HRSDC 2010C HRSDC 2010F |
| 30. What are characteristics of those who default? | 5.5.1 |
HRSDC 2010F
HRSDC 2010C HRSDC 2010E |
| Program Delivery Issues / Communications | ||
31. What is the level of client satisfaction?
|
6.1
6.1 6.1 |
HRSDC 2010A
HRSDC 2010A Focus Group HRSDC 2010A |
| 32. Did the program maintain effective communications with clients and stakeholders since the introduction of direct loans? | N/A | N/A |
33. To what extent are prospective PSE students aware of the CSLP and its rules and requirements?
|
N/A
6.2 |
N/A
Focus Group Key Informants |
| 34. Have integrated loans improved client satisfaction? | 6.1 | HRSDC 2010A |
| 35. Does the CSLP have an appropriate performance measurement and reporting strategy? What elements of this strategy could be improved? |
6.3.1 | Jones, 2007 |
| 36. Do loan applicants find the process understandable? | TR | Focus Groups |
| 37. Are applicants aware of the reassessment process? | TR | Focus Groups |
| 38. Do students receive their loans or grants in a timely manner? | 6.3 | HRSDC 2010A |
| 39. Do applicants for extended interest relief find the process straightforward? | N/A | N/A |
40. Are students well-informed of their repayment obligations?
|
6.1/TR
5.3.2 |
Key Informants
HRSDC 2010A Focus Groups Key Informants HRSDC 2010A |
Appendix 2 - Logic Model (RMAF)

Text version of Appendix 2 - Logic Model (RMAF)
Appendix A describes the Logic Model of the Canada Student Loans Program Logic Model. It describes the vision statement, identifies 6 activities, 7 outputs, 6 short-term outcomes, 3 medium-term outcomes and 2 long-term outcomes. The model builds from the activities level downward to the long-term outcomes.
Vision Statement:
The vision of the Canada Student Loans Program is described as follow:
Canadians have an opportunity to develop the knowledge and skills they need to participate in the economy and society.
Level 1: Activities
The Canada Student Loans Program Logic Model is comprised of the following six sets of activities:
- Administer loans to provide funding to eligible students in financial need;
- Provide grants to eligible students with particular need;
- Build relationship with borrowers and prospective borrowers;
- Manage loan repayment process;
- Sustain relationship with Provinces/Territories & Service Providers;
- Research which include:
- Policy;
- Socio-economic;
- Program Analysis;
- Client Survey;
Level 2: Outputs
When the decision is: Students in need assisted, the activities Administer loans to provide funding to eligible students in financial need and Provide grants to eligible students with particular need are leading to the outputs:
- Canada Student Loans which include:
- In-study interest subsidy;
- Canada Study Grant (CSG) which include:
- Women in Doctoral Studies;
- Students with Dependants;
- High-Need Part-Time Students;
- High-need Students with Disabilities;
- Canada Study Grant:
- Reimbursement for equipment and services for students with disabilities;
The activity Build relationship with borrowers and prospective borrowers is leading to the set of outputs including: - CanLearn Website, Info Packages, Student contracts, Case management and Correspondence
The activity Manage loan repayment process is leading to the set of outputs including: - Debt Repayment Planning:
- Loan Agreement
- Interest Relief
- Debt Reduction in Repayment
- Revision of Loan Terms
The activities Sustain relationship with Provinces/Territories & Service Providers and Research (Socio-economic,Program Analysis and Client Survey) are leading to the following two sets of output: - Agreements, Contracts and Arrangements;
- Reports and Papers;
Level 3: Short-Term Outcomes
The seven outputs result in six short-term outcomes.
The outputs under Students in need assisted: Canada Student Loans (In-study interest subsidy) and Canada Study Grant (CSG) (Women in Doctoral Studies, Students with Dependants, High-Need Part-Time Students and High-need Students with Disabilities) are leading to the short-term outcome:
- Financial barriers reduced to improve access to post-secondary education;
The outputs under Students in need assisted: Canada Study Grant (CSG) (Women in Doctoral Studies, Students with Dependants, High-Need Part-Time Students and High-need Students with Disabilities) and Canada Study Grant (Reimbursement for equipment and services for students with disabilities) are leading to the short-term outcome: - Increased participation for CSG targeted groups in post-secondary education;
The output under Students in need assisted: Canada Study Grant (Reimbursement for equipment and services for students with disabilities) is leading to the short-term outcome: - Learning barriers reduced to improved access to post-secondary education;
The set of outputs including: CanLearn Website, Info Packages, Student contracts, Case management and Correspondence is leading to the short-term outcome: - Improved communications and more informed decision-making by borrowers and prospective borrowers;
The output Debt Repayment Planning (Loan Agreement, Interest Relief, Debt Reduction in Repayment and Revision of Loan Terms) is leading to the short-term outcome: - Improved repayment rate of borrower, reduced cost of loan administration and improved loan portfolio performance;
The set of outputs including: Agreements, Contracts and Arrangements, and the set of outputs including: Reports and Papers are leading to the short-term outcome: - Improved information for program decision-making and improved products;
Level 4: Medium-Term Outcomes
The six short-term outcomes result in three medium-term outcomes.
The following three short-term outcomes: Financial barriers reduced to improve access to post-secondary education, Increased participation for CSG targeted groups in post-secondary education and Learning barriers reduced to improved access to post-secondary education are leading to the two following medium-term outcomes:
- Increased completion of post-secondary education;
- Reduced Debt Load for Borrowers;
The following three short-term outcomes: Improved communications and more informed decision-making by borrowers and prospective borrowers, Improved repayment rate of borrower, reduced cost of loan administration and improved loan portfolio performance and Improved information for program decision-making and improved products are leading to the following medium-term outcome: - Improved Borrower satisfaction with loan experience;
Level 5: Long-Term Outcome
The three medium-term outcomes: Increased completion of post-secondary education, Reduced Debt Load for Borrowers and Improved Borrower satisfaction with loan experience are leading to the two long-term outcomes.
- Better employment opportunity and mobility for students in financial need;
- Strengthened ability of borrowers to better help themselves within the community;
Appendix 3 – Methodology - Summary of Technical Reports
1. HRSDC, 2006, "An Assessment of the Data in the CSLP DARS Files"
This report examines the Default and Recovery System (DARS) database (CSLP administrative data files) in order to determine the extent to which it could be used to answer the evaluation questions developed in the evaluation framework. The database contains information on borrowers whose loans have gone into default. It includes information on the current debt amount, the debt amount at default, and the total debt amount (principal and interest).
The report indicated that the numbers derived from the DARS database in general appear to be reasonable. However, the report finds that of the 34 variables in the DARS database, 11 are of no use for analysis, either because there is no variation in the data (i.e. contains only 0's) or because the variable duplicates another variable. There might be a high degree of variation in the number of observations from one year to the next, although it cannot be determined with certainty that this is correct. The most important finding from the evaluation perspective is that the DARS database was not very helpful in answering the evaluation questions due to its nature (an administrative database).
2. HRSDC, 2007, "Trends in Post-Secondary Education and Canada Student Loans Use"
This study examines the issue of PSE access by looking at participation in the CSLP and population education levels over time. The study describes the recent trends in PSE and the demographic profile of students attending universities and colleges using the October Labour Force Surveys, the 2001 Census, and the CSLP administrative files from 1998-1999 to 2005-2006.
The analysis revealed that the majority of the PSE students were attending a university (53.2%), aged 29 years old or younger (74.9%), female (56.1%), single (63%), and full-time students (72.6%). In comparison, full-time CSL borrowers were younger and more likely to be single compared to the average PSE population. The analysis also showed that both parental education and income was correlated with PSE participation but, as expected, CSL use was found to decrease with parental income. Over the period, the proportion of CSL recipients attending university increased significantly, as well as the proportion of recipients aged 29 years old and younger.
3. HRSDC, 2007, "International Comparison of Direct Financial Assistance to Post-Secondary Students"
This literature review compares PSE financial support in 16 countries, focusing on loan and grant programs. The report examines the characteristics of the loan and grant programs, looks at eligibility requirements, coverage, maximum entitlements, and treatment of debt repayment.
Most countries had both student loans and grant programs for PSE students, with the exception of IReland and Austria. Nevertheless, the characteristics of the programs varied in terms of eligibility requirements (e.g. citizenship, residence, etc) and the intended covered population (variation by age and income). Most countries also had plans for debt repayment (income contingent or mortgage-type payments) as well as assistance programs for students in repayment. The characteristics of the repayment plans often differ from one country to another.
4. HRSDC, 2007 "A Discussion of the Rationale of the Canada Student Loans Program"
This discussion paper provides a deeper understanding of the rationale of the CSLP program, including its various components. The paper examines the theory behind the government intervention to encourage PSE and the theoretical role of the CSLP. It also examines the rationale for some of the details of the CSLP such as the Canada Access Grants and Canada Study Grants.
The overall CSLP rationale remains strong in spite of Canada's very high participation in PSE, as credit constraints exist for students (e.g. low-income families). The rationale for some features of the CSLP might need to be revisited such as grants for part-time students. The paper also revealed that the impact of the Millennium Foundation grants on PSE access was limited even though the grants reduced, in most cases, the student's debt.
5. HRSDC, 2008, "An Assessment of the Data in the CSLP Needs Assessment Reports"
This report describes the Need Assessment Reports (NARS) files from the CSLP administrative database. These files are created by the participating provinces and territories and contain information on the needs assessment performed for each CSLP applicant. The report explores the extent to which the information in the files lines up to those in published reports, in order to ensure that analyses using these files are accurate.
The report indicates that the majority of variables in these files were found to be not useful due to either a large number of missing values, odd variation across files, or inconsistency with published numbers. The NARS files cannot be used to generate statistics on most socio-economic characteristics related to PSE access and does not allow any detailed analysis of the needs assessment procedures. Consequently, the NARS files have a limited utility from an evaluation point of view.
6. HRSDC, 2008, "An Assessment of the Data in the CSLP Disbursement Files"
This report examined the three CSLP administrative data files relating to the disbursement of student loans. The report investigates the extent to which the numbers in the database line up to those in published reports. Two out of the three databases were found to contain good information on loans disbursed to full-time and part-time students. Thus, all the statistics derived from these databases were found to be consistent with numbers published in the CSLP annual reports, such as the number of loans and borrowers, loan amounts, and various socio-demographic characteristics of borrowers. The third database, which contains data on loans authorized since 1970-1971, was found to be of poorer quality since almost all of the information included was found to be unreliable prior to 1993-1994.
In conclusion, the disbursement files have been determined as having some utility for evaluation purposes as they could be used to generate a profile of loan recipients, calculate the percentage and the characteristics of students authorized or not authorized to receive a CSL, and examine the trends in CSLP participation and the level of CSLP assistance.
7. HRSDC, 2008, "An Assessment of the Data in the CSLP Repayment Files"
This study focuses on the four repayment databases. The report explores the extent to which the numbers in the databases replicate those in published reports. The file providing information on borrowers who attended public institutions was found to be complete in terms of the information and few discrepancies were found. The file covering loans granted to borrowers attending private institutions was still in the testing stage and contains many discrepancies. The file containing information on borrowers who have applied for or received IR was found to have a large number of missing values, outliers or to be inconsistent over time and with other variables. By contrast, the file which includes information on borrowers who benefited from the DRR contains consistent and reliable information.
In conclusion, the report revealed that the repayment files have some utility for evaluation purposes as some questions identified in the CSLP Evaluation Framework could be partially addressed with the Repayment data files.
8. HRSDC, 2008, "Post-Secondary Access and Student Financial Aid: A Historical Overview and Literature Review"
A review of the literature was conducted on the rationale for student financial assistance programs, whose goal is to increase PSE access. The review also examined the extent to which student financial aid programs facilitate PSE access by removing financial barriers to education.
Results of the literature review on enrolment effects of student aid varied by type of aid received. The PSE enrolment effects associated with grant aid were found to be ambiguous as cited in the literature surveyed. Student loans were also found to have an ambiguous impact on enrolment. Merit-based aid appeared to generate positive enrolment effects but also appeared to worsen the income disparities in PSE attendance.
9. HRSDC, 2008, "In-Depth Study of the Canada Student Loans Program Needs Assessment Reports (NARS)"
This study takes an in-depth look at the Needs Assessment Reports (NARS) files. The objective was to determine whether the quality of the NARS data was good enough to replicate the needs assessment performed by the provinces. While the NARS data was found to be consistent with most key personal characteristics used in the calculation of needs, the costs and resources variables were found to be less reliable. Many of these variables did not contain any positive values in some provinces.
For a significant number of assessments, the sum of all assessed items did not equal the total as it should have. These problems with the data explain the difficulty in replicating the needs assessment. Indeed, the needs assessment has been replicated for only 5% of the assessments reported in the 2005-2006 NARS database. For 95% of the assessments, the student's needs estimated by applying the CSLP rules to the NARS data did not equal the student's needs reported by the provinces (within a 5% percent margin of error).
10. HRSDC, 2008, "Analysis of 2007 Canada Student Loan Program (CSLP) Client Satisfaction Surveys"
HRSDC conducts two public opinion surveys every year in order to identify potential delivery issues. This report presents results from two surveys: the 2007 Client Satisfaction Survey and the 2007 Omnibus Survey. The Client Satisfaction Survey focuses on CSLP clients. The Omnibus Survey has a larger scope as its population target consists of Canadians between 17 and 30 years of age who may or may not be PSE students and/or CSLP clients.
The main findings are that the satisfaction levels with CSLP websites were relatively low (53%) compared to provincial websites (69%); that 27% of students did not receive their loan in time to pay their tuition fees without penalty; that only 35% of borrowers were aware of the interest accrual during the grace period; and that 46% of clients were not clear about the repayment options available to them if they cannot meet their scheduled debt payments.
11. HRSDC, 2009, "Estimation of the Impact of CSLP Generosity on PSE Participation"
This study seeks to estimate the impact of CSLP generosity on PSE participation, by determining whether CSLP removes financial constraints for credit-constrained students. The study uses data from a merged CSLP-LAD database and covers the 1999 to 2006 period. To determine the impact, an unbalanced panel logit model was estimated.
The results from the study indicate that the CSLP program has a small and statistically significant impact on the PSE participation rate. Each additional $1,000 increase in total student aid increases the PSE attendance rate in the lowest parental-income quartile by about one percentage point.
12. HRSDC, 2010, "Additional Statistical Analysis for the Impact of Students Loans and Grants on University Enrolment: Evidence from Aggregate Data"
The report looks at the impact of the CLSP on the university enrolment rate of students in low-income families using statistical analysis approaches (pooled cross-sectional statistical analyses). This report was a supplementary analysis of the "Impact of Students Loans and Grants on University Enrolment" report. Aggregated data from CSLP/LAD file for the 1998 to 2006 period was used.
The study indicates that loans had a significant positive impact on the university enrolment level of students with low parental income. It also reports that loans and grants were not significant for the enrolment level of students from middle and high parental income families. The study shows that the average level of university tuition had a negative effect on the enrolment rate of students with low parental income.
13. HRSDC, 2010, "U.S. Literature Review: Default Rates"
This report provides a comprehensive review of many U.S. studies on student loan default rates in order to obtain a broad idea of the factors affecting repayment and default rates. In the report, most of the studies have roughly identical weight as there is no attempt of assessing their quality even if some reports do not measure the causality of their results. Instead, the ultimate goal of this literature review is to pull out the consensus among the U.S. literature of the factors affecting repayment and default rates.
The report suggests that some factors such as graduation, academic success, revenue and the unemployment rate had more impact on the default rate than, for instance, the educational institution and field of study. Other factors such as the level of debt, attitudes toward loans, gender, age, and the number of student loans had a modest impact on the default rate. The report also indicates that financial counselling and consolidation have an impact on reducing the default rate, while deferment programs had a short-term impact which tends to disappear after several years.
14. HRSDC, 2010, "The Impact of Student Loan Denial"
This study used a sample of government student loan applicants from the third cycle of the Youth in Transition Survey, cohort A (YITS-A) to investigate whether being rejected for a loan had an impact on PSE enrolment. The choices of attending or not attending PSE institutions were modeled using multinomial logit regressions. The model used in this paper includes a standardized test to control for student's abilities in order to provide a remedy of a critical mis-specification in prior research on the impact of SFA on PSE access.
The study shows a strong correlation between the loan application result and participation in PSE: the odds of attending PSE institutions were 67% and 63% lower respectively for youth who did not have their loan approved compared to those who had their loan approved. In terms of probabilities, loan denial reduced the probability of attending any type of PSE institution by almost 10 percentage points (from 93.6% to 83.9%). Consequently, the results from the study suggest that credit constraints exist and that student loans play an important role in removing financial barriers to PSE.
15. HRSDC, 2010, "Internal Statistical Analysis of the Impact of Ontario Educational Institutions on Default Rates: Aggregate Data"
This report examines the impact of PSE institutional characteristics and a student's field of study on the student loan default rate in Ontario. Ontario was chosen for this study because the province published time series data on the student loan default rate from 1998 to 2008. A database was built from this information to conduct statistical analyses. The database includes 715,659 loans issued by the Ontario Government, with each loan assigned to an institution and a field of study.
The study provides some evidence that institutional characteristics and field of study had an impact on the default rate in Ontario. The different types of PSE institutions seem to have an impact on the default rate. The study also shows that a lack of employment opportunities for recent graduates increases the difficulty students have in paying back their student loans.
16. HRSDC, 2010, "Evaluation of the Impact of CSLP Policy Reforms on Student Loan Default"
This study assesses the effectiveness of the enhancements of IR and DRR in 2004 and 2005, which aim to reduce the default rate on student loans. This study used the CSLP administrative data from January 2001 to October 2008 and developed a model using a difference-in-differences approach to measure the impact of the enhancements, as well as identifying factors affecting the CSLP default rate.
The study shows that the enhancements of IR and DRR have a small but significant impact on default rates, reducing the probability of defaulting by 0.5%. The report also indicates that the CSLP loan amount slightly increases the probability of defaulting. Furthermore, the study identifies factors affecting the default rate. For instance, males are more likely to default than females, as well as borrowers who studied in private institutions compared to those who studied in public colleges or universities. On the other hand, married borrowers are less likely to default than other types of borrowers and those who studied in a Masters program are also less likely to default than those in other programs.
17. Caponi, Vincenzo, 2007, "The General Equilibrium Long-Term Effects of Canadian Education Policies"
This study use a general equilibrium model of the economy developed by the HRSDC Policy Research and Coordination Directorate in order to study the theoretical impacts of a student loans program on the economy. An academic expert was contracted to create the model to include the analysis of student loans. The model examines, on a theoretical basis, how changes to loans program would affect attendance in PSE and their effects on the productivity (GDP) of the economy and income inequality (distribution of earnings).
The study compares the effect of five different government policies. The main results are that the general equilibrium effects of all policies are small; that increasing the maximum limit of student loans is preferable in term of productivity and inequality than reducing tuition fees; and that a policy mixing need-based and merit-based grants (or only need-based grants) is also preferable in terms of productivity and inequality than a policy using only merit-based grants.
18. Data Probe, 2008, "Analysis of the Canada Student Loans Program (CSLP): Does the expected parental contribution affect the marginal tax rate in a reasonable way?"
This study uses the NARS database (2005-2006) to examine how parental contributions expected by the program impact parental marginal tax rates and how the impact varies across provinces. The amount of parental income taxes was calculated using a personal income tax calculator. The results show that CSLP parental contributions can have a significant effect on marginal income tax rates. Families with incomes above $100,000 can face an increase in marginal tax rates of approximately 18 percentage points, on top of their marginal income tax rates. However, less than 5,000 students have parental incomes in excess of $100,000 (about 1% of CSLP borrowers).
19. Data Probe, 2008, "Estimating the Impact of Student Financial Aid on Post-Secondary Enrolments: Trends"
The objective of the study is to estimate the impact of changes in loans and grants on the PSE enrolment rate, particularly among youth from low-income families. The study compares the LAD to Labour Force Survey trends in the population and full-time PSE enrolments over the 1998 to 2006 period.
Using the existing literature and an explorative analysis, the study reports that the PSE supply is inelastic, dominated by supply factors. If the supply remains unchanged, higher student financial aid tends to have a marginal effect in overall PSE enrolment. Consequently, if the goal is to increase the overall enrolment regardless of family income, the government should increase the supply through more financial resources.
20. Data Probe, 2009, "Impact of Students Loans and Grants on University Enrolment: Evidence from Aggregate Data"
The study estimates the impact of the CSLP on the university enrolment rate by parental income level, focusing on students from low parental income families. The Longitudinal Administrative Database (LAD) from 1998 to 2006 was used to estimate the impacts of the CLSP.
The results from the study show that each additional $1,000 of Student Financial Aid (SFA) increases the university enrolment rate of youth in the lowest parental income tricile by about half a percentage point. However, each additional $1,000 of SFA has no effect on the youth enrolment rate in the middle parental income tricile. Sensitivity analyses were conducted but did not alter any main findings.
21. Data Probe, 2010, "The Generosity of Student Financial Aid Programs in Canada and their University Enrolment Effects"
The key objective of this study is to estimate the effect of student loans on university participation rates. Two approaches are used in estimating the effects of the CSLP. The first approach estimates the response of enrolments to changes in the maximum loan amount in a province/year combination. The second approach takes into account changes in program generosity for students across the parental income spectrum. The linked CSLP-LAD database from 1999 to 2005 has been used to estimate the impact.
The results of the study suggest that the CSLP successfully achieves its goal of supporting enrolments of students from low-income backgrounds. A $1,000 increase in the maximum loan amount is estimated to increase enrolment rates by approximately 0.4 percentage points for low-income males, and 0.8 percentage points for low-income females. A $1,000 increase in overall CSLP loan "generosity" is estimated to increase enrolment rate by 0.85 percentage points for low-income females, but has no apparent effect on the enrolment rate for low-income males.
22. Educational Policy Institute, 2008, "Does the Calculation of Total Need Include All Relevant Factors?"
Research was conducted to determine whether the needs assessment process of the CSLP takes into account all relevant PSE student expenditures. The study compares the matching samples from the CSLP administrative database and the Canadian Post-Secondary Student Financial Survey.
Overall, the study indicates that the current allowances are adequate in terms of meeting average monthly student expenditures, and that there were few instances where student expenditures were vastly different from the program allowances. For the most part, the expenses of married students and single parents are accurately assessed. However, the calculation of assessed expenses falls short for single students, mainly due to shelter and transportation costs (personal car expenses). The study found that a significant number of students own or lease a car, and consequently have substantial transportation costs. This situation occurs often for students living in rural communities where public transportation is not available.
23. Educational Policy Institute, 2009, "International Comparison – Student Financial Aid and Population Education"
This study proposes an international comparison of 17 countries in order to establish whether there is a link between the generosity of student financial assistance programs and the percentage of the population that attends PSE. To achieve the paper's objective, qualitative and quantitative analyses were also produced in order to compare the principal features of student aid programs. The study gives ample information on the major aspects of student aid systems (loans, grants, repayments, repayment assistance) in most of the 17 countries. The comparison among the countries illustrates the major differences and common features of student financial assistance for PSE.
24. EKOS, 2008, "Focus Groups for the Summative Evaluation of the Canada Student Loans Program (CSLP)"
A total of 16 focus groups across Canada were conducted with four types of CSLP borrowers: borrowers in study/recently graduated; borrowers who have consolidated their loans and never used debt management measures (nor defaulted); borrowers who are on or have received IR; and borrowers who have defaulted on their loan. The focus groups primarily examine issues related to the needs assessment process, repayment, program delivery, and client satisfaction.
Overall, the needs assessment process was reasonably clear to borrowers. The overall categories of expenses and the resources allocated were generally acceptable to participants, with the exception of parental contributions. The majority of participants thought that students do not have a sufficient initial understanding of their obligations as a borrower. They believed there was too little information available to borrowers on repayment obligations. There are also key aspects of the repayment process that were not clearly understood such as the total amount owed, the interest rate, and the expected monthly payment. Overall, the satisfaction with the program was moderate, and tended to be lower among those who subsequently had difficulty in repayment.
25. Fleishman Hillard, 2007, "Expert Interviews for the Evaluation of the Canada Student Loans Program"
A consultant was hired to conduct 45 interviews with program administrators (federal, provincial and institutional), representatives from student associations, and academic experts. The interviews focused primarily on issues related to the rationale for the program and issues surrounding the needs assessment process. The general view of the key informants were that a federal program is required to help key target groups access PSE; both the federal and provincial governments have a role to play in funding PSE; that students and their families should also contribute to a student's PSE education; non-repayable assistance could be increased; middle income students may be underserved by the CSLP because of the expected contributions from parents; and that the grace period should be renamed because it is confusing for students.
26. Jones, Stephen, 2007, "Comments on the Performance Measurement Strategy of the Canada Student Loans Program"
An external academic expert was contracted to provide comments on the performance indicators, as described in the program's RMAF. This study consists of a review and an assessment of the CSLP performance indicators. The study also provides a number of suggestions for improving the performance indicators as well as some recommendations on a few specific indicators.
The study noted the difficulty in creating a performance measurement system as some of the goals of the CSLP may potentially conflict, such as increasing PSE access and lowering the default rate. The study suggests using the percentage of the population for performance indicators rather than absolute numbers (population), since it is more difficult to appreciate changes with absolute numbers. The study also reported that some measures listed in the RMAF were perceived as being either not useful or not measurable. It also suggests an additional indicator in order to better measure the percentage of non CSL recipients who would have gone on to PSE if they had been able to access a CSL.
27. Malatest, 2009, "Survey of Canada Student Loans Program (CSLP) – Applicants who were Approved for a Government Student Loan but Declined their Loan"
Every year, there are individuals who are approved for a CSL but decline it. In order to gain insight into the factors influencing this phenomenon, a telephone survey of 1,582 CSL applicants was conducted. In order to determine whether or not student loan decliners had different profiles from those individuals who accepted their loans, the results from the telephone survey were compared to the CSLP administrative database.
The main findings from the comparison of the profiles were that students living outside of Ontario are much less likely to decline a student loan than those living in Ontario and that student loan amounts of less than $3,000 have a greater likelihood of being declined. The survey shows that the main reasons for declining a CSL were: being able to manage PSE without a loan, not attending PSE, and deciding that the CSL amount was too small. It was also reported that the majority of CSL decliners had continued with PSE, and most of the others are still planning to pursue PSE in the future. In order to pursue PSE, they relied slightly more than originally planned upon work income, personal savings, money from relatives, and bank loans or credit cards.
28. SP Consulting, 2008, "Technical Report: Analysis of the Canada Student Loans Program (CSLP): Does the needs assessment reflects the geographic differences in living costs?"
This paper examines whether the needs assessment methodology currently in use is flexible enough to adequately account for differences in living costs across regions in Canada and properly addresses these disparities. The report compares expenditures from the 2005 Survey of Household Spending (SHS) collected by Statistics Canada to the 2005-06 CSLP Student Living Allowances.
The results suggest that the current needs assessment methodology does not adequately account for cost of living differences associated with the size of the urban area in which the student resides. In each province, the average cost estimates for students do not accurately reflect the CSLP allocations for these costs for any of the student types. In almost every case, cost estimates for residents of larger urban areas are greater than the provincial averages by as high as 11%. The main explanation for these differences is due to the higher shelter cost in large urban areas.
29. TNS Canadian Facts, 2010, "Analysis of the CSLP Default Rate: Program Level Data"
This report provides an analysis of the CSL default rate using aggregated data at the CSLP level. The study uses annual data from the CSLP database as well as Statistics Canada information for economic aggregated indicators (e.g. unemployment rate). The analytical approach relies on multivariate regression models. The analysis aims to assess the effect on default rates of the IR and DRR changes that occurred in 1997, 1998 and 2003.
In the study, the cumulative effect of the IR and DRR changes was statistically significant, reducing the default rate and the default costs. The model shows that the cumulative effect of the changes resulted in a reduction of over $14 million in the cost of default. Alternative models (adding the inflation rate or/and the lead inflation rate) shows a larger cumulative effect on the reduction of the default cost. It should be noted that the effect of each change fluctuated considerably in the different models.
30. D.M. Gray and J.T. McDonald, 2011, "Burden of Repaying"
Forthcoming.
31. The Brondesbury Group, 2010, "Examination of EIR and DRR"
The study examines the use of the IR and the DRR provisions. The study includes a descriptive analysis as well as a multivariate analysis. The report attempts to demonstrate whether the increased flexibility in repayment provided by the IR and DRR has an impact on loan default. The study made use of the linked LAD-CSLP database for the 1990 to 2007 period.
The results from the study suggest that IR use increase with age, being a female, and having children. The study indicates that the loan size has a minimal effect on IR use compared to the other variables. In terms of program impacts on default rates, the study reports that there is some indication that IR changes have impacted default rates, but that the relationship is affected by economic conditions. Regarding the DRR, there is no evidence of any program impact. The DRR incidence is so low that it is difficult to associate it with changes.
32. TNS Canadian Facts, 2011, "Analysis of the CSLP Default Rate: Personal Level"
Forthcoming.
33. Finnie, Hango, & Wismer, 2010, "Do Increases in Student Loan Limits Increase Access to Post-Secondary Education?"
This study attempts to measure the impacts of the CSLP and provincial student loans on PSE participation, particularly for students from lower parental income families. Specifically, the study tries to measure the effect of an increase in student loan limits that were introduced in Nova Scotia and Prince Edward Island in 2001 on the participation rates in those provinces relative to the participation rates in Newfoundland and New Brunswick, where no such increases were introduced. A series of models are developed, based on a difference-in-differences approach and using the LAD from 1999 to 2006. The results from the study did not show any significant impact of the 2001 changes in PEI and NS on the PSE participation rates of youth from low-income families in these provinces relative to the PSE participation rates in NF and NB.