
Evaluation of the Canada-Nova Scotia Labour Market Development Agreement
On this page
- List of abbreviations
- List of charts
- List of tables
- Executive summary
- Management response
- Introduction
- Labour Market Development Agreements
- Methodology
- Evaluation findings
- Supplemental studies
- Conclusions and recommendations
- References
- Appendix A. List of 8 studies included in the Canada-Nova Scotia synthesis report
Alternate formats

Evaluation of the Canada-Nova Scotia Labour Market Development Agreement[PDF - 1.2 MB]
Large print, braille, MP3 (audio), e-text and DAISY formats are available on demand by ordering online or calling 1 800 O-Canada (1-800-622-6232). If you use a teletypewriter (TTY), call 1-800-926-9105.
List of abbreviations
- EAS
- Employment Assistance Services
- EBSM
- Employment Benefits and Support Measures
- EI
- Employment Insurance
- ESDC
- Employment and Social Development Canada
- JCP
- Job Creation Partnerships
- LMDA
- Labour Market Development Agreements
- SA
- Social assistance
- SD
- Skills Development
List of charts
- Chart i. Change in probability of being employed in participants relative to non-participants (annual average)
- Chart ii. Employment earnings of participants relative to non-participants (annual average)
- Chart iii. Change in dependence on government income support (annual average)
- Chart 1. Change in probability of being employed in participants relative to non-participants (annual average)
- Chart 2. Employment earnings of participants relative to non-participants (annual average)
- Chart 3. Change in the use of EI benefits (annual average)
- Chart 4. Change in the use of SA benefits (annual average)
- Chart 5. Change in dependence on government income support (annual average)
- Chart 6. Average earnings for active claimant participants in START
- Chart 7. Average earnings for former claimant participants in START
- Chart 8. Average earnings for active claimant participants in Job Creation Partnerships
- Chart 9. Average earnings for former claimant participants in Job Creation Partnerships
- Chart 10. Average earnings for active claimant participants in Skills Development-Apprentices
- Chart 11. Average earnings for former claimant participants in Skills Development-Apprentices
List of tables
- Table i. Share of LMDA funding and average cost per Action Plan Equivalent per participant in Nova Scotia, for the 2010 to 2012 period
- Table ii. Number of years for the benefits to exceed program costs
- Table 1. Share of LMDA funding and average cost per Action Plan Equivalent per participant in Nova Scotia
- Table 2. Profile of active and former EI claimant participants in 2010 to 2012 in Nova Scotia
- Table 3. Employment and earning levels, and use of SA in the year before participation in EBSMs
- Table 4. Profile of female active and former EI claimant participants in Nova Scotia in 2010 to 2012
- Table 5. Incremental impacts for female participants (annual average)
- Table 6. Profile of male active and former EI claimant participants in Nova Scotia in 2010 to 2012
- Table 7. Incremental impacts for male participants (annual average)
- Table 8. Profile of youth active and former EI claimant participants in Nova Scotia in 2010 to 2012
- Table 9. Incremental impacts for youth participants (annual average)
- Table 10. Profile of older worker active and former EI claimant participants in Nova Scotia in 2010 to 2012
- Table 11. Incremental impacts for older worker participants (annual average)
- Table 12. Cost-benefit results for active and former EI claimant participants
- Table 13. Profile of active and former EI claimant participants in Skills Development-Apprentices programs across Nova Scotia in 2010 to 2012
Executive summary
The Canada-Nova Scotia Labour Market Development Agreement (LMDA) is a bilateral agreement between Canada and Nova Scotia for the design and delivery of Employment Benefits and Support Measures (EBSMs).
The objective of EBSMs is to assist individuals to obtain or keep employment through various active employment programs, including training or employment assistance services. Successful delivery of EBSMs is expected to result in participants receiving needed services, a quick return to work, and savings to the Employment Insurance (EI) account.
Programs and services delivered by Nova Scotia have to correspond to the EBSM categories defined under the EI Act. The following is a short description of the EBSMs examined in the evaluation.
Skills Development (SD) provides direct financial assistance to individuals to select, arrange, and pay for training. Training is tailored to the needs of participants through counselling and career orientation. It can include adult-based education, literacy and essential skills, language training, short-term training and occupational training leading to certification from an accredited institution.
STARTFootnote 1 subsidizes the wages of individuals whom employers would not ordinarily hire. The incentives paid to the employer are primarily for wages, employer-related costs and training costs.Footnote 2
Job Creation Partnerships (JCP) support community-oriented projects that provide work experience to participants.
Self-Employment provides financial assistance and business planning advice to participants to help them start their own business.
Employment Assistance Services (EAS) support individuals as they prepare to enter or re-enter the workforce or assist them to find a better job. Services can include job search services, career development and counselling, and résumé writing assistance. These services are referred to as ‘light touch intervention' due to their very short duration. They can be provided on a one-on-one basis or in a group setting.
Sector Council ProgramFootnote 3 aims to support an industry-led approach to human resource development tailored to meet the labour market needs of industry sectors.
Research and Innovation initiatives seek to identify better ways of helping people prepare for, return to or keep employment, and be productive participants in the labour force.
The LMDA investment
In fiscal year 2020 to 2021, Canada transferred nearly $101 million (including nearly $10 million in administration funds) to Nova Scotia.
Table i provides an overview of the share of funding allocated to EBSMs and the average cost per Action Plan Equivalent in Nova Scotia for active and former EI claimants. The average cost per participant is calculated based on the 2010 to 2012 data from the EI Monitoring and Assessment Reports. The 2010 to 2012 period corresponds with the cohort of participants selected for incremental impacts and cost-benefit analysis in the LMDA evaluation.
| Employment Benefits and Support Measures | Average share of funding | Average cost – active claimants | Average cost – former claimants |
|---|---|---|---|
| Skills Development | 62% | $16,488 | $16,272 |
| Employment Assistance Services | 25% | $1,726 | $1,569 |
| Self-Employment | 9% | $18,429 | $18,917 |
| Job Creation Partnerships | 2% | $2,166 | $936 |
| START | 1% | $8,772 | $9,093 |
| Sector Council Program | 1% | n/a | n/a |
| Research and Innovation | 0% | n/a | n/a |
| Total | 100% | n/a | n/a |
- Sources: EI Monitoring and Assessment Reports for fiscal years 2010 to 2011 and 2011 to 2012.
Compared to the 2010 to 2012 period, the LMDA budget allocation varied for few programs and services in 2020 to 2021. For example, investments in SD decreased from 62% to 33%. As well, investments in EAS increased from 25% to 47% of total allocation.
Evaluation objectives
Building on the success of previous LMDA evaluation cycles, the aim of this evaluation is to fill in knowledge gaps about the effectiveness, efficiency as well as design and delivery of EBSMs in Nova Scotia.
Evaluation methodology
The findings in this report are drawn from 8 separate evaluation studies carried out at the provincial level. These studies examine issues related to program effectiveness, efficiency, and design and delivery. A mix of qualitative and quantitative methods are used, including:
- incremental impact analysis for participants who began an intervention between 2010 and 2012
- outcome analysis
- cost-benefit analysis (including savings to health care)
- key informant interviews with 43 Nova Scotia program officials, service providers, project holders, sponsors, career practitioners and key stakeholders
- questionnaires completed by provincial officials
- survey of Self-Employment participants in Nova Scotia
- document and literature reviews
The incremental impacts are estimated for 2 types of EI claimants:
- active claimants are participants who started an EBSM intervention while collecting EI benefits
- former claimants are participants who started an EBSM intervention up to 3 years after the end of their EI benefitsFootnote 6
Key findings
Between 2010 and 2012, nearly 20,000 EI active and former claimants participated in LMDA programs and services in Nova Scotia.
Effectiveness and efficiency of EBSMs
Overall, incremental impacts demonstrate that participation in SD and EAS improves labour market attachment and reduces dependence on government income supports compared to similar non-participants. These results are consistent with those found for earlier cohorts of participants as part of the previous evaluation cycle. A subgroup analyses shows that with some exceptions, SD and EAS interventions also improve the labour market attachment and reduce the dependence on income support for most subgroups of participants. As well, for most interventions, the social benefits of participating in EBSMs exceed the initial investment costs over time.
Chart i presents the incremental impacts on the incidence of employment for active and former claimants by EBSM. The estimates can be interpreted as a chance in the probability of being employed following participation. For example, participation in SD increases the probability of being employed by 4.8 percentage points for active EI claimants relative to non-participants.

- Note: Impacts are estimated over 4 post-program years for SD and 5 years post-program for EAS.
Text description Chart i
| Program name | Incidence of employment for active claimants (percentage points) | Incidence of employment for former claimants (percentage points) |
|---|---|---|
| Skills Development | 4.8 | 5.3 |
| Employment Assistance Services | 1.1 | n/a |
- Note: Impacts are estimated over 4 post-program years for SD and 5 years post-program for EAS.
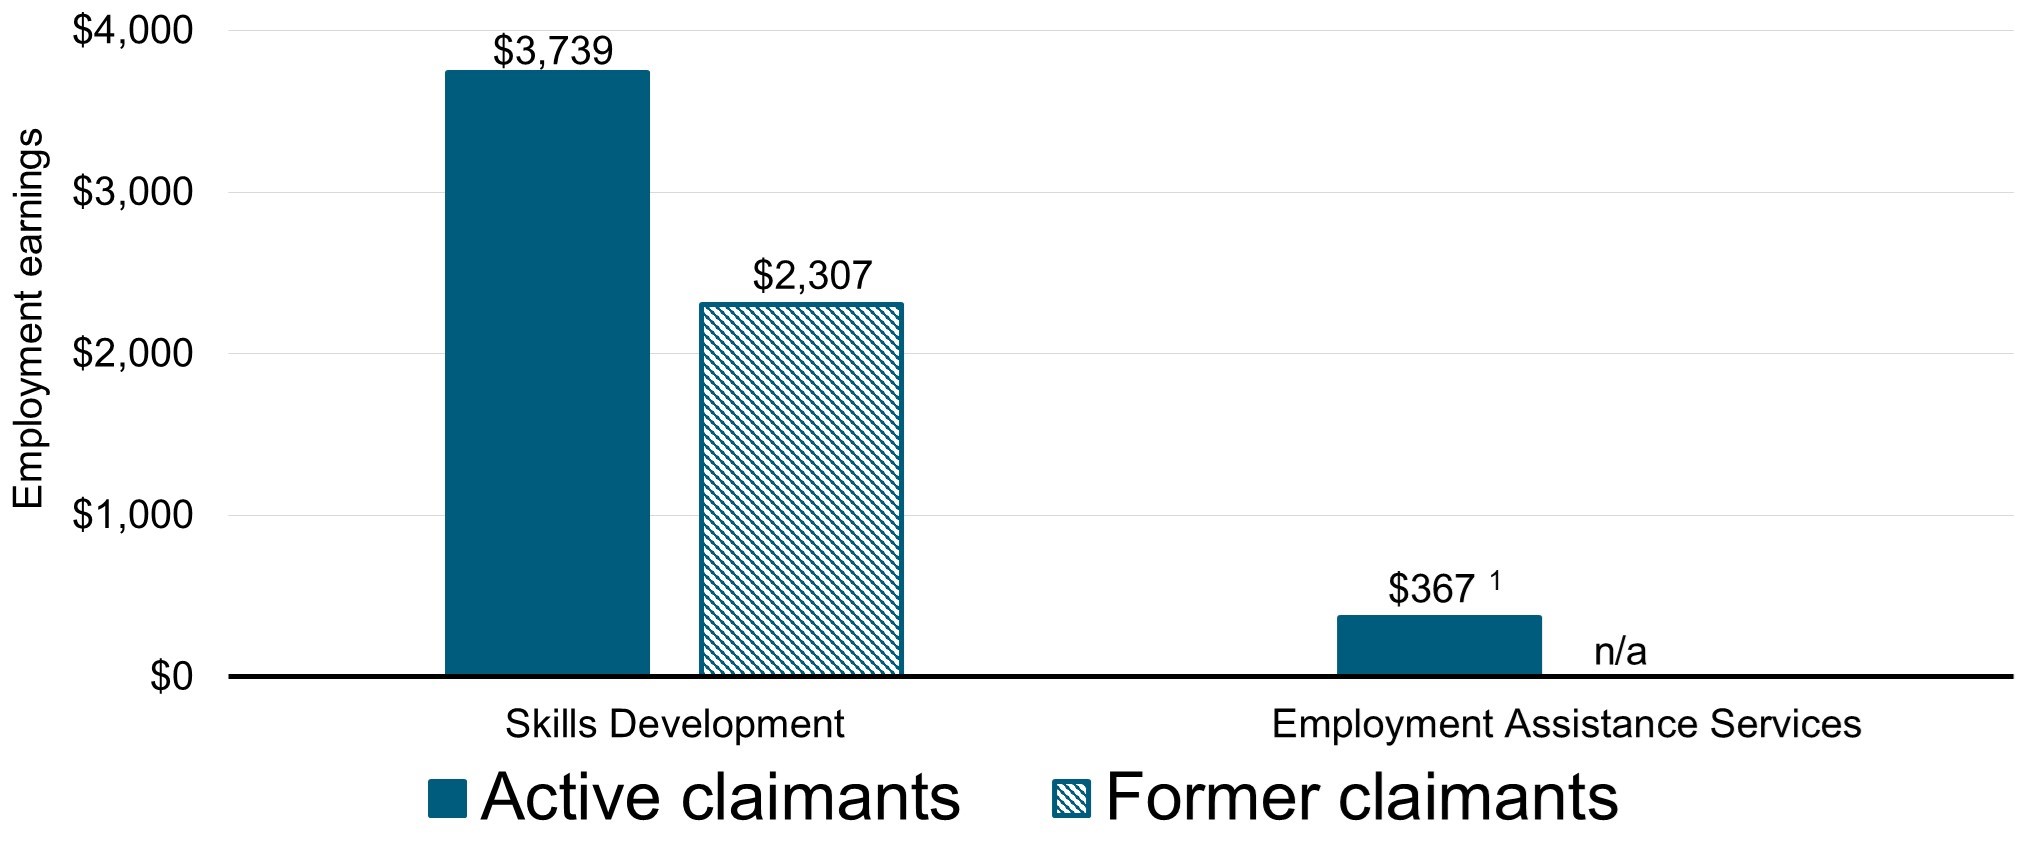
Chart ii presents the annual average increase in employment earnings for active and former claimants over the post-participation period.

- 1 While the annual average increase in employment earnings over the 5 post-program years is not statistically significant, EAS participants increased their employment earnings in years 3 and 4 post-program by $1,039** and $655* respectively.
- Note: Impacts are estimated over 4 post-program years (or 5 years in the case of EAS).
Text description Chart ii
| Program name | Employment earnings for active claimants ($) | Employment earnings for former claimants ($) |
|---|---|---|
| Skills Development | 3,739 | 2,307 |
| Employment Assistance Services | 3671 | n/a |
- 1 While the annual average increase in employment earnings over the 5 post-program years is not statistically significant, EAS participants increased their employment earnings in years 3 and 4 post-program by $1,039** and $655* respectively.
- Note: Impacts are estimated over 4 post-program years (or 5 years in the case of EAS).
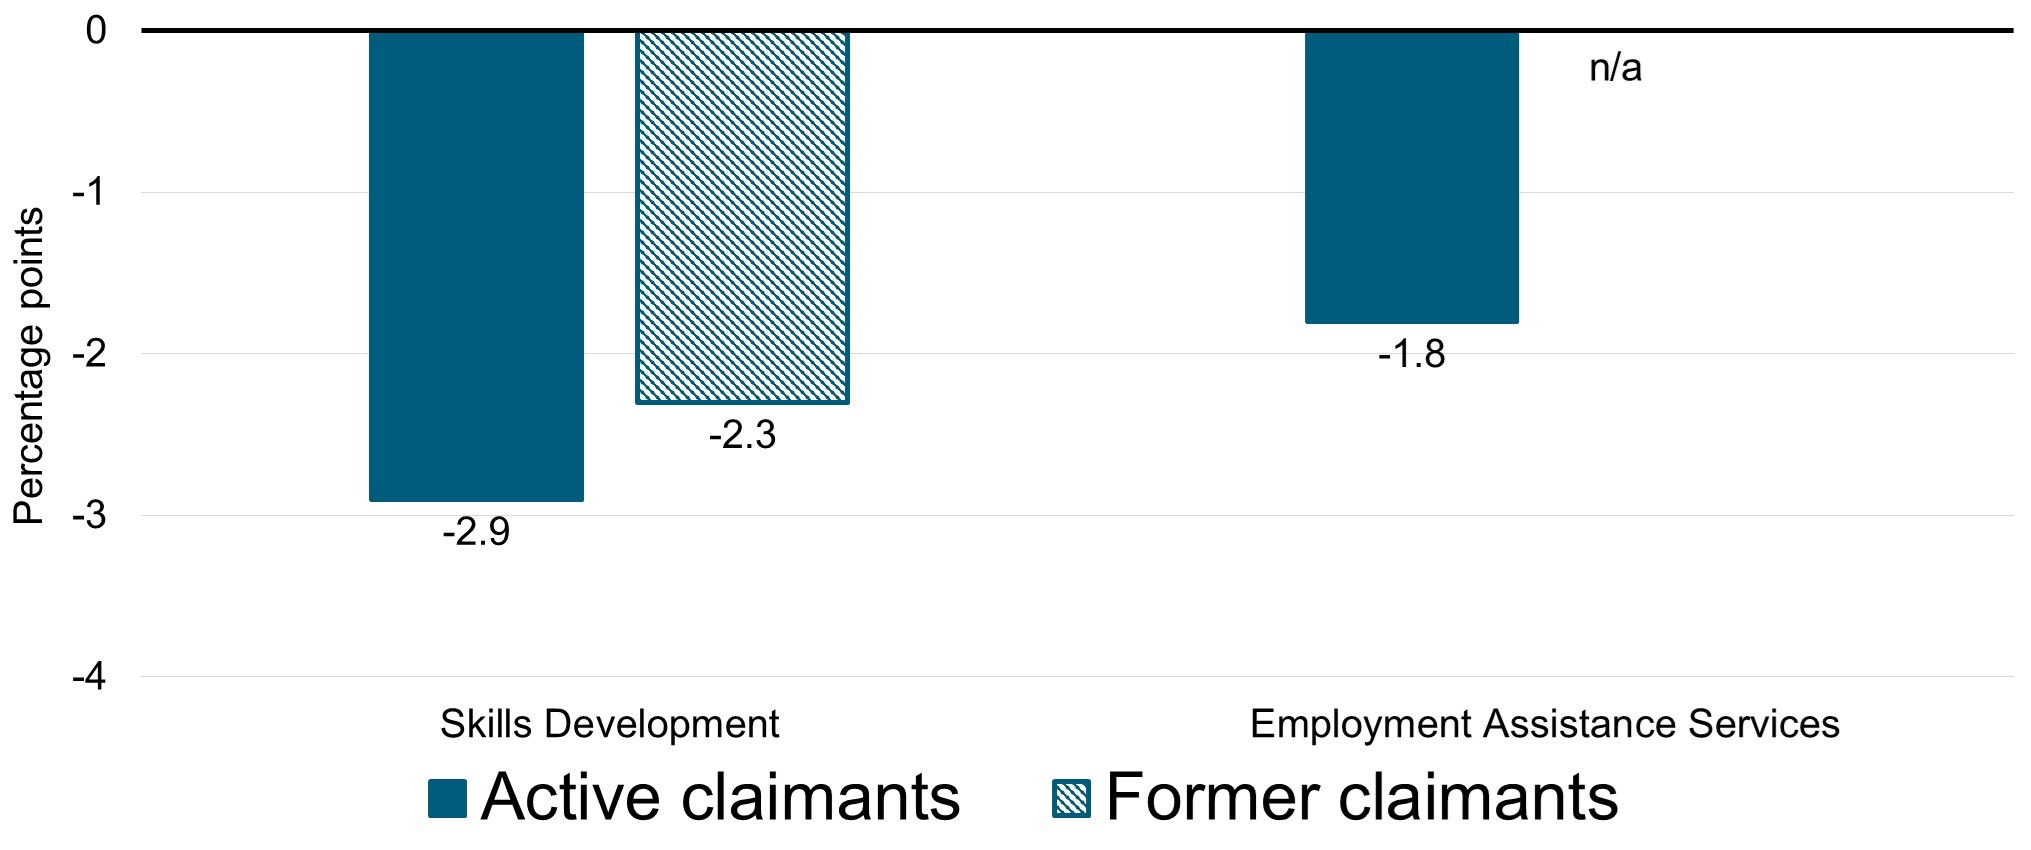
As shown in Chart iii. overall active and former claimants reduce their dependence on government income supports.

- Note: Impacts are estimated over 4 post-program years for SD and 5 post-program years for EAS.
Text description Chart iii
| Program name | Dependence on government income supports for active claimants (percentage points) | Dependence on government income supports for former claimants (percentage points) |
|---|---|---|
| Skills Development | -2.9 | -2.3 |
| Employment Assistance Services | -1.8 | n/a |
- Note: Impacts are estimated over 4 post-program years for SD and 5 post-program years for EAS.
Table ii presents the number of years required for the social benefits to exceed program costs. Social benefits to participation exceed initial investment costs over a period ranging from 7.8 to 12.6 years. As well, for the first time, additional analysis is conducted to estimate the impact of participation in EBSMs on public health care costs. For example, for SD active claimants, the average total discounted benefit to the government and society from the reduction in public health care cost is $388 per participant over 10 years post participation period.
| Payback period | Skills Development - active claimants (10 years post-program) |
Employment Assistance Services - active claimants (5 years post-program) |
Skills Development - former claimants (10 years post-program) |
|---|---|---|---|
| Number of years after end of participation | 7.8 | 12.6 | 9.7 |
Outcomes of EBSMs
Incremental impacts for START and JCP are not produced due to the small samples or due to the models used to estimate the incremental impacts not balancing. Having balanced models is an essential condition to ensure that participants and non-participants are similar. However, outcomes can still be examined for participants in order to describe the average changes that occur from before to after program participation.
Outcomes for both active and former claimant participants in START and JCP show increases in employment earnings from 5 years before program participation to 4 years after. As well, decreases are found in receipt of EI benefits and dependence on government income supports after participation.
Supplemental studies
A series of supplemental studies addresses information gaps previously identified in LMDA evaluations regarding the design and delivery, challenges and lessons learned for Self-Employment, JCP, the Sector Council Program, and Research and Innovation.
Most of these interventions are not suitable for incremental impact analysis. For example, the Sector Council Program and Research and Innovation do not collect participant information. As a results, a mix of qualitative and quantitative methods are used to examine these EBSMs in detail. Key considerations are included to help guide future program and policy discussions.
Self-Employment study
A supplemental study addresses information gaps previously identified in LMDA evaluations for Self-Employment. Using a mix of qualitative and quantitative methods, questions regarding design and delivery, lessons learned, and challenges are examined in detail. Key considerations are included to guide future program and policy discussions.
The Self-Employment program aims to assist participants in creating employment for themselves by providing them with a range of services including:
- assistance with business plan development
- counselling, coaching and mentoring
- entrepreneurial training and workshops
Based on a survey, it was found that 2 to 4 years after program participation:
- participants increased their employment level by 15 percentage points from 58% in the year before participating to 73% at the time of survey. The increase is mainly due to an increase in the percentage of self-employed participants
- nearly 45% of survey respondents launched a self-employment business and it was still in operation
- 60% of self-employment businesses were launched in other services,Footnote 7professional, scientific and technical services, as well as in construction and retail trade
- 70% of respondents said that they were financially about the same or better off after the program
- 68% of respondents said that their household net worth was about the same or higher after the program
The survey did examine the contribution of the program to the success of self-employment businesses. At least 79% of survey respondents who launched a self-employment business rated the following services and training as very or somewhat important to the business launch, operation and success:
- one-on-one mentoring / advice or counselling supports
- assistance with business plan development/assessment
- living allowance during participation and financial assistance with business start-up costs
- discussion on risks and challenges of self-employment
- assessment of entrepreneurial readiness
- information about and assistance to access capital
- training on budgeting, financial management, marketing, business operation and sales
Job Creation Partnership (JCP) study
The JCP program in Nova Scotia is designed to support projects that will provide eligible participants with opportunities to gain work experience and to improve their employment prospects. While project activities should benefit both the participant and the community, the focus of JCP is to assist participants in acquiring work experience, leading to the acquisition of new employment-related skills or the improvement in current skills.
In addition to gaining work experience, key informants identify a variety of other benefits that can be expected from JCP projects. Participants are expected to develop soft and work-related skills, and to enhance their job search abilities, career development and prospects, and personal well-being.
Sponsors can benefit from JCP through increased capacity by having access to labour, implementing their projects, and increasing their services to local communities. At the community level, JCP projects can support the local economy by providing new information and assets (for example, festivals, gardens, collecting and documenting sector-specific data) as well as improved services.
Sector Council Program study
The Sector Council Program aims to support an industry-led approach to human resource development tailored to meet the labour market needs of industry sectors. It includes a wide range of funded activities, such as:
- human resource planning including:
- creation and dissemination of labour market information specific to an industry
- consultation on labour market challenges and opportunities
- development and implementation of human resource strategies/plans and tools
- identification and dissemination of promising practices
- identification of industry training needs
- informing educational curriculum
- attraction and retention activities including:
- creation and dissemination of career resources (for example, brochures, videos; virtual reality career exploration tool)
- creation and dissemination of promotional material and messaging for the sector as a valid employment destination
- participation in/hosting events to promote sector career opportunities (trade shows, career fairs, career presentations in schools)
- promotion of the value of skills development
- activities that support welcoming workplaces
- development of training curriculum and other learning resources
The Department of Labour and Advanced Education and all key informants confirm that program officials carry out activities to support the formation and maintenance of partnerships as a part of the program design and delivery. All key informants stress the importance of partnerships for 'projects' success explaining that partnerships increase the reach and impact of the program, allow project holders to learn about sector needs and contribute to the project delivery.
Research and Innovation study
Research and Innovation projects aim to identify better ways of helping participants prepare for, return to, or keep employment and to be productive in the labour force. Activities funded through Research and Innovation are designed to further develop existing programming or to develop new programming that will either compliment or replace existing programming.
Document review reveals that Research and Innovation projects encompass a variety of activities including:
- conducting a survey of skills in literacy, numeracy and problem solving in technology rich environments among adults between ages of 16 to 65
- developing a center for digital learning to provide best-practices and support for post-secondary institutions offering online education
- using the Phoenix Employment Program designed to provide under-supported unemployed or under-employed youth (aged 18 to 29) with an innovative approach to addressing unique barriers to employment
In relation to factors contributing to successful testing and identification of innovative approaches, program officials highlight the importance of:
- employing experienced staff who have experience in previously administering the program
- providing additional support by program officials to participants for issues outside the scope of the program such as benefits, housing, childcare and literacy
- integrating databases to provide program officials with an environment to collaborate, discuss and disseminate ideas
- conducting monthly check-ins with employers
- providing flexibility in the use of wage subsidies
- employers attending education and training sessions
Skills Development-Apprentices study
The objective of the program is to help apprentices become skilled tradespeople and to increase their labour market attachment. Program participants have generally chosen a career and are already attached to the labour market. The apprenticeship process involves on-the-job learning and technical training in a classroom setting.
The evaluation found that active EI claimants increase their average earnings from $17,445 in the fifth year pre-program to $52,140 in the fifth year after the program start year. Former EI claimants increased their average earnings from $17,851 in the fifth year pre-program to $55,907 in the fifth year after the program start year. After participating in the program, both active and former claimants also decrease their dependence on government income supports.
Recommendations
Since 2012, 15 qualitative and quantitative studies have addressed issues and questions related to EBSM design, delivery, and effectiveness:
- the quantitative studies successfully assessed the effectiveness and efficiency of EBSMs by producing incremental impacts and cost-benefit analysis
- the qualitative studies identified specific challenges, lessons learned, and best practices associated with the design and delivery of EBSMs. Each study included key considerations for program and policy development or recommendations
In addition, the recently completed evaluation of the Workforce Development Agreements complements the LMDA qualitative studies. This comprehensive evaluation provided unique insights into challenges and lessons learned to assist persons with disabilities, immigrants and those further removed from the labour market.
Most results from this evaluation stem from the conduct of advance causal analysis whereby impacts found could be attributed to a specific EBSM. These analyses are predicated on having access to high quality administrative records, thereby confirming the importance of the capacity to leverage and integrate relevant administrative data.
Two key recommendations for Nova Scotia emerge.
Recommendation #1
Nova Scotia is encouraged to share and discuss lessons learned, best practices and challenges associated with the design and delivery of programs and services. Discussions are encouraged with ESDC, at the bilateral or multilateral levels, as well as with service delivery network if necessary.
Recommendation #2
Nova Scotia is encouraged to pursue efforts to maintain and strengthen data collection provisions in support of reporting, performance measurement and data-driven evaluations at the national and provincial levels.
Management response
Nova Scotia collaborated with eleven other provinces and territories and Employment and Social Development Canada (ESDC) to undertake this evaluation. As provincial co-chair of the Labour Market Development Agreement Evaluation Steering Committee, Nova Scotia would like to thank the ESDC Evaluation Directorate as well as the other participating jurisdictions for their work on this project.
Nova Scotia accepts the findings and conclusions of this evaluation report and agrees with the resulting recommendations. Some specific actions Nova Scotia will take in reaction to the recommendations are below:
Recommendation #1: Nova Scotia is encouraged to share and discuss lessons learned, best practices and challenges associated with the design and delivery of programs and services. Discussions are encouraged with ESDC, at the bilateral or multilateral levels, as well as with service delivery network if necessary.
Response: Nova Scotia agrees that sharing and discussing lessons learned, best practices and challenges associated with the design and delivery of programs and services with ESDC, other provinces/territories and its service delivery network is a valuable exercise. Nova Scotia will proactively take steps to ensure that information regarding Labour Market Transfer Agreements - funded programs and services is exchanged on a regular basis through both formal and informal processes.
Recommendation #2: Nova Scotia is encouraged to pursue efforts to maintain and strengthen data collection provisions in support of reporting, performance measurement and data-driven evaluations at the national and provincial levels.
Response: Nova Scotia agrees to continue to pursue efforts to maintain and strengthen data collection provisions in support of reporting, performance measurement and data-driven evaluations at the national and provincial levels. These efforts will include continued development of the Labour Market Program Support System (LaMPSS), data entry training and process and technical support for users of the system. Data quality will continue to be monitored and efforts made to maximize accuracy.
Introduction
Employment and Social Development Canada (ESDC) worked jointly with Nova Scotia and 11 other provinces and territories to undertake the 2018 to 2023 third cycle for the Labour Market Development Agreement (LMDA) evaluations.
The first cycle of LMDA evaluations was carried out from 1998 to 2012. It involved the conduct of separate formative and summative evaluations in all provinces and territories under the guidance of bilateral Joint Evaluation Committees.
Building on lessons learned and best practices from the first cycle, the second cycle of LMDA evaluations was undertaken between 2012 and 2017. The second cycle was designed and implemented under the guidance of a federal-provincial/territorial LMDA Evaluation Steering Committee. The work was supported by bilateral discussions at Joint Evaluation Committees.
The third LMDA evaluation cycle builds on the success of the second cycle. The aim is to fill in knowledge gaps about the effectiveness, efficiency, and design and delivery of Employment Benefits and Support Measures (EBSMs). The evaluation cycle was designed and implemented under the guidance of a federal-provincial/territorial LMDA Evaluation Steering Committee composed of ESDC and 12 participating provinces and territories.
For Nova Scotia, this report presents a summary of findings from 8 separate studies.
Labour Market Development Agreements
The LMDAs are bilateral agreements between Canada and each province and territory for the design and delivery of EBSM programs and services. They were established under Part II of the 1996 Employment Insurance (EI) Act.
In fiscal year 2020 to 2021, Canada transferred nearly $101 million to Nova Scotia.Footnote 8 Under the agreement, Nova Scotia is responsible for the design and delivery of programs and services aimed at assisting individuals to prepare for, obtain, and maintain employment.
LMDA programs and services are classified under 2 categories:
- Employment benefits:Footnote 9, Footnote 10 fall into 5 sub-categories: Skills Development, START, Self-Employment, Job Creation Partnerships, and Targeted Earnings SupplementsFootnote 11
- Support measures: fall into 3 sub-categories: Employment Assistance ServicesFootnote 12, Sector Council Program, and Research and Innovation
Nova Scotia has the flexibility to adapt EBSMs to its jurisdiction's context as long as they are consistent with Part II of the EI Act.Footnote 13
The objective of EBSMs is to assist individuals to obtain or keep employment through various active employment programs, including training or employment assistance services. Successful delivery of EBSMs is expected to result in participants receiving needed services, a quick return to work, and savings to the EI account.
Programs and services examined in this study include Employment benefits and Support measures.
Employment benefits
Skills Development (SD) provides direct financial assistance to individuals to select, arrange, and pay for training. Training is tailored to the needs of participants through counselling and career orientation. It can include adult-based education, literacy and essential skills, language training, short-term training and occupational training leading to certification from an accredited institution.
STARTFootnote 14 subsidizes the wages of individuals whom employers would not ordinarily hire. There is no maximum duration for the START program, however, previous evaluations noted that twelve months is the average duration of the program. The incentives paid to the employer are primarily for wages, mandatory employer-related costs and training costs.Footnote 15
Job Creation Partnerships (JCP) support community-oriented projects that provide work experience to participants.
Self-Employment provides financial assistance and business planning advice to participants to help them start their own business.
Support measures
Employment Assistance Services (EAS) support individuals as they prepare to enter or re-enter the workforce or assist them to find a better job. Services can include job search services, career development and counselling, and resume writing assistance. These services are referred to as ‘light touch intervention' due to their very short duration. They can be provided on a one-on-one basis or in a group setting. A typical intervention lasts less than one day, but a participant may receive multiple short interventions over a few weeks. These services are generally provided in combination with more intensive employment benefit interventions.Footnote 16
The Sector Council ProgramFootnote 17 aims to support an industry-led approach to human resource development tailored to meet the labour market needs of industry sectors.
Research and Innovation initiatives seek to identify better ways of helping people prepare for, return to or keep employment, and be productive participants in the labour force.
Eligible participants covered in this study
The incremental impacts are estimated for active and former EI claimants:
- active claimants are participants who started an EBSM intervention while collecting EI benefits
- former claimants are participants who started an EBSM intervention up to 3 years after the end of their EI benefitsFootnote 18
Average EBSM share of funding and cost per Action Plan Equivalent
Table 1 provides an overview of the share of funding allocated to EBSMs and the average cost per Action Plan Equivalent for active claimants in Nova Scotia. It is noted that the average cost per participant is calculated based on the 2010 to 2012 data from the EI Monitoring and Assessment Reports. The 2010 to 2012 period corresponds with the cohort of participants selected for incremental impacts and cost-benefit analysis in the LMDA evaluation.
From the 2010 to 2012 time period to the 2020 to 2021 fiscal year, investments in SD decreased by 29 percentage points and those in Self-Employment decreased by 3 percentage points. The largest increases in funding are noted for EAS (+22 percentage points) and the Sector Council Program (+5 percentage points).
| Employment Benefits and Support Measures | Share of funding (2010 to 2012) | Share of funding (2020 to 2021) | Average cost – active claimants (2010 to 2012) | Average cost – former claimants (2010 to 2012) |
|---|---|---|---|---|
| Skills Development | 62% | 33% | $16,488 | $16,272 |
| Employment Assistance Services | 25% | 47% | $1,726 | $1,569 |
| Self-Employment | 9% | 6% | $18,429 | $18,917 |
| Job Creation Partnerships | 2% | 2% | $2,166 | $936 |
| START | 1% | 4% | $8,772 | $9,093 |
| Sector Council Program | 1% | 6% | n/a | n/a |
| Research and Innovation | 0% | 2% | n/a | n/a |
- Sources: EI Monitoring and Assessment Reports for fiscal years 2010 to 2011, 2011 to 2012 and 2020 to 2021.
Methodology
This section presents key aspects of the quantitative analyses carried out as part of the LMDA studies.
All quantitative analyses are based on administrative data from the EI Part I (EI claim data) and Part II (EBSM participation data). The EI Part I and II data are then linked to the T1 and T4 taxation files from the Canada Revenue Agency. Incremental impact and cost-benefit analyses are based on 100% of participants in Nova Scotia who began their EBSM participation in 2010 to 2012.
The 2010 to 2012 timeframe was selected in order to assess the impacts of EBSMs in the years following participation. Impacts were assessed over a period of at least 4 years after program completion up to the 2017 calendar year (most recent available information at the time of this evaluation).
Incremental impacts analysisFootnote 21
Program effectiveness is assessed by estimating incremental impacts from EBSM participation on participants’ labour market experience. That is, earnings from employment and self-employment, incidence of employment, use of EI, use of social assistance (SA), and dependence on government income supports after participation.
In Nova Scotia, incremental impacts were estimated for active and former EI claimant participants in SD and active EI claimant participants in EAS. Incremental impacts for START and JCP were not produced due to the small samples or due to the fact that the models used to estimate the incremental impacts did not balance. Having balanced models is an essential condition to ensure that participants and non-participants are similar.
The role of the incremental impact analysis is to isolate the effects of participation from other factors. In order to achieve this, the incremental impact analysis compares the labour market experience of participants before and after their participation with that of similar non-participants.
Figure 1 presents an example of incremental impact calculation.
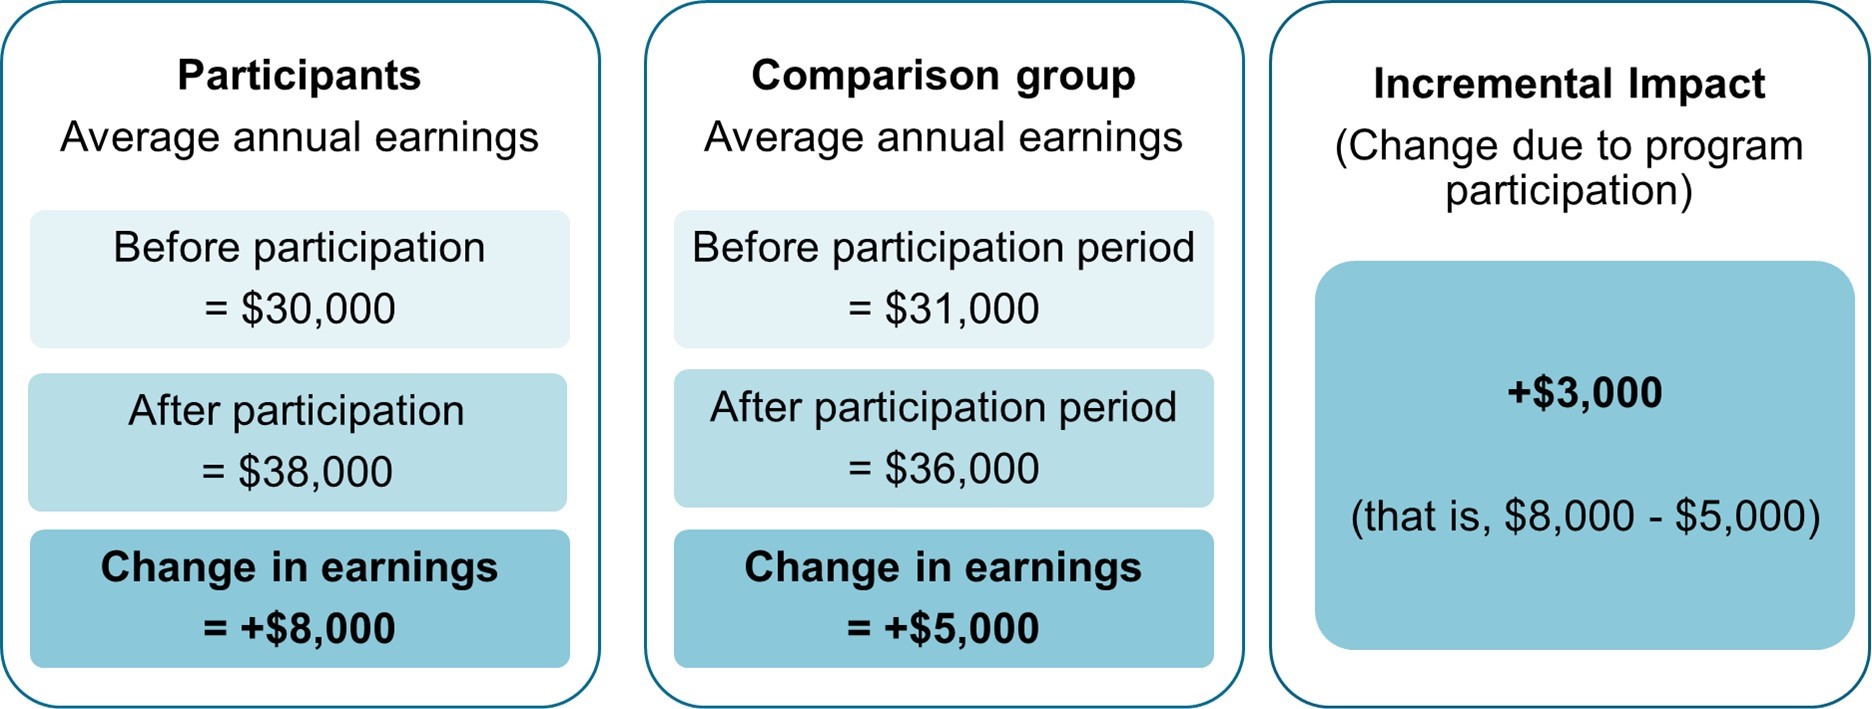
Text description Figure 1
Incremental impacts are the difference in the pre-post participation outcomes between participants and similar non-participants.
For example:
- if the average annual earnings of participants are $30,000 before participation and $38,000 after participation, the change in earning for participants is an increase of $8,000
- if the average annual earnings in the comparison group are $31,000 before participation and $36,000 after participation, the change in earnings for the comparison group is an increase of $5,000
- the incremental impact, that is the change attributed to program participation, is $8,000 minus $5,000, which equals an increase of $3,000
The main estimator used is propensity score kernel matching technique combined with difference-in-differences estimator. Moreover, 3 different state-of-the-art estimation techniques (Inverse Probability Weighting, Nearest Neighbour and Cross-sectional Matching) were carried out separately for each type of EBSMs and EI claimants in order to validate the impact estimates
As for previous LMDA evaluation studies, the Action Plan Equivalent is the unit of analysis used. Action Plan Equivalents regroup all EBSMs received by an individual within less than 6 months between the end of one EBSM and the start of the next. Action Plan Equivalents are categorized based on the longest EBSM they contain, except for EAS-only Action Plan Equivalents which include only EAS interventions.
The matching of participants and comparison group members used up to 75 socio-demographic and labour market variables observed over 5 years before participation. Two different comparison groups were used to measure impacts for active and former EI claimants:
- for active claimants, incremental impacts were measured relative to a comparison group of active claimants who were eligible to, but did not, participate in EBSMs during the reference period
- for former claimants, the comparison group was created using individuals who participated in EAS only during the reference period.Footnote 22 In other words, the experience of former claimants in SD interventions is compared to the experience of former claimants who received EAS only. This is a conservative approach given the fact that participation in EAS can lead to limited effects on labour market outcomes
Due to this difference in measurement, incremental impacts estimated for active claimant participants should not be directly compared to those of former claimant participants.
Impacts are generated over 4 years for SD, while a fifth year is estimated for participants in EAS.Footnote 23
Factors accounted for in the cost-benefit analysisFootnote 24,Footnote 25
Building on the results of the incremental impacts, program efficiency is assessed through a cost-benefit analysis. The analysis compares the participants’ cost of participating and the government's cost of delivering the program to the benefits associated with the program. Overall, this analysis provides insights on the extent to which the program is efficient for the society (that is, for both participants and the government).
Sources of data and information
The analysis takes into account all the quantifiable costs and benefits directly related to EBSM delivery and participation that can be measured given the information available. The analysis is comprehensive in that it accounts for the vast majority of possible direct costs and benefits.
However, the analysis does not account for all costs and benefits. For example, there are factors that can lead to an understatement of the benefits (for example, positive spillovers to other family members) and other factors that can lead to an overstatement of the benefits (for example, effects on skill prices or displacement).
This study relied on integrated data from the EI Part I and II Databank and Income Tax records from the Canada Revenue Agency. Information about earnings, use of EI, and use of social assistance was taken from the study of incremental impacts.Footnote 26 The program costs were calculated using information available in the EI Monitoring and Assessment Reports.
Relative to the previous cycle of evaluation, the methodology has been extended to incorporate one of the indirect health benefits associated with increased labour market attachment. In particular, the methodology includes an estimate of the change in public health care cost due to the decline in health care utilization resulting from program participation.
Data on average public healthcare costs by income quintiles are taken from the report Lifetime Distributional Effects of Publicly Financed Health Care in Canada (2013) by the Canadian Institute for Health Information.
Program costs are measured using information on LMDA expenditures and new interventions reported in the EI Monitoring and Assessment Report. Other costs and benefits are assessed using integrated administrative data from the EI Part I and II databank and the Canada Revenue Agency.
Incremental impacts measured over the second year of participation and up to 5 post-program years are discounted by 3% to bring them to a common base with the program cost and benefits incurred in the program start year. This 3% rate accounts for the interest the government could have collected if the funds used to pay for the program had been invested. Incremental impacts are estimated using 2010 constant dollars and this accounts for inflation.
Costs and benefits accounted for in the calculations
Program cost: cost incurred by the government for delivering the program (that is, administration and direct program costs calculated from data reported in the EI Monitoring and Assessment Reports).
Marginal social cost of public funds: loss incurred by society when raising additional revenues such as taxes to fund government spending. The value is estimated as 20% the program cost, sales taxes, income taxes, impacts on EI and impacts on SA paid or collected by the government.
Foregone earnings: estimated net impacts on participants’ earnings during the participation period. During labour market program participation, some individuals have lower earnings than what they would have received if they had not participated.
Employment earnings: incremental impacts on participants’ earnings during and after participation. In-program earnings represent the foregone earnings for participants.
Fringe benefits: the employer-paid health and life insurance as well as pension contributions. They are estimated at 15% of the incremental impacts on earnings.
Federal and provincial income taxes: incremental impacts on federal, provincial and territorial taxes paid by participants.
Sales taxes: the sales taxes paid by participants estimated as incremental impacts on earnings multiplied by the propensity to consume (97%), the proportion of household spending on taxable goods and services (52%) and the total average federal and provincial sales tax rate (11%).
Social assistance and Employment Insurance benefits collected: incremental impacts on SA and EI benefits use by participants following participation.
Canada Pension Plan contribution and EI premiums: these contributions and premiums were identified from the Canada Revenue Agency data and then, the incremental impacts on Canada Pension Plan contributions and EI premiums were estimated.
Public health care costs savings: estimated impact of participation in EBSMs on public health care costs shown as an average change per participant over the post-program period examined.
Strengths and limitations of the studies
One of the key strengths from the studies is that all quantitative analyses are based on administrative data rather than survey responses. Compared to survey data, administrative data are not subject to recall errors or response bias.
The propensity score models used to match participants and non-participants for the incremental impact analyses are judged to be robust. In part this is because they were based on 5 years of pre-participation data. Moreover, these models are based on a vast array of variables including sociodemographic characteristics, location, skill level related to last occupation, and indicators of labour market attachment.
However, the matching process can be further refined for specific subgroups if the following information is available in the future:
- persons with disabilities: the type and severity of the disability, and the capacity/willingness to work full-time
- recent immigrants: the country of origin, the proficiency in English or French, and the relevance of credentials and work experience
- visible minorities: place of birth; individuals who are born outside of Canada face different challenges compared to those born in Canada
Refining the matching process for population subgroups could broaden the scope for greater Gender-based Plus Analysis.
Sensitivity analysis and the use of alternative estimation methods have increased confidence in the incremental impact estimates. However, one limitation with the propensity score matching techniques is that no one can be fully sure the impacts are not influenced by factors not captured in the data.
The cost-benefit analysis accounted for all quantifiable costs and benefits directly attributable to the EBSMs and could be estimated with the available administrative data. It is furthered strengthened by incorporating one of the indirect benefits, which is the health benefits from program participation. However, the analysis did not account for non-quantifiable factors that can lead to an understatement of the benefits (for example, positive spillovers to other family members) and factors that can lead to an overstatement of the benefits (for example, effects on skill prices or displacement).
In some studies that use qualitative data collection methods, the number of key informants interviewed is relatively small. Responses provided by key informants reflect their own experience and their own region and may not be fully representative of the entire province.
Overview of the studies summarized in this report
The findings in this report are drawn from 8 separate studies carried out at the provincial level. These studies examine issues related to program effectiveness, efficiency, design/delivery and used a mix of qualitative and quantitative methods. Appendix A presents an overview of these studies. The studies are:
- Examination of the medium-term outcomes from 2010 to 2017
- Estimation of the medium-terms incremental impacts from 2010 to 2017
- Cost-benefit analysis of EBSMs in Nova Scotia
- Cost-Benefit Analysis: Incorporating Public Health Care Costs Savings in the Context of the Labour Market Programs Evaluation in Nova Scotia
- Design and delivery of the Job Creation Partnerships program in Nova Scotia
- Design and delivery of the Self-Employment program in Nova Scotia
- Design and delivery of the Sector Council Program in Nova Scotia
- Design and delivery of the Research and Innovation support measure in Nova Scotia
Evaluation findings
Profile of participants
Nearly 20,000 EI active and former claimants participated in LMDA programs and services between 2010 and 2012 in Nova Scotia. The profile of participants is presented in Table 2 by gender, age, sociodemographic group, and marital status. Information about their educational attainment, occupation and industry is based on the latest job they held prior to applying for EI benefits. Information about sociodemographic groups is self-reported.
| Categories | Active claimants | Former claimants |
|---|---|---|
| Number of participants | 12,720 | 7,375 |
| Gender: Female | 54% | 55% |
| Gender: Male | 46% | 45% |
| Age: 30 and under | 34% | 36% |
| Age: 31 to 54 | 57% | 54% |
| Age: 55 and over | 9% | 10% |
| Sociodemographic groups: Indigenous people | 3% | 5% |
| Sociodemographic groups: Persons with disabilities | 14% | 18% |
| Sociodemographic groups: Visible minorities | 4% | 6% |
| Sociodemographic groups: Recent immigrants | 1% | 1% |
| Marital status: Married or common-law | 34% | 30% |
| Marital status: Single | 49% | 53% |
| Marital status: Widow / divorced / separated | 14% | 14% |
| Education or skills level: High school or occupational training | 40% | 41% |
| Education or skills level: On-the-job training | 4% | 27% |
| Education or skills level: College, vocational education or apprenticeship training | 26% | 24% |
| Education or skills level: University degree | 5% | 4% |
- Note: Values may not equal 100% due to rounding or missing information.
Top 3 occupational groups for participants in Nova Scotia prior to participationFootnote 27
Active claimants:
- clerical personnel = 15%
- other manual workers = 13%
- intermediate sales and service personnel; semi-skilled manual workers = 12% each
Former claimants:
- clerical personnel = 16%
- intermediate sales and service personnel = 15%
- other manual workers = 14%
Top 3 industries for participants in Nova Scotia prior to participation
Active claimants:
- administrative and support, waste management and remediation services = 14%
- retail trade = 12%
- manufacturing = 11%
Former claimants:
- administrative and support, waste management and remediation services = 15%
- retail trade = 12%
- accommodation and food services = 11%
As presented in Table 3, in the year before program participation, former claimants have lower levels of employment and earnings than active claimants. Former claimants also have a higher dependence on SA.
| Pre-EBSM participation employment characteristics | Active claimants | Former claimants |
|---|---|---|
| Average employment earnings | $21,350 | $10,588 |
| Percentage employed | 99% | 82% |
| Percentage on SA | 5% | 18% |
Incremental impacts for active and former EI claimants
The incremental impact results presented below are generally consistent with those found as part of the second LMDA evaluation cycle.
Incidence of employment
Chart 1 presents the incremental impacts on the incidence of employment for active and former claimants by type of program.Footnote 28 The estimates can be interpreted as a change in the probability of being employed following participation.
Active claimants in SD and EAS increase their incidence of employment relative to similar non-participants. Former claimants in SD increase their incidence of employment relative to similar participants who receive only EAS.

- Note: Impacts are estimated over 4 post-program years for SD and 5 post-program years for EAS.
Text description - Chart 1
| Program name | Incidence of employment for active claimants (percentage points) | Incidence of employment for former claimants (percentage points) |
|---|---|---|
| Skills Development | 4.8 | 5.3 |
| Employment Assistance Services | 1.1 | n/a |
- Note: Impacts are estimated over 4 post-program years for SD and 5 post-program years for EAS.
Employment earnings
Chart 2 presents the average annual increase in employment earnings for active and former EI claimants in the post-participation period. Active EI claimants who participate in SD and EAS increase their annual employment earnings relative to similar non-participants.Footnote 29 Former EI claimants who participate in SD increase their employment earnings relative to similar participants who receive only EAS services.
- 1 While the annual average increase in employment earnings over the 5 post-program years is not statistically significant, EAS participants increased their employment earnings in years 3 and 4 post-program by $1,039** and $655* respectively.
- Note: Impacts are estimated over 4 post-program years (or 5 years in the case of EAS).
Text description - Chart 2
| Program name | Employment earnings for active claimants $) | Employment earnings for former claimants ($) |
|---|---|---|
| Skills Development | 3,739 | 2,307 |
| Employment Assistance Services | 3671 | n/a |
- 1 While the annual average increase in employment earnings over the 5 post-program years is not statistically significant, EAS participants increased their employment earnings in years 3 and 4 post-program by $1,039** and $655* respectively.
- Note: Impacts are estimated over 4 post-program years (or 5 years in the case of EAS).
Use of EI benefits
As shown in Chart 3, active claimants in SD and EAS reduce their use of EI benefits in the post-program period compared to similar non-participants. In the post-program period, former claimants in SD increase their EI benefits use relative to similar participants who receive EAS services only.
In the case of SD former claimants, the increase in the use of EI is consistent with previous evaluations and is not necessarily a negative impact. Following participation, former claimants are likely to requalify for EI benefits due to their stronger labour market attachment demonstrated by increases in employment and earnings.

- Note: Impacts are estimated over 4 post-program years for SD and 5 post-program years for EAS.
Text description - Chart 3
| Program name | Use of EI benefits for active claimants ($) | Use of EI benefits for former claimants ($) |
|---|---|---|
| Skills Development | -$319 | $323 |
| Employment Assistance Services | -$608 | n/a |
- Note: Impacts are estimated over 4 post-program years for SD and 5 post-program years for EAS.
Use of SA benefits
As shown in Chart 4, active and former EI claimants who participate in SD decrease their use of SA benefits in the post-program period.
Active EI claimants in EAS increase their use of SA benefits compared to similar non-participants.

- Note: Impacts are estimated over 4 post-program years for SD and 5 post-program years for EAS.
Text description - Chart 4
| Program name | Use of SA benefits for active claimants ($) | Use of SA benefits for former claimants ($) |
|---|---|---|
| Skills Development | -$57 | -$227 |
| Employment Assistance Services | $61 | n/a |
- Note: Impacts are estimated over 4 post-program years for SD and 5 post-program years for EAS.
Dependence on income support
As shown in Chart 5, active EI claimants in SD and EAS, as well as former claimants in SD reduce their overall level of dependence on income support (combined EI and SA benefits). The estimates can be interpreted as a change in the probability of receiving EI or SA benefits following participation.
- Note: Impacts are estimated over 4 post-program years for SD and 5 post-program years for EAS.
Text description - Chart 5
| Program name | Dependence on government income supports for active claimants (percentage points) | Dependence on government income supports for former claimants (percentage points) |
|---|---|---|
| Skills Development | -2.9 | -2.3 |
| Employment Assistance Services | -1.8 | n/a |
- Note: Impacts are estimated over 4 post-program years for SD and 5 post-program years for EAS.
Incremental impacts by subgroups of participants
Female participants
Nearly 10,900 EI active and former claimant participants in LMDA programs and services, between 2010 and 2012 are female, representing nearly 54% of participants.
The profile of female participants is presented in Table 4 by age, sociodemographic group, and marital status. Information about their educational attainment, occupation and industry is based on the latest job they held prior to applying for EI Part 1 benefits. Information about sociodemographic groups is self-reported.
| Categories | Active claimants | Former claimants |
|---|---|---|
| Number of participants | 6,847 | 4,068 |
| Age: 30 and under | 34% | 36% |
| Age: 31 to 54 | 58% | 54% |
| Age: 55 and over | 8% | 10% |
| Sociodemographic group: Indigenous people | 3% | 4% |
| Sociodemographic group: Persons with disabilities | 14% | 17% |
| Sociodemographic group: Visible minority | 3% | 5% |
| Sociodemographic group: Recent immigrants | 1% | 1% |
| Marital status: Married or common-law | 34% | 31% |
| Marital status: Single | 47% | 49% |
| Marital status: Widow / divorced / separated | 17% | 17% |
| Education or skills level: High school or occupational training | 46% | 48% |
| Education or skills level: On-the-job training | 19% | 21% |
| Education or skills level: College, vocational education or apprenticeship training | 22% | 21% |
| Education or skills level: University degree | 5% | 4% |
- Note: Values may not equal 100% due to rounding or missing information.
Top 3 occupational groups for female participants prior to participationFootnote 30
Active claimants:
- clerical personnel = 22%
- intermediate sales and service personnel = 18%
- other sales and service professionals = 12%
Former claimants:
- clerical personnel; intermediate sales and service personnel = 22% each
- other sales and service professionals = 15%
- other Manual Workers = 6%
Top 3 industries for female participants prior to participationFootnote 31
Active claimants:
- administrative and support, waste management and remediation services = 15%
- retail trade = 14%
- accommodation and food services = 13%
Former claimants:
- administrative and support, waste management and remediation services = 16%
- retail trade; accommodation and food services = 14% each
- health care and social assistance = 11%
Main findings
Female active and former EI claimant participants in SD, as well as female active claimants in EAS, improve their labour market attachment through increases in their incidence of employment and employment earnings. Female participants also decrease their dependence on government income supports (that is, the combined use of EI and SA benefits).
Table 5 presents the detailed incremental impacts.
For example, the results reveal that female active claimants in EAS only have higher annual earnings (+$646 per year) and incidence of employment (+2.8 percentage points). They also lower their reliance on government income supports (-1.2 percentage points), mainly due to their lesser use of EI benefits (-$314 per year).
Female former claimants in SD have higher annual earnings (+$1,611) and incidence of employment (+ 6.4 percentage points). They also have a lower reliance on government income supports (-3.6 percentage points), mainly due to their lesser use of SA benefits (-$239 per year).
| Variable | Skills Development active claimants | Skills Development former claimants | Employment Assistance Services active claimants |
|---|---|---|---|
| Incidence of employment (percentage points) | 5.8*** | 6.4*** | 2.8*** |
| Employment earnings ($) | 3,146*** | 1,611*** | 646** |
| EI benefits ($) | -394*** | 102 | -314*** |
| SA benefits ($) | -98** | -239*** | 39 |
| Dependence on income support (percentage points) | -3.5*** | -3.6*** | -1.2*** |
| n= | 2,250 | 923 | 4,333 |
- Statistical significance level *** 1%; ** 5%; * 10%, other values are not statistically significant.
- Note: Impacts are estimated over 4 post-program years for SD and 5 post-program years for EAS.
Male participants
Nearly 9,200 EI active and former claimant participants in LMDA programs and services between 2010 and 2012 are male, representing nearly 46% of participants.
The profile of male participants is presented in Table 6 by age, sociodemographic group, and marital status. Information about their educational attainment, occupation and industry is based on the latest job they held prior to applying for EI Part 1 benefits. Information about sociodemographic groups is self-reported.
| Categories | Active claimants | Former claimants |
|---|---|---|
| Number of participants | 5,873 | 3,307 |
| Age: 30 and under | 35% | 35% |
| Age: 31 to 54 | 55% | 54% |
| Age: 55 and over | 10% | 10% |
| Sociodemographic group: Indigenous people | 4% | 5% |
| Sociodemographic group: Persons with disabilities | 14% | 19% |
| Sociodemographic group: Visible minorities | 4% | 5% |
| Sociodemographic group: Recent immigrants | 1% | 1% |
| Marital status: Married/Common-law | 35% | 27% |
| Marital status: Single | 52% | 58% |
| Marital status: Widow / divorced / separated | 10% | 10% |
| Education or skills level: High school or occupational training | 33% | 31% |
| Education or skills level: On-the-job training | 29% | 33% |
| Education or skills level: College, vocational education or apprenticeship training | 30% | 29% |
| Education or skills level: University degree | 3% | 3% |
- Note: Values may not equal 100% due to rounding or missing information.
Top 3 occupational groups for male participants prior to participation
Active claimants:
- other manual workers = 22%
- semi-skilled manual workers = 20%
- skilled crafts and trades = 16%
Former claimants:
- other manual workers = 24%
- semi-skilled manual workers = 17%
- skilled crafts and trades = 15%
Top 3 industries for male participants prior to participationFootnote 32
Active claimants:
- construction = 17%
- manufacturing = 15%
- administrative and support, waste management and remediation services = 13%
Former claimants:
- construction = 18%
- manufacturing; administrative and support, waste management and remediation services = 14% each
- retail trade = 9%
Main findings
Male active EI claimants who participate in SD and EAS improve their labour market attachment mainly through increases in their employment earnings. They also decrease their dependence on government income support (that is, the combined use of EI and SA benefits).
Male former claimants who participate in SD increase their labour market attachment compared to similar male participants who receive EAS services only. They increase their use of EI benefits but decrease their use of SA benefits.
Table 7 presents the detailed incremental impacts.
For example, the results reveal that male former claimants in SD have higher annual earnings (+$2,999 per year) and annual incidence of employment (+4.3 percentage points). While the impact on the combined use of EI and SA is not statistically significant (-0.9 percentage point), male participants reduce their use of SA benefits (-$255 per year). They do, however, increase their use of EI benefits by an annual average of +$463.
While the annual average for employment earnings is not statistically significant, male active claimants in EAS increase their employment earnings in years in years 3 and 4 post-program by +$1,418 and +$1,376 respectively. They also have a lower income support reliance rate (-1.8 percentage points), mainly due to their lesser use of EI benefits (-$742 per year).
| Variable | Skills Development active claimants | Skills Development former claimants | Employment Assistance Services active claimantsFootnote 33 |
|---|---|---|---|
| Incidence of employment (percentage points) | 1.8* | 4.3** | 0.2 |
| Employment earnings ($) | 5,030*** | 2,999** | 521 |
| EI benefits ($) | -520*** | 463** | -742*** |
| SA benefits ($) | -27 | -255*** | 90*** |
| Dependence on income support (percentage points) | -2.6*** | -0.9 | -1.8*** |
| n= | 1,797 | 567 | 3,831 |
- Statistical significance level *** 1%; ** 5%; * 10%, other values are not statistically significant.
- Note: Impacts are estimated over 4 post-program years for SD and 5 post-program years for EAS.
Youth participants
Nearly 7,000 EI active and former claimant participants, between 2010 and 2012, were 30 years of age or younger when they began their program participation in Nova Scotia, representing about 35% of participants.
The profile of youth participants is presented in Table 8 by gender, sociodemographic group, and marital status. Information about their educational attainment, occupation and industry are based on the latest job they held prior to applying for EI benefits. Information about sociodemographic groups is self-reported.
| Categories | Active claimants | Former claimants |
|---|---|---|
| Number of participants | 4,360 | 2,628 |
| Gender: Female | 53% | 55% |
| Gender: Male | 47% | 45% |
| Sociodemographic group: Indigenous people | 4% | 4% |
| Sociodemographic group: Persons with disabilities | 12% | 15% |
| Sociodemographic group: Visible minorities | 3% | 5% |
| Sociodemographic group: Recent immigrants | <1% | 1% |
| Marital status: Married or common-law | 17% | 16% |
| Marital status: Single | 78% | 78% |
| Marital status: Widow / divorced / separated | 3% | 3% |
| Education or skills level: High school or occupational training | 40% | 42% |
| Education or skills level: On-the-job training | 29% | 31% |
| Education or skills level: College, vocational education or apprenticeship training | 23% | 22% |
| Education or skills level: University degree | 4% | 3% |
- Note: Values may not equal 100% due to rounding or missing information.
Top 3 occupational groups for youth participants prior to participationFootnote 34
Active claimants:
- other manual workers = 18%
- clerical personnel = 17%
- intermediate sales and service personnel = 13%
Former claimants:
- clerical personnel = 18%
- other manual workers; intermediate sales and service personnel = 16% each
- other sales and service professionals = 15%
Top 3 industries for youth participants prior to participationFootnote 35
Active claimants:
- administrative and support, waste management and remediation services = 16%
- retail trade = 12%
- accommodation and food services = 11%
Former claimants:
- administrative and support, waste management and remediation services = 19%
- retail trade; accommodation and food services = 13% each
- construction = 10%
Main findings
Youth active claimants in SD improve their labour market attachment through increases in their employment earnings and incidence of employment. They also decrease their dependence on government income supports, mainly due to decreases in the use of EI benefits.
Mixed and not statistically significant results are found for youth former EI claimants who participate in SD and youth active claimants who participate in EAS.
Table 9 presents the detailed incremental impacts.
For example, the results reveal that relative to similar youth non-participants, active claimants who participate in SD have higher annual earnings (+$1,963 per year) and incidence of employment (+3 percentage points). They also have a lower income support reliance rate (-2 percentage points).
| Variable | Skills Development active claimants | Skills Development former claimants | Employment Assistance Services active claimants |
|---|---|---|---|
| Incidence of employment (percentage points) | 3*** | 2.3 | 1.1 |
| Employment earnings ($) | 1,963*** | -27 | 391 |
| EI benefits ($) | -370*** | 148 | -433*** |
| SA benefits ($) | -13 | -153* | 96*** |
| Dependence on income support (percentage points) | -2*** | -1.9 | -0.8 |
| n= | 1,720 | 687 | 2,466 |
- Statistical significance level *** 1%; ** 5%; * 10%, other values are not statistically significant.
- Note: Impacts are estimated over 4 post-program years for SD and 5 post-program years for EAS.
Older worker participantsFootnote 36
Nearly 1,850 EI active and former claimant participants, between 2010 and 2012, were 55 years of age or older when they began their program, representing nearly 10% of participants.
The profile of older worker participants is presented in Table 10 by gender, sociodemographic group, and marital status. Information about their educational attainment, occupation and industry are based on the latest job they held prior to applying for EI benefits. Information about sociodemographic groups is self-reported.
| Categories | Active claimants | Former claimants |
|---|---|---|
| Number of participants | 1,124 | 724 |
| Gender: Female | 50% | 54% |
| Gender: Male | 50% | 46% |
| Sociodemographic group: Indigenous people | 2% | 3% |
| Sociodemographic group: Persons with disabilities | 15% | 21% |
| Sociodemographic group: Visible minorities | 3% | 5% |
| Sociodemographic group: Recent immigrants | <1% | <1% |
| Marital status: Married or common-law | 52% | 47% |
| Marital status: Single | 21% | 24% |
| Marital status: Widow / divorced / separated | 26% | 26% |
| Education or skills level: High school or occupational training | 39% | 41% |
| Education or skills level: On-the-job training | 21% | 23% |
| Education or skills level: College, vocational education or apprenticeship training | 29% | 24% |
| Education or skills level: University degree | 5% | 5% |
- Note: Values may not equal 100% due to rounding or missing information.
Top 3 occupational groups for older worker participants prior to participationFootnote 37
Active claimants:
- clerical personnel; semi-skilled manual workers; intermediate sales and service personnel = 13% each
- skilled crafts and trades workers; other sales and service personnel = 11% each
- other manual workers = 10%
Former claimants:
- clerical personnel; intermediate sales and service personnel = 15% each
- other sales and service personnel; other manual workers = 12% each
- semi-skilled manual workers = 11%
Top 3 industries for older workers participants prior to participationFootnote 38
Active claimants:
- manufacturing; administrative and support, waste management and remediation services = 13% each
- retail trade = 11%
- construction = 9%
Former claimants:
- administrative and support, waste management and remediation services = 13%
- manufacturing; retail trade; health care and social assistance = 10% each
- construction = 9%
Main findings
Older workers who participate in EAS improve their labour market attachment through increases in incidence of employment (+9.2 percentage points annually) and employment earnings (+$2,681 annually). While the estimate on the dependence on income support is not statistically significant, older worker participants increase their use of SA benefits (+$108 annually).
| Variable | Employment Assistance Services active claimants |
|---|---|
| Incidence of employment (percentage points) | 9.2*** |
| Employment earnings ($) | 2,681*** |
| EI benefits ($) | -258 |
| SA benefits ($) | 108** |
| Dependence on income support (percentage points) | 0.2 |
| n= | 899 |
- Statistical significance level *** 1%; ** 5%; * 10%, other values are not statistically significant.
- Note: Impacts are estimated over 4 post-program years for SD and 5 post-program years for EAS.
Cost-benefit analysis
This analysis is based on the EBSM medium-term incremental impacts previously described in this report. Costs and benefits are examined over the participation period of 1 or 2 years and 5 or 10 years after the end of participation.Footnote 39
The cost-benefit analysis addresses the following questions:
- Are the benefits from EBSMs exceeding the costs within 5 years (for EAS) or 10 years (for SD), after the end of participation?
- How much is the benefit for the government and society if the government spends $1 in EI part II funding?
- How many years does it take the benefits to recover the costs?
The cost-benefit results were generated separately for active and former EI claimants and for each EBSM. However, cost-benefit analysis was not conducted for:
- active or former claimants who participate in START or JCP as the incremental impacts were not produced due to low numbers of participants
- former claimants who participate in EAS since they are used as a comparison group to estimate the incremental impacts for former claimants who participated in SD
The following results are presented from the social perspective, that is, the government and individual combined. This allows for a sound assessment of program effectiveness in achieving its objectives of helping unemployed individuals to obtain and maintain employment and to generate EI savings.
Table 12 presents the cost-benefit results for active and former EI claimant participants.
| Indicator | Skills Development active claimants (10 years post-program) | Employment Assistance Services active claimants (5 years post-program) | Skills Development former claimants (10 years post-program) |
|---|---|---|---|
| Net present value | $9,152 | -$3,416 | $1,047 |
| Benefit cost ratio | $1.56 | -$0.98 | $1.06 |
| Payback period (years after end of participation) | 7.8 | 12.6 | 9.7 |
| Social return | 56% | -198% | 6% |
| Savings to public health care | $311 | <$10 | $212 |
The information below provides examples of the net present value, the benefit-cost ratio, the payback period, the social rate of return and savings to health care costs.
Skills Development (SD)Footnote 40
During the 2010 to 2012 period, SD represents 62% of EBSM expenditures under the LMDAs in Nova Scotia. The average duration of an SD Action Plan Equivalent is 68 weeks for active claimants and 69 weeks for former claimants.
As shown in Table 12, over the 10-year post-program period the benefit for active claimants is +$9,152 higher than the costs, yielding a social return of 56% on investment. This means that if the government spends $1 on SD for active EI claimants, it generates +$1.56 of benefit for society. It takes 7.8 years for the benefits to recover the costs of programming. Overall, there is a savings to health care costs of $311 per participant.
The benefit for former claimants is +$1,047 higher than the costs, yielding a social return of 6% over the 10-year post-program period. This means that if the government spends $1 on programming, it generates $1.06 of gain for society. From a social perspective it takes 9.7 years of society to recover the costs of SD for former EI claimant participants. Overall, there is a savings to health care costs of $212 per participant.
Employment Assistance Services (EAS)
EAS includes a variety of services such as computer access for job search services, group sessions to prepare for an interview, career counselling, and action plan development. The administrative data, however, do not allow to identify what proportion of EAS interventions belong to each category or the intensity of services offered to participants.
While EAS are often provided with other EBSMs, this analysis examined only participants who received one or more EAS without participating in other EBSMs. EAS represents 25% of total EBSM expenditures between 2010 and 2012 in Nova Scotia.
The average length of an EAS-only Action Plan Equivalent is 18 weeks compared to between 68 weeks for active EI claimant participants in SD.
As shown in Table 12, over the 5-year post-program period the benefits for active claimants in EAS is -$3,416 lower than the costs, yielding a social return on investment of -198%. This means that if the government spends $1 on EAS for active claimants, it generates a -$0.98 loss for society.
Five years after participation the benefits are negative. Participants’ earning gains, which start in the second-year post-program, and do not compensate for the loss experienced during EAS participation and in the first year after participation. Assuming that the average benefits measured from the second to the fifth post-program year are maintained over time, it takes 12.6 years after participation for the benefits to recover the costs.
No savings to health care costs are found.
Overall, the goal of EAS is not to help participants acquire more skills, therefore, increasing participants’ earnings after participation is not necessarily expected. Conducting a cost-benefit analysis for EAS is a challenge as it is not possible to attribute a dollar figure to the return to employment. However, including earnings in the cost-benefit calculation is still very relevant since it captures partially the positive impact of the quicker return to work.
Outcomes for active and former EI claimantsFootnote 41
Incremental impacts for START and JCP are not produced due to small samples, or the models used to estimate the incremental impacts not balancing. Having balanced models is an essential condition to ensure that participants and non-participants are similar. However, outcomes can still be examined for participants in order to describe the average changes that occur from before to after program participation.
The labour market outcomes are based on individuals who began their participation during the 2010 to 2012 period. Statistics focus on 5 years before and 4 years after participation.
START participant outcomes
Approximately 575 active and former EI claimant participants, between 2010 and 2012, participated in the START program.
Active claimants
As shown in Chart 6, START participants increase their average earnings from $17,282 in the fifth year pre-program to $21,965 in the fourth year after participation.

Text description - Chart 6
| Year in pre-post participation period | Average earnings for active claimant participants |
|---|---|
| 5 years pre-program | $17,282 |
| 4 years pre-program | $18,002 |
| 3 years pre-program | $17,704 |
| 2 years pre-program | $18,697 |
| 1 year pre-program | $19,508 |
| Program start year | $12,765 |
| Second year of participation | $16,932 |
| 1 year post-program | $19,862 |
| 2 years post-program | $22,103 |
| 3 years post-program | $21,744 |
| 4 years post-program | $21,965 |
The proportion of employed participants declines from 95% in the program start year, but remains around 86% on average during the post-program period. The proportion of participants on EI Part I decreases from 99% in the program start year to 32% in the fourth year after participation. Participants decrease their dependence on income support from 54% in the program start year to 15% in the fourth year after participation.
Former claimants
As shown in Chart 7, former EI claimant participants in START increase their average earnings from $14,876 in the fifth year pre-program to $19,099 in the fourth year after participation.

Text description - Chart 7
| Year in pre-post participation period | Average earnings for former claimant participants |
|---|---|
| 5 years pre-program | $14,876 |
| 4 years pre-program | $16,905 |
| 3 years pre-program | $16,329 |
| 2 years pre-program | $15,226 |
| 1 year pre-program | $10,881 |
| Program start year | $11,222 |
| Second year of participation | $17,924 |
| 1 year post-program | $18,433 |
| 2 years post-program | $19,985 |
| 3 years post-program | $20,648 |
| 4 years post-program | $19,099 |
The proportion of employed participants declines from 87% in the program start year, but remains on average around 83% in the post-program period. The proportion of participants on EI Part I decreases from 70% in the program start year to 37% in the fourth year after the participation. Participants decreased their dependence on income support from 39% in the program start year to 19% in the fourth year after participation.
Job Creation Partnerships participants
Approximately 340 active and former EI claimant participants, between 2010 and 2012, participated in JCP.
Active claimants
As shown in Chart 8, JCP active EI claimant participants increase their average earnings from $12,469 in the fifth year pre-program to $20,225 in the fourth year after participation.
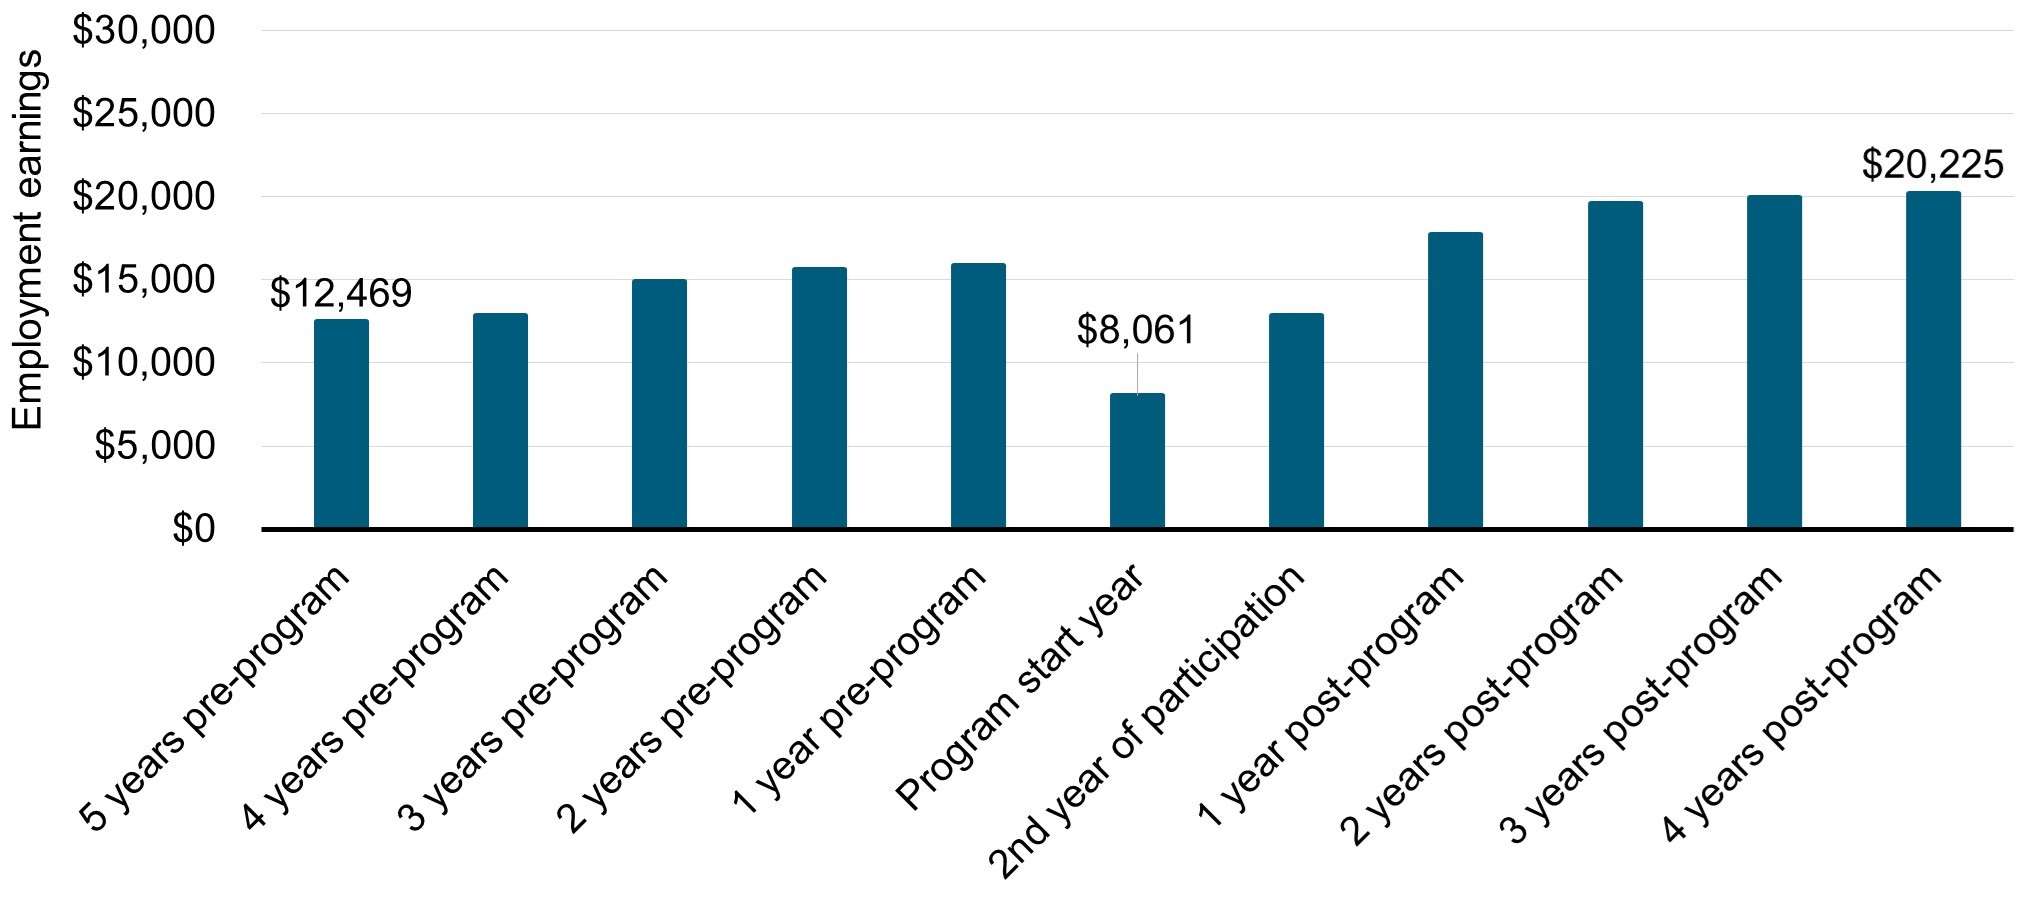
Text description - Chart 8
| Year in pre-post participation period | Average earnings for active claimant participants |
|---|---|
| 5 years pre-program | $12,469 |
| 4 years pre-program | $12,827 |
| 3 years pre-program | $14,919 |
| 2 years pre-program | $15,599 |
| 1 year pre-program | $15,861 |
| Program start year | $8,061 |
| Second year of participation | $12,882 |
| 1 year post-program | $17,750 |
| 2 years post-program | $19,569 |
| 3 years post-program | $19,941 |
| 4 years post-program | $20,225 |
The proportion of employed participants increases from 86% in the program start year, remaining on average around 87% in the post-program period. The proportion of participants on EI Part I decreases from 100% in the program start year to 38% in the fourth year after participation. Participants decrease their dependence on income support from 63% in the program start year to 17% in the fourth year after participation.
Former claimants
As shown in Chart 9, JCP former EI claimant participants increase their average earnings from $13,325 in the fifth year pre-program to $19,202 in the fourth year after participation.
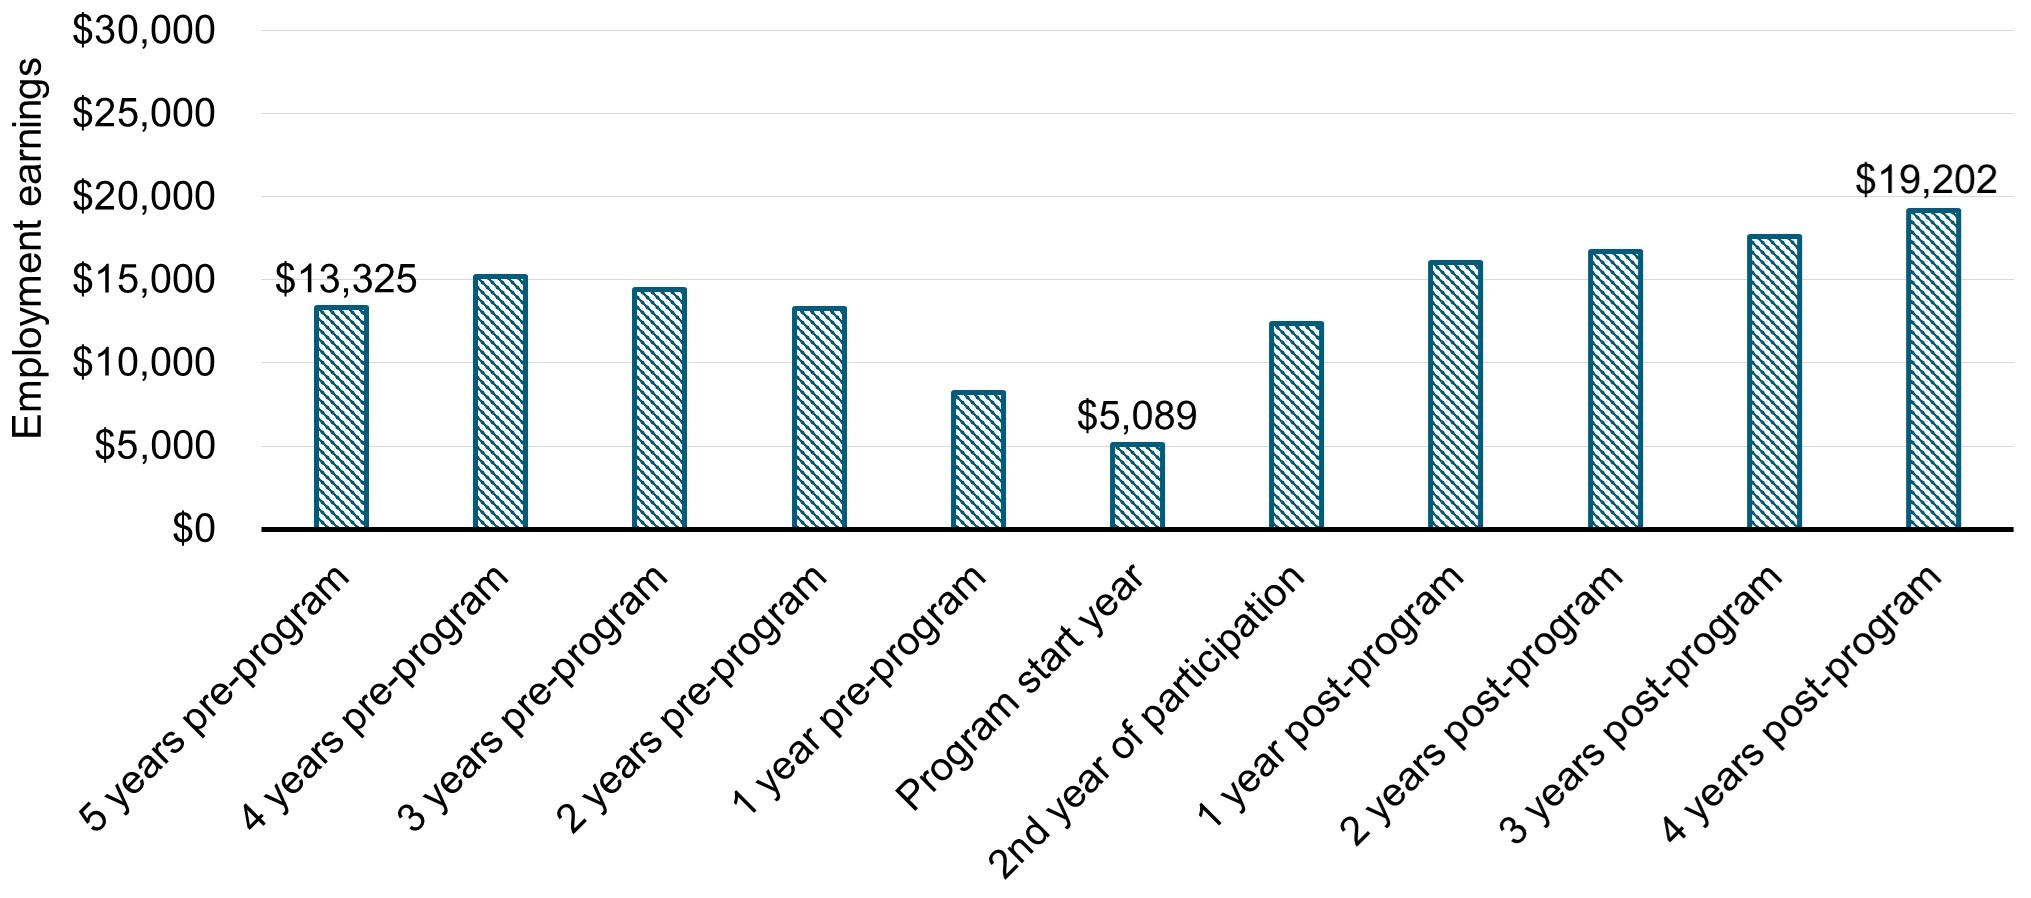
Text description - Chart 9
| Year in pre-post participation period | Average earnings for former claimant participants |
|---|---|
| 5 years pre-program | $13,325 |
| 4 years pre-program | $15,232 |
| 3 years pre-program | $14,429 |
| 2 years pre-program | $13,287 |
| 1 year pre-program | $8,238 |
| Program start year | $5,089 |
| Second year of participation | $12,354 |
| 1 year post-program | $16,053 |
| 2 years post-program | $16,712 |
| 3 years post-program | $17,602 |
| 4 years post-program | $19,202 |
The proportion of employed participants increases from 64% in the program start year to an average of 77% during the post-program period. The proportion of participants on EI Part I decreases from 52% in the program start year to 32% in the fourth year after participation. Participants decreased their dependence on income support from 46% in the program start year to 25% in the fourth year after participation.
Supplemental studies
Self-EmploymentFootnote 42
Program design and delivery
The following is a summary of guidelines from Nova Scotia. Key informants did confirm and complement the information found in program guidelines.
The Self-Employment program aims to assist participants in creating employment for themselves by providing them with a range of services including:
- assistance with business plan development
- counselling, coaching and mentoring
- entrepreneurial training and workshops
Eligible individuals must be unemployed and thinking about starting a new business to create a job for themselves. Nova Scotia has the flexibility to design and deliver the program to meet its labour market needs. In fall 2018, the program was delivered through third-party organizations, including:
- businesses
- federal or provincial crown corporations
- not-for-profit organizations
- municipal governments
- bands/tribal councils
- public health and educational institutions
Nova Scotia allocates between 7% and 8% of its LMDA funding to the Self-Employment program between fiscal year 2013 to 2014 and fiscal year 2018 to 2019. While spending on the Self-Employment program tends to decrease in Canada, it remains stable in Nova Scotia.
The application process is structured and aimed to ensure that participants are suited for self-employment, have a viable business idea and the financial resources to launch a business.
Participants’ employment outcomes
The following is a summary of labour market outcomes and satisfaction rates from a survey of Self-Employment participants in Nova Scotia completed in winter 2020.Footnote 43 A total of 413 individuals responded to the survey with a 57% response rate.Footnote 44
Self-Employment participants increase their employment level by 15 percentage points from 58% in the year before participating to 73% at the time of survey (that is 2 to 4 years after program participation). The increase is mainly due to an increase in the percentage of self-employed participants.
Type of businesses created, survival rates and success factors
Nearly 45% of survey respondents launched a self-employment business and it was still in operation in winter 2020 (2 to 4 years following program participation). Among the 289 respondents who started a business, 62% of them were still operating their business at 2 to 4 years post-program. Another 3% sold their business, but it was still operational. Thirty percent (30%) of respondents were unable to maintain the operation of the business they started as part of the program.
The business survival rate is consistent with a 2018 Statistics Canada study that found that less than half of unincorporated self-employed individuals continued operations for more than 2 years.Footnote 45
Sixty percent (60%) of self-employment businesses were launched in other services;Footnote 46 professional, scientific and technical services; as well as in construction and retail trade.
Regarding factors influencing the success or failure of self-employment businesses:
- participants who started a business and were still in operation at the time of survey attributed their business success to:
- their dedication, hard work and positive attitude
- the high demand for their services or products
- the quality of service provided
- their own abilities, experience, knowledge and skills
- their network and business contacts
- participants who started a business but were forced to close it attributed the closure to:
- poor sales and low revenues
- small market
- finding another job
- participants who did not launch a business attributed this to:
- the level of uncertainty and risk involved
- the lack of funding
- workload, work life balance, and underestimating the required commitment
Earning outcomes and reliance on income support
Survey respondents were not comfortable answering questions that related to their earnings. This situation made it difficult to compare the pre- and post-earnings of Self-Employment participants.
Overall, there appears to be an increase in the number of participants reporting less than $10,000 in earnings annually. However, survey respondents, who are able to maintain the operation of their business, are more likely to report earning more or the same as before participating in the program.
As a complement to the earning questions, survey respondents did assess their financial well-being. When considering their entire financial situation:
- 70% of respondents said that they are financially about the same or better off after the program
- 68% of respondents said that their household net worth is about the same or higher after the program
In line with survey findings, key informants state that immediate increases in earnings are not necessarily an expected outcome of the program.
Regarding the reliance on government income support, participants reduce reliance on the use of EI and SA following program participation.
Satisfaction with services received and current employment
A high percentage of respondents who started a self-employment business report that they are equally or more satisfied with their job situation after program participation. Those who are able to maintain the operation of their business are 22 percentage points more likely to report being more satisfied, compared to those whose business closed (72% compared to 50%).
The survey did examine the contribution of the program to the success of self-employment businesses. At least 79% of survey respondents who launched a self-employment business rate the following services and training as very or somewhat important to the business launch, operation and success:
- one-on-one mentoring / advice or counselling supports
- assistance with business plan development/assessment
- living allowance during participation and financial assistance with business start-up costs
- discussion on risks and challenges of self-employment
- assessment of entrepreneurial readiness
- information about and assistance to access capital
- training on budgeting, financial management, marketing, business operation and sales
Challenges and lessons learned related to program design and delivery
The following is based on key informant interviews with program managers, career practitioners and service providers.
Key informants identify the following challenges related to program design and delivery, including the need to:
- fill in gaps in program guidelines and policy documents to support service delivery
- examine the level and flexibility of financial support available to program participants and service providers
- simplify the approval process
Best practices related to program design and delivery included:
- having a rigorous screening and selection process of program participants
- having knowledgeable and experienced service providers and government staff
- having service providers who can offer loans to participants
- using specialists to deliver tailored training
- having regular follow-up with participants
Key considerations for Self-Employment program and policy development
The following considerations for program and policy development emerged as part of the study.
The Self-Employment program can benefit from an updated objective specifying that it is dedicated to eligible participants who have a viable business idea, the financial or in-kind resources to launch a business, and the required level of dedication.
The data collection process should include only participants who have been deemed suitable for self-employment and accepted into the program. This will require excluding candidates who attended information sessions alone or those deemed not suited for self-employment. The latter participants can be reported under EAS.
Indicators of program success can include: increase in employment and/or self-employment levels; medium-term increase in earnings; business survival rate similar to the local economy and/or the sector; and acquisition of transferable skills.
Nova Scotia may wish to consult with its service delivery network on the extent to which identified challenges are applicable to their unique context, and how best to address them along with integrating lessons learned that can benefit program delivery.
Job Creation PartnershipsFootnote 47
The following is a summary of guidelines in Nova Scotia for JCP in the years 2018 and 2019. Key informants did confirm and complement the information found in program guidelines.
Program objective
The JCP program in Nova Scotia is designed to support projects that will provide eligible participants with opportunities to gain work experience and to improve their employment prospects. While project activities should benefit both the participant and the community, the focus of JCP is to assist participants in acquiring work experience, leading to the acquisition of new employment-related skills or the improvement in current skills.
JCP is delivered through the provision of funds to an organization that implements a community-benefiting project while providing work experience to participants.
Participants receive benefits from EI Part I or II.Footnote 48 Benefits to participants follow the prevailing wage rate, up to the maximum EI weekly benefit rate. Participants may receive an additional wage top up from the sponsor/employer.
Program delivery
The design and delivery of JCP allows Nova Scotia to address a variety of barriers to employment experienced by its residents (for example, lack of work experience). JCP is not generally used to address labour market issues experienced by economic sectors or local communities.
Program managers reported that the amount allocated to JCP is influenced by previous funding levels. They specified that flexibility exists to increase funding in order to meet labour market needs. There are indications that the use of JCP may decrease due to the removal of some eligible expenses and the introduction of the more generous START program.
In addition to gaining work experience, key informants identified a variety of other benefits that can be expected from JCP projects. Participants are expected to develop soft and work-related skills, and to enhance their job search abilities, career development and prospects, and personal well-being.
Sponsors can benefit from JCP through increased capacity by having access to labour, implementing their projects, and increasing their services to local communities. At the community level, JCP projects can support the local economy by providing new information and assets (for example, festivals, gardens, collecting and documenting sector-specific data) as well as improved services.
Challenges and lessons learned
Key informants identify challenges related to the recruitment of participants and organizations.
Key informants identify the following elements as contributing factors to participants’ success.
Recurring projects are a good practice. As well, projects with a 12-month duration can provide a credible work experience to participants.
In terms of monitoring, having regular contact with JCP participants, on-site monitoring and providing support to JCP sponsors are important considerations.
Participants who benefit the most from JCP are those in need of work experience and networking opportunities.
Well established not-for-profit organizations, that used JCP previously, are most likely to succeed as JCP sponsors. They have the capacity to manage funding and to provide support to participants.
Projects found to be best suited under JCP are those that are well defined, incremental to the work of the sponsor and focused on community development. Examples include projects associated with festivals or fundraising events.
Key considerations for JCP program and policy development
The following consideration emerged as part of the JCP study.
Compared to other Employment Benefits offered under the Canada-Nova Scotia LMDA, JCP is a less attractive program and is the least used. The program could benefit from increased promotion and changes to make it more attractive to organizations and job seekers.
On average, JCP accounted for approximately 1.5% of total LMDA expenditure between fiscal years 2012 to 2013 and 2017 to 2018. Awareness and interest in the program were a challenge, despite its positive outcomes. Key informants reported the lack of promotion to potential organizations and identified the lack of interest by organizations and job seekers as challenges. Recruitment of participants may be affected by the low level of financial support available to them compared to other programs.
Sector Council ProgramFootnote 49
The Sector Council Program aims to support an industry-led approach to human resource development tailored to meet the labour market needs of industry sectors. It includes a wide range of funded activities, such as:
- human resource planning including:
- creation and dissemination of labour market information specific to an industry
- consultation on labour market challenges and opportunities
- development and implementation of human resource strategies/plans and tools
- identification and dissemination of promising practices
- identification of industry training needs
- informing educational curriculum
- attraction and retention activities including:
- creation and dissemination of career resources (for example, brochures, videos; virtual reality career exploration tool)
- creation and dissemination of promotional material and messaging for the sector as a valid employment destination
- participation in/hosting events to promote sector career opportunities (trade shows, career fairs, career presentations in schools)
- promotion of the value of skills development
- activities that support welcoming workplaces
- development of training curriculum and other learning resources
With $11.5 million in fiscal year 2019 to 2020, the Sector Council Program represents nearly 11% of total expenditure under the Canada-Nova Scotia Labour Market Development Agreement. In 2020 to 2021, Nova Scotia spent approximately $5.5 million on the Sector Council Program, which represented about 6% of Nova Scotia’s total LMDA funding.
Funded organizations
Funded organizations include non-profits sector councils.
Targeted labour market issues
Sector Council Program projects target skills and/or labour shortages. These projects also target specific unemployed populations (for example, women and youth).
Generally, funded projects target labour market issues associated with:
- lack of capacity for human resource planning resulting in attraction and retention challenges for sectors
- shortages of sector specific labour market information
- technology changes
- demographical changes (for example, aging population and rural out migration)
- skills development challenges/training gaps to fill in-demand jobs
- seasonal nature of employment
All projects reviewed align with Sector Council Program objectives and eligible activities.
Partnerships
The Department of Labour and Advanced Education and all key informants confirm that program officials carry out activities to support the formation and maintenance of partnerships as a part of the program design and delivery.
According to the Department, partner’s contributions are beneficial, but not required for the achievement of the project expected outcomes. All key informants stress the importance of partnerships for projects’ success explaining that partnerships increase the reach and impact of the program, allow project holders to learn about sector needs and contribute to the project delivery.
Through questionnaire, document review and key informants it was found that:
- partnerships are established to support the delivery of all projects
- partners make a financial and/or in-kind contribution. The most common forms of in-kind contribution are office/event space and usage of equipment
- project activities delivered with the support of partners include:
- consultation on labour market challenges and opportunities
- human resource plan development
- human resource tools development
- career awareness tools and material development
- career awareness events
- labour market and human resource research and training development
Challenges and lessons learned
The Department of Labour and Advanced Education and program officials identified challenges related to program administration and monitoring, such as staff turnover.
Actions of program officials and project characteristics that were identified as being conducive to the success of the program include:
- project holders being well established organisations, knowledgeable of the sector and having the capacity to deliver the project
- projects grounded in industry needs and/or having good labour market data for evidence-based decisions
- ongoing communication and trusted relationship between project holders and program officials
- program officials working with sector councils to increase their knowledge, expertise in strategic workforce planning, capacity and the provision of strategic guidance leveraging the strengths of other partners
- providing with opportunities and supporting capacity development to build the partnerships as partners enable the project success
- being nimble and knowing when to make slight adjustments in the project to meet overall objectives
Key considerations for the Sector Council Program
The following considerations for program and policy development emerged as part of this study.
Considering that the current performance indicators do not reflect the diversity of activities funded under Sector Council, it is important for ESDC and Nova Scotia to discuss current funded activities in order to make recommendations on how best to report on results.
It is essential to share lessons learned about successful Sector Council Program projects. Particularly, for projects targeted to employers (such as workplace or employer-sponsored training), and those assisting communities and economic sectors dealing with labour market adjustment issues (contraction or expansion).
Research and Innovation
Research and Innovation projects aim to identify better ways of helping participants prepare for, return to, or keep employment and to be productive in the labour force. Activities funded under Research and Innovation are designed to further develop existing programming or to develop new programming that will either compliment or replace existing programming.
Nova Scotia uses Research and Innovation funding annually. During the period of fiscal years 2016 to 2017 and 2019 to 2020, funding ranges from less than 1% ($267,000) to 4% ($3,822,000) of the province’s annual LMDA funding.
Funded organizations
Funded organizations include not-for-profit organizations, educational institutions and intergovernmental bodies.
Funded Research and Innovation activities
Research and Innovation projects encompassed a variety of activities including:
- conducting a survey of skills in literacy, numeracy and problem solving in technology rich environments among adults between ages of 16 to 65 in Nova Scotia
- developing a centre for digital learning to provide best practices and supports for post-secondary institutions offering online education
- using the Phoenix Employment Program designed to provide under-supported unemployed or under-employed youth (aged 18 to 29) with an innovative approach to addressing unique barriers to employment
Innovation definition and criteria
When assessing an activity for eligibility for Research and Innovation, achieving the desired outcomes and increased efficiency are the 2 highest weighted factors.
Performance measurement
Agreement holders are required to submit both activity and financial reports either throughout the project or prior to completion of the project.
Challenges and lessons learned
Project documents and program officials identified challenges related to testing and identification of innovative approaches including:
- short timelines for projects
- project staff inability to coordinate with employers
- challenges experienced by project participants such as mental health issues
In relation to factors contributing to successful testing and identification of innovative approaches, program officials highlighted the importance of:
- employing experienced staff who have experience in previously administering the program
- providing additional support to participants for issues outside of the program scope such as benefits, housing, childcare and literacy
- integrating databases to provide program officials with an environment to collaborate, discuss and disseminate ideas
- conducting monthly check-ins with employers
- providing flexibility to wage subsidies
- employers attending education and training sessions
Skills Development-Apprentices
The objective of the program is to help apprentices become skilled tradespeople and to increase their labour market attachment. Program participants have generally chosen a career and are already attached to the labour market. The apprenticeship process involves on-the-job learning and technical training in a classroom setting.
Apprentices who have worked enough hours to qualify for EI can apply to receive EI Part I benefits while on training. The program provides financial assistance to EI eligible apprentices to help them offset the costs they incur while they attend technical training. The level of funding is based on the needs of apprentices, the location of the training, and any fees paid by the apprentices.Footnote 50
The profile of program participants is presented in Table 13 by gender, age, sociodemographic group, and marital status. Information about their educational attainment, occupation and industry is based on the latest job they held prior to applying for EI benefits. Information about sociodemographic groups is self-reported.
| Categories | Active claimants | Former claimants |
|---|---|---|
| Number of participants | 886 | 860 |
| Gender: Female | 4% | 5% |
| Gender: Male | 96% | 95% |
| Age: 30 and under | 71% | 72% |
| Age: 31 to 54 | 29% | 27% |
| Age: 55 and over | 1% | 1% |
| Sociodemographic group: Indigenous people | 5% | 3% |
| Sociodemographic group: Persons with disabilities | 3% | 3% |
| Sociodemographic group: Visible minorities | 3% | 4% |
| Sociodemographic group: Recent immigrants | <1% | <1% |
| Marital status: Married or common-law | 30% | 34% |
| Marital status: Single | 65% | 61% |
| Marital status: Widow / divorced / separated | 3% | 3% |
| Education or skills level: High school or occupational training | 3% | 5% |
| Education or skills level: On-the-job training | 6% | 11% |
| Education or skills level: College, vocational education or apprenticeship training | 90% | 83% |
| Education or skills level: University degree | <1% | <1% |
- Note: Values may not equal 100% due to rounding or missing information.
Top 3 occupation groups for participants in SD-Apprentices
Active claimants:
- skilled crafts and trades workers = 85%
- other manual workers = 5%
- skilled sales and service personnel = 3%
Former claimants:
- skilled crafts and trades workers = 76%
- other manual workers = 8%
- skilled sales and service personnel = 4%
Top 3 industries for participants in SD-Apprentices
Active claimants:
- construction = 51%
- manufacturing = 16%
- retail trade = 9%
Former claimants:
- construction = 43%
- manufacturing = 14%
- retail trade = 10%
Labour market outcomes
The labour market outcomes are based on individuals who began their participation during the 2010 to 2012 period. Statistics focus on 5 years before program participation and 5 years after the program start year.
Active claimants
As shown in Chart 10, program participants increase their average earnings from $17,445 in the fifth year pre-program to $52,140 in the fifth year after the program start year.

Text description - Chart 10
| Year in pre-post participation period | Employment earnings |
|---|---|
| 5 years pre-program | $17,445 |
| 4 years pre-program | $19,926 |
| 3 years pre-program | $21,362 |
| 2 years pre-program | $24,918 |
| 1 year pre-program | $29,536 |
| Program start year | $29,775 |
| 1 year post-program | $42,059 |
| 2 years post-program | $49,391 |
| 3 years post-program | $52,397 |
| 4 years post-program | $52,228 |
| 5 years post-program | $52,140 |
The proportion of employed participants declines slightly after the program start year but remains around 96% for the annual post-program average. The proportion of participants on EI Part I decreases from 100% in the program start year to 40% in the fifth year after the program start year. Participants decrease their dependence on income support from 29% in the program start year to 8% in the fifth year after participation.
Former claimants
As shown in Chart 11, program participants increase their average earnings from $17,851 in the fifth year pre-program to $55,907 in the fifth year after the program start year.
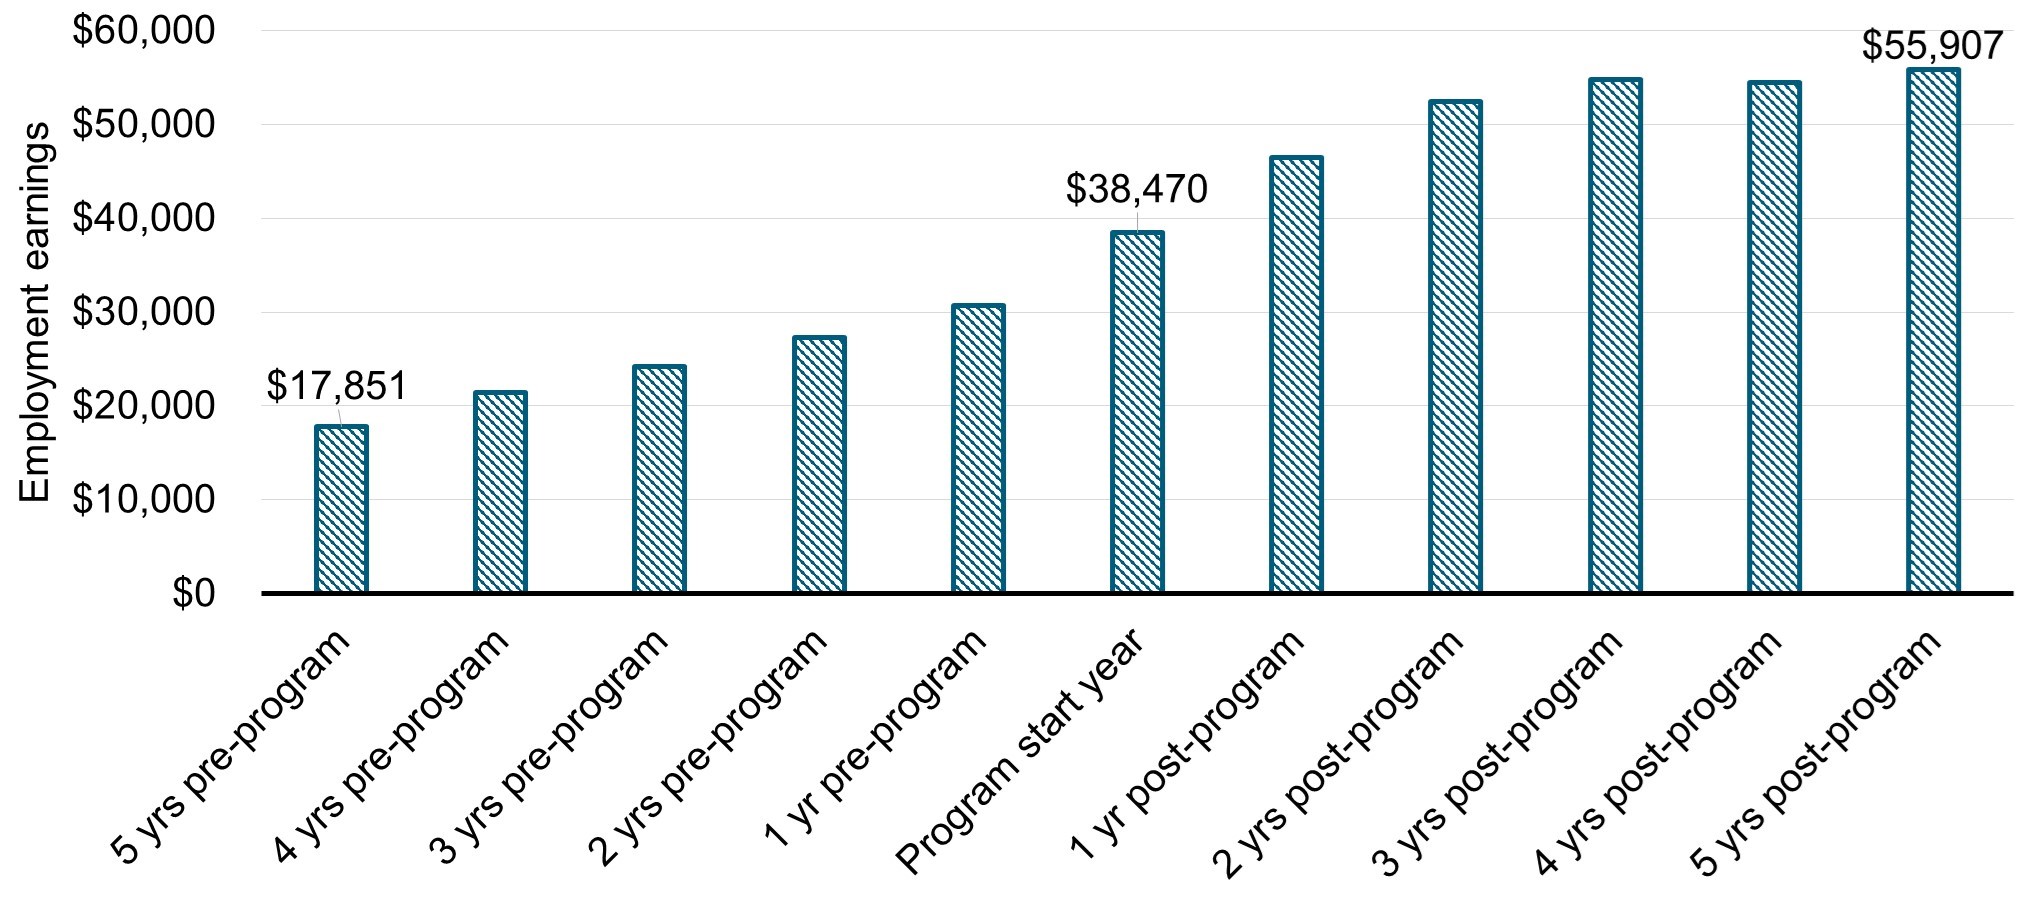
Text description - Chart 11
| Year in pre-post participation period | Employment earnings |
|---|---|
| 5 years pre-program | $17,851 |
| 4 years pre-program | $21,422 |
| 3 years pre-program | $24,163 |
| 2 years pre-program | $27,257 |
| 1 year pre-program | $30,693 |
| Program start year | $38,470 |
| 1 year post-program | $46,484 |
| 2 years post-program | $52,486 |
| 3 years post-program | $54,833 |
| 4 years post-program | $54,525 |
| 5 years post-program | $55,907 |
The proportion of employed participants declines by 1 percentage point annually after the program start year but remains around 96%. The proportion of participants on EI Part I decreases from 77% in the program start year to 29% in the fifth year after the program start year. Participants decrease their dependence on income support from 12% in the program start year to 6% in the fifth year after participation.
Conclusions and recommendations
The Canada-Nova Scotia LMDA is the largest annual investment in active labour market programs and services in the province. Based on the findings presented in this report, the EBSMs are meeting the objective of assisting individuals to obtain or keep employment through various active employment programs, including training or employment assistance services.
Summary of findings
Overall, incremental impacts demonstrate that active and former EI claimants in SD and active claimants in EAS improve their labour market attachment. These participants also reduce their dependence on government income supports compared to similar non-participants. With some exceptions, SD and EAS also improves the labour market attachment and reduces the dependence on income support for most subgroups of participants. As well, the social benefits of participating in EBSMs exceeds the costs of investments over time.
Incremental impacts are not produced for START and JCP due to small samples or the models used to estimate the incremental impacts not balancing. Outcomes for both active and former claimant participants in START and JCP show increases in employment earnings from 5 years before program participation to 4 years after. As well, decreases are found in receipt of EI benefits and dependence on government income supports after participation.
A series of supplemental studies address information gaps previously identified in LMDA evaluations for Self-Employment, JCP, the Sector Council Program and Research and Innovation. Each study identified lessons learned, best practices and challenges, and issued when relevant considerations for policy design and development. Overall, it was found that:
- the Self-Employment program helps carefully selected participants to create employment for themselves by providing them with a range of services
- the focus of JCP is to assist participants in acquiring work experience, leading to the acquisition of new employment-related skills or the improvement in current skills
- after participating in SD, apprentices increase their employment earnings and decrease their dependence on government income supports
- Nova Scotia uses the Sector Council Program to support an industry-led approach to human resource development tailored to meet the labour market needs of industry sectors
- activities funded under Research and Innovation are designed to further develop existing programming or to develop new programming that will either compliment or replace existing programming
Recommendations
Since 2012, 15 qualitative and quantitative evaluation studies have been used to address issues and questions related to EBSM design, delivery and effectiveness:
- the quantitative studies successfully assessed the effectiveness and efficiency of EBSMs by producing incremental impacts and cost-benefit analysis
- the qualitative studies identified specific challenges, lessons learned, and best practices associated with the design and delivery of EBSMs. Each study included key considerations for program and policy development or recommendations
The recently completed evaluation of the Workforce Development Agreements complements the LMDA qualitative studies. This evaluation was also supported by literature reviews and provided unique insights into challenges and lessons learned to assist persons with disabilities, immigrants and those further removed from the labour market.
Most results from this evaluation stem from the conduct of advance causal analysis whereby impacts found could be attributed to a specific EBSM. These analyses are predicated on having access to high quality administrative records, thereby confirming the importance of the capacity to leverage and integrate relevant administrative data.
From these main findings, 2 key recommendations for Nova Scotia emerge:
Recommendation #1: Nova Scotia is encouraged to share and discuss lessons learned, best practices and challenges associated with the design and delivery of programs and services. Discussions are encouraged with ESDC, at the bilateral or multilateral levels, as well as with service delivery network if necessary.
Recommendation #2: Nova Scotia is encouraged to pursue efforts to maintain and strengthen data collection provisions in support of reporting, performance measurement and data-driven evaluations at the national and provincial levels.
References
Allin, S., Corscadden, L., Gapanenko, K., and Grignon, M. Lifetime Distributional Effects of Publicly Financed Health Care in Canada. CIHI, 2013.
Athey, S., and Imbens, G. Machine Learning Methods Economists Should Know About. Annual Review of Economics, 2019.
Douwere G. and Huju Liu. The Entry into and Exit out of Self-employment and Business Ownership in Canada. Statistics Canada, 2018.
Employment and Social Development Canada. Cost-Benefit Analysis: Incorporating Public Health Care Costs Savings in the Context of the Labour Market Programs Evaluation. Internal document, 2022.
Employment and Social Development Canada. Cycle II of the Evaluation of the Labour Market Development Agreements: Cost-Benefit Analysis of Employment Benefits and Support Measures. Internal document, 2015.
Employment and Social Development Canada. Design and delivery of the Job Creation Partnerships program in Nova Scotia. Internal report, 2019.
Employment and Social Development Canada. Employment Insurance Monitoring and Assessment Reports. 2011 to 2022.
Employment and Social Development Canada. Evaluation of the Labour Market Development Agreements, Design and delivery of the Self-Employment program in Nova Scotia. Internal report, 2021.
Employment and Social Development Canada. Horizontal evaluation of the Labour Market Development Agreements, Design and delivery of the Labour Market Partnerships program. Internal document, 2021.
Employment and Social Development Canada. Labour Market Development Agreements Process for Determination of Similarity. Internal document, 2012.
Employment and Social Development Canada. Technical Report on the Analysis of Employment Benefits and Support Measures (EBSMs) Profile, Outcomes and Medium-Term Incremental Impacts from 2010 to 2017. Internal report, 2021.
Employment and Social Development Canada. Third Cycle for the Horizontal Evaluation of the Labour Market Development Agreements: Quantitative Methodology Report. Internal document, 2019.
Lechner, M. Modified Causal Forests for Estimating Heterogeneous Causal Effects. 2019.
Appendix A. List of 8 studies included in the Canada-Nova Scotia synthesis report
This report includes findings from 8 studies:
- Examination of medium-term outcomes from 2010 to 2017
- Evidence generated: profile of active and former EI claimants; outcomes by claimant type and by subgroup
- Methods: before and after results of program participation
- Reference period: 2010 to 2012 participants
- Observation period: up to 12 years (5 years before participation, 1 to 2 years of participation, and 4 to 5 years after participation
- Estimation of medium-term incremental impacts from 2010 to 2017
- Evidence generated: incremental impacts for active and former EI claimants; incremental impacts by subgroup; profile and socio-demographic characteristics of participants
- Methods: non-experimental method using propensity score matching in combination with difference-in-differences; statistical profiling
- Reference period: 2010 to 2012 participants
- Observation period: up to 7 years (1 to 2 years in program, and up to 5 years after participation)
- Cost-Benefit Analysis of Employment Benefits and Support Measures in Nova Scotia
- Evidence generated: cost-benefit analysis
- Methods: non-experimental method using propensity score matching in combination with difference-in-differences; cost-benefit analysis
- Reference period: 2010 to 2012 participants
- Observation period: 5 years post-program for EAS and 10 years post-program for SD
- Cost-Benefit Analysis: Incorporating Public Health Care Costs Savings in the Context of the Labour Market Programs Evaluation in Nova Scotia
- Evidence generated: cost-benefit analysis
- Methods: estimation of adjusted annualized healthcare costs
- Reference period: 2010 to 2012 participants
- Observation period: 5 years post-program for EAS and 10 years post-program for SD
- Design and delivery of the Job Creation Partnerships program in Nova Scotia
- Evidence generated: program design and delivery; challenges and lessons learned
- Methods: non-experimental approach (from cycle II); statistical analysis; document review;14 semi-structured telephone interviews with 20 key informants
- Reference period: 2015 to 2017 participants
- Observation period: 2015 to 2019
- Design and delivery of the Self-Employment program in Nova Scotia
- Evidence generated: program design, delivery and success; define outcomes attributed to the program; fill in knowledge gaps; challenges and lessons learned
- Methods: document review; statistical analysis of administrative data; Canadian self-employment literature and statistics; 11 semi-structured telephone interviews with 17 key informants; survey of Self-Employment participants in the province
- Reference period: 2015 to 2017 participants
- Observation period: 2015 to 2020
- Design and delivery of the Sector Council Program in Nova Scotia
- Evidence generated: program design and delivery; challenges and lessons learned
- Methods: document review; questionnaire completed by the province; <10 key informant interviews
- Reference period: 2018 to 2020
- Observation period: design and delivery at the time of the data collection
- Design and delivery of the Research and Innovation Support measure in Nova Scotia
- Evidence generated: program design and delivery; challenges and lessons learned
- Methods: document review; questionnaire completed by the province
- Reference period: 2017 to 2020
- Observation period: design and delivery at the time of the data collection