
Evaluation of the Sectoral Initiatives Program
From: Employment and Social Development Canada
On this page
- Executive summary
- Management response
- Introduction
- Program description
- Evaluation scope and methodology
- Relevance: Addressing the need for skilled labour
- Measuring performance
- Performance: Establishing the context for success
- Performance: Contributions to outcomes
- Observations on efficiency and economy
- Conclusions
- Recommendations and considerations
- Appendix A – Sectoral Initiatives Program logic model (2016)
- Appendix B – Evaluation scope, methodology, and limitations
- Appendix C – Data on estimated beneficiaries
Alternate formats

Evaluation of the Sectoral Initiatives Program [PDF - 1.02 MB]
Large print, braille, MP3 (audio), e-text and DAISY formats are available on demand by ordering online or calling 1 800 O-Canada (1-800-622-6232). If you use a teletypewriter (TTY), call 1-800-926-9105.
Executive summary
The Sectoral Initiatives Program (referenced hereafter as “the Program”) was designed to improve the availability and use of products that help labour market stakeholders identify and address emerging labour market issues in their sectors, including:
- skills requirements;
- skills mismatches; and
- labour shortages.
The Program funds sector-based projects implemented by funding recipient organizations. Since the Program’s launch in April 2013, it has provided an average of approximately $20 million in contribution funds per fiscal year. The funded projects are national in scope and target 1 or more key sectors of the Canadian economy.
The Program’s mandate is to help sectors identify and develop solutions to address the human resources and labour market needs of their sector. Contributions are provided to funding recipients, who are expected to work with sectoral stakeholders to produce sector-specific labour market information, national occupational standards, skills certification, and training program accreditation products. The products can be used individually or as a continuum to help end-users (for example, employers, job seekers, and learning institutions) understand the sector’s labour market needs and to adjust human resources planning and activities accordingly.
Projects undertaken using Program contributions include, among others:
- A project in the forest products sector that produced a sector-specific online labour market information database, labour market forecasts, and job matching service.
- A project in the food and beverage manufacturing sector that produced new and updated national occupational standards and supporting tools to move toward a sector-based certification framework.
- A project in the advanced manufacturing sector that piloted a certification program to prepare students for employment in the sector using elements of work-integrated learning and partnerships with employers.
An evaluation approach was developed in late 2015 and presented to the former Departmental Evaluation Committee in February 2016. Key issues examined include:
- The continued need for the Program among target groups.
- The Program’s alignment with federal priorities and provincial initiatives.
- Efforts to measure Program and project performance.
- Stakeholder engagement.
- Product dissemination and timeliness.
- Contributions toward Program outcomes such as awareness and use of products, skills recognition and employability, and addressing sectoral labour market issues.
- Observations on efforts to deliver the Program in a cost efficient manner.
In accordance with the Financial Administration Act, an evaluation of the Program was required to be completed by April 2018. The evaluation covered all 64 active projects from the time the Program launched in April 2013 to the end of the evaluation period in March 2017. The scope includes 27 projects inherited from the Program’s predecessor, the Sector Council Program. This approach allowed the evaluation to consider more completed sector-based projects and to gather more data on contributions to the sectors and on outcomes.
It is important to note that the Program is designed to work through third parties and does not collect individual-level data on the labour market outcomes of individual beneficiaries. The evaluation therefore assessed the Program’s support for horizontal coordination of efforts to identify and address sectoral labour market issues and its contributions to systemic changes in the ways sectors address emerging skills gaps and labour shortages. Furthermore, the program is 1 of many interventions designed to help improve labour market efficiency and reduce skills gaps. Subsequently, the evaluation’s analysis focuses on contributions to outcomes rather than on causal attributions.
Similarly, the Program is not structured to collect information through a Gender-Based Analysis Plus (GBA+) lens for the years covered by the evaluation. However, a few instances where identity factors played a role in the Program were observed. For example, 3 projects took a cross-sectoral approach that focused on a target population, Indigenous workers and job seekers, rather than a specific sector. The projects prepared and disseminated products to assist Indigenous workers and job seekers in finding nearby employment opportunities and in positioning themselves as candidates for these jobs.
Key findings
Alignment with priorities and needs
The Program is aligned with the priorities and strategic outcomes of the Government of Canada and Employment and Social Development Canada. The Program aligns with the Minister of Employment, Workforce Development and Labour’s Mandate Letter, which tasks the Minister with ensuring “Canadians get the skills they need for good quality jobs … by working with provinces, territories, municipalities, Indigenous Peoples, the post-secondary education system, employers and labour to strengthen our training systems to build the human capital that Canadians and employers need.” At the level of individual projects, 55 of the 64 included in the evaluation were in a sector mentioned at least once in the Budget or Speech from the Throne between 2011 and 2017.
The Program and its projects respond to sectors’ specific needs to help reduce skills gaps and facilitate the connection between employers and potential employees. Funding recipients noted how the projects are designed to respond to needs and challenges in their respective sectors. Those needs include labour shortages, aging workforces, skills needs, and new technology and evolving job requirements. The Program also fills a niche for sector-specific, national-level labour market information, national occupational standards, certification, and accreditation products.
Measuring performance
The Program is collecting performance data with a particular emphasis on outcomes. The Program monitors and measures progress toward its goals using standard grants and contributions monitoring reports, supplemented with an annual survey of funding recipients designed and implemented by the Program. The annual survey of funding recipients provides performance data that are tailored to the Program’s internal and corporate reporting needs. However, the evaluation found potential areas for improvement related to reporting burden, survey design, and data quality.
Stakeholder engagement and product dissemination
Generally, all projects have had high levels of stakeholder engagement from various groups in different ways. Stakeholder engagement was found to be an important part of product development and distribution. It helps ensure that the products reflected the needs and realities of the sectors. Stakeholders were involved in all projects, with the most commonly reported stakeholders being employers and employer associations. For example, funding recipients reported that between April 2015 and March 2016, their projects engaged with a total of 10,630 employers, 697 employer organizations, and 487 learning institutions. Stakeholders often assisted funding recipients with sharing and promoting the products to end-user beneficiaries in the sectors (e.g., employers, employees, students, job seekers, etc.).
Funding recipients and their stakeholders are completing dissemination activities. Key informants reported that products are reaching many intended end-user beneficiaries. Those aware of the products find them useful and timely. For example, funding recipients reported that 34,000 to 147,000 beneficiaries received labour market information each year between April 2013 and March 2016. While some projects were able to engage employees and job seekers in the development and testing of the tools, other projects found it more difficult to include these groups, suggesting they may not be as aware of the products or using them to their fullest potential.
Output completion and contributions to outcomes
The evaluation observed that projects are completing products as planned. For example, data collected directly from funding recipients via the fiscal year 2015 to 2016 edition of the Program’s annual survey of funding recipients indicated that funding recipients had completed or updated the following products:
- 126 labour market information reports;
- 40 labour market information forecasts and forecasting systems;
- 150 national occupational standards;
- 57 certification streams; and
- 12 accreditation programs.
Some evidence was collected for the evaluation that indicated products are being used and are contributing to systemic change in the labour market activities of some sectoral stakeholders. However, the evaluation found there is still room for continued growth in product use and contributions to systemic change in sectoral labour markets.
In 1 example of use and systemic change, national occupational standards developed for the truck transportation sector were used as the foundation for 1 province’s new mandatory entry-level truck driver training.
In the mining sector, products funded by the project were reported by key informants to be:
- improving the sector’s ability to attract and retain workers;
- assisting with workforce management;
- helping to balance labour supply and demand;
- strengthening linkages between employers and educational institutions;
- helping to align messaging around employment; and
- supporting decision-making by employers and training institutions.
Projects in the environmental sector helped to formalize the skills of students and employees through an updated and streamlined certification program. The funding recipient reported an increase of 1,375 certifications and strengthened support for certification renewal resulting from a project that focused on certification and accreditation. They reported that 105 of 158 applicants for the project’s new Sustainability certification were successful. In addition, 110 interns received their certification, which is expected to facilitate their transition from school to entry-level jobs in the sector. This aligns with the direction of the sector, which is reflected in the stronger preference by employers for employment candidates holding a certification. Shortly after the certification and accreditation project ended in April 2014, the funding recipient calculated that 40% of the jobs on their sector-specific job board specify a preference for candidates with certifications.
Observations on efficiency and economy
The Program design and activities demonstrate stewardship over contributions funds. For example, the Program negotiated reduced project budgets prior to project approval and instituted a 5% leveraging requirement for all projects. The Program has less than one half of the budget of its predecessor, the Sector Council Program, but products continue to be completed.
Recommendations
Recommendation #1: Explore ways to encourage funding recipients to strengthen product outreach and dissemination.
Recommendation #2: Explore ways to improve performance measurement and increase data validity while minimizing the burden on funding recipients.
Management response
Introduction
The Skills and Employment Branch and the Program Operations Branch would like to thank the Evaluation Directorate and all parties involved in conducting the 2018 evaluation of the Sectoral Initiatives Program (“the Program”) and, in particular, would like to acknowledge the contribution of all stakeholders, key informants, and program officials consulted.
Launched in 2013, the Sectoral Initiatives Program is a grants and contributions program with a mandate to help Canada’s key economic sectors identify, forecast, and address their human resources and skills issues. Through its partnership-based projects, the Program aims to address current and future skills shortages by supporting the development and distribution of sector specific labour market intelligence, national occupational standards, and skills certification and accreditation systems in key sectors.
The findings from this evaluation indicate that the Program responds to sectors’ needs for products to help reduce skills gaps, and helps to connect the supply and demand sides of the labour market. A strong indication of the buy-in from stakeholders is their willingness to contribute resources to Program-funded projects. In fiscal year 2015 to 2016 alone, projects levered $13.8M of contributions from other sources, which was over 50% of the Program’s contributions that year.
Management agrees with evaluation recommendations that the Program seek improvements to product outreach and dissemination, as well as enhancements in reporting mechanisms. These recommendations align with the Management’s recent emphasis towards improving the efficiency of the evaluation of projects, Program reach, and performance measurement.
Recommendations and planned follow-up actions
Recommendation #1: Explore ways to encourage funding recipients to strengthen product outreach and dissemination.
Management agrees with the recommendation to encourage funding recipients to strengthen product outreach and dissemination, and will continue to pursue broader take-up of information and tools developed through projects. As such, Management will continue to seek stronger links to the supply side of the labour market, both as project stakeholders and end users.
This greater engagement is already underway. The fall 2017 Program call for proposals strongly encouraged that supply-side groups, such as labour unions and associations, be represented in proposal submissions. Short-listed proposals are currently being negotiated, and Program officials are ensuring that these include strong communications and dissemination plans. Officials will also ensure that adequate time and resources are allocated to dissemination, and that information and tools developed by projects are available and useful to a range of users, including employees, job seekers and students.
This recommendation also aligns with the Program’s broader efforts to establish a dissemination strategy. Through this strategy, Program officials will provide ongoing guidance to funding recipients throughout projects to promote broader dissemination through industry networks and encourage greater collaboration between stakeholders. Program officials will also facilitate greater dissemination through Departmental channels, such as Job Bank and other labour market information platforms.
Recommendation #2: Explore ways to improve performance measurement and increase data validity while minimizing the burden on funding recipients.
Management agrees with the recommendation to review its reporting mechanisms, and will continue to pursue ways to improve the collection and validation of program results. The evaluation recognizes that measuring the long-term impact of Program investments on individual Canadians is inherently difficult given that products are developed and distributed by third party organizations and are designed to induce broad systemic changes. The Program collects results through regular project monitoring of each funding agreement, as well as through an annual survey of recipients to capture longer-term results of Program investments. Management acknowledges the burden these place on recipients, and will review the totality of reporting requirements and eliminate duplication wherever possible.
Since the end of the evaluation period, the Program has reviewed and updated its performance measurement strategy and logic model to include 2 new business lines and expected outcomes. In accordance with the recent Policy on Results, the Program has also developed a Performance Indicator Profile. Going forward, these elements will be used to guide the Program’s data collection requirements and methods.
Currently, the frequency of regular project monitoring is based on the Departmental Risk Assessment Management and Mitigation approach. The Department is undertaking a review of this approach in fiscal year 2018 to 2019. The Program will review the totality of compliance and outcomes reporting requirements and eliminate duplication wherever possible. In addition, funding recipients for projects in the current call will be advised early of their reporting requirements, which will provide clear expectations and allow adequate time to prepare.
While the evaluation commends the Program’s efforts to improve its performance measurement via the Recipient Survey of Sectoral Initiatives Program Performance Indicators (the Survey), it also highlights that questions could be clarified and the tool made easier to use. Since the end of the evaluation period, the Program’s most recent launch of the Survey incorporated a new, streamlined approach that allowed respondents to navigate the questionnaire more efficiently, and introduced some prepopulated fields to reduce the reporting burden. Management will identify and adopt Departmental best practices with respect to collecting outcomes data, and will facilitate feedback sessions with funding recipients to discuss the strengths and weaknesses of both the Survey tool and reporting process. Feedback received will be analyzed and incorporated into the redesign of the survey instrument and methodology.
Lastly, the evaluation identified that the Survey design could result in inconsistent responses. Management agrees that validation of Survey data is essential to its reliability, and continually strives to improve data quality. Going forward, the Program will consult departmental data experts, including the Evaluation Directorate, to improve the existing validation process and to implement new methods for effectively validating qualitative survey responses.
1. Introduction
Helping employers and employees to connect in the labour market is 1 of the Government of Canada’s priorities. At times, there is a mismatch between the knowledge, skills, and experience employers need, and the availability of employees or job seekers who possess these competencies. Employment and Social Development Canada (referenced hereafter as “the Department”) has a suite of programs designed to address skills, labour, and training gaps outside of the post-secondary education system. The Sectoral Initiatives Program (referenced hereafter as “the Program”), launched in April 2013, is 1 such program. It was designed to provide financial contributions to produce sector-based labour market information and human resources products.
This report presents the findings and recommendations from the evaluation of the Program, which covered the period from April 2011 through March 2017 and meets the Financial Administration Act requirement to evaluate all grants and contributions spending on a 5-year cycle. The evaluation included several projects that began under the Program’s predecessors, the Sector Council Program and the Sectoral Partnership Initiative.
An evaluation approach was presented to the former Departmental Evaluation Committee in February 2016. Key issues examined include:
- The continued need for the Program among target groups.
- The Program’s alignment with federal priorities and provincial initiatives.
- Efforts to measure Program and project performance.
- Stakeholder engagement.
- Product dissemination and timeliness.
- Contributions toward Program outcomes such as awareness and use of products, skills recognition and employability, and addressing sectoral labour market issues.
- Observations on efforts to deliver the Program in a cost efficient manner.
The Program provides funds to third-party organizations (referenced hereafter as “funding recipients”) to implement projects, with the input of sectoral stakeholders, and does not work directly with stakeholders or end-user beneficiaries. Thus, it does not have data to track or attribute direct effects (i.e. labour market outcomes) on individuals. This program design is typical for grants and contributions programs such as this. Further, the program is 1 of many interventions designed to help improve labour market efficiency and reduce skills gaps. Instead, the evaluation analysis focused on contributions to outcomes and systemic change in the ways sectoral stakeholders address labour market challenges.
In a similar way, the Program was not structured to collect information to support an analysis from a Gender-Based Analysis Plus (GBA+) perspective. However, the evaluation observed that a few projects focused on preparing and disseminating products to assist with labour market participation by beneficiaries that are sometimes underrepresented in the labour market. Specifically, 3 projects were cross-sectoral in design and focused on helping Indigenous workers and job seekers find nearby employment opportunities and position themselves as candidates for these jobs.
2. Program description
The Program began on April 1, 2013, as a new approach to addressing sectoral skills shortages, following the end of the Sector Council Program. It falls under the Departmental strategic outcome of a skilled, adaptable, and inclusive workforce and an efficient labour market.
The Program’s mandate is to help sectors identify, forecast, and address human resources and labour market skills gaps and needs through projects implemented by funding recipients. The Program is designed primarily to be demand-driven, with a focus on funding labour market and skills development products that are driven by industry and relevant to their needs, and to work with labour market demand-side players. It provides funding through contribution agreements for projects that support the development of sector-specific labour market information, national occupational standards, skills certification, and training accreditation systems. Funding recipients are often not-for-profits but can also be for-profit organizations, municipal governments, Indigenous organizations, provincial and territorial governments, Government of Canada agencies and crown corporations, unions, educational institutions, provincial governments, etc.
Stakeholders help the funding recipients develop and disseminate the products, and may also benefit from the products themselves. These include the same categories of groups as funding recipients, but can also be job seekers, employees, individual employers, students, and other Government of Canada departments. Projects can also involve supply-side stakeholders through such activities as consultations and participation in project working groups. Some beneficiaries, however, are not involved in the development of products. Figure 1 demonstrates the relationship between the Program and key players involved in the projects.
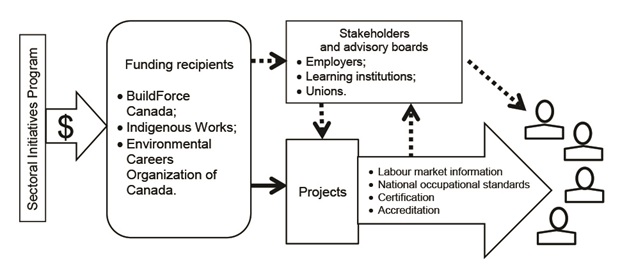
Description of figure 1
Figure 1 is a flow chart illustrating the Program’s structure. Boxes represent key groups and components of the Program. Arrows demonstrate the relationship between components and groups. The diagram demonstrates that the program is complex and is comprised of many components. The diagram also demonstrates the Program’s indirect relationship with end-user beneficiaries of the products it funds.
From left to right, a box represents the Sectoral Initiatives Program. An arrow pointing to the right with a dollar sign inside connects the Program box to a box representing funding recipients, demonstrating that the Program provides contributions to funding recipients. The box includes 3 examples of funding recipients: BuildForce Canada, Indigenous Works, and the Environmental Careers Organization of Canada.
The funding recipient box is connected to 2 more boxes by arrows pointing to the right. The topmost box represents stakeholders and advisory boards. Employers, learning institutions, and unions are provided as examples. An arrow made of dashes, representing a partnership between funding recipients and their stakeholders and advisory boards, connects the funding recipient box to the stakeholder and advisory board box. The bottommost box represents projects and is connected to the funding recipient box by a solid arrow, representing the funding recipients’ responsibility for the projects. The stakeholder and advisory board box is also connected to the projects box by an arrow made up of dashes, which points downward toward the projects box.
To the right of the projects box is a large arrow, pointing to the right. The large arrow lists the Program’s 4 business lines: labour market information, national occupational standards, certification, and accreditation. The large arrow represents the projects’ products and points to 4 icons shaped like people, which represent the end-user beneficiaries of the products. An arrow made up of dashes points upward from the large arrow to the stakeholder and advisory boards box, representing that stakeholders and advisory boards may also use the products. Finally, the stakeholders and advisory boards box is connected to the end-user beneficiary icons by an arrow made of dashes pointing to the right, representing that the stakeholders and advisory boards may also disseminate products to beneficiaries.
Business lines
The Program supports the development of products from 4 business lines:
- Sector-based labour market information (i.e. labour market reports and forecasting systems). The information must take a national lens, but provincial and regional sub-reporting is encouraged. These products help to determine a sector’s skills gaps and labour needs.
- National occupational standards, which are guidelines for the knowledge, experience, skills, and competencies needed for a specific job in a sector. They are expected to apply sector-wide, rather than be applicable only to a specific employer.
- Skills certification, which is a formal acknowledgement of an employee, student, or job seeker meeting a standard for knowledge, education, experience, skills, and competencies in a given field or job. Certification streams involve sector-wide certification standards, sometimes based on national occupational standards, and an application and assessment process.
- Training program accreditation, which involves a formal acknowledgement that a training program is adequately designed to produce graduates who will meet the sector’s requirements and needs.
Projects can include elements of any business line and can be used alone or as part of a continuum, in which case products build on existing products in the sector (for example, national occupational standards may be used as the base for certification requirements).
Program outcomes
The following expected outcomes are based on the Program’s 2016 logic model (see Appendix A).
- Short-term outcomes focus mostly on increasing awareness and use of the products by employers, employees, and educational institutions.
- Medium-term outcomes are about the products becoming a part of sustained change in their sectors. For example, the use of sectoral labour market information is expected to contribute to intelligent investments in training and skills upgrading that contribute to addressing recognized labour market needs in a sector.
- Long-term outcomes relate to the products’ contributions to the efficiency of the labour market and adaptability of the labour force in priority sectors. Key themes include improved matching of labour supply and demand, a more skilled workforce, more efficient use of human resources, and fewer skills shortages.
Projects and funding
The Program launched a call for project concepts in fiscal year 2012 to 2013Footnote 1 and received 124 applications for projects. Projects were expected to develop or update a set of products that would benefit an overall sector. They were required to be national in scope, or at least nationally significant. Proposed budgets had to demonstrate that at least 5% of cash or in kind funding would come from other sources to demonstrate stakeholder support. Finally, projects were required to have performance measurement strategies and product dissemination strategies in place within a few months of project launch.
A total of 31 projects were approved through the call for concepts, with projects often spanning multiple years. Once projects began, funding recipients were required to submit quarterly financial and activity reports detailing products and progress toward achieving project-specific outcomes.
From April 2013 to March 2017, the Program provided funding for 37 projects: the 31 from the call for concepts and 6 unsolicited after the call, as funding became available. Project funds come from 2 sources: the Consolidated Revenue Fund and Part II of the Employment Insurance Act. On average, the Program received approximately $20 million from these sources per year to spend on project contributions.
Sector Council Program and Sectoral Partnerships Initiative
The Department previously supported the development of sector-specific labour market information, skills training, and certification through the Sector Council Program, which sunsetted in March 2013. The Sector Council Program had a budget about 3 times larger than the current Program’s and it funded slightly different initiatives and activities. In particular, the Sector Council Program provided core funding for sector councils. The outputs of Sector Council Program funding were not always publicly available, whereas the Sectoral Initiatives Program was designed to leverage the Department’s free, publicly available Job Bank website as 1 avenue to disseminate sectoral labour market information.
3. Evaluation scope and methodology
The present evaluation is the Program’s first. However, an evaluation of the Sector Council Program, with its provision of core organizational funding, was completed in 2010.Footnote 2
The scope for the current evaluation was agreed upon at the Departmental Evaluation Committee in February 2016. The evaluation period covers fiscal years 2011 to 2012 through 2016 to 2017. Table 1 summarizes projects included in the evaluation based on when they were approved. The evaluation includes projects that began under the Sector Council Program and Sector Partnerships Initiative but were completed after the new Program’s launch in April 2013. It also covers projects were approved under the Program between April 2013 and March 2017, either through the fiscal year 2012 to 2013 call for project concepts or through the reception of unsolicited proposals after the call for concepts.
| Approval time period | Number of projects |
|---|---|
| Prior to April 2013: Projects funded by Sector Council Program and Sector Partnerships Initiative | 27 |
| 2013 to 2014: Projects funded from the fiscal year 2012 to 2013 Sectoral Initiatives Program Call for Concepts | 31 |
| 2014 to 2017: Projects funded through Sectoral Initiatives Program, unsolicited | 6 |
Source: Program administrative data
Key issues to be examined included:
- continued need for the Program among target groups;
- the Program’s alignment with federal priorities and provincial initiatives;
- efforts to measure Program and project performance;
- stakeholder engagement;
- product dissemination and timeliness;
- contributions toward Program outcomes such as awareness and use of products, skills formalization and employability, and addressing sectoral labour market issues; and
- observations on efforts to deliver the Program in a cost efficient manner.
A full list of evaluation issues is provided in Appendix B along with information on the evaluation methodology and data limitations. In brief, the evaluation used 6 lines of evidence to gather data for this report:
- a review of Program administrative documents and project files for 44 projects;
- a review of the Program’s administrative data (data from 3 years of an annual survey of funding recipients);
- a short literature review;
- key informant interviews (45) with representatives from the Program, funding recipients, employers and employer associations, experts in labour market information, and other stakeholders (for example, learning institutions and unions);
- 3 project-level case studies: forest products, manufacturing, and food and beverage manufacturing sectors; and
- 3 sector case studies: aviation and aerospace, information and communication technology, and mining.
A few limitations have been identified for this evaluation. First, the availability and quality of project files vary. Second, the administrative data is limited to an annual survey of funding recipients, which covers only active projects and reports at the project level, not at the user level. The Department does not have an administrative database on the Program’s end-user beneficiaries or their labour market outcomes. Finally, contribution agreements only require funding recipients to provide data for a few months after projects close, which limits the availability of outcome data, particularly for longer-term outcomes and contributions to impacts on overall systemic change in labour market efficiency.
4. Relevance: Addressing the need for skilled labour
The Program is aligned with priorities and strategic outcomes established by the Government of Canada and the Department. The Program and its projects respond to sectors’ specific needs to help reduce skills gaps and facilitate the connection between employers and potential employees.
4.1. Alignment with federal government priorities
The Government of Canada prioritizes issues such as skilled labour needs, connecting employers and employees in the labour market, and improving employment opportunities for Canadians. The objective to address skills shortages was specifically referenced in Budget 2014 and Budget 2017. Moreover, the Government’s commitment to ensure public access to reliable, up-to-date labour market information, skill certification and forecasts is mentioned in Budgets from 2011 through 2017.
Moreover, as per the Mandate Letters, the Minister of Employment, Workforce Development and Labour is tasked with helping “Canadians get the skills they need for good quality jobs … by working with provinces, territories, municipalities, Indigenous Peoples, the post-secondary education system, employers and labour to strengthen our training systems to build the human capital that Canadians and employers need.”Footnote 3
The Program also considers Government priorities when assessing projects for funding. A few key informants from the Program pointed to the Connecting Canadians with Available Jobs initiative as an example of the types of priorities the Program considers when selecting projects for funding. These key informants also noted that project selection criteria are informed in part by priorities found in the Speech from the Throne, Budgets, and other policy statements.
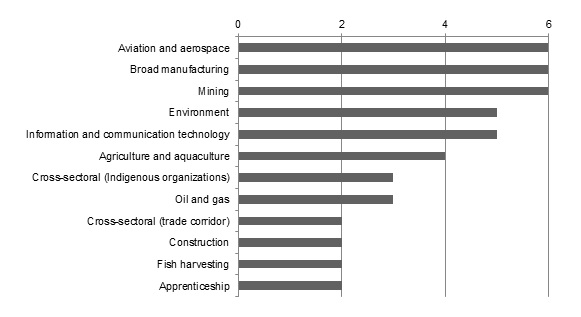
The evaluation examined the connection between sectors that received project funding from the Program and sectors of priority to the Government of Canada. Figure 2 presents the sectors that appeared in Government priority-setting documents between 2011 and 2017 and also had 2 or more active projects during the evaluation period. The evaluation found that 12 sectors, with a combined 46 projects, were mentioned in at least 1 priority document and had at least 2 active projects. From the perspective of individual projects, 55 of 64 total projects included in the evaluation were in a sector mentioned at least once in a Government priority-setting document between 2011 and 2017. The remaining 9 projects were in sectors that were not referenced in government priority documents, including wood manufacturing (3 projects), food and beverage manufacturing (3 projects), educational services (1 project) management of companies and enterprises (1 project), and utilities (1 project).
Source: Program administrative data.
Note: Priority sectors with a single project include automotive; cross-sectoral; forest products; motor carrier; professional, scientific and technical services; supply chain; tourism; truck transportation; and veterans.
Description of figure 2
| Priority sector | Number of projects |
|---|---|
| Aviation and aerospace | 6 |
| Broad manufacturing | 6 |
| Mining | 6 |
| Environment | 5 |
| Information and communication technology | 5 |
| Agriculture and aquaculture | 4 |
| Cross-sectoral (Indigenous organizations) | 3 |
| Oil and gas | 3 |
| Cross-sectoral (trade corridor) | 2 |
| Construction | 2 |
| Fish harvesting | 2 |
| Apprenticeship | 2 |
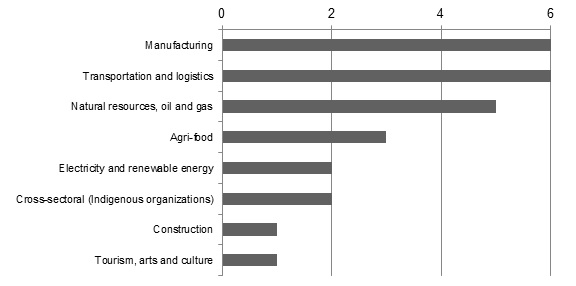
The evaluation also examined alignment between Program priorities and projects funded. Sectors listed as priorities in the fiscal year 2012 to 2013 call for project concepts were intended to be broad, to allow some flexibility in project selection and scope. Projects in other sectors were also considered for funding, particularly if they aligned with the Government’s priority to help unemployed Canadians connect quickly to jobs. Figure 3 shows approved projects by call for concept priority sector.
Source: Program administrative data.
Description of figure 3
| Call for concepts 2011 to 2012 priority sector | Number of projects from call for concepts |
|---|---|
| Manufacturing | 6 |
| Transportation and logistics | 6 |
| Natural resources, oil and gas | 5 |
| Agri-food | 3 |
| Electricity and renewable energy | 2 |
| Cross-sectoral (Indigenous organizations) | 2 |
| Construction | 1 |
| Tourism, arts and culture | 1 |
Of the 31 projects approved through the call for concepts, 26 fell within 1 of the broad priority categories listed in the call for concepts. The remaining 5 projects were from sectors not specifically mentioned in the call for concepts, which include information and communication technology (2 projects), aviation and aerospace (1 project), apprenticeship (1 project), and educational services (1 project). Projects were also designed with consideration to broader Government priorities. For example, 3 cross-sectoral projects focused on improving employment opportunities for Indigenous employees, students, and job seekers through targeted labour market information, engagement, and skills upgrading and matching. In this way, the project focused on a sub-population of priority rather than a specific sector.
4.2. Alignment with departmental strategic outcomes
A strategic outcome of the Department is “a skilled, adaptable and inclusive labour force and an efficient labour market”. The Program provides funding for sector-based products that can help individuals build and demonstrate the skills needed to obtain or maintain employment. The fiscal year 2012 to 2013 call for concepts focused on labour market efficiency, skills, and adaptability. The objectives included supporting improved matches between skills and labour market needs, more informed decisions by the supply side of the labour market, and improved labour mobility through skills development. Other programs in the Department are aligned with these goals or undertake similar work, but the Program’s work fills a niche in being sector-based and in funding all 4 business lines rather than focusing on 1 or 2 as other programs do.
A few key informants with knowledge of the Program design reinforced this connection, stating the Program’s business lines are directly aligned with the strategic outcome. For example, a forest products project was designed to help improve the efficiency of the job search process through labour market forecasting and a sector-specific job board. Most key informants participating in the forest products project case study indicated that the sector-specific nature of the labour market information and job board facilitated connections more easily than a generic job board would have.
4.3. Complementing provincial/territorial initiatives
The Program differentiates itself from similar initiatives at the provincial and territorial levels by funding projects that are national in scope, and providing more specific data and products. Furthermore, it coordinates with the provinces and territories by encouraging funding recipients to work with them as stakeholders that help to produce and to disseminate products.
All projects are national in scope or, at minimum, covered multiple provinces, territories, and/or regions. The general perception from all the key informants is that the Program does not overlap with similar provincial initiatives. A few key informants noted that a few provincial or territorial initiatives produce similar products. However, they said the Program complements these initiatives by taking a national or regional perspective, and provinces and territories do not typically fund similar products with a national scope. Similar findings were observed through a scan of publicly-available provincial products that are similar to those funded by the Program. For example, the Government of Ontario makes accessible to the public with free labour market information reports and job profiles, similar to national occupational standards, but the information and profiles use data specific to Ontario.
The Program encourages participation of provincial and territorial governments in the projects. Provincial and territorial stakeholders often participate through project advisory or steering committees. This collaboration is expected to help open lines of communication, avoid duplication of effort, and allow the provinces and territories to leverage the products. A few key informants explained that projects are sometimes supported by regional sub-committees in the sector that can be useful networks for provincial and territorial work as well. Provinces and territories provided cash or in-kind funding for some projects, too. For example, the province of Newfoundland and Labrador provided some of the funding for the 3 projects in the fishing sector. Table 2 lists the number of projects that engaged sectoral stakeholders each fiscal year from fiscal year 2013 to 2014 through fiscal year 2015 to 2016.
| Fiscal year | Number of projects |
|---|---|
| 2013 to 2014 | 20 |
| 2014 to 2015 | 22 |
| 2015 to 2016 | 24 |
Source: The Program’s annual survey of funding recipients.
Note: Projects almost always span multiple fiscal years. As a result, some projects are represented in the table in more than 1 fiscal year.
More specific examples were found in the aerospace and mining sectors. Funding recipients in these sectors worked with provincial stakeholders to produce regional labour market information, which the recipients rolled up into national-level reports and forecasts.
4.4. Demonstrated need for the program
The Program responds to the sectors’ needs for products that help reduce skills gaps and assist the supply and demand sides of the labour market to connect. Key informants indicated there is a general need for current tools that are consistent across the country to aid in the identification of labour market shortages and to allow labour market mobility in the sectors. Almost all agreed that the Program helps the sectors to identify and address these issues. Many said their sectors’ needs are ongoing.
The Program determines needs in sectors at a macro level when preparing sector profiles by using existing research, statistics, and labour market information. Moreover, analysts identify potential topics that the Program may want to consider funding in the future and consult with stakeholders in the sector to validate the information they have gathered.
At a micro level, project proposals are expected to demonstrate the needs in their sectors using existing research and data on the sector. This justification section often highlights the importance of the sector to the Canadian economy, the shortfall in the sector (skills development, lack of candidates for jobs, and so forth), and how new or updated labour market information, national occupational standards, certification, and/or accreditation would help to address the shortfall. The evaluation identified 10 categories of reasons given for needing project funds and 16 types of justifications provided to explain why sectors required skills development. Examples of a few of the more commonly-cited needs follow:
Labour shortages
Some project files described how growth in their sectors led to an existing or forecasted need for more employees. Labour demand was outpacing or would shortly outpace supply, necessitating labour market information to confirm a perceived shortage or to help pinpoint the specific jobs and/or specific regions experiencing these shortages. A project in the tourism industry, for example, presented data from previous research on projected labour demand in the sector to demonstrate the need to update and expand products from all 4 business lines to help the sector prepare to fill the anticipated need for more employees to keep up with the sector’s growth. Updated national occupational standards, certification, and accreditation were said to be needed to ensure qualified potential employees could quickly be identified to fill these positions.
Aging workforce
A few projects were designed to address the effects of an aging workforce in their sectors. As employees retired or neared retirement, some sectors reported struggles to attract new workers, and youth in particular. A project in the truck transportation sector cited research that the sector was particularly vulnerable to this trend, and the effects could be far reaching as other sectors depend on the truck transportation sector to move goods across the country. The occupational standards and toolkit developed through the project provided potential new drivers with a pathway to join the sector, and it was hoped they would help improve the perception of truck driving as a career.
Skills needs
A main objective of the Program is to help sectors address skills mismatches. Some projects highlighted how their sectors required the Program’s support to pinpoint and to address these mismatches and various needs. A few specific types of skills mismatches and needs were brought forward in the project files. A few sectors experienced an excess demand for labour while provincial, regional, or local unemployment persisted in areas where the sector is active.
Labour mobility was another example of a type of skills need. Potential employees with the skills needed by employers in a given sector were not in the right place at the right time to fill the positions. Students and new graduates were reported to sometimes lack specific skills and experience needed to fill in-demand positions the sector despite having the right general knowledge. Many of the projects touched on skills needs, but 2 cross-sectoral projects illustrated how the products are expected to help fill skills needs. These projects were designed to help a target population, Indigenous job seekers, by producing labour market information on the jobs available near reserves and areas with many Indigenous job seekers. The labour market information was used to determine the skills needed to fill those jobs, and it informed the design of a framework to help Indigenous job seekers gain the skills to match with the jobs in their regions.
New technology and evolving job requirements
A few projects were designed to help their sectors, and related workers, to adapt to new technology and job requirements. For example, the Program’s research determined that the forest products sector needed help to upgrade existing and potential employees’ skills to help the sector adapt to new technology. According to the project recommendation report for a project in the forest products sector, labour market forecasts indicated an upcoming shortage of skilled workers due, in part, to shifts in the sector to move into new activities, such as bio-energy and bio-fuel, which were creating new job types and skill requirements.
5. Measuring performance
The Program is collecting performance data with a particular emphasis on outcomes. However, the evaluation found potential areas for improvement related to reporting burden, survey design, and data quality.
Activities
Performance monitoring and measurement are critical support activities for the Program’s core work with funding recipients. The Program monitors the projects’ ongoing progress and collects performance data on their outputs and contributions to outcomes. This data collection helps to inform internal reports on Program achievements and corporate reporting requirements.
The Program uses a few types of tools to monitor and measure performance:
- a performance measurement strategy comprised of a logic model and performance indicators;Footnote 4
- an annual survey of funding recipients with active projects, feeding into the performance measurement strategy, that collects information on products completed, stakeholder engagement, product dissemination, end-user beneficiaries, contributions to outcomes, and leveraging; and
- project administrative files, which include the standard Grants and Contribution monitoring tools: project proposals; quarterly reports on finances, activities, and contributions to outcomes; final reports; and, project evaluations.
Strengths
During the period covered by the evaluation, a performance measurement strategy was in place and information was collected and used. According to a few key informants from the Program, the performance measurement strategy was designed to place a greater emphasis on measuring outcomes as opposed to outputs. This included gathering quantitative and qualitative information from recipients on the outcomes of beneficiaries using their products through the annual survey of funding recipients. Data from the annual survey of funding recipients are used to produce annual internal reports on project outputs and contributions to the sectors. Data are also used to inform corporate reporting.
The annual survey of funding recipients has been designed to collect performance data that are specific to the Program’s needs. As 1 key informant from the Program described, the quarterly reports and internal project monitoring reports ensure the projects are following their plans, whereas the survey digs deeper, to collect data on the products and their effects in the sectors. The Program’s report notes the undertaking of a review and validation of the data each time the survey is conducted.
According to the Program, the validation consists of raw data collected through the survey being cleaned and validated internally through a process involving the examination of any apparent outliers and questionable responses. The Program describes that in these instances, Program analysts will contact funding recipients to obtain clarification on their responses, and make adjustments as required.
Challenges and areas for improvement
There is room to improve performance measurement in the volume of reporting requests, survey design, and data quality.
Funding recipients’ views were mixed when considering the burden of reporting requirements. 1 of the issues raised was perceived overlap between the quarterly reports and the annual survey of funding recipients. This was also observed when reviewing the duplication between information gathered in project files and survey data.
Some funding recipients interviewed indicated the survey itself is overly burdensome and the questions on the survey can sometimes be unclear. Some others filled out the survey for multiple projects and/or business lines. Moreover, survey data indicated that some funding recipients reported challenges with responding to certain questions, particularly those regarding take-up, use, and dissemination of products. They sometimes provided explanations about their methodologies for estimating their responses in their text responses.
This created a challenge for data analysis due to inconsistent estimations. For example, some recipients included their social media follower counts from all social media channels in their estimates of beneficiaries using the products. Others included all participants at a conference even though not all were said to have attended the recipient’s presentation. Similarly, a few key informants said it can be challenging to respond to questions about outcomes. This is because the annual survey of funding recipients is for active projects, which may not yet be contributing to outcomes.
A few key informants provided the following suggestions to improve performance measurement:
- to collect more information on the benefits of the labour market forecasting business line and its effect on business decisions;
- to find a way to measure the quality of the products;
- to emphasize product dissemination and use; and,
- to standardize the template for final reports.
6. Performance: Establishing the context for success
6.1. Stakeholder engagement
Generally, all projects have had high levels of stakeholder engagement from various groups in different ways. While some projects were able to engage employees and job seekers in the development and testing of the tools, other projects found it more difficult to include these groups.
Activities
Most stakeholder engagement is conducted by funding recipients, who are required to involve individuals and groups from the sectors to help ensure the products respond to the sector’s needs and will be useful to stakeholders and end-user beneficiaries. The Program, through its fiscal year 2012 to 2013 call for concepts, required projects to leverage at least 5% of their proposed budgets from stakeholders as a way of ensuring the sectors’ support and encouraging funding recipients to connect with stakeholders.
Stakeholder groups include employers and employer associations active in the sector, provincial and territorial governments, unions, sector councils, non-governmental organizations at the provincial/territorial and national level, and training institutions, which are often universities and colleges. Some stakeholders sign formal partnership agreements and/or provide cash or in-kind funding to demonstrate their commitment to a project, but these are not required for stakeholders to participate in projects. Other stakeholders participated through boards, advisory committees, and/or working groups, for the project specifically or for the funding recipient in general, which often entailed helping with product development, review, validation, and dissemination.
Strengths
The evaluation identified 3 major strengths of stakeholder engagement in the projects. Stakeholder involvement is useful for testing and validating the accuracy of labour market information, national occupational standards, certification, and accreditation products. Also, it is encouraging collaboration in the sector because it brings together a range of stakeholders.
First, funding recipients are engaging many stakeholders in the projects, particularly from the demand side of the labour market. Through its annual survey of funding recipients, the Program provides a list of stakeholder types and asks funding recipients to report which types of stakeholders they have engaged in their projects. Table 3 lists each type of stakeholder and how many projects reported engagement with stakeholders of that type.
| Stakeholder type | Number of projects reporting engagement, fiscal year 2013 to 2014 | Number of projects reporting engagement, fiscal year 2014 to 2015 | Number of projects reporting engagement, fiscal year 2015 to 2016 |
|---|---|---|---|
| Employers | 29 | 28 | 29 |
| Employer associations | 31 | 28 | 27 |
| Learning institutions | 30 | 28 | 28 |
| Provincial sector councils | 8 | 15 | 21 |
| Other non-governmental organizations | 14 | 12 | 17 |
| Provincial and territorial governments | 20 | 22 | 24 |
| Unions | 12 | 12 | 13 |
| National sector councils | 12 | 12 | 16 |
| Other Government of Canada departments or agencies | 22 | 17 | 17 |
| Municipalities | 10 | 13 | 9 |
| Other Employment and Social Development Canada programs | 13 | 12 | 15 |
| International government departments or agencies | 6 | 5 | 4 |
| Other stakeholders | 11 | 17 | 16 |
Source: The Program’s annual survey of funding recipients.
Note: Projects almost always span multiple fiscal years. As a result, some projects are represented in the table in more than 1 fiscal year.
The Program’s annual survey of funding recipients also asks recipients to estimate how many stakeholders (individuals or groups) were engaged in their projects each fiscal year, using the same list of stakeholder types. The evaluation tallied the responses across projects, but kept separate the totals by stakeholder type. Table 4 provides the total stakeholders across projects, disaggregated by stakeholder type and fiscal year.
| Stakeholder type | Number of stakeholders engaged, fiscal year 2013 to 2014 | Number of stakeholders engaged, fiscal year 2014 to 2015 | Number of stakeholders engaged, fiscal year 2015 to 2016 |
|---|---|---|---|
| Employers | 9,663 | 11,697 | 10,630 |
| Employer associations | 258 | 380 | 697 |
| Learning institutions | 547 | 369 | 487 |
| Provincial sector councils | 20 | 64 | 306 |
| Other non-governmental organizations | 288 | 111 | 179 |
| Unions | 18 | 23 | 83 |
| National sector councils | 53 | 33 | 68 |
| Other Government of Canada departments or agencies | 54 | 45 | 57 |
| Municipalities | 65 | 48 | 51 |
| Other Employment and Social Development Canada programs | 24 | 25 | 36 |
| Other Employment and Social Development Canada programs | 24 | 25 | 36 |
| International government departments or agencies | 9 | 21 | 21 |
| Other stakeholders | 210 | 255 | 308 |
| Total | 11,209 | 13,071 | 12,923 |
Source: The Program’s annual survey of funding recipients.
Note: Projects almost always span multiple fiscal years. As a result, some stakeholders are represented in the table in more than 1 fiscal year.
The Program is designed to focus on the demand side of the labour market, and accordingly, the data demonstrate employers from the sectors and employer associations were the most common stakeholder groups reported to be involved in the projects. Data from the annual survey of funding recipients indicated that projects were successful at engaging stakeholders from more than 1 category.
Key informants and participants in project and sector case studies echoed the survey results. Some highlighted the wide variety of stakeholders that were involved in some projects in addition to representatives from across their industry, including groups representing Indigenous peoples. Furthermore, project files indicated that all projects approved since 2013 have leveraged funding from stakeholders.
Stakeholder involvement was important to ensure the products were accurate and useful for their sectors. Evidence from most key informants and the case studies indicated the importance of industry representative involvement in the projects, including employers and employer associations. A few key informants also reported that collaboration with stakeholders increased the usefulness of labour market information products in particular.
The forest products sector project advisory committee had representatives from across Canada’s forest products industry, including not-for-profits, employers, government, and training institutions. In 2015, the project held focus groups to test the labour market information and job board. Approximately 400 job seekers from universities, colleges, and high schools
Involvement in the boards of directors, working groups or advisory committees was 1 of the most common types of stakeholder engagement activities reported by funding recipients. Key informants noted that in most cases, an advisory committee or working group comprising employers and training institutions (and, in 1 case, workers) would validate the tools, in addition to providing guidance and oversight throughout the project. For example, 2 of 3 project case studies undertook similar engagement strategies in the form of creating advisory groups for the projects and using other means, such as focus groups, to include other stakeholders.
Finally, some key informants and participants in sector case studies indicated that some projects fostered collaboration between employers, or between different stakeholder groups of stakeholders, such as employers and training institutions, employers and unions, and employers and non-governmental organizations.
The aerospace sector project brought together employers over their shared need for good labour data and a skilled workforce.
Challenges
The evaluation found that the engagement of stakeholders from the supply side of the labour market (employees, job seekers and students) was occurring in some projects, but it was not always clear to what extent this was systematically the case.
The supply side of the labour market can be seen as represented by unions and learning institutions, but they do not cover the entirety of the supply side continuum. Some key informants interviewed mentioned job seekers and workers are engaged in the projects, but an equal number commented that these groups were not. A few key informants reported that specific groups such as training institutions, unions, and job seekers had not been targeted by projects, and they perceived this to be an area for improvement.
6.2. Dissemination
Evidence suggests those who are aware of the products often find them timely and useful for human resource decision making. However, concerns exist regarding the number of end-user beneficiaries and whether the dissemination activities were reaching a broad enough audience, including job seekers and small and medium enterprises.
Activities
The purpose of dissemination activities is to ensure products are reaching their intended end-user beneficiaries and that they are using them to address their human resources and skills training needs. The majority of efforts to disseminate products to end-user beneficiaries are undertaken by funding recipients, often with the assistance of stakeholders. Funding recipients were also expected to coordinate with the Department to post products on the Job Bank website to expose the products to a wider audience.
The fiscal year 2012 to 2013 call for project concepts indicates funding recipients were required to produce a communication or dissemination plan to distribute the products to end-user beneficiaries across the sector. Dissemination activities varied by project depending on the products and the end-users they targeted. Projects generally used more than 1 approach to disseminate products. Most funding recipients leveraged their stakeholder networks to further their reach, sometimes having employer associations include information on the products in their newsletters.
Strengths
Funding recipients and their stakeholders are completing dissemination activities, and through these activities, key informants perceive that products are reaching many intended end-user beneficiaries. Those aware of the products find them useful and timely.
Product dissemination is an important part of the project lifecycle and was routinely completed by funding recipients. All project files and case studies indicated funding recipients and their stakeholders are engaging in a range of activities, some of which were creative and innovative, to share products across the sector and place importance upon this component of the project lifecycle.
Some projects were able to meet the requirement to share products via the Department’s Job Bank website. Recent labour market information produced through the projects was available on Job Bank for agriculture, forestry, mining, oil and gas, manufacturing, international trade, tourism, and information and communication technology. According to Job Bank data, 81 labour market information reports in each official language produced with Program contributions have been posted to Job Bank since the Program launched. Some key informants stated they saw a benefit in the use of Job Bank to disseminate products. Additionally, some funding recipients were continuing to attempt to connect products to Job Bank.
| Online page or event | Number of visits or views |
|---|---|
| Video views | 32,228 |
| Site visits | 74,460 |
| New visitors | 58,877 |
| Job seeker registrations | 1,099 |
| Apply now clicks | 1,024 |
Source: Funding recipient.
Project reports sometimes included output data on dissemination activities. Funding recipients were most often able to report on the number of activities undertaken, attendance at these activities, and web analytics (product downloads, web page visits, social media followers). For example, the funding recipient for the case study project in the forest products sector measured website traffic for the job match portion of their labour market information products. These results are presented in Table 5.
Most key informants indicated that products were reaching intended audiences, in general. Although there are challenges related to measuring take-up and reach of the labour market products, funding recipients reported that they have been able to reach many beneficiaries, particularly on the demand side of the labour market. Based on an aggregation of data from the Program’s annual survey of funding recipients between fiscal year 2013 to 2014 and fiscal year 2015 to 2016 (Appendix C), funding recipients reported between 29,000 and 147,000 beneficiaries received labour market information each fiscal year.
For national occupational standards, respondents estimated between 11,000 and 15,000 beneficiaries per fiscal year. The highest numbers of beneficiaries were reported for employers, students or influencers, apprentices, and workers or job seekers (1 shared category).
Most key informants commented that the products are disseminated in a timely manner. A few employer associations and funding recipients specifically noted that this timeliness is particularly necessary due to the strong demand for the products.
Some key informants noted that the data included in the products is up-to-date, with a few key informants adding that there are specific plans in place to continue updating the tools. For example, a few key informants noted that revisions have been made to account for changes to market conditions in some sectors, which keeps products timely and relevant. Some key informants attributed the dissemination success to the approach of continuous dissemination throughout the project lifecycle and to the fact that many connections are already in place between funding recipients, industry and other stakeholders.
Challenges and areas for improvement
The evaluation found challenges with regards to product dissemination, which included unavailability of dissemination strategies and limited information on reach and timeliness among some groups of beneficiaries. It is worth noting that much of the data available on dissemination activities is restricted to activities and outputs, and has not been linked to outcomes. Finally, in interviews and responses to the annual survey of funding recipients, some recipients reported experiencing challenges connecting their products electronically with Job Bank.
Dissemination strategies
The evaluation found some evidence in project files of activities undertaken to disseminate products, but evidence of the required dissemination plan documents was rare. Some funding recipients interviewed noted that there is limited funding available for dissemination, and funding structures can create a challenge for dissemination. As they described it, project funding runs out too early to continue focusing on dissemination and reporting on those efforts. Some key informants and cases study participants recommended more money be spent on dissemination, and a few suggested a more specific allocation of funding dissemination after the product has been developed.
Potential to increase reach and use
Challenges exist with the data on dissemination. In the annual survey of funding recipients, many funding recipients used the open-text fields to report their difficulties in collecting the detailed quantitative data on the reach and take-up of their products. The methodology used by funding recipients to report on beneficiaries also differed across projects. To an extent, this is to be expected, as projects may be designed to reach funding recipients in a variety of ways. However, the open text responses indicated that some funding recipients included more indirect beneficiaries, such as social media followers or total conference participation numbers, whereas others reported more direct contact with beneficiaries.
Challenges with the accuracy and reliability of responses to the annual survey of funding recipients were raised by key informants. A few key informants mentioned it is difficult to determine the extent to which tools have been disseminated and used. Although there was agreement from most of the project and sector case study interviewees that stakeholders were aware of the projects and resulting products, project administrative data indicated funding recipients were not always able to report on these interactions in terms of extending the reach of products to the broadest number of potential beneficiaries and contributing to product use.
For some key informants, dissemination activities were considered to be successful in sharing products with end-user beneficiaries. Other key informants raised shortcomings with product dissemination, with some mentioning that oftentimes, there is not enough widespread dissemination and awareness of products.
Some funding recipients and other stakeholders interviewed noted uneven awareness of products within their sector, particularly in the case of large or diverse industries. They also reported that specific groups, such as small and medium enterprises, are generally not aware of the tools. Evidence regarding awareness of the projects and their products was mostly anecdotal from the key informants, as well as participants in the 3 project and sector case studies.
Challenges also exist with understanding products sufficiently to use them to their fullest potential. A few key informants explained that there are many small and medium enterprises that need additional assistance to understand what national occupational standards are and how to use them. For example, a few key informants noted that disseminating products to small and medium enterprises is a challenge for systemic reasons.
Timeliness and accessibility
Although most key informants indicated the products are produced and disseminated in a timely manner, some noted challenges. A few key informants mentioned that the Census of Population and employment estimates, when used to produce labour market information, are already somewhat out of date. This was observed in the aerospace and mining sector case studies. A few key informants said the pace of change in a sector can sometimes render labour market information outdated by the time it is published.
A potential unforeseen outcome was identified in relation to the move from the Sector Council Program to the new Program. Nearly all completed products were found to be publicly accessible. However, files for a couple of projects indicated that funding recipients had decided or were considering putting some products behind paywalls to recoup costs and to ensure sustainability. This has the potential to decrease access to and take up of products, particularly by job seekers and small and medium enterprises.
Job Bank
As noted, 81 products have been posted to Job Bank. However, the evaluation found limitations to the use of Job Bank as a dissemination tool for the Program’s labour market information products.Footnote 5
First, some funding recipients reported technical challenges with electronically connecting their labour market information with Job Bank. For example, an objective of the forest products sector project was to connect the completed labour market information and job board to Job Bank. The goal of cross-posting this information to Job Bank was to ensure that forest products sector job opportunities posted to Job Bank would automatically be posted to the forest products sector job board, and vice-versa.
A participant in the case study, however, indicated that the process was ongoing due to technical difficulties linking the systems. Second, only labour market information products are posted to the Job Bank’s sector pages. National occupational standards and information on certification and accreditation do not appear on the sector pages.
Finally, consistent with the findings of the 2017 evaluation of Job Bank and the Department’s approach to disseminating learning and labour market information, finding the labour market information products on Job Bank is a challenge for those unfamiliar with the website. The previous evaluation found this was particularly difficult for job seekers. The sector-based labour market information products are several clicks away from the Job Bank landing page.
Some key informants suggested the Government of Canada or the Department could assist in the dissemination of products in other ways. A few recommended that the Department list all funded projects on its website and a few others even suggested using Job Bank as a labour market dissemination tool.
7. Performance: Contributions to outcomes
The products are generally contributing to the Program’s short-term and medium-term outcomes. However, shortcomings exist about measurement of outcomes, particularly those expected over the medium-to-long term, and overall use of the products.
Outcomes
The Program’s short-term outcomes are awareness and use of the products by employers, employees, and educational and training institutions. In the medium term, the products are expected to be a part of sustained change in their sectors, such as more intelligent investments in training and skills upgrading that contribute to addressing recognized labour market needs.
Strengths
The projects are generally successful at preparing and disseminating products, with only 2 projects reporting challenges that prevented them from completing some of their expected products. Evidence suggests that products are being produced across the 4 business lines, and are contributing to the Program’s short-term and medium-term outcomes. Table 6 demonstrates that most projects focus on labour market information, national occupational standards, or a mix of products across business lines. Although there are no projects focusing solely on certification or accreditation, many of the projects that span multiple business lines include certification and/or accreditation, with these 2 business lines often paired with one another or with national occupational standards.
| Business line | Number of projects |
|---|---|
| Labour market information only | 33 |
| National occupational standards only | 5 |
| Certification only | 0 |
| Accreditation only | 0 |
| Multiple business lines | 22 |
| No business line | 4 |
| Total | 64 |
Source: Program administrative data.
More than half the of the 64 projects focused on labour market information only, followed by a third of projects that focussed on more than 1 business line. Labour market information was the most frequently used business line.
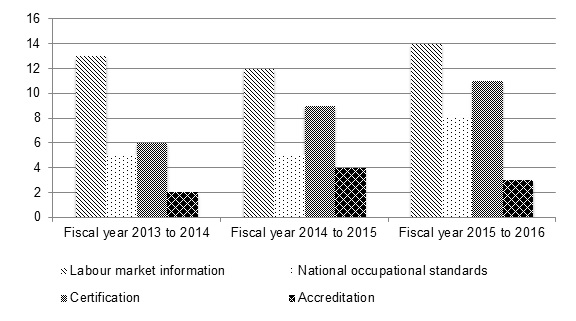
Using the funds provided, the projects have completed new or updated products across the 4 business lines. This coverage is represented in Figure 4, which illustrates the number of projects per fiscal year that yielded products, disaggregated by business line.
Source: The Program’s annual survey of funding recipients.
Description of figure 4
| Business line | Fiscal year 2013 to 2014 | Fiscal year 2014 to 2015 | Fiscal year 2015 to 2016 |
|---|---|---|---|
| Labour market information | 13 | 12 | 14 |
| National occupational standards | 5 | 5 | 8 |
| Certification | 6 | 9 | 11 |
| Accreditation | 2 | 4 | 3 |
Looking beyond the projects to the individual products, administrative data indicates the projects are producing labour market information products. Figure 5 provides an estimate of the labour market information and forecasting products completed as of fiscal year 2015 to 2016, using data collected directly from funding recipients through the Program’s annual survey of funding recipients.

Description of figure 5
| Type of product | Fiscal year 2013 to 2014 | Fiscal year 2014 to 2015 | Fiscal year 2015 to 2016 |
|---|---|---|---|
| Labout market information reports | 91 | 111 | 126 |
| Labour market information forecasting | 12 | 163 | 40 |
| National occupational standards products | 22 | 34 | 150 |
| Certification products | 13 | 27 | 57 |
| Accredited training programs or schools | 5 | 22 | 12 |
Evidence collected through case studies supports the finding that products were, in general, completed according to the projects’ plans. Regarding short-term and medium-term outcomes, the evaluation found evidence of awareness, usefulness and timeliness of the products by key informants from the sectors. Furthermore, the evaluation found some examples of products contributing to changes in their sectors with regard to skills gaps and labour market efficiency.
Most key informants with knowledge of the labour market information products, including funding recipients, Program representatives, and stakeholders, stated they found the products to be useful to help address sector-specific labour market needs. It was noted in the information and communication technology sector case study that most relevant stakeholders are aware of and are using labour market information products funded by the Program. In the mining sector, the labour market information projects contributed to an improved understanding of human resources challenges and best practices.
In the aerospace, information and communication technology, and mining sectors, the national occupational standards are being used by employers and training institutions.
Some key informants across respondent groups who had knowledge of national occupational standards indicated that those standards were useful supports for human resource planning, recruitment, candidate and employee assessment, training, and certification. Case studies found evidence that the standards are being used and are contributing to changes that could help with labour market efficiency in their sectors. In 2 case studies, respondents noted high levels of awareness among employers and other stakeholder organizations.
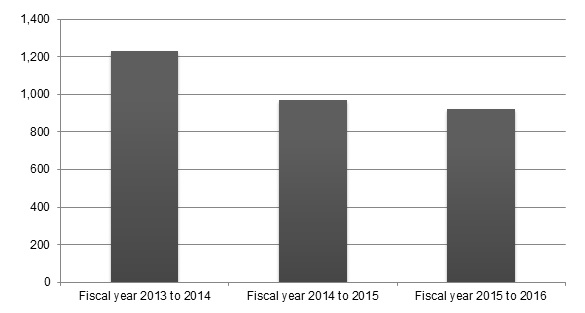
Source: Program’s annual survey of funding recipients
Description of figure 6
| Fiscal year 2013 to 2014 | Fiscal year 2014 to 2015 | Fiscal year 2015 to 2016 | |
|---|---|---|---|
| Number of Certifications | 1232 | 970 | 924 |
Fewer projects involve certification and accreditation, and as such, most key informants were unable to comment on these products. However, those with knowledge of these 2 business lines indicated that the products were being used and were strengthening the systems that guide training and recruitment. Similarly, the 3 sector case studies indicated use and awareness of funded certification and accreditation products. Figure 6 presents an estimate of the certification take-up, as reported by some funding recipients.
A few key informants made comments pertaining to the continuum in which each business line can develop products based on products from previous business lines. For example, sectors that have developed national occupational standards could move on to future projects, specifically the development of certification tools based on the standards.
The evaluation found examples of projects contributing to reducing skills shortages and skills gaps. In the aerospace, mining, and information and communication technology sectors, case study key informants agreed that products developed have helped to fill difficult-to-fill vacancies, helped employers experience fewer skill shortages, and helped employees experience fewer skill mismatches in their relative sectors. However, some also noted challenges in achieving these outcomes to date given that the products have only recently been developed and shared.
In the environmental sector, accreditation increased by 10 programs while a project was ongoing, for a total of 21 accredited programs upon completion of the project. 3 new certification and accreditation streams were created (curriculum standards in environmental studies, environmental management, and Master’s level programs) based on the sector’s national occupational.
Labour market information
Some key informants noted that funded Labour Market Information can be helpful for addressing labour market shortages. The key informants also reported that labour market information products have been used to guide decision-making for investment or policy decisions, to enter into discussions with government for advocacy activities and funding requests, and to guide training, business and workforce planning. Multiple lines of evidence yielded examples of how labour market information products contributed to outcomes such as awareness of products, collaboration in the sectors, capacity building to invest in skills development and manage human resources in keeping with labour market trends and issues, and facilitated human resource management. Table 7 presents examples of contributions to 3 sectors: mining, forest products, and construction.
| Sectors | Examples of labour market information product usefulness |
|---|---|
| Mining |
|
| Forest products |
|
| Construction |
|
Sources: Key informant interviews, case studies, project files, and the Program’s annual survey of funding recipients.
National occupational standards
Some key informants explained how national occupational standards can help employers with employee training, human resource planning, and recruitment, (acting as an input for developing job descriptions and assessing candidates). Some key informants also noted that the standards can be useful to training institutions in the development or updating of training curricula, including for minimum entry-level training. Additionally, key informants indicated standards can help job seekers determine which skills are transferable to other occupations and sectors and articulate their skills in developing their resumes. These key informants noted that demonstrating alignment with national occupational standards can make job seekers more attractive candidates for employers.
More concretely, interviewees from the sector case studies noted that the national occupational standards are being used by their sectors to help with hiring and by training institutions to develop curricula. Multiple lines of evidence yielded examples of how national occupational standards products contributed to outcomes such as awareness and use of the standards, skills improvement and standardization, better human resources management, and the promotion and delivery of nationally-recognized, demand-driven, skills-based approaches to training to facilitate labour mobility. Table 8 presents examples of contributions to 3 sectors: aviation and aerospace, agriculture, and truck transportation.
| Sectors | Examples of national occupational standards product usefulness |
|---|---|
| Aviation and aerospace |
|
| Agriculture |
|
| Truck transportation |
|
Sources: Key informant interviews, case studies, project files, and the Program’s annual survey of funding recipients.
Certification and accreditation
Most of the 46 key informants were not able to comment on certification or accreditation products. However, those who could reported that the products have helped fill vacant positions, contributed to reducing recruitment and training costs, and helped to increase employee retention. Regarding accreditation, some key informants noted training institutions are using the products, and employers sometimes use these products to help make training investment decisions. Furthermore, it was noted that some students from accredited programs are being hired even before they graduate. Multiple lines of evidence yielded examples of how certification and accreditation contributed to outcomes such as awareness and adoption of products by learning institutions, workers and employers; recognition of workers’ competencies; attainment of certification or new credentials; workers seeking training to fill skills gaps or avoiding training for skills already possessed; increased employability for workers with certifications; increased applications for accreditation; accreditation assessments in progress and successful; more relevant, up-to-date, higher quality training programs being developed by post-secondary institutions; and quality assurance for accredited programs. Table 9 presents examples of contributions to 3 sectors: mining, environmental, and manufacturing.
| Sectors | Examples of certification and accreditation product usefulness |
|---|---|
| Mining |
|
| Environmental |
|
| Manufacturing |
|
Sources: Key informant interviews, case studies, project files, and the Program’s annual survey of funding recipients.
Challenges and areas for improvement
Challenges were identified in relation to data collection, particularly for longer-term outcomes:
- Projects are time-bound and end shortly after outputs are completed, which sometimes means the funding or incentive to collect and report on longer-term outcomes ends when projects end. Data on medium- and longer-term outcomes may not yet be available at that point.
- A few key informants expressed difficulties in tracking the extent to which products are being used.
- Products had not always been in use for long enough to measure outcomes.
Challenges were also identified in relation to take-up of products. Suggestions were collected from key informants as to why this may be:
- Some sectors are small and already well-networked.
- Some employers have strong internal capacity to produce their own labour market information.
- There may be limited awareness of labour market information in a sector generally.
- National occupational standards are not always sufficiently accessible for small and medium enterprises to understand them.
Finally, a few key informants and sector case study participants emphasized the need to fund, or continue to fund, labour market information forecasting models, which are relevant for longer periods of time. A funding recipient in the oil and gas industry reported that their project’s forecasting system was adjusted after the shock in prices in 2015, which allowed them to better understand and respond to the effects of this shock on the sector’s labour market.
8. Observations on efficiency and economy
Some measures such as the 5% leveraging for all projects and negotiating lower contribution amounts for projects might have contributed to efficiencies. However, findings are mixed about the cost-effectiveness of the Program when comparing with the previous Program. Costing data was not available at a sufficient level of detail to support an exact measurement of cost efficiency.
Activities
The transition from the Sector Council Program to the current Program involved a reduction in overall budget, including in funding for grants and contributions, as well as a reduction in human resources. Figure 7 presents the Program’s budgets for the period covered by the evaluation.

Source: Chief Financial Officer Branch, November 2017.
Description of figure 7
| Spending Type | Fiscal year 2011 to 2012 | Fiscal year 2012 to 2013 | Fiscal year 2013 to 2014 | Fiscal year 2014 to 2015 | Fiscal year 2015 to 2016 | Fiscal year 2016 to 2017 |
|---|---|---|---|---|---|---|
| Sector Council Program | Sectoral Initiatives Program | |||||
| Total funding for projects ($) | 57,334,186 | 50,978,273 | 14,901,275 | 22,553,534 | 23,430,874 | 19,051,009 |
| Total operating ($) | 8,678,460 | 6,387,913 | 3,788,421 | 3,963,107 | 3,929,884 | 4,598,449 |
Strengths
Some key informants and case study interviewees indicated that the Program is effective and is delivered cost-effectively. Specific reasons noted include the following:
- The call for concepts process is targeted. Instead of funding sector councils, the Program addresses industry-identified needs by funding projects directly.
- The Program can fund projects from a variety of organizations, allowing it to support different types of projects.
- Funding recipients are managing their projects in cost-effective ways.
The Program was designed to be more efficient by requiring all projects to leverage at least 5% of their budgets from other sources. All projects funded through or after the fiscal year 2012 to 2013 call for concepts met this new requirement. The Program was the primary source of funding (i.e. contributed over 50% of the budget) for all but 2 projects. A few projects leveraged either large dollar-value amounts or a large proportion of the project budget. Figure 8 presents total amounts leveraged, as reported by the funding recipients.
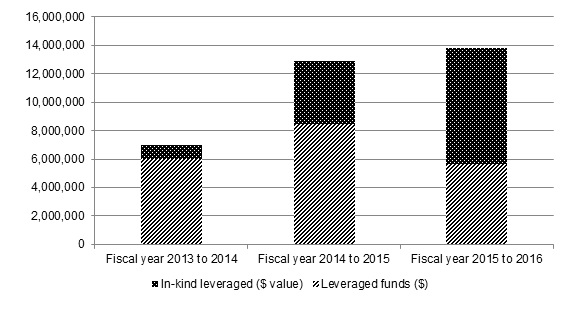
Description of figure 8
| Fiscal year | Leveraged funds ($) | In-kind leveraged ($ value) |
|---|---|---|
| Fiscal year 2013 to 2014 | 6,000,000 | 1,000,000 |
| Fiscal year 2014 to 2015 | 8,500,000 | 4,400,000 |
| Fiscal year 2015 to 2016 | 5,700,000 | 8,100,000 |
Based on the project file review:
- 7 projects leveraged more than $1 million, representing 17% to 75% of the individual projects’ budgets;
- 8 projects leveraged at least 29% of their project budgets; and
- 1 project in the manufacturing sector received 64% of its budget from sources external to the Department.
Additionally, some key informants mentioned the importance of industry engagement in the cost-effective delivery of the program. They agreed that having industry engagement ensures the products be useful and used by industry, therefore the investment into the project is worth the costs. Additionally, the sector case study interviewees noted that oversight by Boards of Directors, oversight committees, and industry engagement helped to keep the projects on track, and ensure that they are meeting industry needs and, therefore, were an effective use of funds.
Finally, in a demonstration of stewardship over public funds, the Program negotiated with funding recipients to reduce project budgets prior to project approval. Project budgets proposed by funding recipients were reduced by a total of over $1 million prior to the projects’ approval, according to recommendation reports. The contributions funds saved through the negotiations were made available to fund other projects.
Challenges and areas for improvement
The evaluation collected evidence of some challenges related to the Program’s cost-effectiveness and cost-efficiency. A couple of examples provided by key informants included:
- The gap between the call for concepts has been too long, with the first call occurring in fiscal year 2012 to 2013 and the most recent occurring in fiscal year 2017 to 2018. The calls could be more frequent – organizations can lose industry engagement and trust in their organization, which could affect take-up of their products.
- The time between application and funding approval (approximately 14 to 18 months for the first call) was too long. It resulted in delays to some projects.
According to the Program, these gaps were somewhat mitigated by extensions to existing projects and the provision of funding to unsolicited projects outside the call for concepts. The Program additionally noted that the high number of concepts received through the call, along with competing departmental priorities, contributed to the timelines between project applications and funding.
A few key informants and sector case study interviewees also noted their preference for the previous program and its core funding for organizations. These key informants explained that some organizations faced challenges due to the disruption in funding to sector councils, including the need for organizations to work on a project-by-project basis without assurance of funding, and delays to projects due to waiting for project funding approval. Some of these key informants perceived former sector councils to be less active, or non-existent, in their sectors since the new Program launched. They stated that the former councils were crucial to the generation and dissemination of labour market information, as well as to the engagement of industry in the development and use of the products.
In relation to the Program’s efforts to potentially become more cost effective, some of the key informants indicated the following considerations:
- Allocating more funding to the dissemination and promotion of the products to target audiences, and working with funding recipients to help with dissemination and promotional activities. If not enough investment is made in product dissemination, the value of the products to the sector diminishes rapidly and the work put into the products is wasted.
- Calls for concepts could be targeted more directly to sectors and be for specific projects needed for the sector. This could help to ensure better use of funding and better project outcomes.
- Investigating sustained funding to address longer-term issues.
- Hosting annual meetings of funding recipients to share their projects, experiences, and lessons learned.
- Investigating the possibility of more shared projects between funding recipients and even across sectors to enhancing collaboration and take a more cohesive, strategic approach, as opposed to one-off projects.
9. Conclusions
The Program addresses Government of Canada priorities and Departmental strategic outcomes. It fulfills a need in priority sectors and the labour market. The evaluation found evidence to suggest there is a continued need for the Program.
The Program has been working to improve its performance measurement, particularly how it measures outreach and outcomes. However, issues were identified with the volume of requests for performance data, the design of the questionnaire and forms, and the reliability and usefulness of the data as it is not always provided in a consistent manner by funding recipients.
The projects have had high levels of stakeholder engagement from a range of interested groups through various activities. Collaboration with stakeholders has led to the production of the expected products under all 4 business lines. Many channels are being used to disseminate products completed through the projects. Funding recipients have made efforts to disseminate products.
The evaluation also found evidence that there are opportunities to reach more stakeholders and end-user beneficiaries, particularly on the supply side of the labour market. Some concerns were raised as to whether the dissemination activities were reaching a broad enough audience and the extent to which Job Bank is an effective dissemination tool. Presently, limited data is available on the number of people who are being reached with the products and the extent to which products are being used for their intended purposes.
There is evidence that the Program and projects are contributing to the Program’s outcomes, particularly short-term outcomes such as awareness and use of products to support decision making around human resources planning, training, and skills formalization. Evidence of contributions to medium-term outcomes is mostly anecdotal, but the evaluation found some examples of systemic change in the sectors, particularly around the adoption of national occupational standards and certification products.
Overall, the Program is performing as designed and its products are making contributions toward addressing sector-specific human resources challenges, and in particular, addressing skills gaps and unfilled vacancies. There are opportunities to improve the program to be more likely to attain and measure contributions. There are opportunities to make the products even more timely and useful than they are and to reach additional beneficiaries.
10. Recommendations and considerations
2 recommendations flowed from the evaluation findings and analysis:
1) Explore ways to encourage funding recipients to strengthen product outreach and dissemination.
Although the Program is designed to focus on the demand side of the labour market, and the market’s demands, it needs to work with funding recipients to broaden and increase product take-up by certain target beneficiary groups, particularly employees and job seekers. The evaluation found that the products are already effective for many target groups, but there is an opportunity to increase their effectiveness. Information from key informant interviews, project files, and case studies indicated there are opportunities to work with funding recipients to strengthen their product outreach and dissemination plans and activities. This could help increase beneficiary participation and take-up.
2) Explore ways to improve performance measurement and increase data validity while minimizing the burden on funding recipients.
Data gathered for the evaluation indicated issues around the definition and measurement of program related outcomes. The program has tools in place to monitor projects and provide information to better understand sectoral labour market issues. However, the program could consider how to better align the reporting tools with the need to measure performance. Issues were raised about the validity of the information collected and the burden placed on funding recipients to collect data. Concerns were also noted about the length of the questionnaire, the complexity of the questions, and a lack of standardization around the interpretation and methodology used to answer the questions.
Appendix A – Sectoral Initiatives Program logic model (2016)
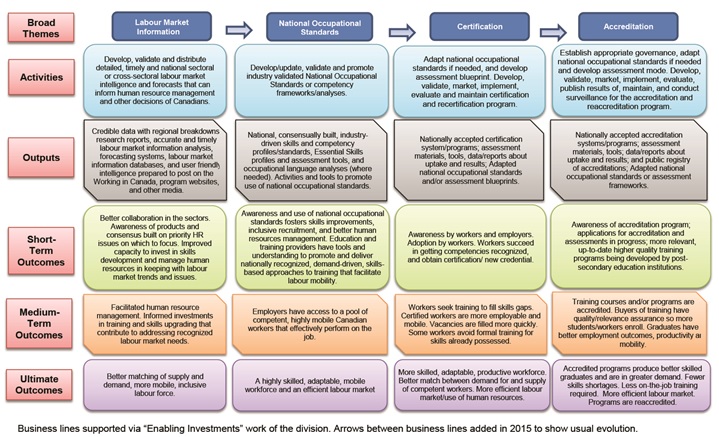
Description of Appendix A
Appendix A presents the Sectoral Initiatives Program’s logic model. The logic model outlines broad themes, activities, outputs, and outcomes the Program intends to achieve or to which it intends to contribute.
The logic model has 4 broad themes, connected by arrows pointing to the right from 1 theme to the next. The broad themes are, from left to right:
- Labour market information
- National occupational standards
- Certification
- Accreditation
The activities are arranged by broad theme. From left to right, the activities are:
- Develop, validate and distribute detailed, timely and national sectoral or cross-sectoral labour market intelligence and forecasts that can inform human resource management and other decisions of Canadians.
- Develop/update, validate and promote industry validated National Occupational Standards or competency frameworks/analyses.
- Adapt national occupational standards if needed, and develop assessment blueprint. Develop, validate, market, implement, evaluate and maintain certification and recertification program.
- Establish appropriate governance, adapt national occupational standards if needed and develop assessment mode. Develop, validate, market, implement, evaluate, publish results of, maintain, and conduct surveillance for the accreditation and reaccreditation program.
The activities are expected to produce the following outputs, again arranged by broad theme, from left to right:
- Credible data with regional breakdowns, research reports, accurate and timely labour market information analysis, forecasting systems, labour market information databases, and user friendly intelligence prepared to post on the Working in Canada, program websites, and other media.
- National, consensually built, industry-driven skills and competency profiles/standards, Essential Skills profiles and assessment tools, and occupational language analyses (where needed). Activities and tools to promote use of national occupational standards.
- Nationally accepted certification system/programs; assessment materials, tools, data/reports about uptake and results; Adapted national occupational standards and/or assessment blueprints.
- Nationally accepted accreditation systems/programs; assessment materials, tools; data/reports about uptake and results; and public registry of accreditations; Adapted national occupational standards or assessment frameworks.
The outputs are expected to contribute to the following short-term outcomes, arranged by broad theme from left to right:
- Better collaboration in the sectors. Awareness of products and consensus built on priority HR issues on which to focus. Improved capacity to invest in skills development and manage human resources in keeping with labour market trends and issues.
- Awareness and use of national occupational standards fosters skills improvements, inclusive recruitment, and better human resources management. Education and training providers have tools and understanding to promote and deliver nationally recognized, demand-driven, skills-based approaches to training that facilitate labour mobility.
- Awareness by workers and employers. Adoption by workers. Workers succeed in getting competencies recognized, and obtain certification/ new credential.
- Awareness of accreditation program; applications for accreditation and assessments in progress; more relevant, up-to-date higher quality training programs being developed by post-secondary education institutions.
The short-term outcomes are expected to contribute to the following medium-term outcomes, arranged by broad theme from left to right:
- Facilitated human resource management. Informed investments in training and skills upgrading that contribute to addressing recognized labour market needs.
- Employers have access to a pool of competent, highly mobile Canadian workers that effectively perform on the job.
- Workers seek training to fill skills gaps. Certified workers are more employable and mobile. Vacancies are filled more quickly. Some workers avoid formal training for skills already possessed.
- Training courses and/or programs are accredited. Buyers of training have quality/relevance assurance so more students/workers enroll. Graduates have better employment outcomes, productivity and mobility.
The medium-term outcomes are expected to contribute to the following ultimate outcomes, arranged by broad theme from left to right:
- Better matching of supply and demand, more mobile, inclusive labour force.
- A highly skilled, adaptable, mobile workforce and an efficient labour market.
- More skilled, adaptable, productive workforce. Better match between demand for and supply of competent workers. More efficient labour market/use of human resources.
- Accredited programs produce better skilled graduates and are in greater demand. Fewer skills shortages. Less on-the-job training required. More efficient labour market. Programs are reaccredited.
A line of text after the logic model states: Business lines supported via “Enabling Investments” work of the division. Arrows between business lines added in 2015 to show usual evolution.
Appendix B – Evaluation scope, methodology, and limitations
The evaluation covered the period of April 2011 to March 2017, inclusively. This timeframe includes projects that began prior to the Program’s launch in April 2013 but continued after that time. The coverage period was selected to allow for some comparisons and exploration of lessons learned between the Program and its predecessor, the Sector Council Program. It also allowed more completed projects to be included in the evaluation, which gave the evaluation more data.
The evaluation questions covered the following topics:
- continued need among target groups;
- alignment with priorities and comparison with similar provincial initiatives;
- use of applicable lessons learned from the Sector Council Program in the new Program’s design;
- monitoring and measuring performance;
- engaging key stakeholders within the sectors;
- adequate product dissemination to reach target groups;
- product timeliness and usefulness to target groups;
- awareness and usefulness of sectoral labour market information;
- adoption of national occupational standards for targeted occupations;
- facilitating the certification of workers’ skills;
- facilitating the accreditation of training programs;
- contributions to the development of a skilled and adaptable labour force and a more efficient labour market within targeted sectors; and
- cost-efficiency of program delivery.
From February 2017 to September 2017, the evaluation collected data from the following lines of evidence. Additional information is available upon request through technical reports.
Document and file review
The evaluation included a review of approximately 250 documents, including Government and Departmental priority-setting documents, Program documents, and project administrative files. The review covered the 44 projects that were not part of the in-depth project and sector case studies. Document and file collection ended at the end of August 2017.
Administrative data review
The administrative data review included quantitative and qualitative data collected through the Program’s annual survey of funding recipients from fiscal year 2013 to 2014 through fiscal year 2015 to 2016. Responses were received for 39 projects in fiscal year 2013 to 2014 (72% response rate) and for 30 projects in each of fiscal year 2014 to 2015 (85.7% response rate) and fiscal year 2015 to 2016 (97% response rate).
Literature review
The literature review covered 2 topics: ongoing need for the Program’s national, sectoral approach to addressing labour market efficiency and skills gaps; and alternatives and improvements to assist with cost-effectiveness. The review included 18 articles from academic and grey literature published between 2006 and 2016, as well as the Department’s 2017 Evaluation of Learning and Labour Market Information final report.
Key informant interviews
The evaluation included 45 interviews with 46 key informants, 2 of whom chose to participate in a joint interview. Key informants were selected in consultation with the Program. Table 10 presents key informants by category.
| Key informant category | Number of interviews | Number of key informants |
|---|---|---|
| Program representatives | 6 | 6 |
| Funding recipients | 10 | 10 |
| Employers and employer associations | 11 | 12 |
| Experts | 5 or fewer | 5 or fewer |
| Other stakeholders (e.g., learning institutions, unions) | 15 | 15 |
Each interview lasted approximately an hour. They were completed by telephone in the key informant’s official language of choice (French or English) between June 2017 and August 2017. Responses were aggregated using the scale presented in Figure 9:

Description of figure 9
Figure 9 presents the scale used to measure key informant interview responses. The scale is a grey rectangle that progresses from light grey on the left to steadily darker grey on the right. The lightness or darkness of the grey indicates the level of concurrence among key informants, with darker shades indicating higher levels of concurrence. Under the rectangle, text describes the categories used to weigh key informant interview responses. From left to right, categories are a few (>0% to 15%), some (>15% to 50%), most (>50% to 85%), and almost all (>85% to 100%).
Project case studies
The goal of the project case studies was to obtain a deeper understanding of 3 projects and to gather illustrative examples of the larger population of projects. Case selection criteria included the projects’ scheduled completion date (ideally on or before December 2016), project value and duration (ideally approximating the average contribution value and project duration), and collectively representing the 4 business lines across cases, to the extent possible. The Program was also asked to submit suggestions for project case studies using their own criteria, which were considered in the case study selection.
The following projects were selected:
- Forest Sector Labour Market Information;
- Raising the Skills Standard for Food and Beverage Manufacturers; and
- Advanced Manufacturing and Youth Career Development.
With some exceptions, the projects selected met most of the criteria, including the requirement that the projects be funded through the current Program.
Each project case study involved a review of project files and products, complemented by key informant interviews. The file review used internal project files, data from the annual survey of funding recipients, publicly available online information, and documents provided by funding recipients and stakeholders. Project file data collection had a cut-off date of May 2017. Key informants from 3 groups were interviewed: funding recipient organizations, sectoral stakeholders who participated in the projects, and other stakeholders and end-user beneficiaries.
Sector case studies
The goal of the sector case studies was to provide an in-depth analysis of the Program’s contributions to a sector over time and to understand how products might build on one another. For this reason, the case studies examined the products and outcomes, where possible, of multiple projects within the selected sectors. An influential case selection strategy was used to select sectors that would be most likely to have information on the effects of the Department’s long-term support for sector-based projects. Consideration was given to project timelines and stages of completion, to the total contribution amounts to active projects in the sector, to the use of all business lines across projects in the sector, and to the types of funding recipients in the sector. Case selection also considered the Program’s suggestions. The following 3 cases were selected:
- aviation and aerospace (6 projects);
- information and communication technology (5 projects); and
- mining (6 projects).
Each sector case study involved a review of Program documents, project files, and products for all projects in the sector, complemented by key informant interviews. The document and file review included the Program’s sectoral profiles, project administrative files, data from the annual survey of funding recipients publicly available online information, and documents provided by funding, recipients and sector stakeholders. Key informants from 3 groups were interviewed funding recipient organizations, stakeholders who participated in projects, and other stakeholders and end-user beneficiaries of the products.
Challenges and data limitations
All the data sources used for the evaluation contained partial outcome information, which limiting the evaluation to qualitative illustrations of contributions to outcomes. Furthermore, the annual survey of funding recipients, funding recipients’ final reports, and project close-out reports are completed during and immediately after the completion of the projects, which is premature to fully measure longer-term outcomes.
Another challenge involved the data collected from Program’s annual survey of funding recipients. In their text responses, some funding recipients noted challenges with responding to certain questions due to a lack of data collection on their part. Methodologies used by funding recipients to arrive at their input differed as well. However, the survey was the only available source of quantitative administrative and performance data that was organized in a way that permitted analysis.
Appendix C – Data on estimated beneficiaries
Table 11 lists each type of labour market information beneficiary and how many projects reported engagement with beneficiaries of that type.
| Beneficiary type | Number of projects, fiscal year 2013 to 2014 | Number of projects, fiscal year 2014 to 2015 | Number of projects, fiscal year 2015 to 2016 |
|---|---|---|---|
| Employers | 8 | 6 | 13 |
| Small and medium enterprises | 7 | 4 | 10 |
| Educators | 7 | 6 | 11 |
| Students or influencers | 5 | 2 | 5 |
| Workers/Job seekers | 6 | 3 | 6 |
| Apprentices | 1 | 1 | 0 |
| Indigenous Persons | 2 | 3 | 5 |
| Persons with Disabilities | 1 | 1 | 0 |
| Older workers | 3 | 1 | 0 |
| Newcomers | 5 | 2 | 3 |
| Employment Insurance claimants | 3 | 0 | 0 |
| Youth | 5 | 2 | 4 |
| Visible minorities | 3 | 1 | 0 |
| Other beneficiaries | 4 | 3 | 6 |
Source: The Program’s annual survey of funding recipients.
Note: Projects almost always span multiple fiscal years. As a result, some projects are represented in the table in more than 1 fiscal year.
Table 12 provides the total number of labour market information beneficiaries across projects, disaggregated by beneficiary type and fiscal year.
| Beneficiary type | Number of beneficiaries, fiscal year 2013 to 2014 | Number of beneficiaries, fiscal year 2014 to 2015 | Number of beneficiaries, fiscal year 2015 to 2016 |
|---|---|---|---|
| Employers | 12,674 | 6,458 | 17,492 |
| Small and medium enterprises | 12,719 | 5,243 | 10,361 |
| Educators | 577 | 531 | 503 |
| Students or influencers | 1,572 | 7,842 | 5,615 |
| Workers/Job seekers | 23,319 | 11,061 | 61,492 |
| Apprentices | 1 | 858 | 18,852 |
| Indigenous Persons | 243 | 461 | 18,852 |
| Persons with Disabilities | 2 | 2 | 0 |
| Older workers | 20 | 36 | 0 |
| Newcomers | 265 | 850 | 176 |
| Employment Insurance claimants | 70 | 0 | 0 |
| Youth | 550 | 1,358 | 32,763 |
| Visible minorities | 103 | 26 | 0 |
| Other beneficiaries | 25 | 23 | 157 |
| Total | 52,140 | 34,749 | 146,949 |
Source: The Program’s annual survey of funding recipients.
Note: Projects almost always span multiple fiscal years. As a result, some beneficiaries are represented in the table in more than 1 fiscal year.
Table 13 lists each type of national occupational standards beneficiary and how many projects reported engagement with beneficiaries of that type.
| Beneficiary type | Number of projects, fiscal year 2013 to 2014 | Number of projects, fiscal year 2014 to 2015 | Number of projects, fiscal year 2015 to 2016 |
|---|---|---|---|
| Employers | 3 | 2 | 4 |
| Small and medium enterprises | 2 | 2 | 3 |
| Educators | 2 | 1 | 2 |
| Students or influencers | 2 | 1 | 1 |
| Workers/Job seekers | 2 | 1 | 3 |
| Apprentices | 0 | 0 | 0 |
| Indigenous Persons | 1 | 1 | 2 |
| Persons with Disabilities | 0 | 0 | 0 |
| Older workers | 0 | 0 | 0 |
| Newcomers | 2 | 1 | 0 |
| Employment Insurance claimants | 0 | 0 | 0 |
| Youth | 2 | 1 | 0 |
| Visible minorities | 0 | 0 | 0 |
| Other beneficiaries | 0 | 1 | 1 |
Source: The Program’s annual survey of funding recipients.
Note: Projects almost always span multiple fiscal years. As a result, some projects are represented in the table in more than 1 fiscal year.
| Beneficiary type | Number of beneficiaries, fiscal year 2013 to 2014 | Number of beneficiaries, fiscal year 2014 to 2015 | Number of beneficiaries, fiscal year 2015 to 2016 |
|---|---|---|---|
| Employers | 5,209 | 649 | 6,055 |
| Small and medium enterprises | 3,642 | 572 | 4,227 |
| Educators | 24 | 238 | 80 |
| Students or influencers | 880 | 542 | 990 |
| Workers/Job seekers | 2,916 | 9,463 | 0 |
| Apprentices | 0 | 0 | 3,360 |
| Indigenous Persons | 229 | 50 | 0 |
| Persons with Disabilities | 0 | 0 | 343 |
| Older workers | 0 | 0 | 0 |
| Newcomers | 125 | 50 | 0 |
| Employment Insurance claimants | 0 | 0 | 0 |
| Youth | 210 | 180 | 0 |
| Visible minorities | 0 | 0 | 0 |
| Other beneficiaries | 0 | 1 | 8 |
| Total | 13,235 | 11,745 | 15,063 |
Source: The Program’s annual survey of funding recipients.
Note: Projects almost always span multiple fiscal years. As a result, some beneficiaries are represented in the table in more than 1 fiscal year.