
6. Canadian Indicators for the United Nations Convention on the Rights of Persons with Disabilities (CRPD) - article 20: personal mobility
On this page
Alternate formats
A PDF version of the Canadian Indicators for the United Nations Convention on the Rights of Persons with Disabilities is available on the index page.
6.1 Requiring mobility-related aids or devices
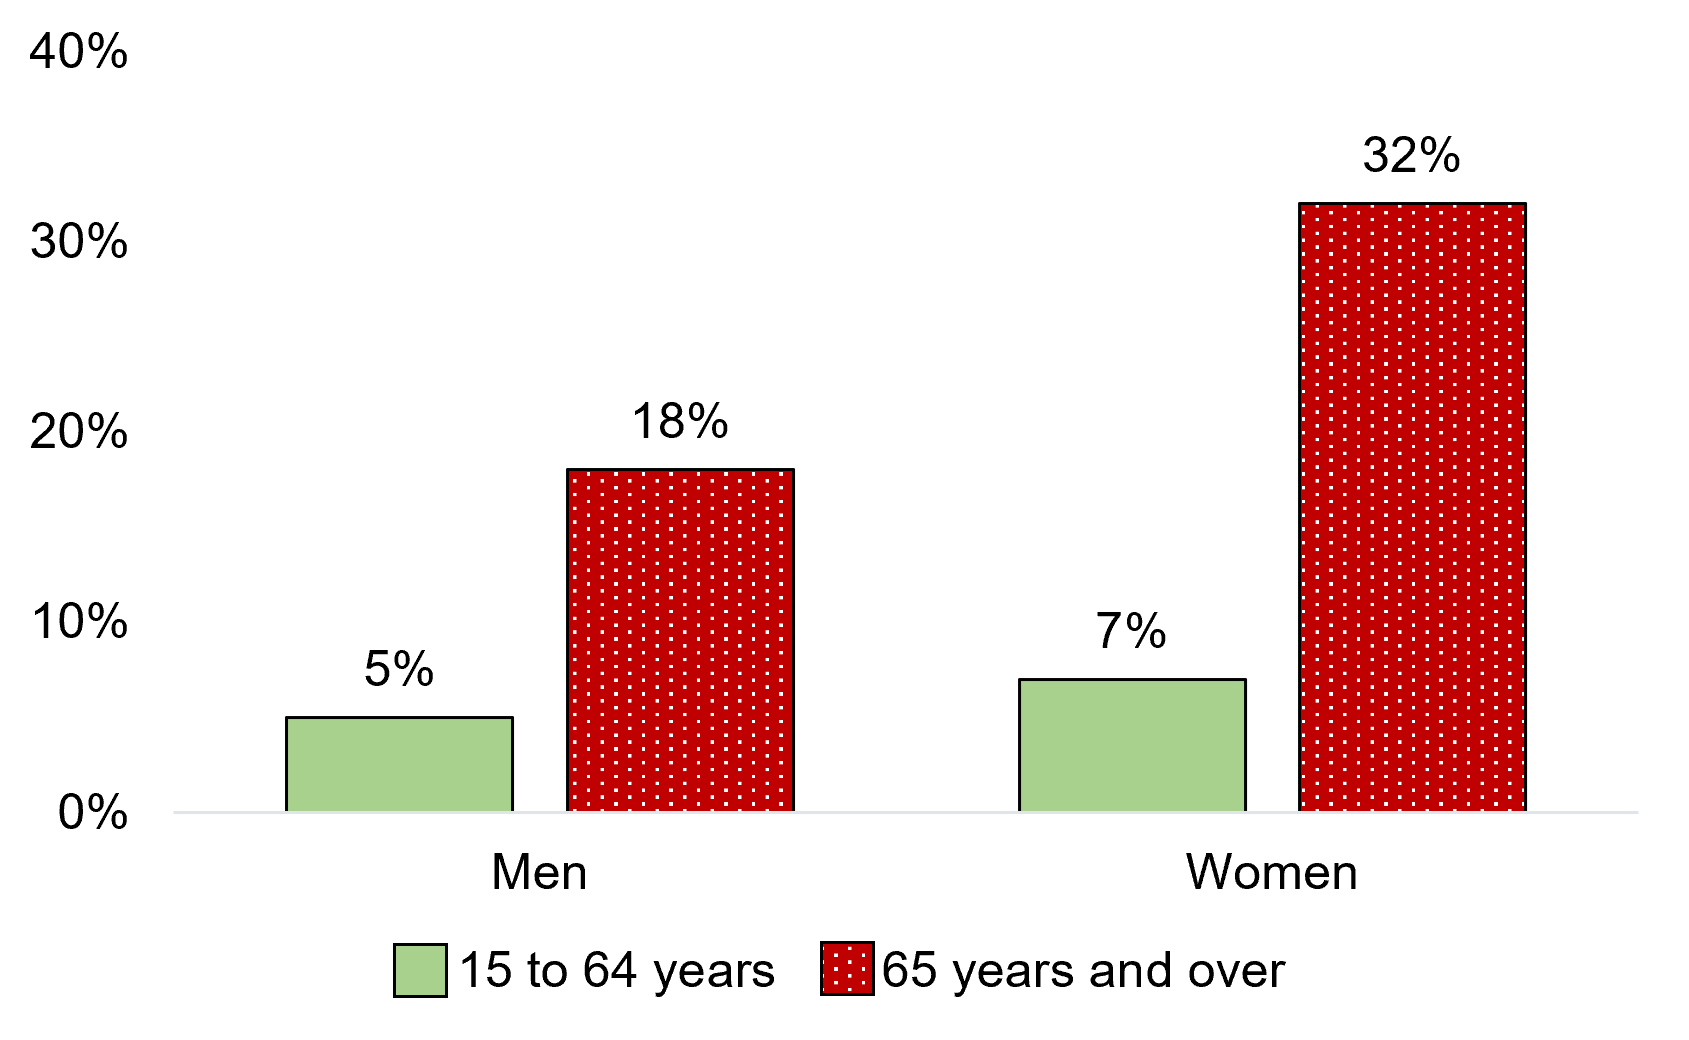
Figure 6.1 – Text description
| Gender | 15 to 64 years | 65 years and over |
|---|---|---|
| Men+ | 28% | 47%* |
| Women+ | 31% | 61%* |
- *significantly different from estimate for persons with physical disabilities aged 15 to 64 years in the same gender category (p<0.05)
- Notes: Respondents with physical disabilities (this includes mobility, flexibility, or dexterity disabilities) were asked about their use of or need for mobility-related aids or devices. These include canes, walking sticks, or crutches; walkers; scooters; and manual or motorized wheelchairs. The proportions above indicate requiring such aids or devices among persons with physical disabilities.
- To protect the confidentiality of non-binary persons, a two-category gender variable was used, given the relatively small size of this population in Canada. Non-binary persons were redistributed into the men and women categories, denoted as “men+” and “women+” in charts and tables. The “men+” category includes cisgender and transgender men and boys, as well as some non-binary persons; and the “women+” category includes cisgender and transgender women and girls, as well as some non-binary persons.
- *significantly different from estimate for persons with physical disabilities aged 15 to 64 years in the same gender category (p<0.05)
- Differences between men and women were statistically significant only among persons with physical disabilities aged 65 years and over (p<0.05).
- Source: Statistics Canada, Canadian Survey on Disability, 2022 (Social Research Division calculations).
Among men with physical disabilities, those aged 65 years and over were more likely than those aged 15 to 64 years to require mobility-related aids or devices (47% versus 28%). Women with physical disabilities aged 65 years and over were also nearly twice as likely as those aged 15 to 64 years to require these aids or devices (61% versus 31%). Among persons with physical disabilities aged 65 years and over, women were more likely than men to require mobility-related aid or devices (61% versus 47%).
6.2 Having unmet needs for mobility-related aids or devices
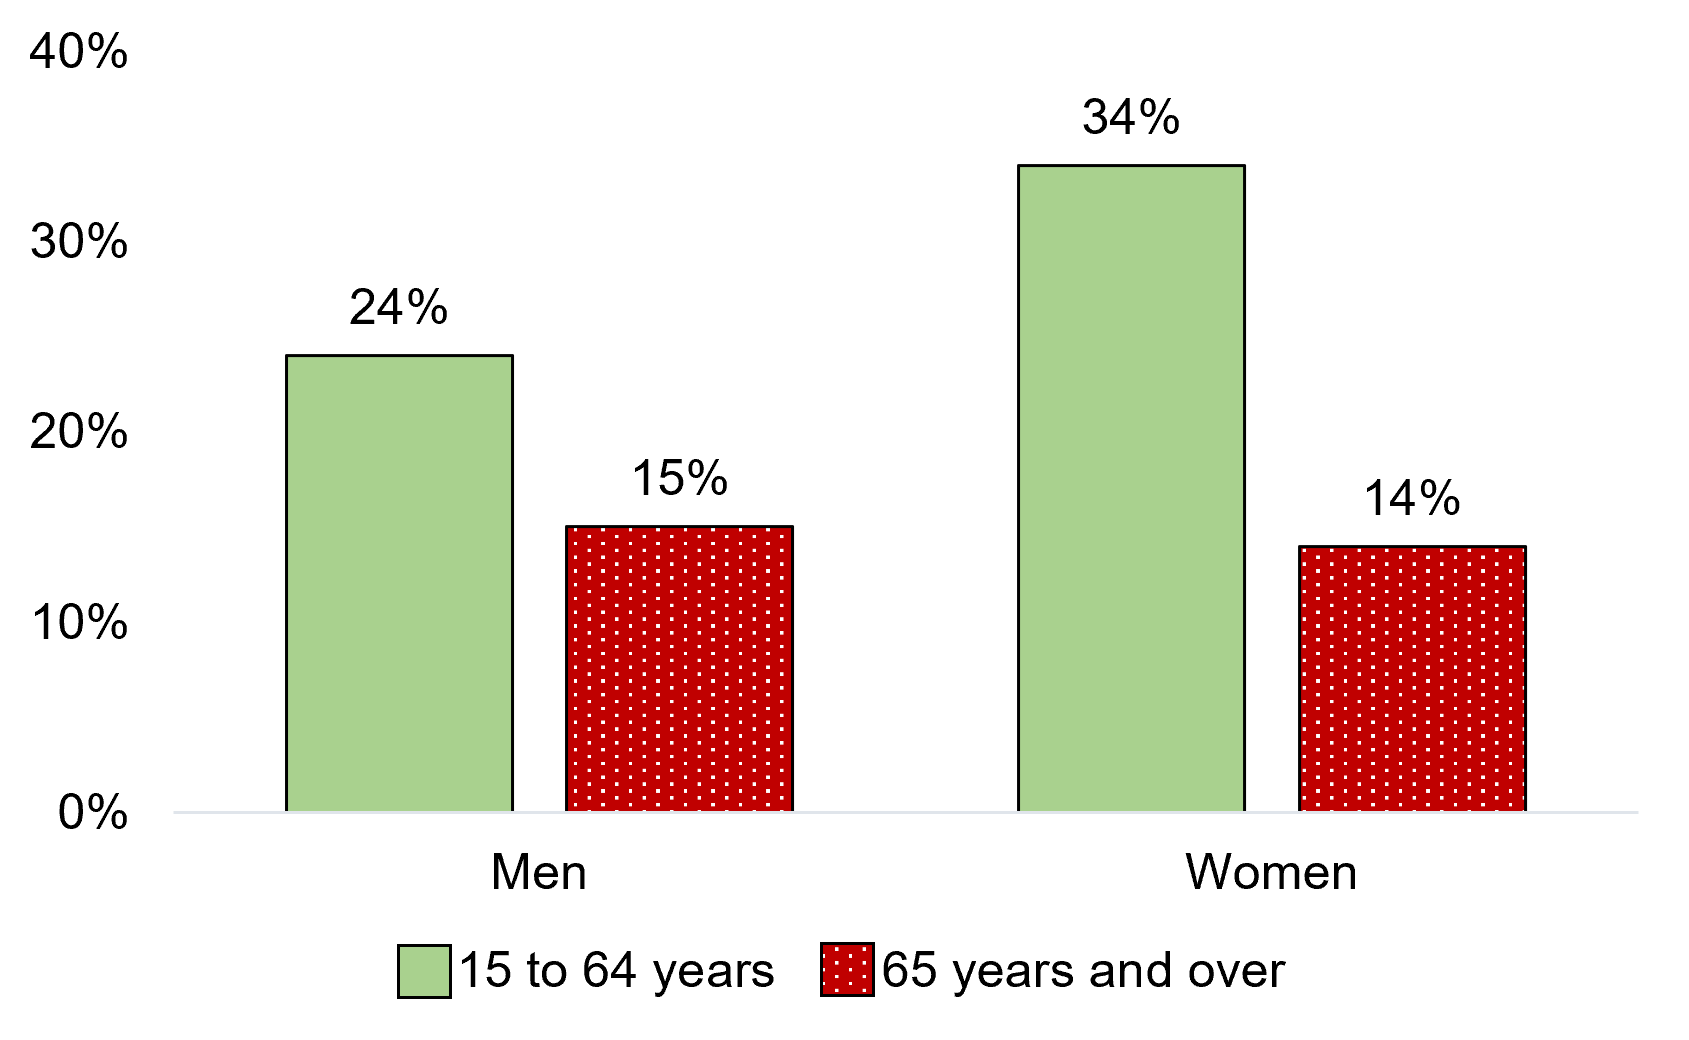
Figure 6.2 – Text description
| Gender | 15 to 64 years | 65 years and over |
|---|---|---|
| Men+ | 17% | 11%* |
| Women+ | 23% | 9%* |
- *significantly different from estimate for persons with physical disabilities aged 15 to 64 years in the same gender category (p<0.05)
- Notes: Respondents with physical disabilities (this includes mobility, flexibility, or dexterity disabilities) were asked about their use of or need for mobility-related aids or devices. These include canes, walking sticks, or crutches; walkers; scooters; and manual or motorized wheelchairs. The proportions above indicate unmet needs among persons with physical disabilities who require mobility-related aids or devices.
- To protect the confidentiality of non-binary persons, a two-category gender variable was used, given the relatively small size of this population in Canada. Non-binary persons were redistributed into the men and women categories, denoted as “men+” and “women+” in charts and tables. The “men+” category includes cisgender and transgender men and boys, as well as some non-binary persons; and the “women+” category includes cisgender and transgender women and girls, as well as some non-binary persons.
- *significantly different from estimate for persons with physical disabilities aged 15 to 64 years in the same gender category (p<0.05)
- Differences between men and women are not statistically significant for both age groups (p<0.05).
- Source: Statistics Canada, Canadian Survey on Disability, 2022 (Social Research Division calculations).
Among men with physical disabilities, those aged 15 to 64 years were more likely than those aged 65 years and over to report unmet needs for mobility-related aids or devices (17% versus 11%).
Among women with physical disabilities, unmet needs for these aids or devices were also higher for those aged 15 to 64 years than those aged 65 years and over (23% versus 9%).
6.3 Being housebound
Figure 6.3 – Text description
| Frequency of being housebound | Milder disabilities | More severe disabilities |
|---|---|---|
| Rarely | 11% | 10% |
| Sometimes | 14% | 31%* |
| Often | 3% | 19%* |
| Always | 0.4% | 8%* |
- *significantly different from estimate for persons with milder disabilities in the same response category (p<0.05)
- Notes: Respondents were asked if they considered themselves to be housebound due to their condition and were given the following answer categories: “No”, “Rarely”, “Sometimes”, “Often”, or “Always”. The chart above shows estimates for those who considered themselves housebound at least “Rarely”.
- Respondents who answered the survey themselves were asked this question; proxy respondents were excluded. Respondents were instructed that they are considered “housebound” when they are unable to leave their home environment due to their condition. They were specifically asked to exclude instances of being housebound resulting from COVID-19 pandemic restrictions imposed by government or public health authorities.
- "Milder" refers to those with mild or moderate disabilities, and "more severe" refers to those with severe or very severe disabilities.
- *significantly different from estimate for persons with milder disabilities in the same response category (p<0.05)
- Source: Statistics Canada, Canadian Survey on Disability, 2022 (Social Research Division calculations).
Persons with more severe disabilities were more likely than those with milder disabilities to consider themselves housebound sometimes (31% versus 14%), often (19% versus 3%), and always (8% versus 0.4%).
6.4 Reasons for being housebound

Figure 6.4 – Text description
| Reason | Men+ | Women+ |
|---|---|---|
| Condition or health problem fluctuates | 58% | 58% |
| No motivation, lack desire or not interested | 43% | 49%* |
| Condition or health problem aggravated when out | 43% | 43% |
| Mobility restrictions | 37% | 34% |
| Weather conditions or seasonal limitations | 29% | 33%* |
| Financial reasons | 29% | 24%* |
| Social connections outside home are limited | 28% | 26% |
| Do not feel safe when leaving home | 19% | 23%* |
| No attendant or companion available to help | 10% | 11% |
| Accessible transportation not available/unreliable | 9% | 9% |
| Destinations are not accessible | 7% | 7% |
| Other | 10% | 9% |
- *significantly different from estimate for men with disabilities for a given reason (p<0.05)
- Notes: The estimates above refer to the proportion reporting a given reason among those who considered themselves housebound. Respondents who answered the survey themselves were asked this question; proxy respondents were excluded. Respondents were instructed that they are considered “housebound” when they are unable to leave their home environment due to their condition. They were specifically asked to exclude instances of being housebound resulting from COVID-19 pandemic restrictions imposed by government or public health authorities.
- To protect the confidentiality of non-binary persons, a two-category gender variable was used, given the relatively small size of this population in Canada. Non-binary persons were redistributed into the men and women categories, denoted as “men+” and “women+” in charts and tables. The “men+” category includes cisgender and transgender men and boys, as well as some non-binary persons; and the “women+” category includes cisgender and transgender women and girls, as well as some non-binary persons.
- *significantly different from estimate for men with disabilities for a given reason (p<0.05)
- Source: Statistics Canada, Canadian Survey on Disability, 2022 (Social Research Division calculations).
Among men and women with disabilities aged 15 years and over who considered themselves housebound, the most common reason reported for being housebound was “condition or health problem fluctuates ” (58% of both men and women), followed by “no motivation, lack desire or not interested” (43% of men and 49% of women) and “condition or health problem aggravated when out” (43% of both men and women).