
7. Canadian Indicators for the United Nations Convention on the Rights of Persons with Disabilities (CRPD) - article 24: education
On this page
Alternate formats
A PDF version of the Canadian Indicators for the United Nations Convention on the Rights of Persons with Disabilities is available on the index page.
7.1 Attendance at educational institutions

Figure 7.1 - Text description
| Year | Gender | Persons with disabilities | Persons without disabilities |
|---|---|---|---|
| 2016 | Men | 52% | 53% |
| 2016 | Women | 52% | 56%* |
| 2021 | Men+ | 43% | 49%* |
| 2021 | Women+ | 52% | 56% |
- *significantly different from estimate for persons with disabilities within the same year and gender category (p<0.05)
- Notes: The estimates above are based on data obtained from the 2016 and 2021 Census of Population. The 2016 estimates are for persons who attended any accredited educational institution between September 2015 and May 2016. The 2021 estimates are for persons who attended any accredited educational institution between September 2020 and May 2021.
- Educational institutions include school, college, CEGEP, or university.
- For 2021 data, the "men+" category includes cisgender and transgender men and boys, as well as some non-binary persons; and the "women+" category includes cisgender and transgender women and girls, as well as some non-binary persons. To protect the confidentiality of non-binary persons, a two-category gender variable was used, given the relatively small size of this population in Canada. Non-binary persons were redistributed into the men and women categories, denoted as "men+" and "women+" in charts and tables.
- * significantly different from estimate for persons with disabilities within the same year and gender category (p<0.05)
- For 2016, differences between men and women are statistically significant only for persons without disabilities (p<0.05).
- For 2021, differences between men and women are statistically significant for both persons with and without disabilities (p<0.05).
- Differences between 2016 and 2021 are statistically significant only for men with disabilities and men without disabilities (p<0.05).
- Source: Statistics Canada, Canadian Survey on Disability, 2017 and 2022 (Social Research Division calculations).
In 2016, among women aged 15 to 29 years, those with disabilities were less likely to be attending educational institutions than women without disabilities (52% versus 56%). While the estimated proportions for women were similar in both 2016 and 2021, the difference between those with and without disabilities was no longer statistically significant in 2021. In contrast, for men aged 15 to 29 years in 2016, the proportion attending educational institutions was similar for those with disabilities (52%) and for those without disabilities (53%). The proportions were lower in 2021, and men with disabilities were less likely to be attending educational institutions than men without disabilities (43% versus 49%).
7.2 Educational attainment

Figure 7.2 - Text description
| Highest educational attainment | Persons with disabilities | Persons without disabilities |
|---|---|---|
| Less than high school | 13% | 9%* |
| High school | 25% | 22%* |
| College, trade, or certificate | 37% | 33%* |
| Bachelor or above | 25% | 36%* |
- * significantly different from estimate for persons with disabilities in a given level of education (p<0.05)
- Note: The estimates above are based on data obtained from the 2021 Census of Population.
- * significantly different from estimate for persons with disabilities in a given level of education (p<0.05)
- Source: Statistics Canada, Canadian Survey on Disability, 2022 (Social Research Division calculations).
Persons with disabilities had lower levels of educational attainment than persons without disabilities. Among persons aged 25 to 64 years, a smaller proportion of those with disabilities than those without disabilities reported "bachelor or above" as their highest level of education (25% versus 36%). For other levels of education, proportions were higher for persons with disabilities than those without disabilities: less than high school (13% versus 9%), high school (25% versus 22%), and college, trade, or certificate (37% versus 33%).
7.3 Discontinuing education

Figure 7.3 - Text description
| Gender | Milder disabilities | More severe disabilities |
|---|---|---|
| Men+ | 21% | 30% |
| Women+ | 19% | 44%* |
- * significantly different from estimate for students with milder disabilities within the same gender category (p<0.05)
- Notes: Respondents were asked whether they ever discontinued their formal education or training because of their condition. Estimates above are for respondents who answered "Yes".
- The estimates above include persons with disabilities either currently attending school, college, CEGEP, or university or last attended in 2021 or 2022 and had a disability at the time.
- "Milder" refers to those with mild or moderate disabilities, and "more severe" refers to those with severe or very severe disabilities.
- To protect the confidentiality of non-binary persons, a two-category gender variable was used, given the relatively small size of this population in Canada. Non-binary persons were redistributed into the men and women categories, denoted as "men+" and "women+" in charts and tables. The "men+" category includes cisgender and transgender men and boys, as well as some non-binary persons; and the "women+" category includes cisgender and transgender women and girls, as well as some non-binary persons.
- *significantly different from estimate for students with milder disabilities within the same gender category (p<0.05)
- Differences between men and women are statistically significant only for persons with more severe disabilities (p<0.05).
- Source: Statistics Canada, Canadian Survey on Disability, 2022 (Social Research Division calculations).
Among students aged 15 to 29 years, women with more severe disabilities (44%) were more likely to have ever discontinued their education due to their condition than women with milder disabilities (19%).
7.4 School accommodations
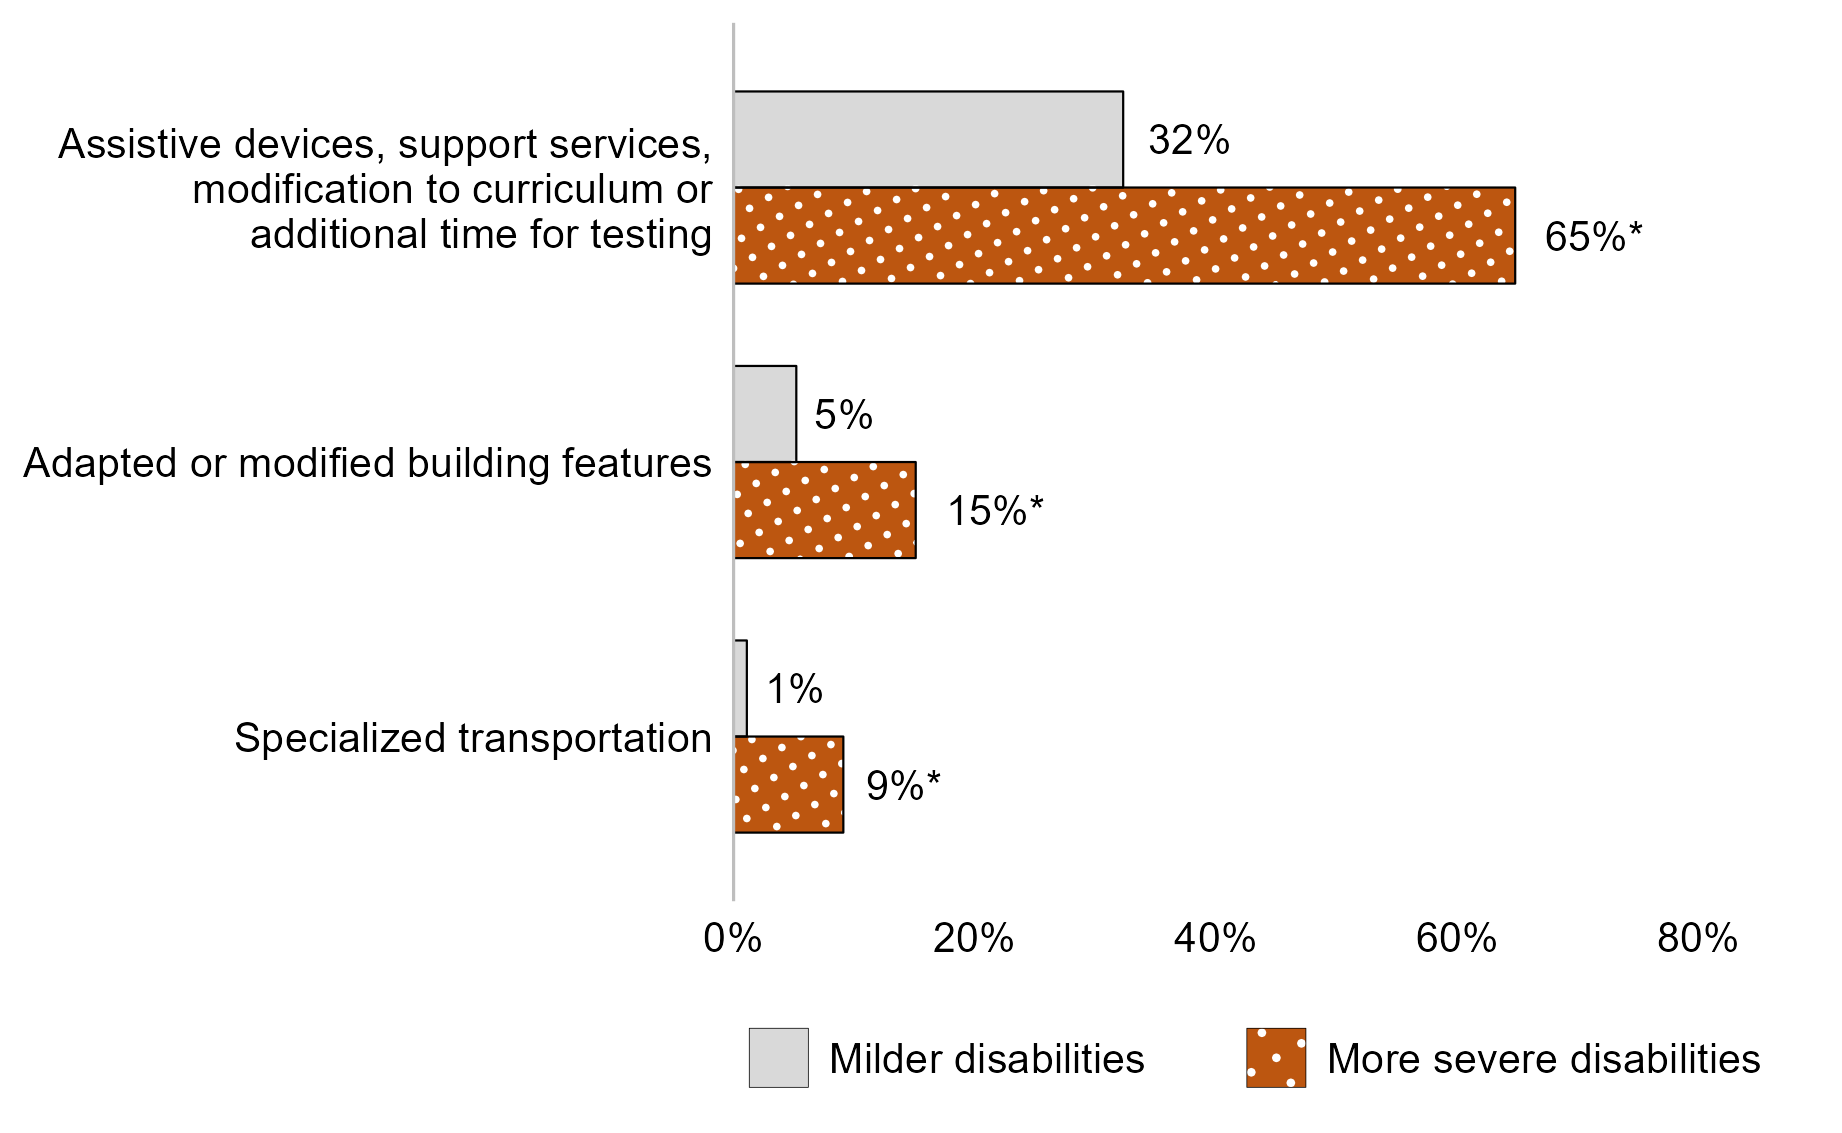
Figure 7.4 - Text description
| School accommodation | Milder disabilities | More severe disabilities |
|---|---|---|
| Assistive devices, support services, modification to curriculum or additional time for testing | 32% | 65%* |
| Adapted or modified building features | 5% | 15%* |
| Specialized transportation | 1% | 9%* |
- * significantly different from estimate for students with milder disabilities for a given school accommodation (p<0.05)
- Notes: The estimates above include persons with disabilities either currently attending school, college, CEGEP, or university or last attended in 2021 or 2022 and had a disability at the time.
- Adapted or modified building features may include accessible classrooms, adapted washrooms, ramps, elevators, etc.
- "Milder" refers to those with mild or moderate disabilities, and "more severe" refers to those with severe or very severe disabilities.
- * significantly different from estimate for students with milder disabilities for a given school accommodation (p<0.05)
- Source: Statistics Canada, Canadian Survey on Disability, 2022 (Social Research Division calculations).
Students with more severe disabilities were more likely to require school accommodations than those with milder disabilities. For example, 65% of students with more severe disabilities required assistive devices, support services, modifications to curricula, or additional time for testing. This compares with 32% of those with milder disabilities.
7.5 Requirements and needs met for educational accommodations
| Type of educational accommodation | Required | Needs met |
|---|---|---|
| Extended time to take tests and exams | 79% | 82% |
| Computer, laptop, or tablet with specialized software or apps or other adaptations | 47% | 69% |
| Quiet room or sensory room | 46% | 70% |
| Individualized Education Plan (IEP) | 39% | 74% |
| Recording equipment or a portable note-taking device | 32% | 48% |
| Modified or adapted course curriculum | 31% | 77% |
| Educational assistant or tutor | 31% | 58% |
| Sensory objects | 25% | 45% |
| Cell phone, smartphone, or smartwatch with specialized features or apps | 25% | 55% |
| Textbooks in e-format | 24% | 62% |
| Device for playing audio books or e-books | 21% | 44% |
| Special education classes | 10% | 75% |
- Notes: The estimates above include persons with disabilities either currently attending school, college, CEGEP, or university or last attended in 2021 or 2022 and had a disability at the time. Estimates for needs met are among those who required a given educational accommodation.
- Source: Statistics Canada, Canadian Survey on Disability, 2022 (Social Research Division calculations).
Among students with disabilities aged 15 to 29 years, the most commonly required educational accommodation was extended time to take tests and exams (79%). The need for this accommodation was met for 82% of those who required it. The second most frequently required educational accommodation among students with disabilities aged 15 to 29 years was a computer, laptop, or tablet with specialized software or apps or other adaptations (47%). The need for this accommodation was met for 69% of those who required it.
7.6 Experiences of bullying at school among students with disabilities
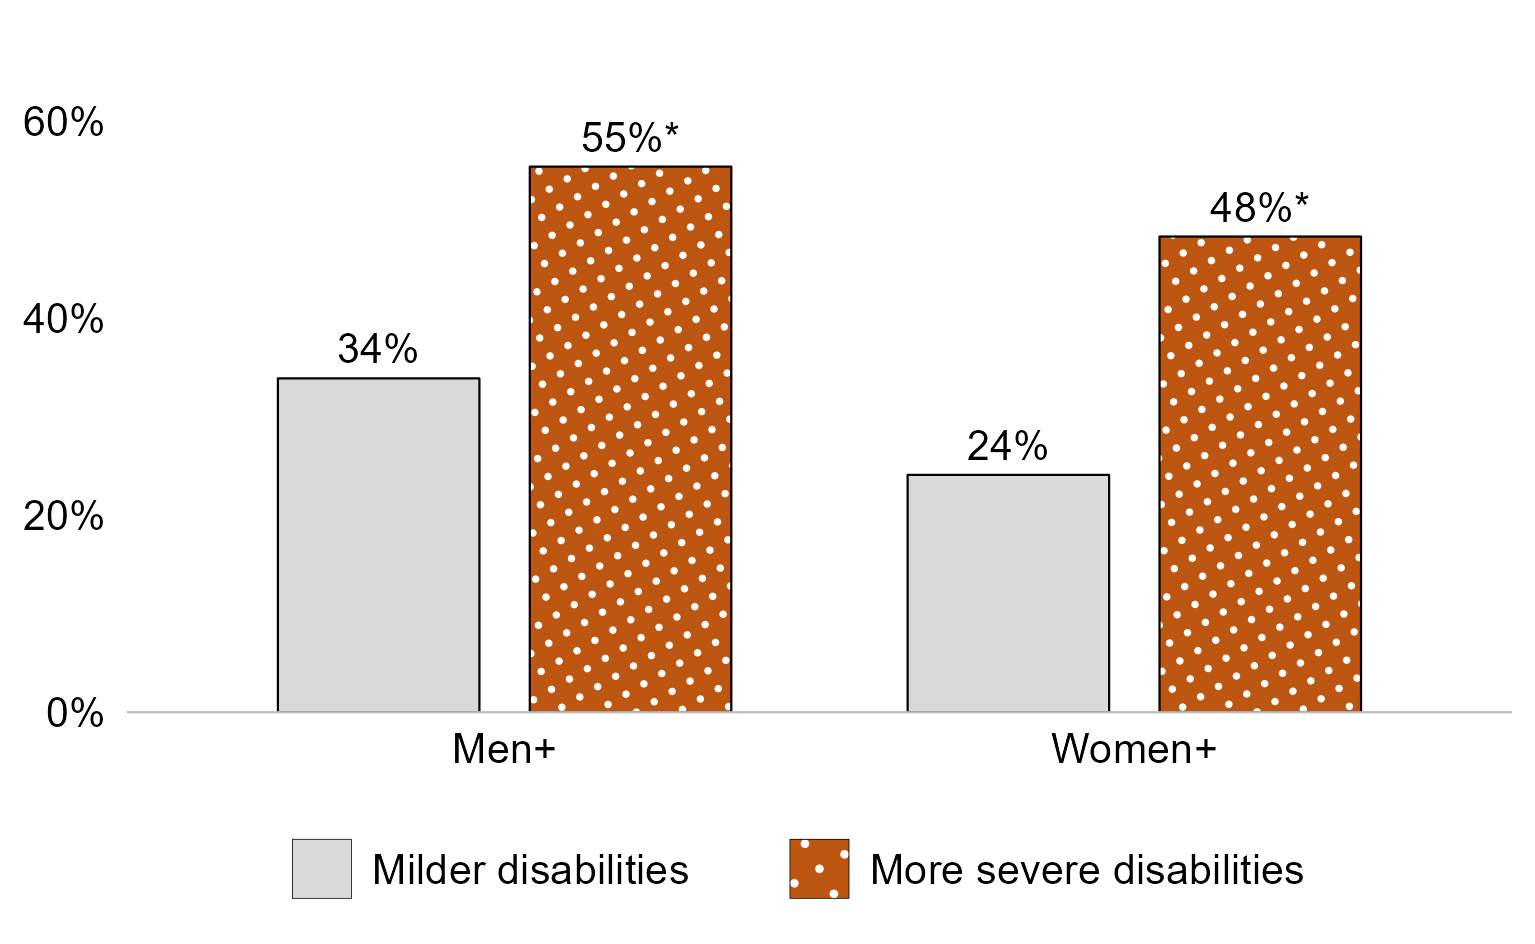
Figure 7.5 - Text description
| Gender | Milder disabilities | More severe disabilities |
|---|---|---|
| Men+ | 34% | 55%* |
| Women+ | 24% | 48%* |
- *significantly different from estimate for students with milder disabilities within the same gender category (p<0.05)
- Notes: The estimates above include persons with disabilities either currently attending school, college, CEGEP, or university or last attended in 2021 or 2022 and had a disability at the time.
- "Milder" refers to those with mild or moderate disabilities, and "more severe" refers to those with severe or very severe disabilities.
- To protect the confidentiality of non-binary persons, a two-category gender variable was used, given the relatively small size of this population in Canada. Non-binary persons were redistributed into the men and women categories, denoted as "men+" and "women+" in charts and tables. The "men+" category includes cisgender and transgender men and boys, as well as some non-binary persons; and the "women+" category includes cisgender and transgender women and girls, as well as some non-binary persons.
- * significantly different from estimate for students with milder disabilities within the same gender category (p<0.05)
- Differences between men and women are statistically significant only for students with milder disabilities (p<0.05).
- Source: Statistics Canada, Canadian Survey on Disability, 2022 (Social Research Division calculations).
Students aged 15 to 29 years with more severe disabilities were more likely to report experiencing bullying at school than those with milder disabilities. Among men, 55% of those with more severe disabilities experienced bullying at school, compared with 34% of those with milder disabilities. Women with more severe disabilities were around twice as likely as women with milder disabilities to experience bullying at school (48% versus 24%).