
8. Canadian Indicators for the United Nations Convention on the Rights of Persons with Disabilities (CRPD) - article 25: health
On this page
- 8.1 Unable to buy prescription medications due to cost
- 8.2 Self-reported good to excellent general health
- 8.3 Self-reported good to excellent mental health
- 8.4 Unmet needs for physiotherapy, massage therapy, or chiropractic treatments
- 8.5 Unmet needs for counselling services
- 8.6 Receiving help or care for a long-term health condition or disability
Alternate formats
A PDF version of the Canadian Indicators for the United Nations Convention on the Rights of Persons with Disabilities is available on the index page.
8.1 Unable to buy prescription medications due to cost

Figure 8.1 – Text description
| Age group | Milder disabilities | More severe disabilities |
|---|---|---|
| 15 to 64 years | 7% | 20%* |
| 65 years and over | 3% | 6%* |
- * significantly different from estimate for persons with milder disabilities within the same age group (p<0.05)
- Notes: Respondents were asked if in the past 12 months they were ever unable to get prescription medications they were supposed to take because of the cost.
- "Milder" refers to those with mild or moderate disabilities, and "more severe" refers to those with severe or very severe disabilities.
- * significantly different from estimate for persons with milder disabilities within the same age group (p<0.05)
- For both levels of severity, estimates for persons aged 65 years and over are significantly different from those for persons aged 15 to 64 years (p<0.05).
- Source: Statistics Canada, Canadian Survey on Disability, 2022 (Social Research Division calculations).
Among persons with disabilities aged 15 to 64 years, those with more severe disabilities were almost 3 times as likely as those with milder disabilities to not be able to get prescription medications due to cost (20% versus 7%). Persons aged 65 years and over with more severe disabilities were twice as likely as those with milder disabilities to not be able to get prescription medications due to cost (6% versus 3%). Persons aged 15 to 64 years were more likely than those aged 65 years and over to not be able to get prescription medications due to cost for both severity levels: milder disabilities (7% versus 3%) and more severe disabilities (20% versus 6%).
8.2 Self-reported good to excellent general health

Figure 8.2 – Text description
| Gender | Persons with disabilities | Persons without disabilities |
|---|---|---|
| Men+ | 78% | 97%* |
| Women+ | 77% | 97%* |
- * significantly different from estimate for persons with disabilities in the same gender category (p<0.05)
- Notes: Respondents were asked to rate their health in general on a 5-point scale with the following options: “excellent”, “very good”, “good”, “fair”, “poor”. The percentages above refer to those who described their general health as “good”, “very good”, or “excellent”.
- To protect the confidentiality of non-binary persons, a two-category gender variable was used, given the relatively small size of this population in Canada. Non-binary respondents were redistributed into the men and women categories, denoted as “men+” and “women+” in charts and tables.
- * significantly different from estimate for persons with disabilities in the same gender category (p<0.05)
- Differences between men and women are not statistically significant for both persons with and without disabilities (p<0.05).
- Source: Statistics Canada, General Social Survey - Social Identity, 2020 (Social Research Division calculations).
Persons with disabilities were less likely than those without disabilities to rate their general health as “good”, “very good”, or “excellent”. Among persons with disabilities, 78% of men and 77% of women reported good to excellent general health. This compares to 97 % of men and 97% of women without disabilities.
8.3 Self-reported good to excellent mental health
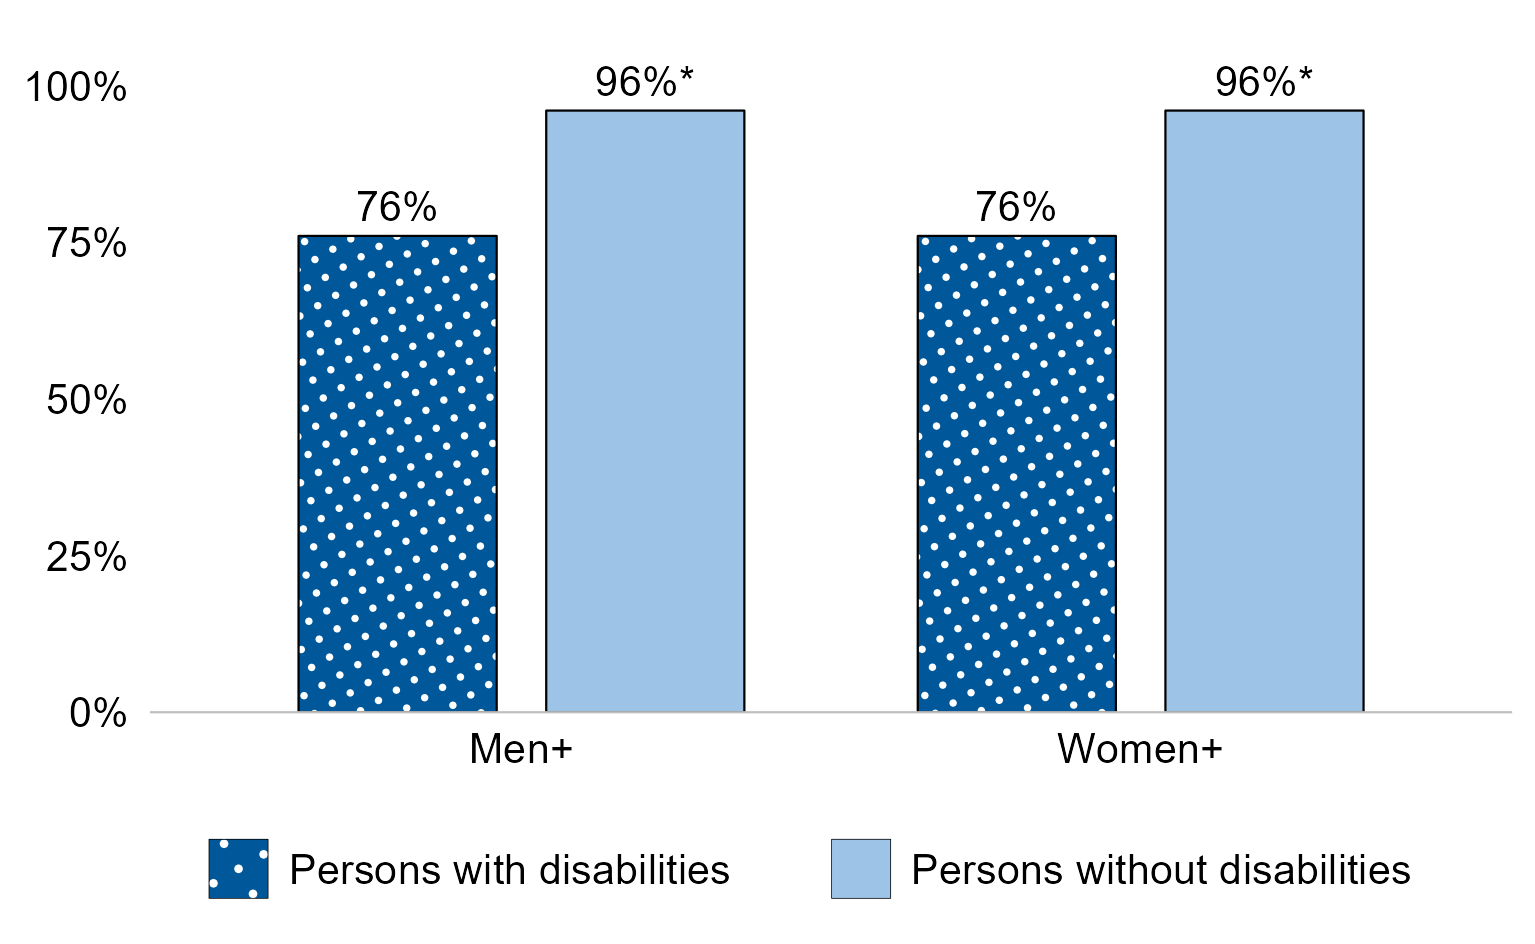
Figure 8.3 – Text description
| Gender | Persons with disabilities | Persons without disabilities |
|---|---|---|
| Men+ | 76% | 96%* |
| Women+ | 76% | 96%* |
- * significantly different from estimate for persons with disabilities in the same gender category (p<0.05)
- Notes: Respondents were asked to rate their mental health on a 5-point scale with the following options: “excellent”, “very good”, “good”, “fair”, “poor”. The estimates above refer to those who described their mental health as “good”, “very good”, or “excellent”.
- To protect the confidentiality of non-binary persons, a two-category gender variable was used, given the relatively small size of this population in Canada. Non-binary respondents were redistributed into the men and women categories, denoted as “men+” and “women+” in charts and tables.
- * significantly different from estimate for persons with disabilities in the same gender category (p<0.05)
- Differences between men and women are not statistically significant for both persons with and without disabilities (p<0.05).
- Source: Statistics Canada, General Social Survey - Social Identity, 2020 (Social Research Division calculations).
Persons with disabilities were less likely than persons without disabilities to rate their mental health as “good”, “very good”, or “excellent”. About 76% of men and 76% of women with disabilities reported good to excellent mental health. This compares to 96 % of men and 96% of women without disabilities.
8.4 Unmet needs for physiotherapy, massage therapy, or chiropractic treatments

Figure 8.4 – Text description
| Gender | Milder disabilities | More severe disabilities |
|---|---|---|
| Men+ | 61% | 77%* |
| Women+ | 66% | 77%* |
- * significantly different from estimate for persons with milder disabilities in the same gender category (p<0.05)
- Notes: The estimates above refer to unmet needs among persons with disabilities who required physiotherapy, massage therapy, or chiropractic treatments in the last 12 months. Within this group, those who did not receive these supports, or received some but not enough of them, are defined as having unmet needs.
- "Milder" refers to those with mild or moderate disabilities, and "more severe" refers to those with severe or very severe disabilities.
- To protect the confidentiality of non-binary persons, a two-category gender variable was used, given the relatively small size of this population in Canada. Non-binary persons were redistributed into the men and women categories, denoted as “men+” and “women+” in charts and tables. The “men+” category includes cisgender and transgender men and boys, as well as some non-binary persons; and the “women+” category includes cisgender and transgender women and girls, as well as some non-binary persons.
- * significantly different from estimate for persons with milder disabilities in the same gender category (p<0.05)
- For both levels of severity, differences between men and women are not statistically significant (p<0.05).
- Source: Statistics Canada, Canadian Survey on Disability, 2022 (Social Research Division calculations).
Regardless of disability severity or gender, the majority of persons with disabilities who required physiotherapy, massage therapy, or chiropractic treatments did not receive all of the therapy or treatments they needed in the preceding 12 months. Persons with more severe disabilities (77% of men and 77% of women) were more likely to report having unmet needs for physiotherapy, massage therapy, or chiropractic treatments than those with milder disabilities (61% of men and 66% of women).
8.5 Unmet needs for counselling services

Figure 8.5 – Text description
| Gender | Milder disabilities | More severe disabilities |
|---|---|---|
| Men+ | 65% | 72%* |
| Women+ | 66% | 74%* |
- * significantly different from estimate for persons with milder disabilities in the same gender category (p<0.05)
- Notes: The estimates above refer to unmet needs among persons with disabilities who required counselling services from a psychologist, psychiatrist, psychotherapist, or social worker in the last 12 months. Within this group, those who did not receive these services, or received some but not enough of them, are defined as having unmet needs.
- "Milder" refers to those with mild or moderate disabilities, and "more severe" refers to those with severe or very severe disabilities.
- To protect the confidentiality of non-binary persons, a two-category gender variable was used, given the relatively small size of this population in Canada. Non-binary persons were redistributed into the men and women categories, denoted as “men+” and “women+” in charts and tables. The “men+” category includes cisgender and transgender men and boys, as well as some non-binary persons; and the “women+” category includes cisgender and transgender women and girls, as well as some non-binary persons.
- * significantly different from estimate for persons with milder disabilities in the same gender category (p<0.05)
- For both levels of severity, differences between men and women are not statistically significant (p<0.05).
- Source: Statistics Canada, Canadian Survey on Disability, 2022 (Social Research Division calculations).
Regardless of disability severity or gender, the majority of persons with disabilities who required counselling services did not receive all of the services they needed in the preceding 12 months. Persons with more severe disabilities (72% of men and 74% of women) were more likely to report unmet needs for counselling services than those with milder disabilities (65% of men and 66% of women).
8.6 Receiving help or care for a long-term health condition or disability

Figure 8.6 – Text description
| Sex | Persons with disabilities | Persons without disabilities |
|---|---|---|
| Men | 22% | 3%* |
| Women | 22% | 3%* |
- * significantly different from estimate for persons with disabilities of the same sex (p<0.05)
- Notes: Respondents were asked if they received help or care for a long-term health condition or a physical or mental disability in the last 12 months. A long-term health condition refers to a condition that has lasted or is expected to last 6 months or longer.
- Respondents were instructed that help may come from family, friends, neighbours, paid workers, or organizations, and may include help with driving, shopping, housework, personal care, or anything else.
- The estimates in the chart above refer only to non-institutionalized persons receiving care. The target population for the 2018 General Social Survey is all non-institutionalized persons aged 15 years and over, living in the 10 provinces of Canada.
- * significantly different from estimate for persons with disabilities of the same sex (p<0.05)
- Differences between men and women are not statistically significant for both persons with and without disabilities (p<0.05).
- Source: Statistics Canada, General Social Survey - Caregiving and Care Receiving, 2018 (Social Research Division calculations).
Both men and women with disabilities were over 7 times more likely than men and women without disabilities to report having received help or care for a long-term health condition or disability in the last 12 months (22% versus 3%).