
9. Canadian Indicators for the United Nations Convention on the Rights of Persons with Disabilities (CRPD) - article 27: work and employment
On this page
- List of figures
- 9.1a Employment rate, 2021
- 9.1b Employment rate trend, 2022 to 2024
- 9.2 Not in the Labour Force (NILF)
- 9.3 Work potential
- 9.4 Part-time employment
- 9.5a Self-employment rate
- 9.5b Self-employment distribution
- 9.6 Employment income trend, 2015 to 2023
- 9.7 Not in Employment, Education, or Training (NEET)
- 9.8 Career advancement
- 9.9 Employment benefits
- 9.10 Verbal, sexual, or physical violence at work
- 9.11 Labour force discrimination
- 9.12 Workplace accommodations
- 9.13 Employment by occupation
Alternate formats
A PDF version of the Canadian Indicators for the United Nations Convention on the Rights of Persons with Disabilities is available on the index page.
List of figures
- Figure 9.1a: Employment rate, by disability status and gender, persons aged 25 to 64 years, 2021
- Figure 9.1b: Employment rate trend, by disability status and gender, persons aged 25 to 64 years, 2022 to 2024
- Figure 9.2: NILF rate, by disability status and gender, persons aged 25 to 64 years, 2021
- Figure 9.3: Proportion with work potential, by age and gender, persons with disabilities aged 15 to 64 years who were unemployed or not in the labour force, 2022
- Figure 9.4: Part-time employment rate, by disability status and gender, workers aged 25 to 64 years, 2021
- Figure 9.5a: Self-employment rate, by disability status and gender, workers aged 25 to 64 years, 2021
- Figure 9.5b: Self-employment distribution, by disability status, self-employed workers aged 25 to 64 years, 2021
- Figure 9.6: Median employment income trend, by disability status and sex, persons aged 15 years and over employed full-time for the full year, 2015 to 2023
- Figure 9.7: NEET rate, by disability status and gender, persons aged 15 to 24 years, 2021
- Figure 9.8: Proportion with good prospects for career advancement, by disability status and sex, employees aged 25 to 64 years, 2016
- Figure 9.9: Proportion with access to employment benefits, by disability status, employees aged 25 to 64 years, 2016
- Figure 9.10: Proportion subjected to verbal, sexual, or physical violence at work, by disability status and sex, employed persons aged 25 to 64 years, 2016
- Figure 9.11: Proportion who experienced labour discrimination because of their condition, by gender, employees with disabilities aged 25 to 64 years, 2022
- Figure 9.12: Occupation distribution, by disability status, employees aged 25 to 64 years, 2021
9.1a Employment rate, 2021
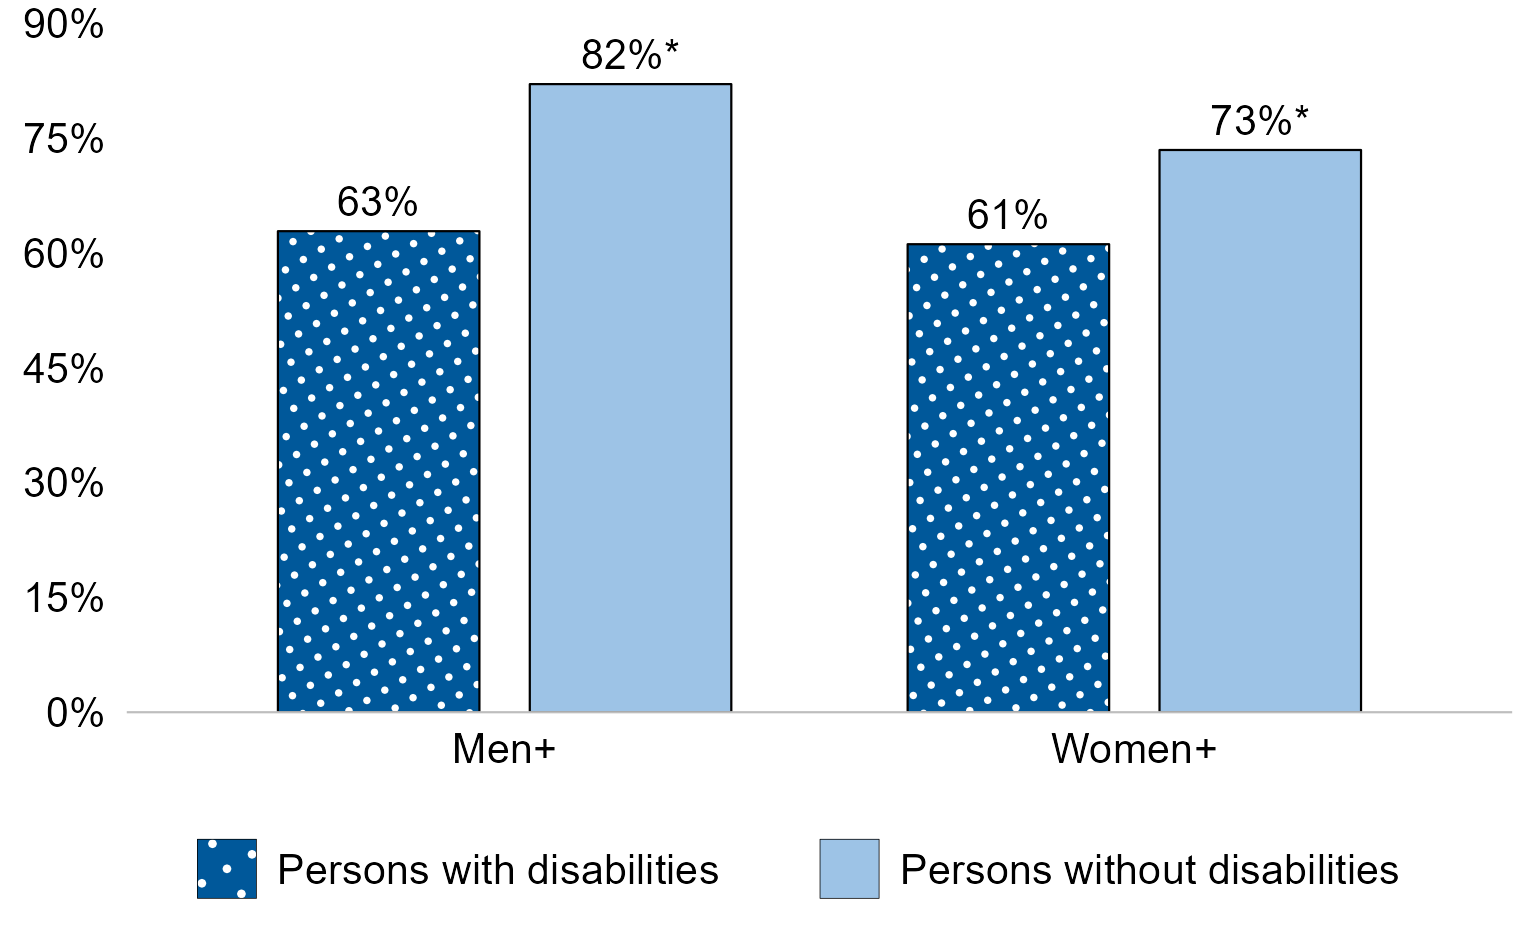
Figure 9.1a - Text description
| Gender | Persons with disabilities | Persons without disabilities |
|---|---|---|
| Men+ | 63% | 82%* |
| Women+ | 61% | 73%* |
- * significantly different from estimate for persons with disabilities in the same gender category (p<0.05)
- Notes: The employment rate refers to the number of persons employed as a percentage of the total population aged 25 to 64 years.
- Information about employment rates is from 2021 Census data linked to the 2022 Canadian Survey on Disability. It reflects the reference week for the Census, from May 2 to May 8, 2021.
- To protect the confidentiality of non-binary persons, a two-category gender variable was used, given the relatively small size of this population in Canada. Non-binary persons were redistributed into the men and women categories, denoted as "men+" and "women+" in charts and tables. The "men+" category includes cisgender and transgender men and boys, as well as some non-binary persons; and the "women+" category includes cisgender and transgender women and girls, as well as some non-binary persons.
- * significantly different from estimate for persons with disabilities in the same gender category (p<0.05)
- Differences between men and women are statistically significant only for persons without disabilities (p<0.05).
- Source: Statistics Canada, Canadian Survey on Disability, 2022 (Social Research Division calculations).
Persons with disabilities had lower rates of employment than those without disabilities.
Among men aged 25 to 64 years, 63% of those with disabilities were employed compared to 82% of those without disabilities. Among women aged 25 to 64 years, 61% of those with disabilities were employed compared to 73% of those without disabilities.
9.1b Employment rate trend, 2022 to 2024
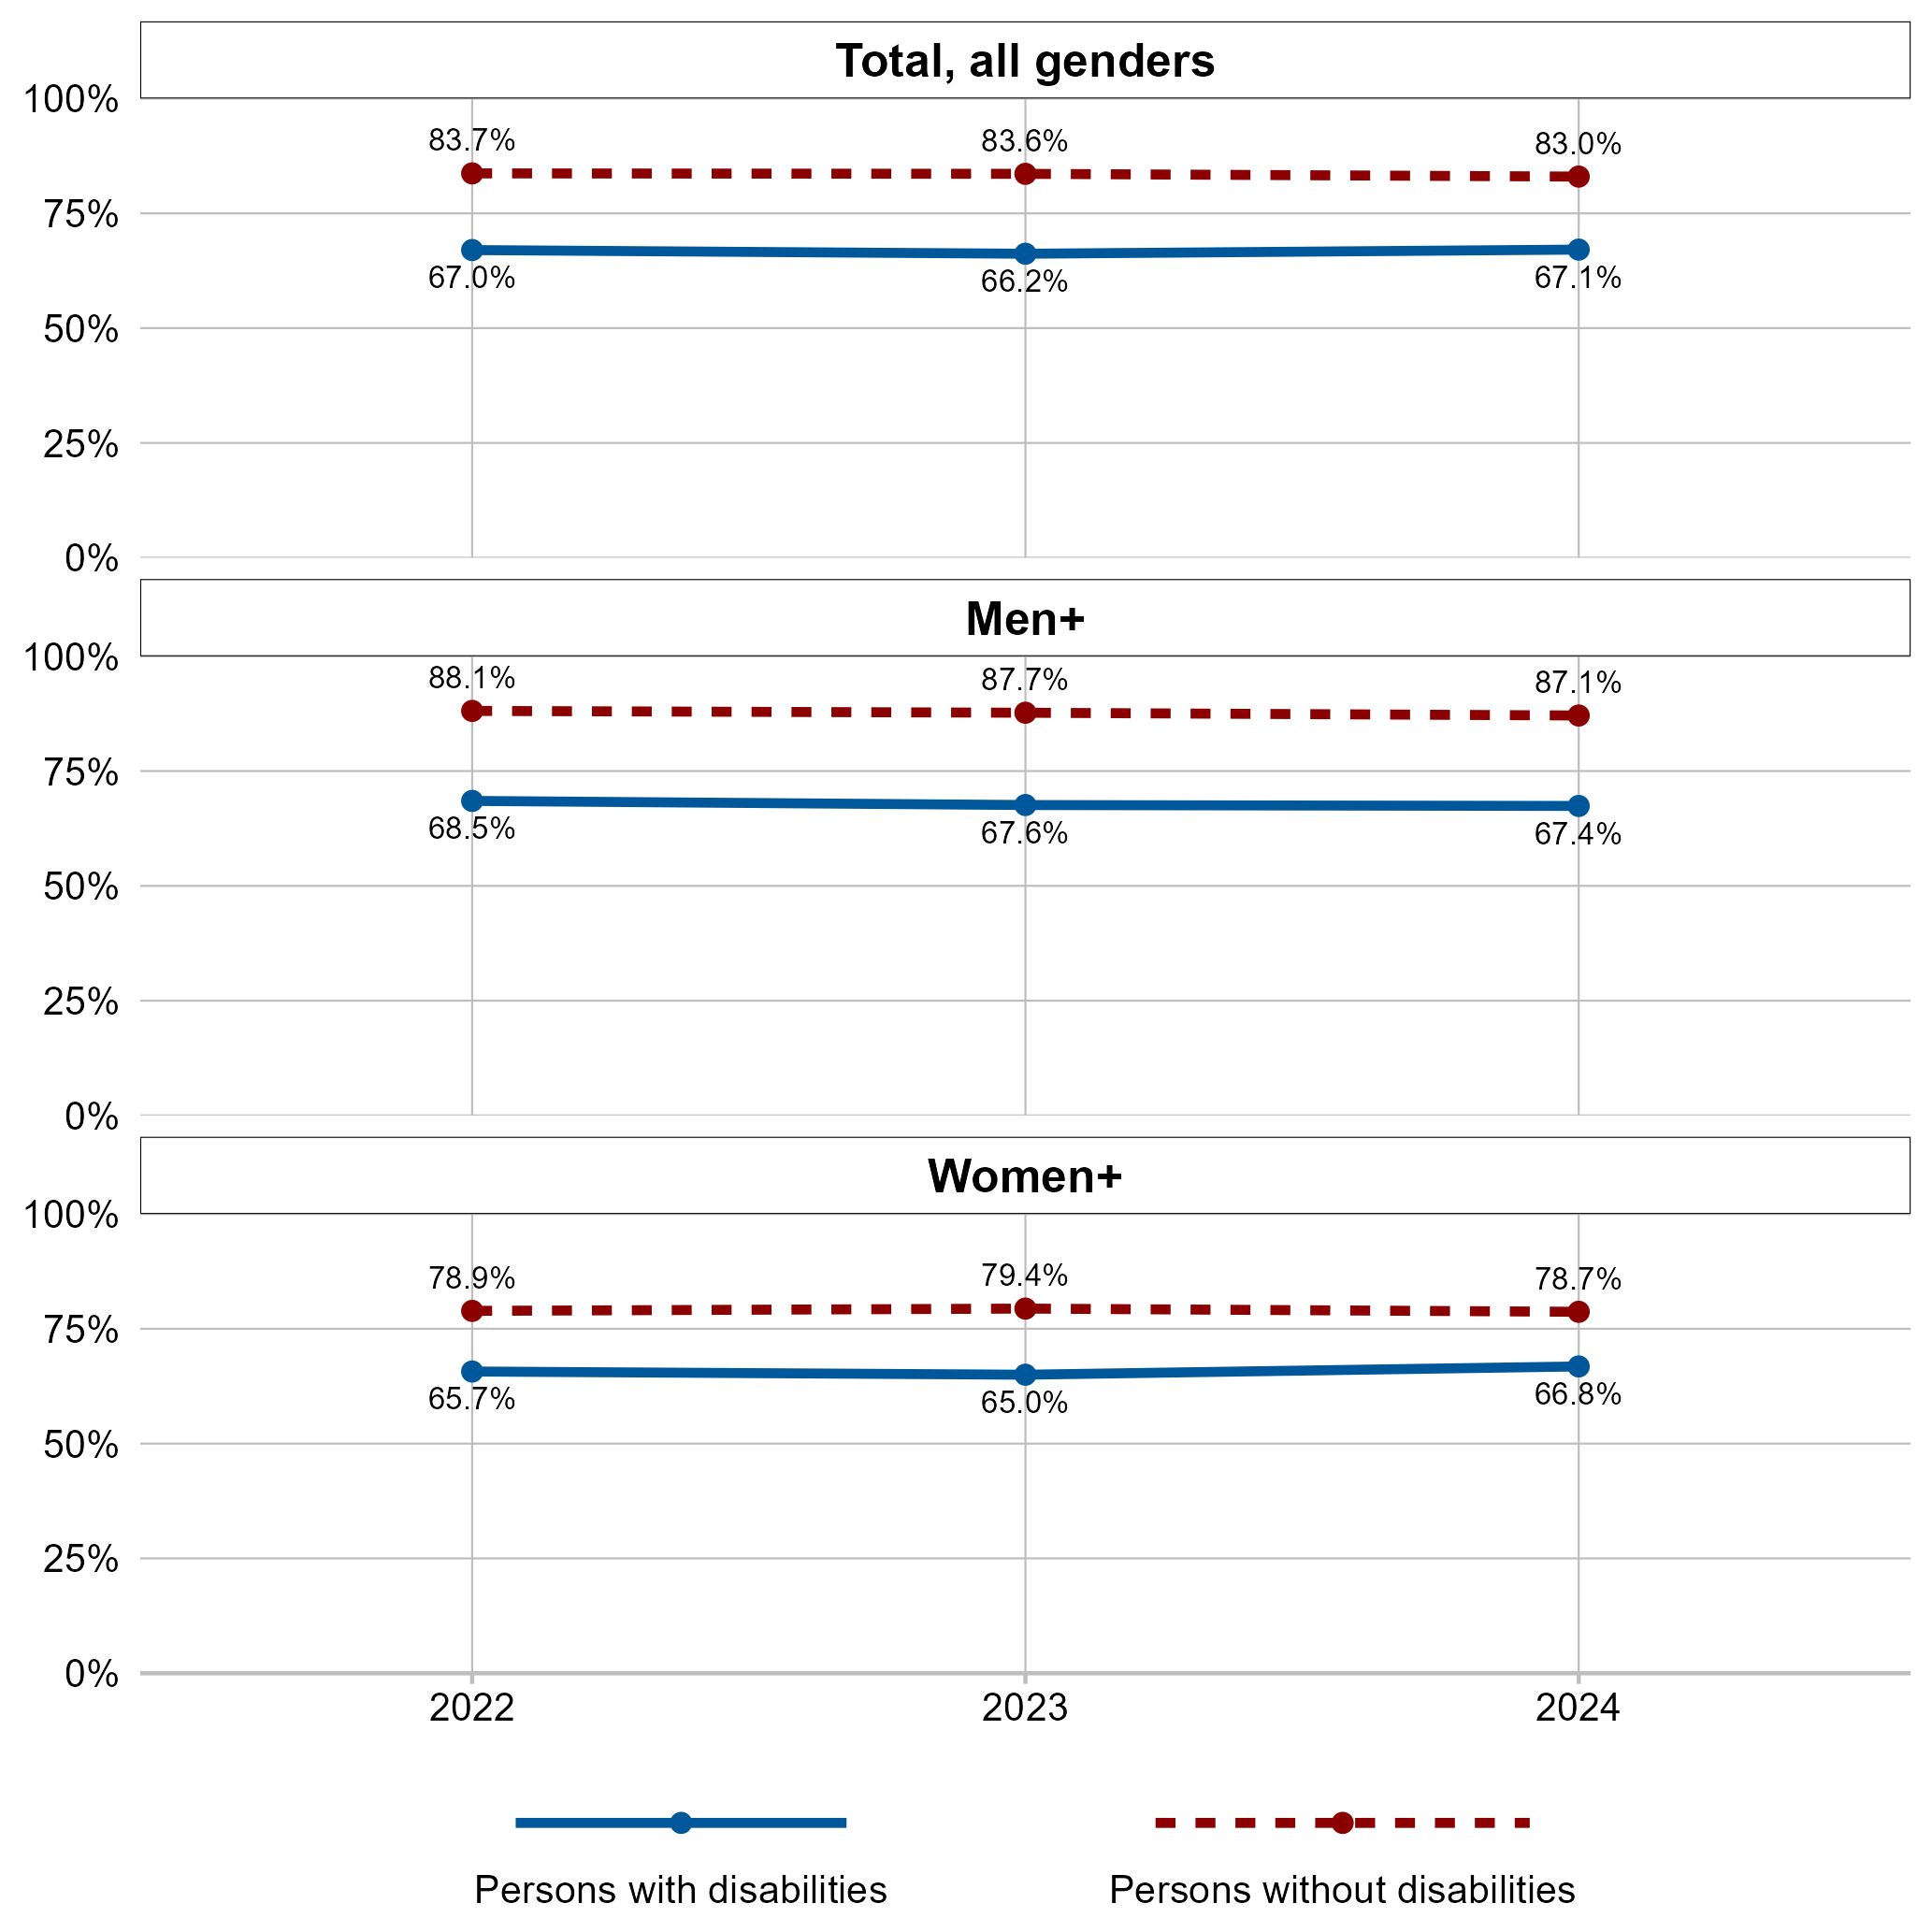
Figure 9.1b - Text description
| Year | Gender | Persons with disabilities | Persons without disabilities |
|---|---|---|---|
| 2022 | Total, all genders | 67.0% | 83.7% |
| 2023 | Total, all genders | 66.2% | 83.6% |
| 2024 | Total, all genders | 67.1% | 83.0% |
| 2022 | Men+ | 68.5% | 88.1% |
| 2023 | Men+ | 67.6% | 87.7% |
| 2024 | Men+ | 67.4% | 87.1% |
| 2022 | Women+ | 65.7% | 78.9% |
| 2023 | Women+ | 65.0% | 79.4% |
| 2024 | Women+ | 66.8% | 78.7% |
- Notes: Employment rate refers to the number of persons employed expressed as a percentage of the population aged 25 to 64 years. The estimates above exclude the territories.
- To protect the confidentiality of non-binary persons, a two-category gender variable was used, given the relatively small size of this population in Canada. Non-binary persons were redistributed into the men and women categories, denoted as "men+" and "women+" in charts and tables. The "men+" category includes cisgender and transgender men and boys, as well as some non-binary persons; and the "women+" category includes cisgender and transgender women and girls, as well as some non-binary persons.
- Source: Statistics Canada, Labour Force Survey, Canadian Income Survey, and Labour Market and Socio-economic Indicators, data retrieved from Table 14-10-0477-01 Labour market indicators for persons with and without disabilities, annual (Statistics Canada calculations).
The employment rates for persons with and without disabilities aged 25 to 64 years remained fairly steady between 2022 and 2024. As a result, the overall gap in the employment rates by disability status also remained stable throughout this period (at about 16 to 17 percentage points). The gap was higher among men (around 20 percentage points) and lower among women (around 12 to 14 percentage points). Among persons without disabilities, the gap in employment rates by gender remained stable at around 8 to 9 percentage points. The gap among persons with disabilities was smaller at around 1 to 3 percentage points.
9.2 Not in the Labour Force (NILF)
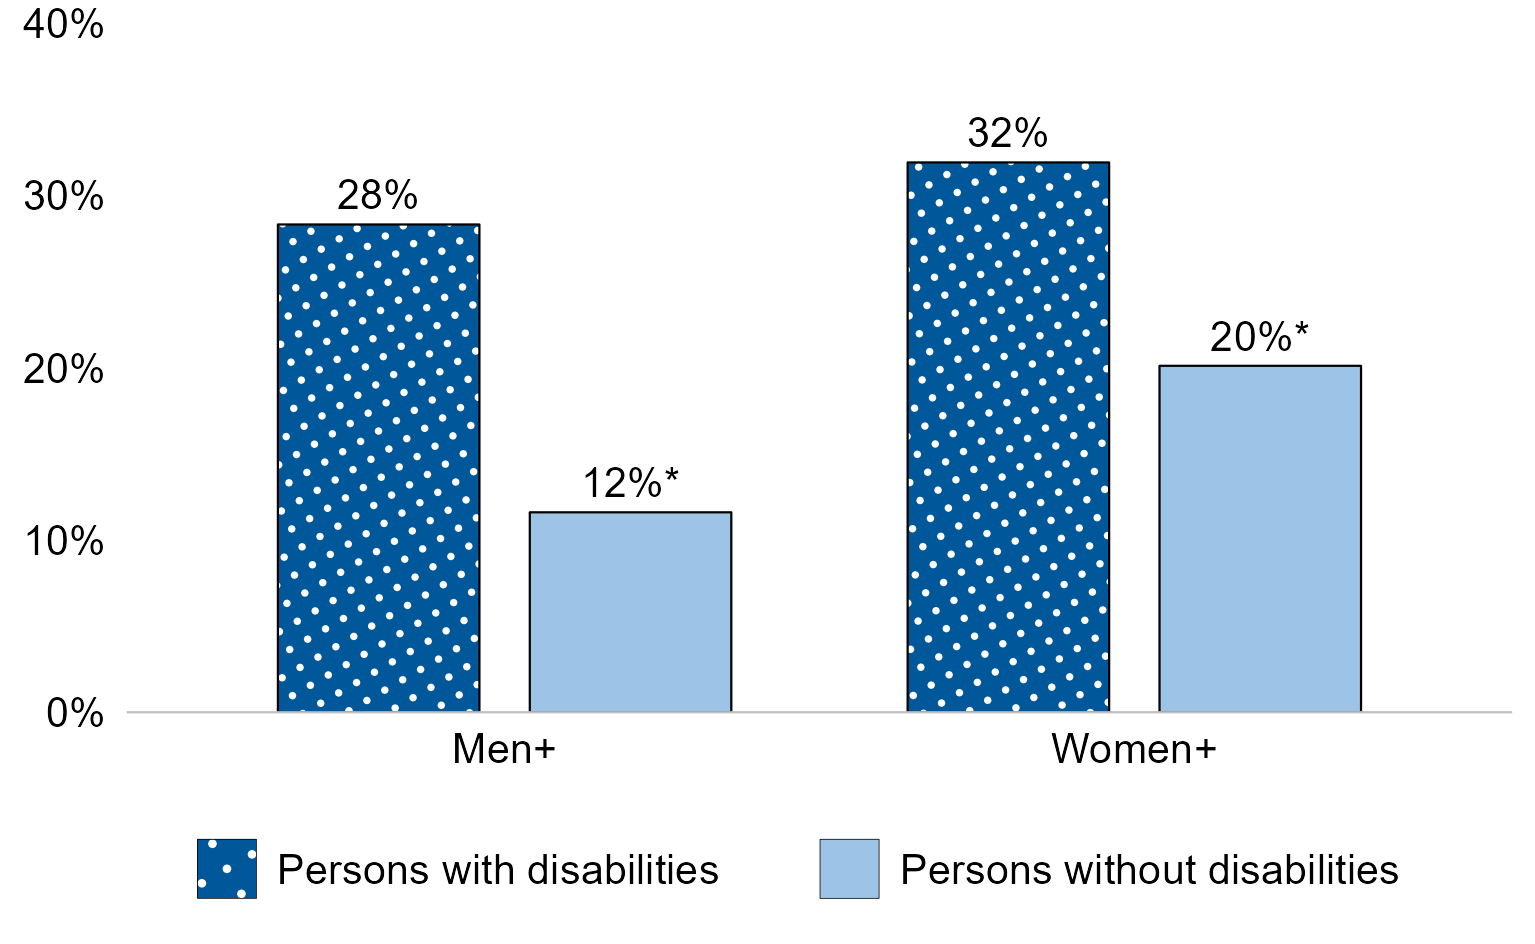
Figure 9.2 - Text description
| Gender | Persons with disabilities | Persons without disabilities |
|---|---|---|
| Men+ | 28% | 12%* |
| Women+ | 32% | 20%* |
- * significantly different from estimate for persons with disabilities in the same gender category (p<0.05)
- Notes: Not in the Labour Force (NILF) rate refers to the number of persons who are neither employed nor unemployed, expressed as a percentage of the total population aged 25 to 64 years.
- Information about NILF rates is from 2021 Census data linked to the 2022 Canadian Survey on Disability. It reflects the reference week for the Census, from May 2 to May 8, 2021.
- To protect the confidentiality of non-binary persons, a two-category gender variable was used, given the relatively small size of this population in Canada. Non-binary persons were redistributed into the men and women categories, denoted as "men+" and "women+" in charts and tables. The "men+" category includes cisgender and transgender men and boys, as well as some non-binary persons; and the "women+" category includes cisgender and transgender women and girls, as well as some non-binary persons.
- * significantly different from estimate for persons with disabilities in the same gender category (p<0.05)
- Differences between men and women are statistically significant both for persons with and without disabilities (p<0.05).
- Source: Statistics Canada, Canadian Survey on Disability, 2022 (Social Research Division calculations).
Persons with disabilities had lower rates of labour force participation than those without disabilities. Among men aged 25 to 64 years, those with disabilities were more likely than those without disabilities to not be in the labour force (28% versus 12%). Among women aged 25 to 64 years, those with disabilities were more likely than those without disabilities to not be in the labour force (32% versus 20%).
9.3 Work potential
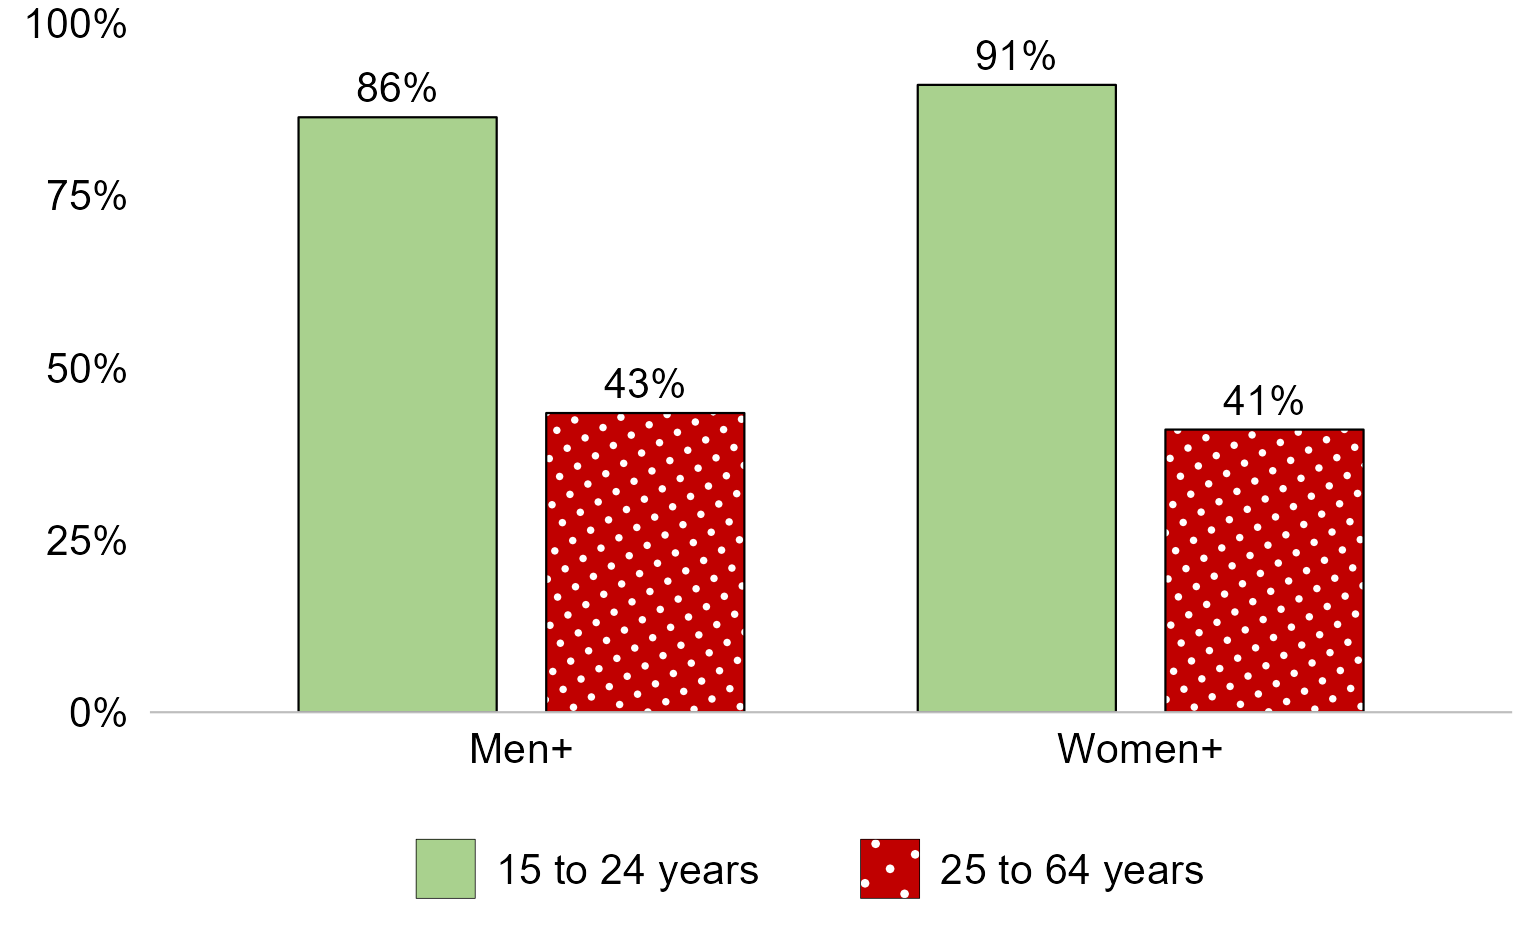
Figure 9.3 - Text description
| Gender | 15 to 24 years | 25 to 64 years |
|---|---|---|
| Men+ | 86% | 43% |
| Women+ | 91% | 41% |
- Notes: Persons with work potential include those who were unemployed or not in the labor force but stated they would be looking for work in the next 12 months, in addition to those who were not fully retired and either weren't prevented from work because of their condition or could work if they had access to workplace accommodations. The estimates above refer to the proportion with work potential among persons with disabilities who were unemployed or not in the labour force (NILF).
- To protect the confidentiality of non-binary persons, a two-category gender variable was used, given the relatively small size of this population in Canada. Non-binary persons were redistributed into the men and women categories, denoted as "men+" and "women+" in charts and tables. The "men+" category includes cisgender and transgender men and boys, as well as some non-binary persons; and the "women+" category includes cisgender and transgender women and girls, as well as some non-binary persons.
- Source: Statistics Canada, Canadian Survey on Disability, 2022 , data retrieved from Table 13-10-0895-01 Work potential for persons with disabilities by age group and gender (Statistics Canada calculations).
Among men with disabilities who were unemployed or not in the labour force, 86% of those aged 15 to 24 years and 43% of those aged 25 to 64 years had work potential. Among women with disabilities who were unemployed or not in the labour force, 91% of those aged 15 to 24 years and 41% of those aged 25 to 64 years had work potential.
9.4 Part-time employment
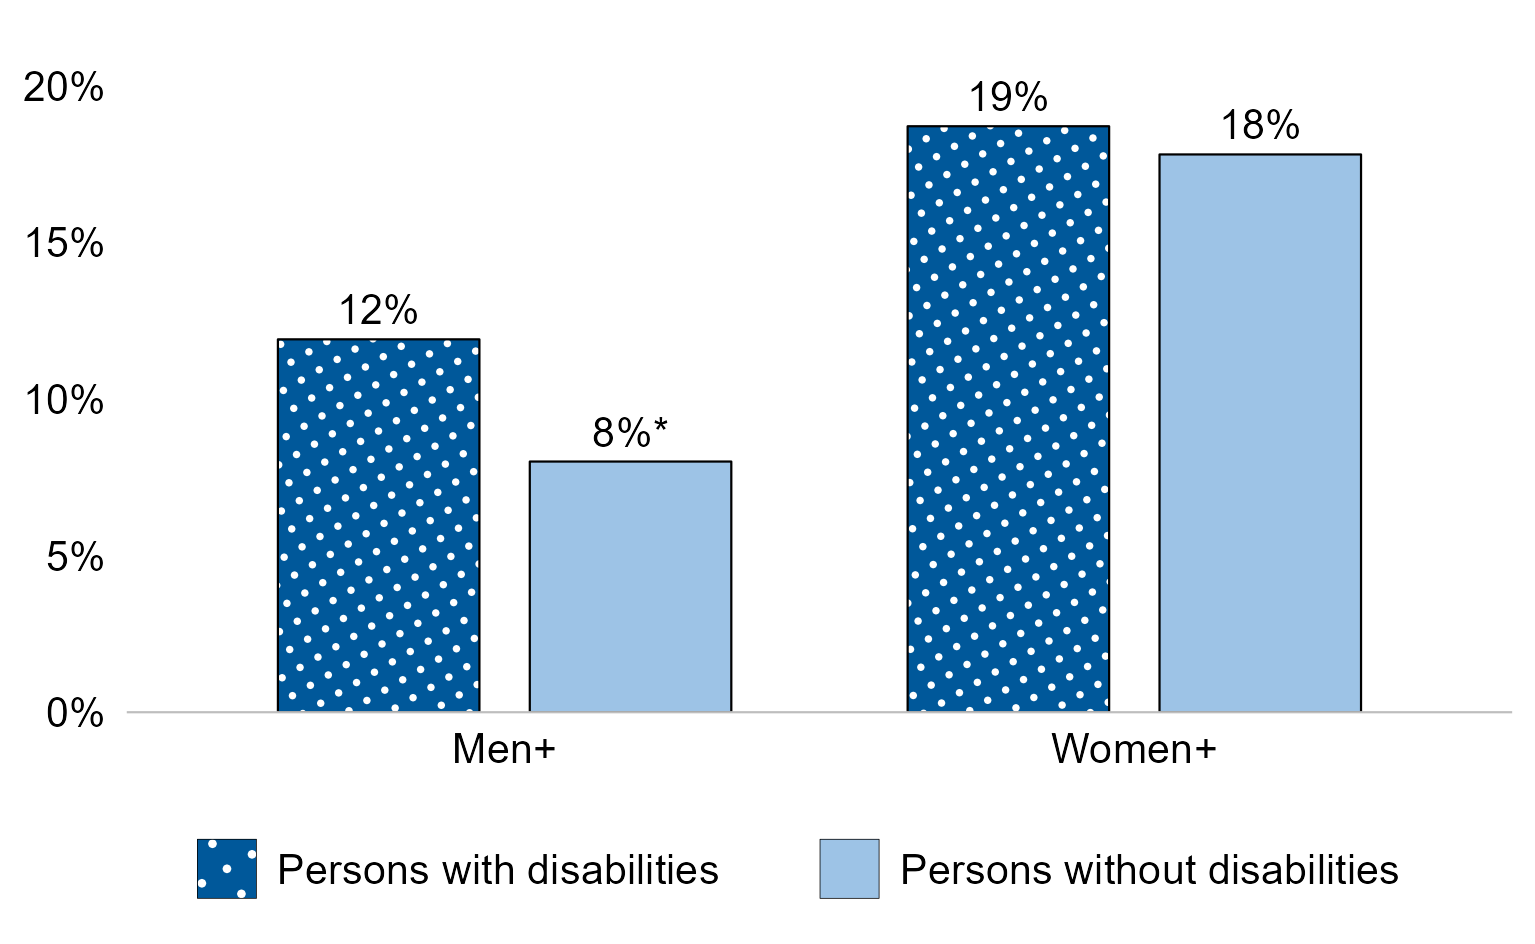
Figure 9.4 - Text description
| Gender | Persons with disabilities | Persons without disabilities |
|---|---|---|
| Men+ | 12% | 8%* |
| Women+ | 19% | 18% |
- * significantly different from estimate for persons with disabilities in the same gender category (p<0.05)
- Notes: The part-time employment rate refers to the percentage of workers aged 25 to 64 years who worked less than 30 hours per week for pay or in self-employment.
- Information about part-time work is from 2021 Census data linked to the 2022 Canadian Survey on Disability. It reflects the reference week for the Census, from May 2 to May 8, 2021.
- To protect the confidentiality of non-binary persons, a two-category gender variable was used, given the relatively small size of this population in Canada. Non-binary persons were redistributed into the men and women categories, denoted as "men+" and "women+" in charts and tables. The "men+" category includes cisgender and transgender men and boys, as well as some non-binary persons; and the "women+" category includes cisgender and transgender women and girls, as well as some non-binary persons.
- * significantly different from estimate for persons with disabilities in the same gender category (p<0.05)
- Differences between men and women are statistically significant for both persons with and without disabilities (p<0.05).
- Source: Statistics Canada, Canadian Survey on Disability, 2022 (Social Research Division calculations).
Among working men aged 25 to 64 years, those with disabilities were more likely than those without disabilities to work part-time (12% versus 8%). Among working women aged 25 to 64 years, those with disabilities and those without disabilities had similar part-time employment rates (19% versus 18%).
9.5a Self-employment rate

Figure 9.5a - Text description
| Gender | Persons with disabilities | Persons without disabilities |
|---|---|---|
| Men+ | 16% | 18%* |
| Women+ | 11% | 12% |
- * significantly different from estimate for persons with disabilities in the same gender category (p<0.05)
- Notes: Self-employment rate refers to persons who were self-employed, expressed as a percentage of the population of workers aged 25 to 64 years. Self-employed persons include those with an incorporated or unincorporated business, as well as unpaid family workers.
- Information about self-employment rates is from 2021 Census data linked to the 2022 Canadian Survey on Disability. The information usually refers to a respondent's job during the week of May 2 to May 8, 2021. If they didn't work that week, it refers to the job they had the longest since January 1, 2020. Persons with more than one job reported the one where they worked the most hours.
- To protect the confidentiality of non-binary persons, a two-category gender variable was used, given the relatively small size of this population in Canada. Non-binary persons were redistributed into the men and women categories, denoted as "men+" and "women+" in charts and tables. The "men+" category includes cisgender and transgender men and boys, as well as some non-binary persons; and the "women+" category includes cisgender and transgender women and girls, as well as some non-binary persons.
- * significantly different from estimate for persons with disabilities in the same gender category (p<0.05)
- Differences between men and women are statistically significant for both persons with and without disabilities (p<0.05).
- Source: Statistics Canada, Canadian Survey on Disability, 2022 (Social Research Division calculations).
Among working men aged 25 to 64 years, those with disabilities were less likely than those without disabilities to be self-employed (16% versus 18%). Among working women aged 25 to 64 years, 11% of those with disabilities and 12% of those without disabilities were self-employed. Among workers aged 25 to 64 years, men were more likely than women to be self-employed for both persons with disabilities (16% versus 11%) and persons without disabilities (18% versus 12%).
9.5b Self-employment distribution

Figure 9.5b - Text description
| Self-employment category | Persons with disabilities | Persons without disabilities |
|---|---|---|
| Unincorporated, no paid help | 62% | 47%* |
| Unincorporated, with paid help | 10% | 11% |
| Incorporated, no paid help | 16% | 18% |
| Incorporated, with paid help | 11% | 22%* |
| Unpaid family worker | 1% | 2%* |
- * significantly different from estimate for persons with disabilities in the same self-employment category (p<0.05)
- Notes: The estimates above refer to the distribution of self-employed persons with the same disability status across different self-employment categories.
- Self-employed persons include those with an incorporated or unincorporated business, as well as unpaid family workers.
- Self-employed persons are those who run a business, farm, or professional practice on their own or in partnership. This includes farm operators, freelancers, contract workers (e.g., architects, nurses), direct sellers, and fishing workers using their own or shared equipment. The business may be incorporated or not, with or without paid help.
- Unpaid family workers are those who work without pay in a business, farm, or professional practice owned and operated by another family member living in the same dwelling.
- Information about self-employment is from 2021 Census data linked to the 2022 Canadian Survey on Disability. The information usually refers to a respondent's job during the week of May 2 to May 8, 2021. If they didn't work that week, it refers to the job they had the longest since January 1, 2020. Persons with more than one job reported the one where they worked the most hours.
- * significantly different from estimate for persons with disabilities in the same self-employment category (p<0.05)
- Source: Statistics Canada, Canadian Survey on Disability, 2022 (Social Research Division calculations).
Among self-employed workers aged 25 to 64 years, those with disabilities were more likely than those without disabilities to be self-employed in an unincorporated business with no paid help (62% versus 47%). Conversely, they were less likely than those without disabilities to be self-employed in an incorporated business with paid help (11% versus 22%).
9.6 Employment income trend, 2015 to 2023
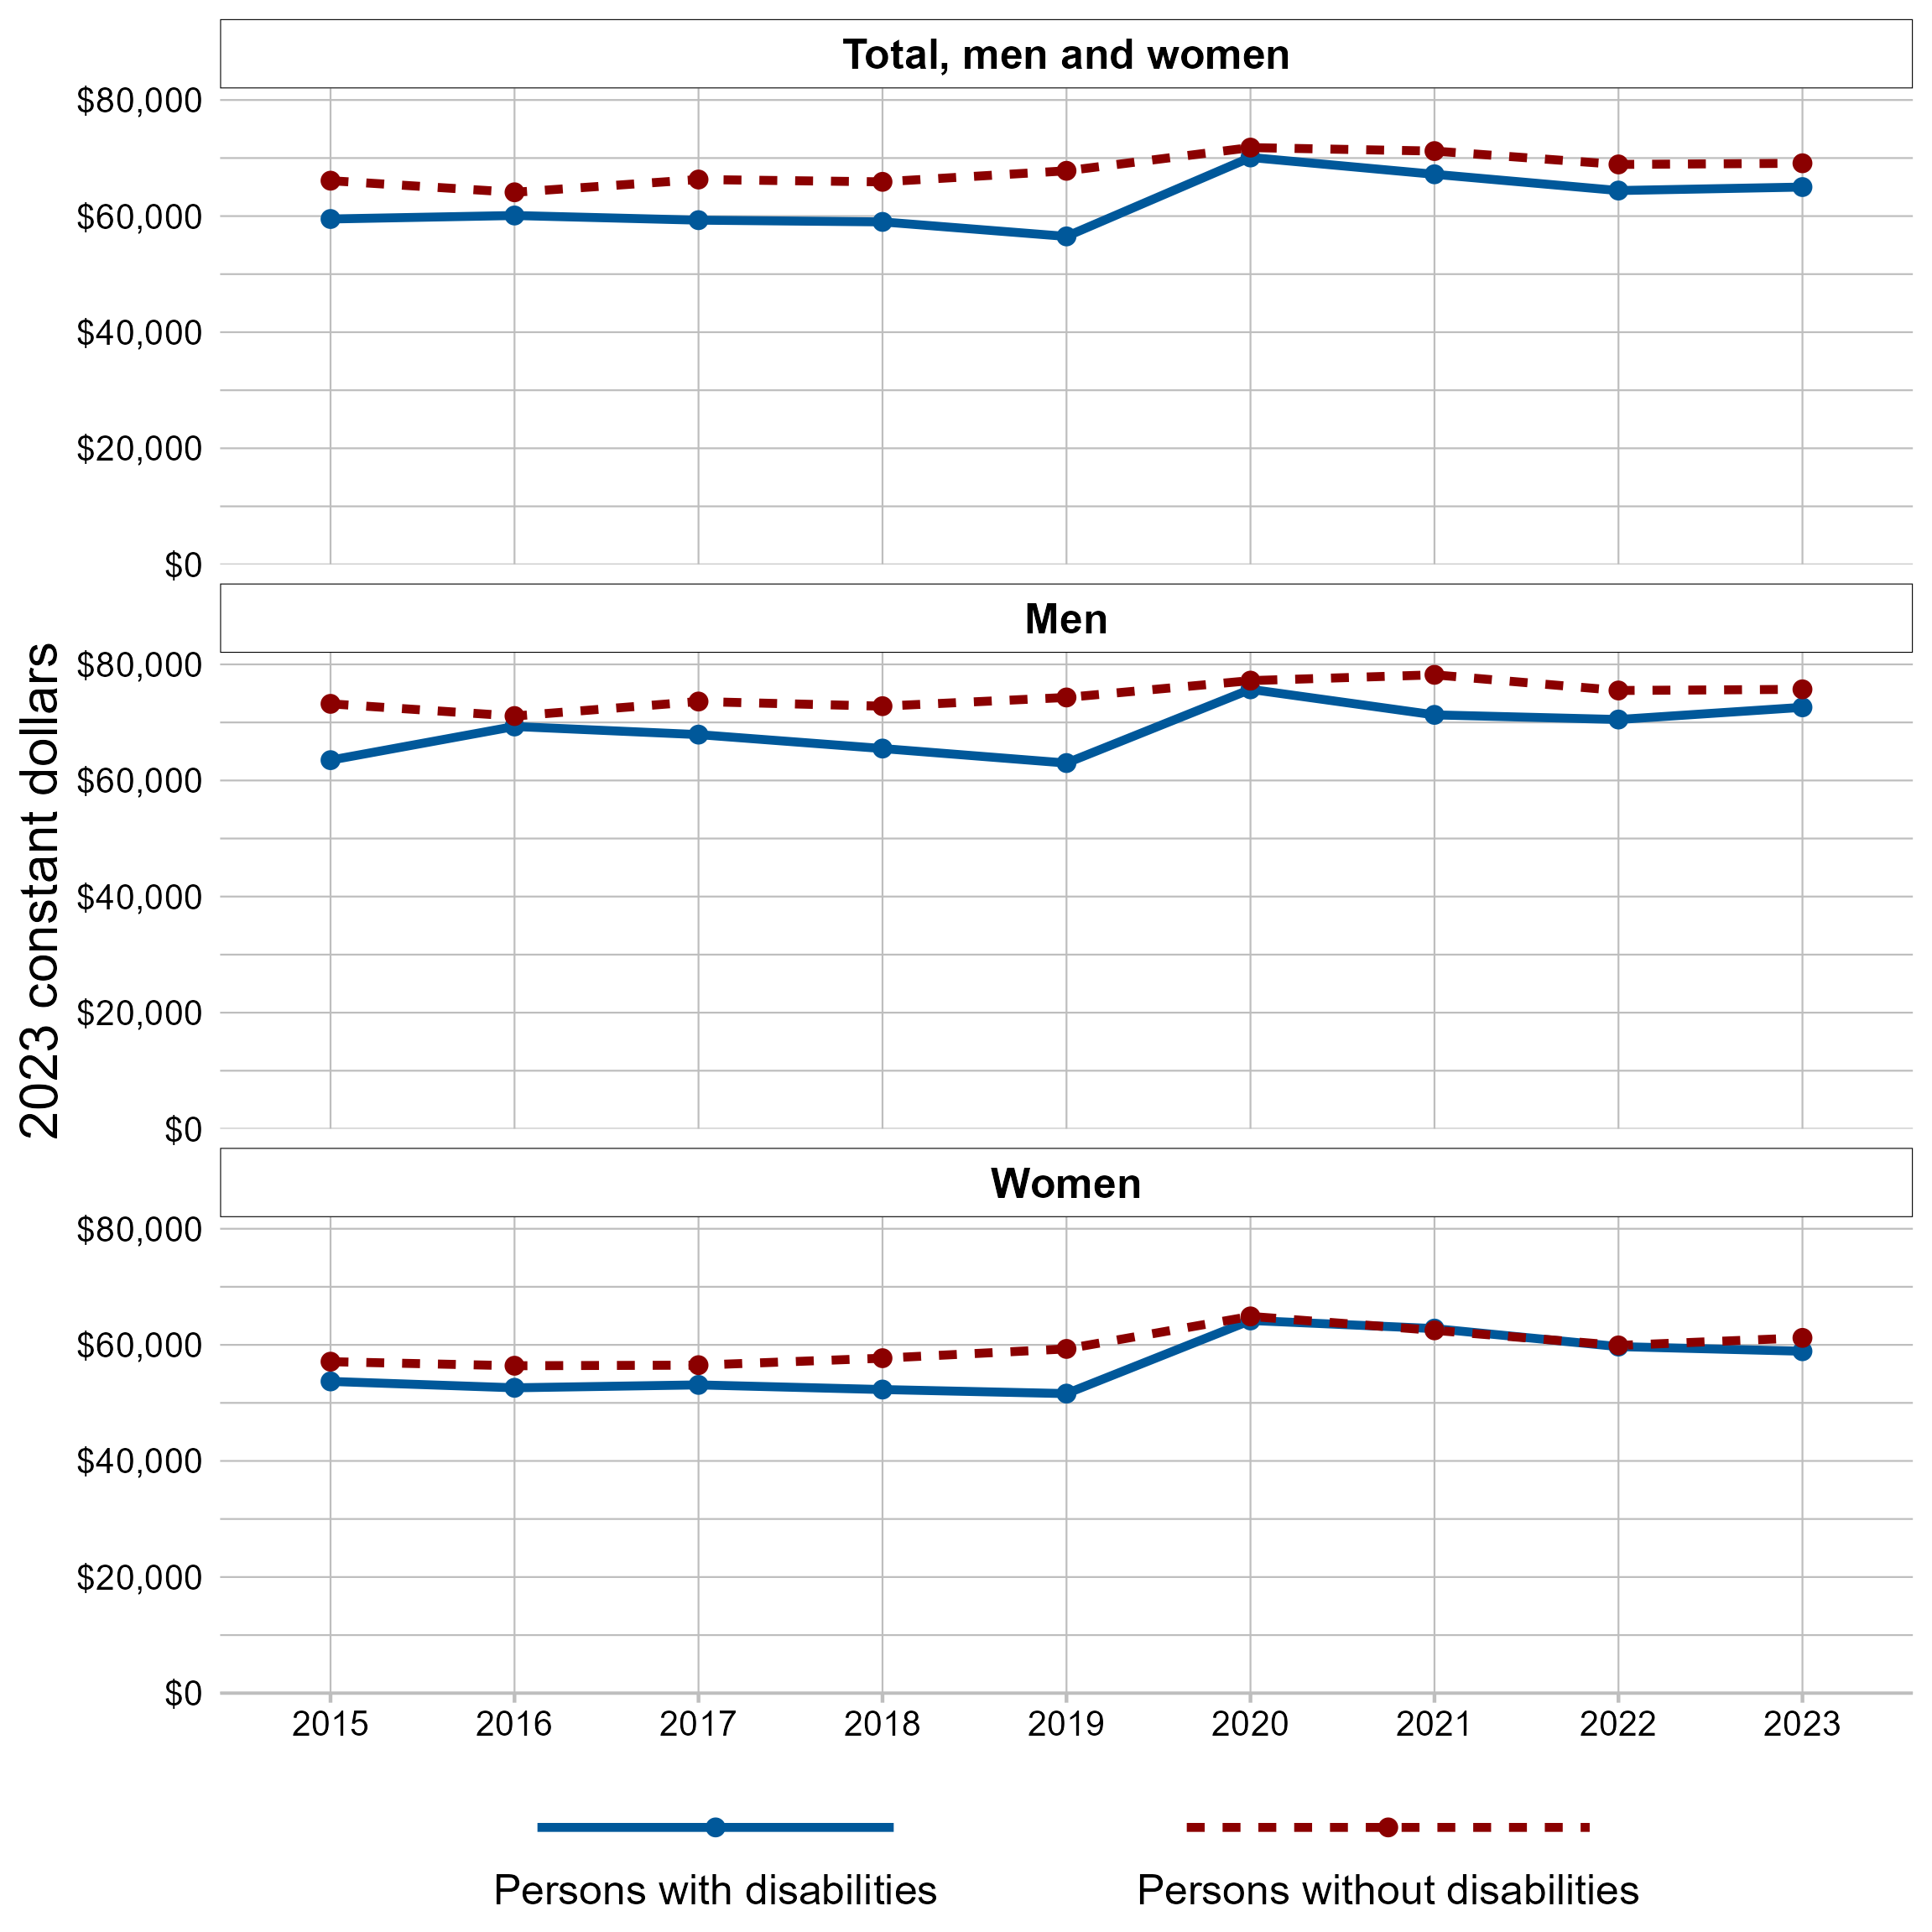
Figure 9.6 - Text description
| Year | Total, men and women with disabilities | Men with disabilities | Women with disabilities | Total, men and women without disabilities | Men without disabilities | Women without disabilities |
|---|---|---|---|---|---|---|
| 2015 | $59,500 | $63,500 | $53,700 | $66,100 | $73,200 | $57,100 |
| 2016 | $60,100 | $69,300 | $52,600 | $64,100 | $71,100 | $56,400 |
| 2017 | $59,300 | $67,900 | $53,100 | $66,300 | $73,600 | $56,500 |
| 2018 | $59,000 | $65,500 | $52,300 | $65,900 | $72,800 | $57,700 |
| 2019 | $56,500 | $63,000 | $51,600 | $67,800 | $74,300 | $59,300 |
| 2020 | $70,100 | $75,700 | $64,200 | $71,800 | $77,200 | $64,900 |
| 2021 | $67,200 | $71,300 | $62,800 | $71,200 | $78,200 | $62,500 |
| 2022 | $64,400 | $70,500 | $59,700 | $68,900 | $75,500 | $59,900 |
| 2023 | $65,000 | $72,600 | $58,900 | $69,100 | $75,700 | $61,200 |
- Notes: The estimates above refer to median employment income of full-year full-time workers. Full-year full-time workers are those who were employed for the whole year (52 weeks) and whose average usual hours of work were 30 or more per week. The estimates do not include the territories.
- Estimates for 2015 to 2021 are for persons aged 16 years and over, whereas estimates for 2022 and 2023 are for persons aged 15 years and over.
- The income estimates above are expressed in 2023 constant dollars.
- Source: Statistics Canada, Canadian Income Survey, data retrieved from Table 11-10-0089-01 Distribution of employment income of individuals by disability status, sex and work activity, (Statistics Canada calculations).
The median employment income (in 2023 constant dollars) of persons working full-time for the full year has been on a general upward trend since 2015. The overall income gap between persons with and without disabilities has varied across the years with an overall decrease from 2015 to 2023 (from $6,600 to $4,100). In 2020, it reached its lowest value, which should be considered with caution given the government support provided through COVID-19 benefits between 2020 and 2021. The median employment income (in 2023 constant dollars) of men who worked full-time for the full year has been on a general upward trend since 2015. The income gap between men with and without disabilities has varied across the years with an overall decrease from 2015 to 2023 (from $9,700 to $3,100). The median employment income (in 2023 constant dollars) of women who worked full-time for the full year has been on a general upward trend since 2015. The income gap between women with and without disabilities has varied across the years with an overall decrease from 2015 to 2023 (from $3,400 to $2,300). The gap reached its lowest levels between 2020 and 2022.
9.7 Not in Employment, Education, or Training (NEET)

Figure 9.7 - Text description
| Gender | Persons with disabilities | Persons without disabilities |
|---|---|---|
| Men+ | 22% | 10%* |
| Women+ | 12% | 8%* |
- * significantly different from estimate for persons with disabilities in the same gender category (p<0.05)
- Notes: NEET refers to those not in employment, education, or training.
- Information about NEET rates is from 2021 Census data linked to the 2022 Canadian Survey on Disability. Employment data reflects the Census reference week, from Sunday, May 2 to Saturday, May 8, 2021. Education data reflects the reference period between September 2020 and May 11, 2021.
- To protect the confidentiality of non-binary persons, a two-category gender variable was used, given the relatively small size of this population in Canada. Non-binary persons were redistributed into the men and women categories, denoted as "men+" and "women+" in charts and tables. The "men+" category includes cisgender and transgender men and boys, as well as some non-binary persons; and the "women+" category includes cisgender and transgender women and girls, as well as some non-binary persons.
- * significantly different from estimate for persons with disabilities in the same gender category (p<0.05)
- Differences between men and women are statistically significant for both persons with and without disabilities (p<0.05).
- Source: Statistics Canada, Canadian Survey on Disability, 2022 (Social Research Division calculations).
Young persons with disabilities had higher NEET rates than those without disabilities.
Among men aged 15 to 24 years, 22% of those with disabilities were not in employment, education, or training. This compares to 10% of those without disabilities. Among women aged 15 to 24 years, 12% of those with disabilities were not in employment, education, or training. This compares to 8% of those without disabilities.
9.8 Career advancement

Figure 9.8 - Text description
| Sex | Persons with disabilities | Persons without disabilities |
|---|---|---|
| Men | 43% | 57%* |
| Women | 42% | 51%* |
- * significantly different from estimate for persons with disabilities of the same sex (p<0.05)
- Notes: The estimates above refer to the proportion of paid employees who responded that they "strongly agree" or "agree" with the following statement: "Your job offers good prospects for career advancement".
- * significantly different from estimate for persons with disabilities of the same sex (p<0.05)
- Differences between men and women are statistically significant only for persons without disabilities (p<0.05).
- Source: Statistics Canada, General Social Survey - Canadians at Work and Home, 2016 (Social Research Division calculations).
Lower proportions of persons with disabilities reported good prospects for career advancement than those without disabilities. Among employed men aged 25 to 64 years, 43% of those with disabilities said that their job offered good prospects for career advancement. This compares to 57% of those without disabilities. Among employed women aged 25 to 64 years, 42% of those with disabilities said that their job offered good prospects for career advancement. This compares to 51% of those without disabilities.
9.9 Employment benefits

Figure 9.9 - Text description
| Employment benefit category | Persons with disabilities | Persons without disabilities |
|---|---|---|
| Disability insurance | 41% | 48%* |
| Maternity, parental, or layoff benefits | 40% | 47%* |
| Workplace pension plan | 37% | 43%* |
| Paid sick leave | 41% | 46%* |
| Paid vacation leave | 54% | 59%* |
| Supplemental medical or dental care | 46% | 51%* |
| Worker's compensation | 49% | 52%* |
- * significantly different from estimate for persons with disabilities within the same employment benefit category (p<0.05)
- Notes: The estimates above refer to the proportions of paid employees aged 25 to 64 years who indicated they had access to each of the listed employment benefit categories as part of their employment.
- * significantly different from estimate for persons with disabilities within the same employment benefit category (p<0.05)
- Source: Statistics Canada, General Social Survey - Canadians at Work and Home, 2016 (Social Research Division calculations).
Employees with disabilities were less likely than those without disabilities to have access to employment benefits, for all listed categories. For example, 40% of employees with disabilities reported they had access to maternity, parental, or layoff benefits, compared with 47% of those without disabilities.
9.10 Verbal, sexual, or physical violence at work

Figure 9.10 - Text description
| Sex | Persons with disabilities | Persons without disabilities |
|---|---|---|
| Men | 18% | 8%* |
| Women | 21% | 13%* |
- * significantly different from estimate for persons with disabilities of the same sex (p<0.05)
- Notes: The estimates above refer to the proportion of paid employees or those who were self-employed who responded "yes" to the question "In the past 12 months, have you been subjected to: verbal abuse, unwanted sexual attention or sexual harassment, or physical violence while at work?".
- * significantly different from estimate for persons with disabilities of the same sex (p<0.05)
- Differences between men and women are statistically significant only for persons without disabilities (p<0.05).
- Source: Statistics Canada, General Social Survey - Canadians at Work and Home, 2016 (Social Research Division calculations).
Persons with disabilities were more likely to report experiencing verbal, sexual, or physical violence at work than those without disabilities. Among employed men aged 25 to 64 years, 18% of those with disabilities experienced verbal, sexual, or physical violence at work. This compares to 8% of those without disabilities. Among employed women aged 25 to 64 years, 21% of those with disabilities experienced verbal, sexual, or physical violence at work. This compares to 13% of those without disabilities.
9.11 Labour force discrimination

Figure 9.11 - Text description
| Form of labour discrimination | Men+ | Women+ |
|---|---|---|
| Disadvantaged in employment | 26% | 26% |
| Refused a promotion | 9% | 9% |
| Refused a job | 9% | 8% |
- Notes: "Disadvantaged in employment" refers to those who responded "yes" to the question "Do you consider yourself to be disadvantaged in employment because of your condition?".
- "Refused a promotion" refers to those who responded "yes" to the question "In the past 5 years, do you believe that because of your condition, you have been refused a job promotion?".
- "Refused a job" refers to those who responded "yes" to the question "In the past 5 years, do you believe that because of your condition, you have been refused a job?".
- Differences between men with disabilities and women with disabilities are not statistically significant for all forms of labour discrimination (p<0.05).
- Source: Statistics Canada, Canadian Survey on Disability, 2022 (Social Research Division calculations).
Employees with disabilities aged 25 to 64 years were asked about their experiences with labour force discrimination. Around 26% of both men and women considered themselves disadvantaged in employment due to their condition. Around 9% of men and 8% of women reported that they had been refused a job because of their condition in the past 5 years. Similarly, 9% of both men and women reported that they had been refused a job promotion because of their condition in the past 5 years.
9.12 Workplace accommodations
| Type of workplace accommodation | Required | Needs met |
|---|---|---|
| Modified hours or days or reduced work hours | 16% | 77% |
| Modified or different duties | 12% | 69% |
| Working from home | 11% | 81% |
| Modified or ergonomic workstation | 11% | 64% |
| Special chair or back support | 11% | 56% |
- Notes: Requirements for workplace accommodations are shown as a percentage of the total population of employees with disabilities aged 25 to 64 years. Note that employees may require more than one type of accommodation. For employees with disabilities, a need is met if the workplace accommodation required by them to be able to work was made available. The estimates for needs met are among employees with disabilities who required a given accommodation.
- Source: Statistics Canada, Canadian Survey on Disability, 2022 (Social Research Division calculations).
Among employees with disabilities aged 25 to 64 years, the most commonly required workplace accommodation was "modified hours or days or reduced work hours" (16%), and the need was met for 77% of the employees who required it to be able to work. The second most commonly required workplace accommodation was "modified or different duties" (12%), and the need was met for 69% of the employees who required it to be able to work. About 11% of employees with disabilities aged 25 to 64 required the following workplace accommodations: "working from home", "modified or ergonomic workstations", or "special chairs or back support". Among those who needed these accommodations, 81% had their need met for "working from home", 64% had their need met for "modified or ergonomic workstations", and 56% had their need met for "special chairs or back support".
9.13 Employment by occupation

Figure 9.12 - Text description
| Occupation category | Persons with disabilities | Persons without disabilities |
|---|---|---|
| Business, finance, and administration occupations | 21% | 19%* |
| Sales and service occupations | 20% | 19% |
| Occupations in education, law and social, community and government services | 16% | 13%* |
| Trades, transport, and equipment operators and related occupations | 15% | 18%* |
| Natural and applied sciences and related occupations | 9% | 10% |
| Health occupations | 8% | 9% |
| Occupations in manufacturing and utilities | 4% | 5% |
| Occupations in art, culture, recreation, and sport | 4% | 3%* |
| Natural resources, agriculture, and related production occupations | 2% | 3%* |
| Legislative and senior management occupations | 1% | 2%* |
- * significantly different from estimate for persons with disabilities within the same occupation category (p<0.05)
- Notes: The estimates above show the distribution of employees aged 25 to 64 years across broad occupational categories (National Occupational Classification, 2021).
- Information about occupation distribution rates is from 2021 Census data linked to the 2022 Canadian Survey on Disability. The information usually refers to a respondent's job during the week of May 2 to May 8, 2021. If they didn't work that week, it refers to the job they had the longest since January 1, 2020. Persons with more than one job reported the one where they worked the most hours.
- * significantly different from estimate for persons with disabilities within the same occupation category (p<0.05)
- Source: Statistics Canada, Canadian Survey on Disability, 2022 (Social Research Division calculations).
Higher proportions of persons with disabilities than persons without disabilities worked in "business, finance, and administration occupations" (21% versus 19%), "occupations in education, law and social, community and government services" (16% versus 13%), and "occupations in art, culture, recreation, and sport" (4% versus 3%). Conversely, lower proportions of persons with disabilities than persons without disabilities worked in "trades, transport, and equipment operators and related occupations" (15% versus 18%), "natural resources, agriculture, and related production occupations" (2% versus 3%), and "legislative and senior management occupations" (1% versus 2%).