
10. Canadian Indicators for the United Nations Convention on the Rights of Persons with Disabilities (CRPD) - article 28: adequate standard of living and social protection
On this page
Alternate formats
A PDF version of the Canadian Indicators for the United Nations Convention on the Rights of Persons with Disabilities is available on the index page.
10.1 Having Government transfers as major source of income
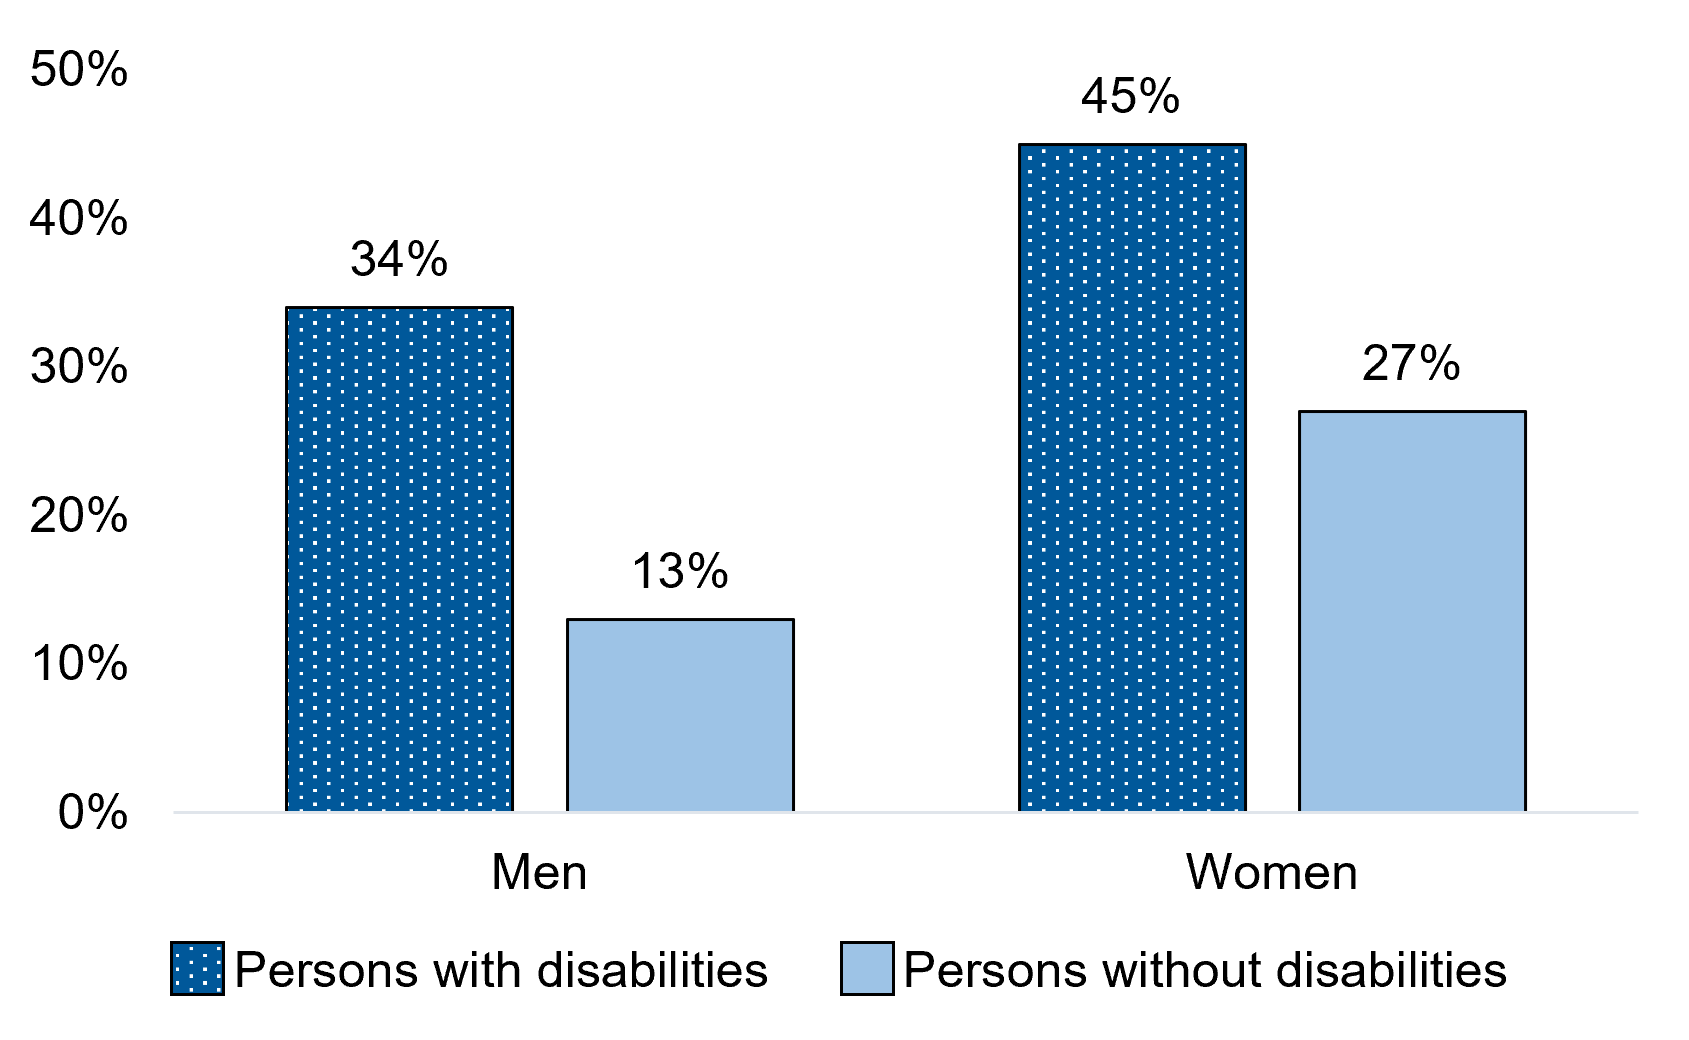
Figure 10.1 - Text description
| Sex | Persons with disabilities | Persons without disabilities |
|---|---|---|
| Men | 23% | 5%* |
| Women | 31% | 16%* |
* significantly different from estimate for persons with disabilities of the same sex (p<0.05)
- Notes: Respondents were asked what their major source of income was for the reference year (2022). The categories were "No income", "Wages and salaries", "Self-employment income", "Government transfers", "Investment income", "Private retirement pensions" and "Other income". The estimates above are for persons who selected "Government transfers".
- * significantly different from estimate for persons with disabilities of the same sex (p<0.05)
- Differences between men and women were statistically significant for both persons with and without disabilities (p< 0.05).
- Source: Statistics Canada, Canadian Income Survey, 2022 (Social Research Division calculations).
Among men aged 25 to 64 years, those with disabilities were over 4 times more likely to rely on Government transfers as their major source of income than those without disabilities (23% versus 5%). Among women aged 25 to 64 years, those with disabilities were nearly twice as likely as those without disabilities to report Government transfers as their main source of income (31% versus 16%). Among persons aged 25 to 64 years, women were more likely than men to report Government transfers as their major source of income. This was the case for both persons with disabilities (31% versus 23%) and persons without disabilities (16% versus 5%).
10.2a Poverty rate, 2020

Figure 10.2a - Text description
| Age group | Persons with disabilities | Persons without disabilities |
|---|---|---|
| 15 to 24 years | 11.8% | 11.9% |
| 25 to 64 years | 11.7% | 7.1%* |
| 65 years and over | 5.1% | 3.9%* |
* significantly different from estimate for persons with disabilities in the same age group (p<0.05)
- Notes: The estimates above use the 2018-base Market Basket Measure (MBM) based on 2020 financial data. Poverty estimates using the MBM exclude territories.
- The Market Basket Measure (MBM) establishes poverty thresholds based on the cost of a specific basket of goods and services representing a modest, basic standard of living. Poverty thresholds include the costs of food, clothing, shelter, transportation and other items for a reference family. These costs are compared to the disposable income of families to determine whether or not they fall below the poverty line.
- Poverty rates observed in 2020 were lower than those in previous and subsequent years. This can be largely attributed to the government support provided through COVID-19 benefits, which started in 2020 and were phased out in 2021 and 2022.
- * significantly different from estimate for persons with disabilities in the same age group (p<0.05)
- Differences between persons aged 15 to 24 years and those aged 25 to 64 years are statistically significant only for persons without disabilities (p<0.05).
- Differences between persons aged 15 to 24 years and those aged 65 years and over are statistically significant for both persons with and without disabilities (p<0.05).
- Source: Statistics Canada, Canadian Survey on Disability, 2022 (Social Research Division calculations).
Among persons aged 25 to 64 years, persons with disabilities were more likely than persons without disabilities to live below Canada's official poverty line (11.7% versus 7.1%).
Among persons aged 65 years and over, persons with disabilities were more likely than persons without disabilities to live below Canada's official poverty line (5.1% versus 3.9%).
10.2b Poverty rate trend, 2015 to 2023

Figure 10.2b - Text description
| Year | Persons with disabilities - Total, 15 years and over | Persons without disabilities - Total, 15 years and over | Persons with disabilities - 15 to 64 years | Persons without disabilities - 15 to 64 years | Persons with disabilities - 65 years and over | Persons without disabilities - 65 years and over |
|---|---|---|---|---|---|---|
| 2015 | 20.6% | 11.4% | 25.6% | 12.5% | 9.3% | 5.3% |
| 2016 | 16.9% | 10.3% | 20.2% | 11.1% | 9.2% | 6.1% |
| 2017 | 16.6% | 9.2% | 20.3% | 10.1% | 7.9% | 4.5% |
| 2018 | 16.5% | 8.7% | 20.3% | 9.6% | 8.1% | 4.3% |
| 2019 | 13.7% | 7.8% | 17.0% | 8.4% | 5.8% | 4.9% |
| 2020 | 8.5% | 4.3% | 10.9% | 4.8% | 3.2% | 2.1% |
| 2021 | 10.6% | 5.7% | 12.6% | 5.9% | 6.0% | 5.0% |
| 2022 | 12.3% | 7.4% | 14.6% | 8.1% | 7.1% | 4.6% |
| 2023 | 12.0% | 7.7% | 14.4% | 8.7% | 6.5% | 3.6% |
- Notes: The estimates above use the 2018-base Market Basket Measure (MBM) as a measure of poverty. Poverty estimates using the MBM exclude territories.
- The Market Basket Measure (MBM) establishes poverty thresholds based on the cost of a specific basket of goods and services representing a modest, basic standard of living. Poverty thresholds include the costs of food, clothing, shelter, transportation and other items for a reference family. These costs are compared to the disposable income of families to determine whether or not they fall below the poverty line.
- Lower poverty rates observed in 2020 can be largely attributed to the government support provided through COVID-19 benefits, which started in 2020 and were phased out in 2021 and 2022.
- Estimates for 2015 to 2021 are for persons aged 16 years and over, whereas estimates for 2022 and 2023 are for persons aged 15 years and over.
- Source: Statistics Canada, Canadian Income Survey, data retrieved from Table 11-10-0090-01 Poverty and low-income statistics by disability status (Statistics Canada calculations).
Since 2015, poverty rates among persons aged 15 years and over have been on an overall downward trend for both persons with and without disabilities. In 2023, among persons aged 15 years and over,12% of persons with disabilities and 7.7% of persons without disabilities lived in poverty. The gap between poverty rates by disability status has decreased from 9.2 percentage points in 2015 to 4.3 percentage points in 2023. Poverty rates among persons aged 15 to 64 years were generally higher than among those aged 65 years and over. Similarly, the gap in poverty rates by disability status was higher among persons aged 15 to 64 years and lower among those aged 65 years and over, when compared with the overall gap.
10.3 Having unmet needs for assistive aids or devices due to cost
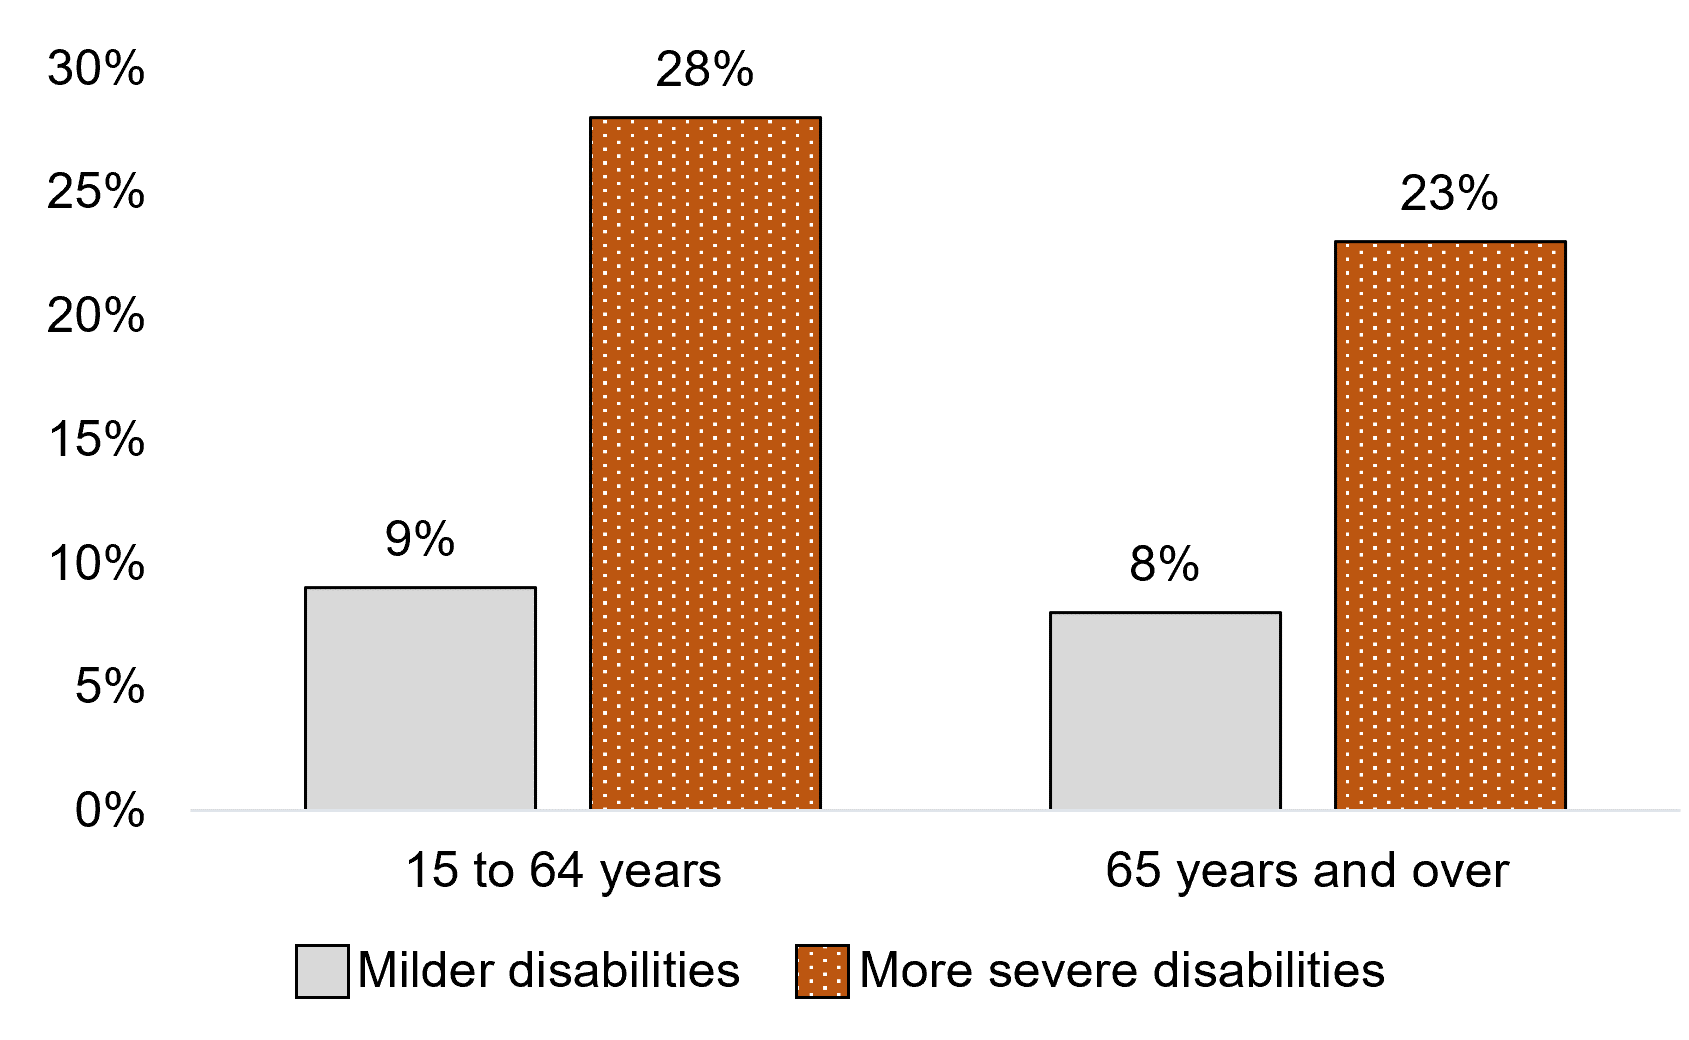
Figure 10.3 - Text description
| Age group | Milder disabilities | More severe disabilities |
|---|---|---|
| 15 to 64 years | 7% | 28%* |
| 65 years and over | 10% | 24%* |
* significantly different from estimate for persons with milder disabilities in the same age group (p<0.05)
- Notes: Assistive aids or devices refer to devices or tools designed or adapted to help persons with disabilities to perform a particular task or activity.
- The estimates above refer to the proportion with unmet needs for assistive aids or devices due to cost among persons with disabilities.
- "Milder" refers to those with mild or moderate disabilities, and "more severe" refers to those with severe or very severe disabilities.
- * significantly different from estimate for persons with milder disabilities in the same age group (p<0.05)
- For both levels of severity, differences between age groups are statistically significant (p<0.05).
- Source: Statistics Canada, Canadian Survey on Disability, 2022 (Social Research Division calculations).
Among persons with disabilities aged 15 to 64 years, those with more severe disabilities were about 4 times as likely as those with milder disabilities to cite cost as a reason for not having assistive aids or devices that they need (28% versus 7%). Among persons with disabilities aged 65 years and over, those with more severe disabilities were over twice as likely as those with milder disabilities to cite cost as a reason for not having assistive aids or devices that they need (24% versus 10%).
10.4 Household food insecurity
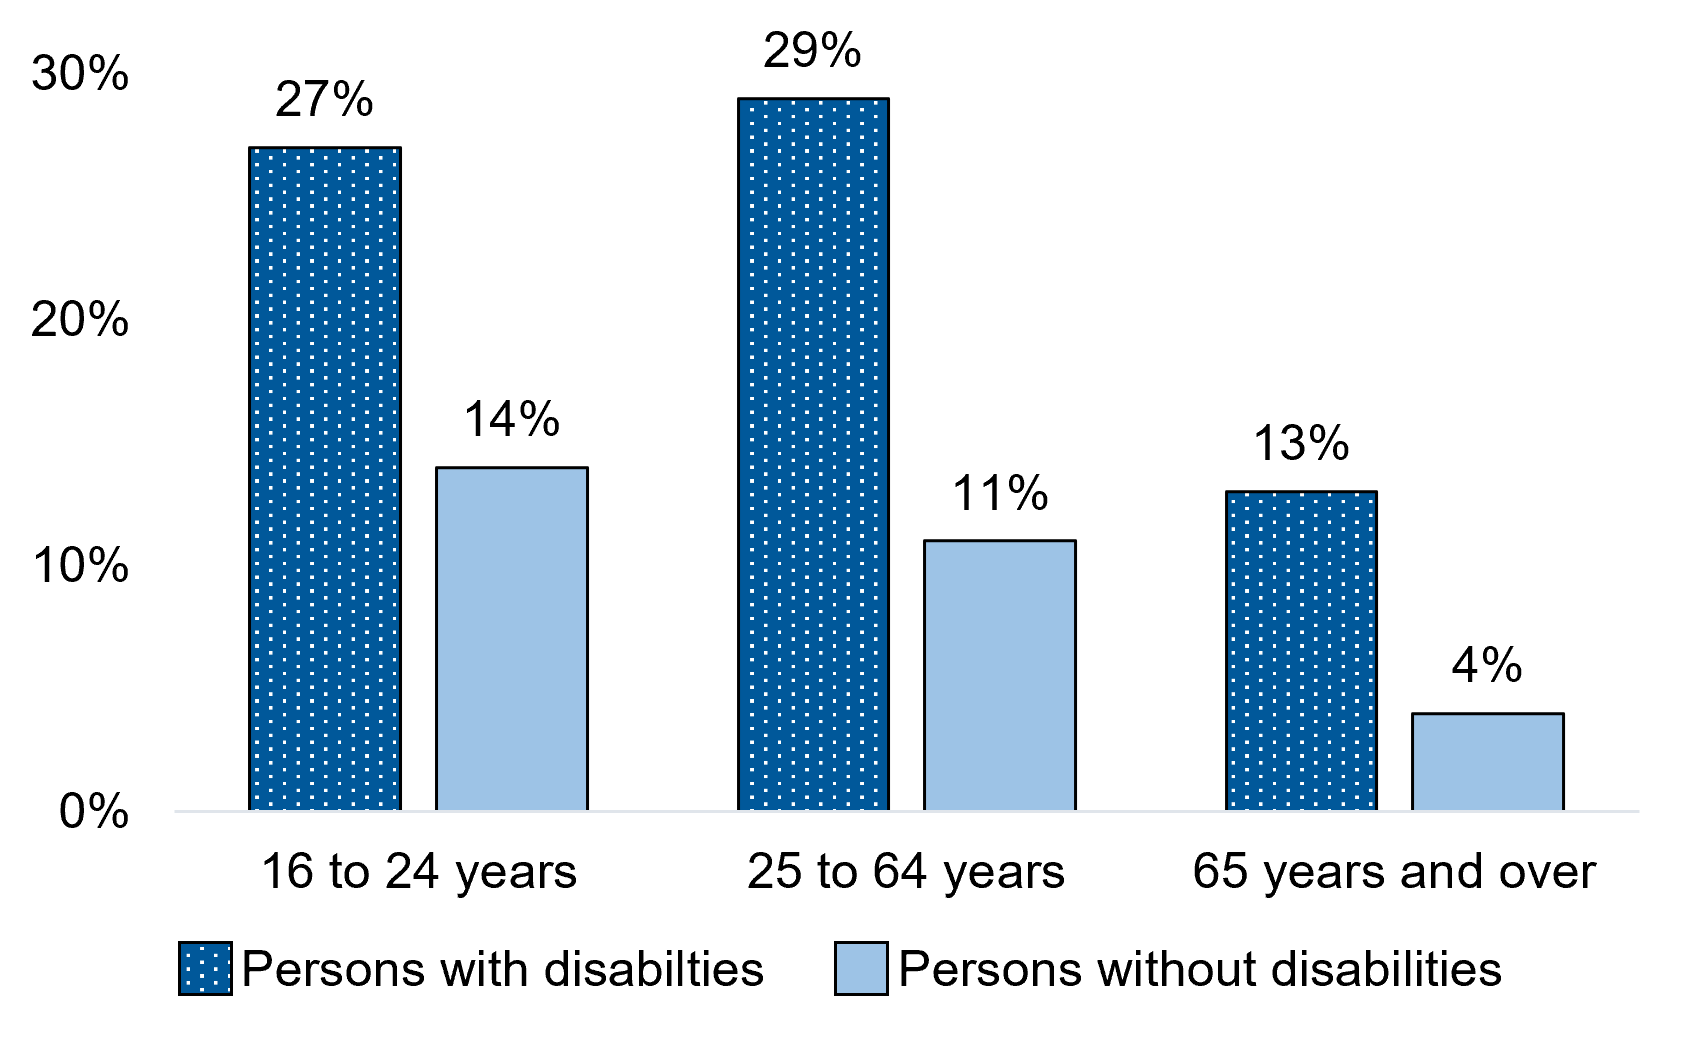
Figure 10.4 - Text description
| Age group | Persons with disabilities | Persons without disabilities |
|---|---|---|
| 16 to 24 years | 27% | 14%* |
| 25 to 64 years | 33% | 12%* |
| 65 years and over | 11% | 4%* |
* significantly different from estimate for persons with disabilities in the same age group (p<0.05)
- Notes: Food insecurity refers to the inability to afford an adequate quality or sufficient quantity of food and nutrition. The estimates above include persons living in households that experienced food insecurity moderately (compromising in quality or quantity of food) or severely (missing meals, reducing food intake, or going one or more days without food) due to limited financial resources.
- A previous version of this indicator (published on December 18th, 2024) using data from the 2020 Canadian Income Survey included persons living in households that experienced marginal (worrying about running out of food and/or limited food selection), moderate, or severe food insecurity.
- * significantly different from estimate for persons with disabilities in the same age group (p<0.05)
- Differences between persons aged 16 to 24 years and those aged 25 to 64 years are statistically significant only for persons with disabilities (p<0.05).
- Differences between persons aged 16 to 24 years and those aged 65 years and over are statistically significant for both persons with and without disabilities (p<0.05).
- Source: Statistics Canada, Canadian Income Survey, 2022 (Social Research Division calculations).
Among persons aged 16 to 24 years, persons with disabilities were more likely than persons without disabilities to live in a food insecure household (27% versus 14%). Among persons aged 25 to 64 years, persons with disabilities were over twice as likely as persons without disabilities to live in a food insecure household (33% versus 12%).
Among persons aged 65 years and over, persons with disabilities were over twice as likely as persons without disabilities to live in a food insecure household (11% versus 4%).
10.5 Tenure status of households
| Tenure status | Persons with disabilities | Persons without disabilities |
|---|---|---|
| Owner | 68% | 74%* |
| Owner with a mortgage | 40% | 48%* |
| Owner without a mortgage | 28% | 26%* |
| Renter | 32% | 27%* |
| Renter in subsidized housing | 5% | 2%* |
| Renter not in subsidized housing | 27% | 25%* |
- Notes: Tenure status refers to whether the household owns or rents their private dwelling.
- The estimates above are for those living in private dwellings. Those living in collective dwellings such as hospitals and nursing homes are not included.
- A household is considered to own their dwelling if some member of the household owns the dwelling. If no member of the household owns the dwelling, the household is considered to rent their dwelling.
- The estimates above are based on data obtained from the 2021 Census of Population.
- * significantly different from estimate for persons with disabilities with the same tenure status (p<0.05)
- Source: Statistics Canada, Canadian Survey on Disability, 2022 (Social Research Division calculations).
Persons with disabilities were less likely than those without disabilities to live in a private dwelling owned by them or by a member of their household (68% versus 74%). They were less likely to live in a dwelling with a mortgage (40% versus 48%), however, they were slightly more likely to live in a dwelling without a mortgage (28% versus 26%). Persons with disabilities were more likely than those without disabilities to live in a rented dwelling (32% versus 27%). This was the case whether the rented dwelling was subsidized (5% versus 2%) or not subsidized (27% versus 25%).