
12. Canadian Indicators for the United Nations Convention on the Rights of Persons with Disabilities (CRPD) – article 30: participation in cultural life, recreation, leisure, and sport
On this page
- 12.1 Participation in a sports or recreational organization
- 12.2 Participation in a cultural or educational organization
- 12.3 Active leisure
- 12.4 Passive leisure
Alternate formats
A PDF version of the Canadian Indicators for the United Nations Convention on the Rights of Persons with Disabilities is available on the index page.
12.1 Participation in a sports or recreational organization
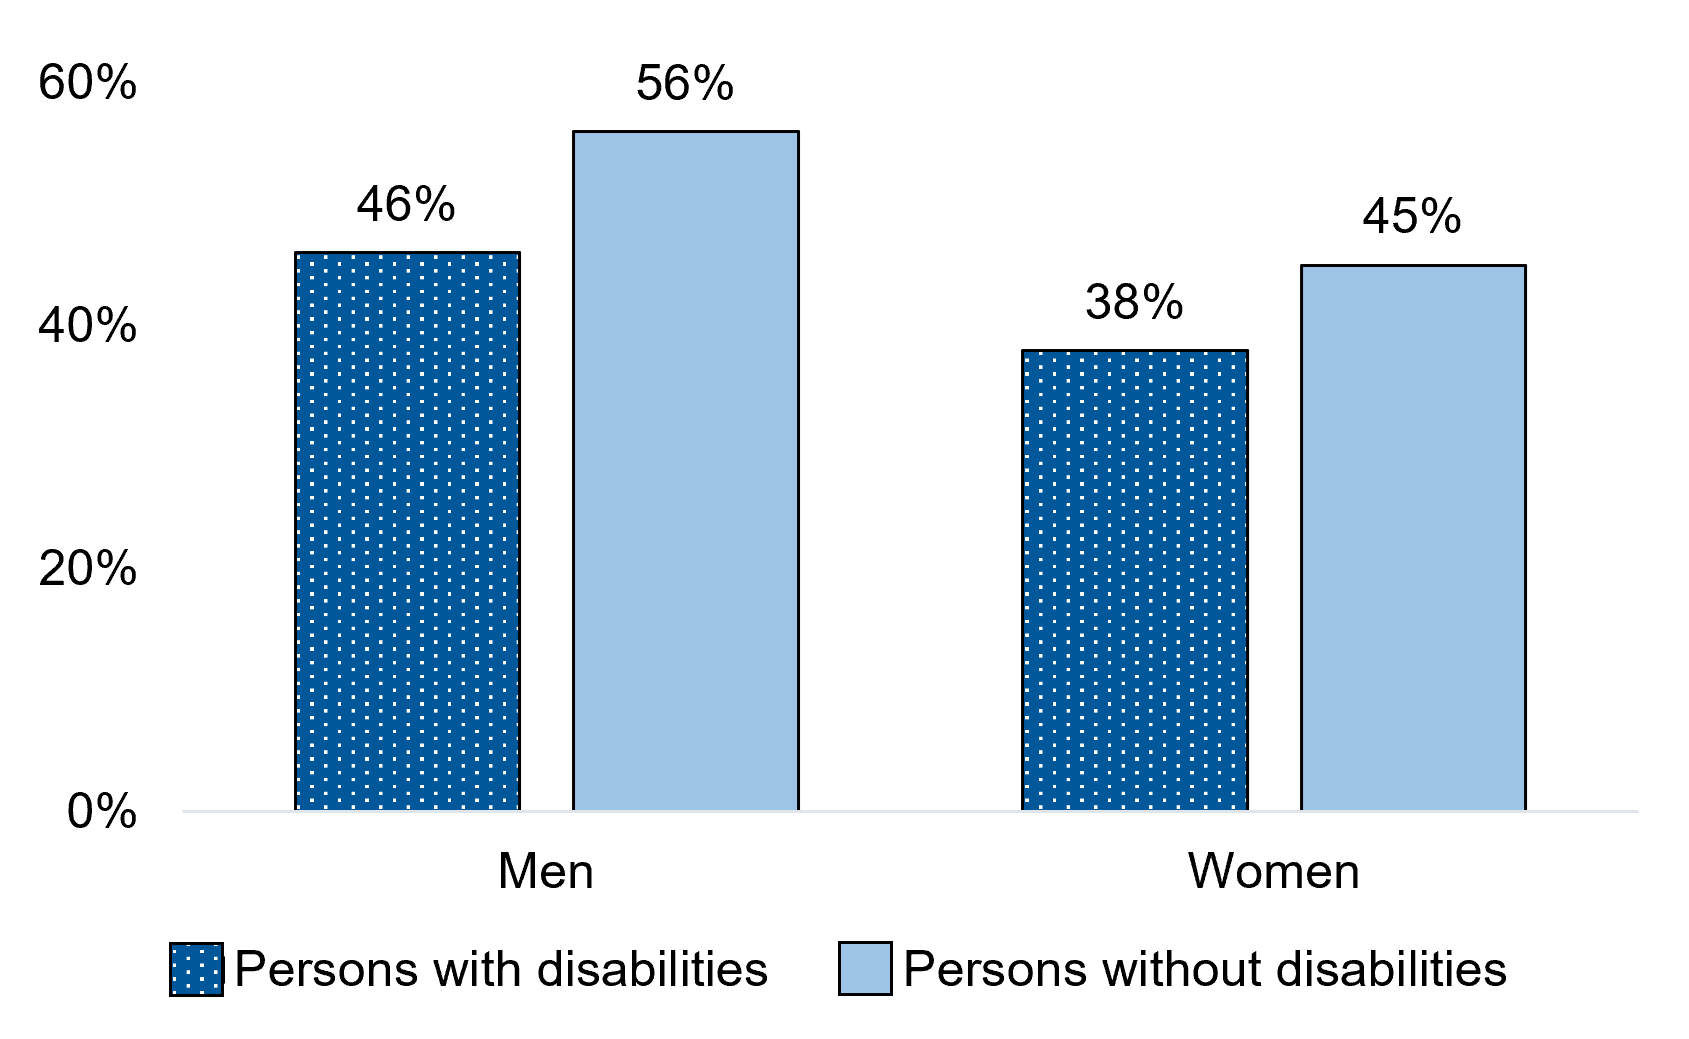
Figure 12.1 – Text description
| Gender | Persons with disabilities | Persons without disabilities |
|---|---|---|
| Men+ | 46% | 56%* |
| Women+ | 38% | 45%* |
- * significantly different from estimate for persons with disabilities in the same gender category (p<0.05)
- Notes: Respondents were asked whether they were a member or participant in a "sports or recreational organization (e.g., hockey league, health club or golf club)" in the past 12 months.
- To protect the confidentiality of non-binary persons, a two-category gender variable was used, given the relatively small size of this population in Canada. Non-binary respondents were redistributed into the men and women categories, denoted as "men+" and "women+" in charts and tables.
- * significantly different from estimate for persons with disabilities in the same gender category (p<0.05)
- Differences between men and women were statistically significant for both persons with and without disabilities (p<0.05).
- Source: Statistics Canada, General Social Survey - Social Identity, 2020 (Social Research Division calculations).
Persons with disabilities were less likely than those without disabilities to have participated in a sports or recreational organization in the last 12 months. Among persons with disabilities, 46% of men and 38% of women reported participating in a sports or recreational organization in the last 12 months. This compares to 56% of men and 45% of women without disabilities.
12.2 Participation in a cultural or educational organization
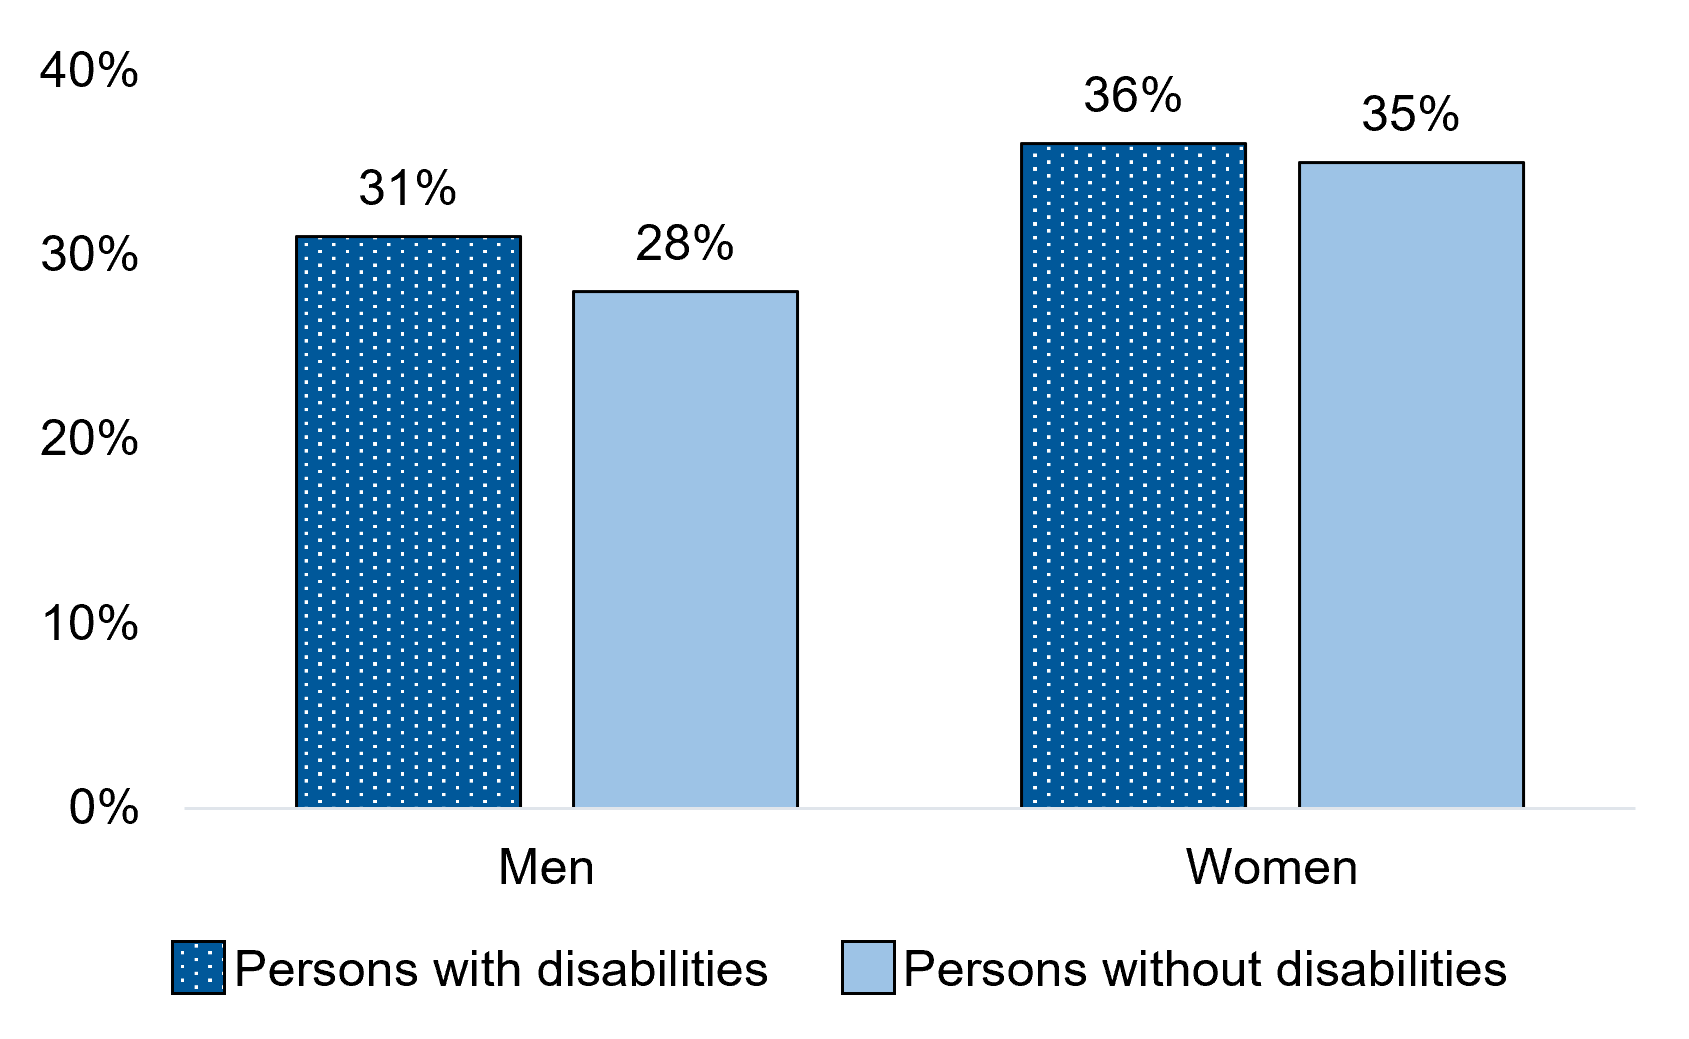
Figure 12.2 – Text description
| Gender | Persons with disabilities | Persons without disabilities |
|---|---|---|
| Men+ | 31% | 28% |
| Women+ | 36% | 35% |
- Notes: Respondents were asked whether they were a member or participant in a "cultural, educational or hobby organization (e.g., theatre group, book club or bridge club)" in the past 12 months.
- To protect the confidentiality of non-binary persons, a two-category gender variable was used, given the relatively small size of this population in Canada. Non-binary respondents were redistributed into the men and women categories, denoted as "men+" and "women+" in charts and tables.
- For both men and women, differences between persons with and without disabilities were not statistically significant (p<0.05).
- For both persons with and without disabilities, differences between men and women were statistically significant (p<0.05).
- Source: Statistics Canada, General Social Survey - Social Identity, 2020 (Social Research Division calculations).
Women were more likely than men to report participating in a cultural or educational organization. This was the case among both persons with disabilities (36% versus 31%) and persons without disabilities (35% versus 28%).
12.3 Active leisure
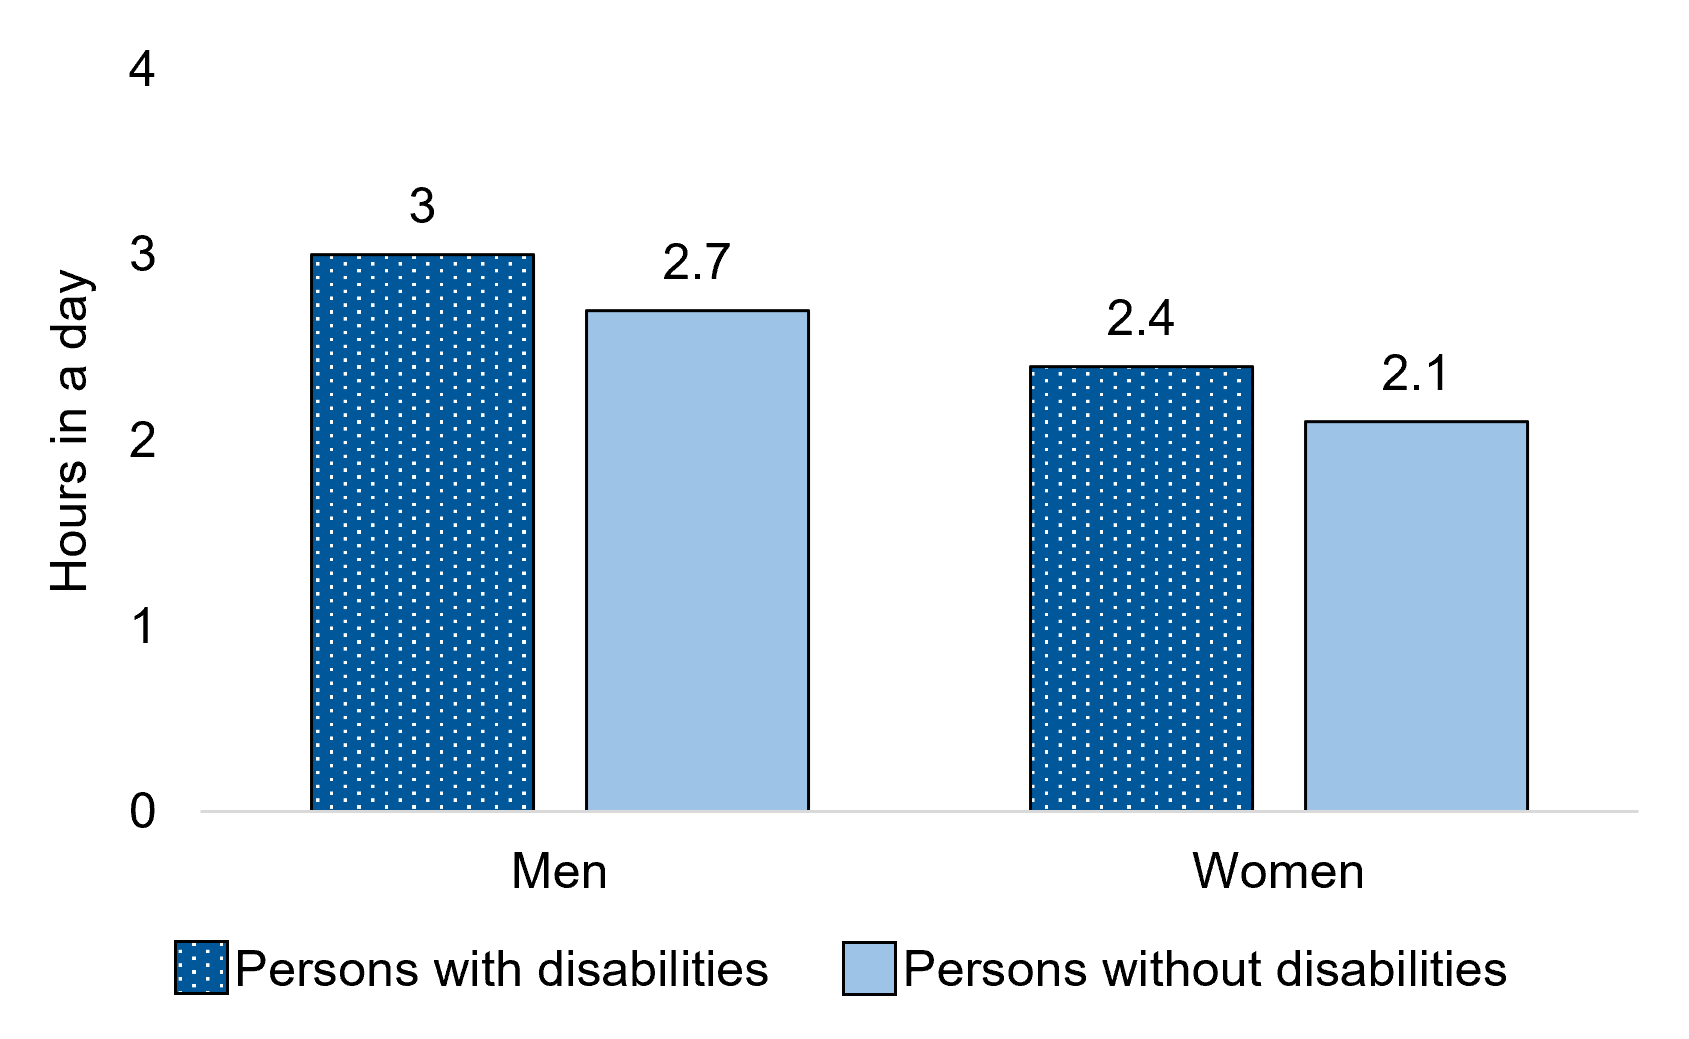
Figure 12.3 – Text description
| Gender | Persons with disabilities | Persons without disabilities |
|---|---|---|
| Men+ | 3.5 hours | 3.2 hours |
| Women+ | 2.5 hours | 2.2 hours* |
- * significantly different from estimate for persons with disabilities in the same gender category (p<0.05)
- Notes: Active leisure refers to the following activity types: arts, hobbies or playing games (drawing, painting, crafting, writing, playing an instrument, dancing, collecting, knitting, photography, board or card games, video games, gambling); leisure or outdoor activities (fishing, hunting, camping, birdwatching, boating, horseback riding, window-shopping); or use of technology (general computer use, Internet, art, music or video production).
- To protect the confidentiality of non-binary persons, a two-category gender variable was used, given the relatively small size of this population in Canada. Non-binary persons were redistributed into the men and women categories, denoted as "men+" and "women+" in charts and tables.
- * significantly different from estimate for persons with disabilities in the same gender category (p<0.05)
- Differences between men and women were statistically significant for both persons with and without disabilities (p< 0.05).
- Source: Statistics Canada, General Social Survey - Time Use, 2022 (Social Research Division calculations).
Among women aged 15 years and over, on average, those with disabilities spent more time in a day on active leisure activities (2.5 hours) than women without disabilities (2.2 hours). On average, men spent more time in a day doing active leisure activities than women. This was the case for both persons with disabilities (3.5 versus 2.5 hours) and persons without disabilities (3.2 versus 2.2 hours).
12.4 Passive leisure
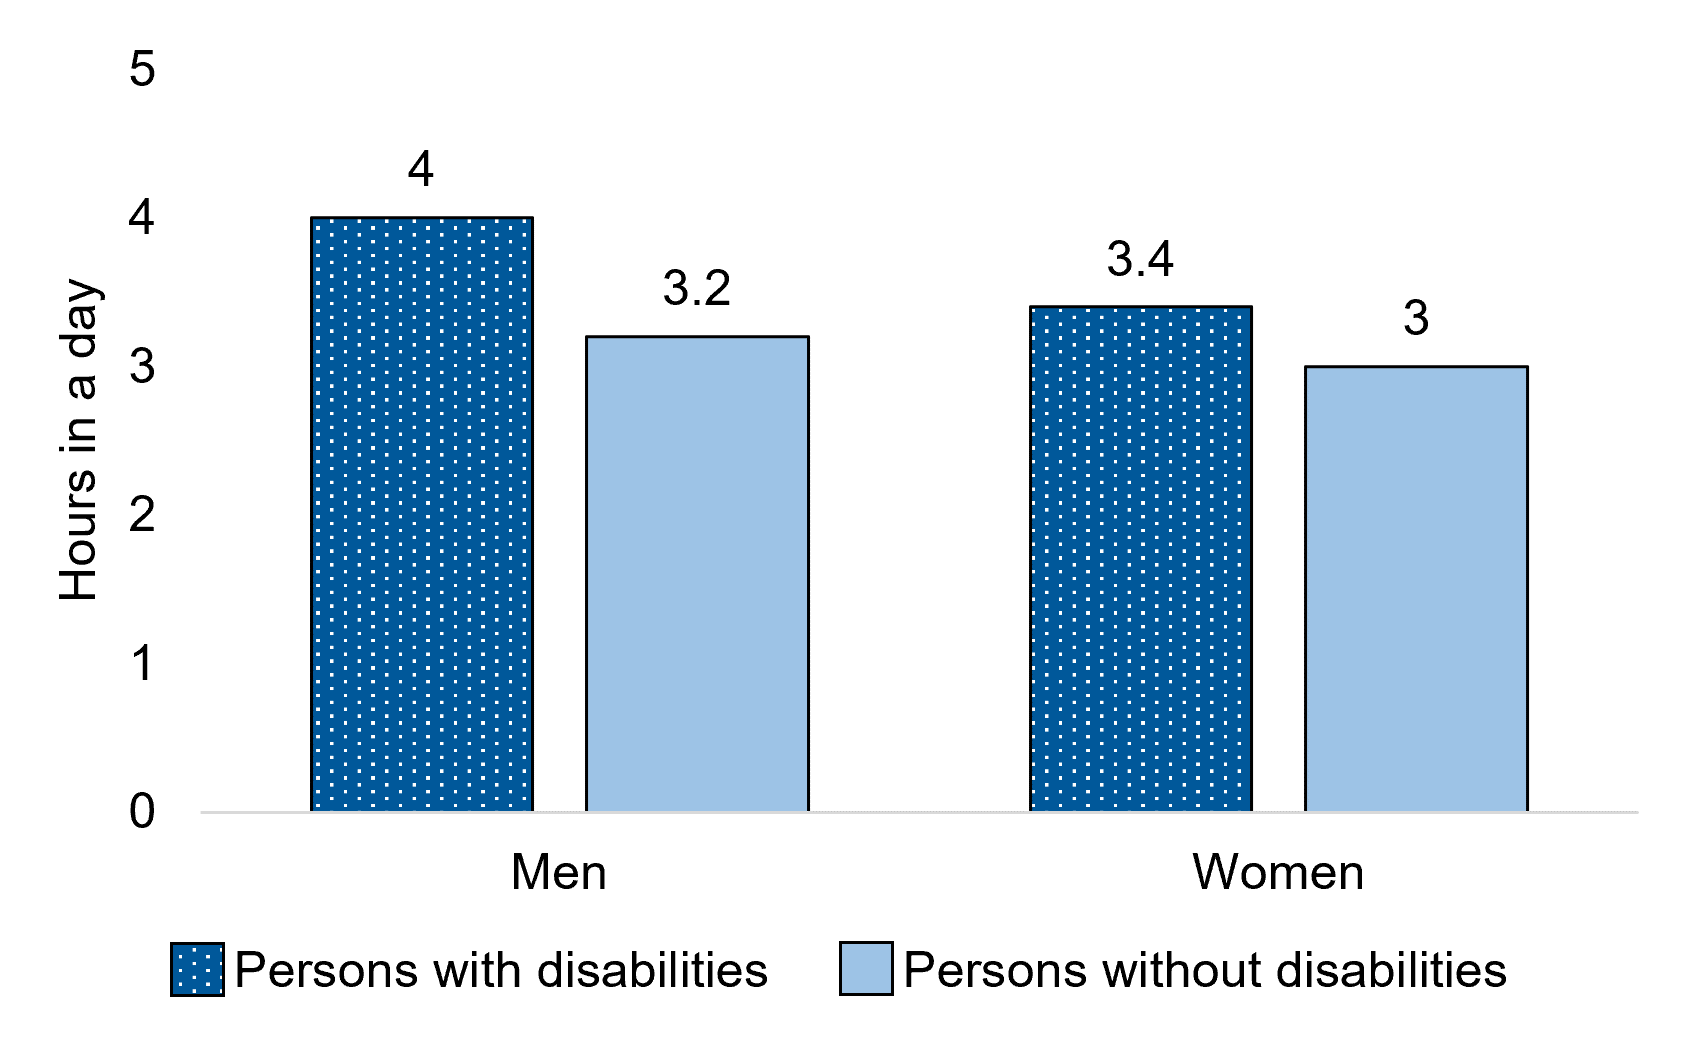
Figure 12.4 - Text description
| Gender | Persons with disabilities | Persons without disabilities |
|---|---|---|
| Men+ | 3.8 hours | 3.3 hours* |
| Women+ | 3.5 hours | 3.1 hours* |
- * significantly different from estimate for persons with disabilities in the same gender category (p<0.05)
- Notes: Passive leisure refers to the following activity types: reading (online or paper version books, periodicals, newspapers); watching television shows, movies or videos online or TV broadcast; or listening to music, radio or podcasts online or radio broadcasts.
- To protect the confidentiality of non-binary persons, a two-category gender variable was used, given the relatively small size of this population in Canada. Non-binary persons were redistributed into the men and women categories, denoted as “men+” and “women+” in charts and tables.
- * significantly different from estimate for persons with disabilities in the same gender category (p<0.05)
- Differences between men and women were statistically significant for both persons with and without disabilities (p< 0.05).
- Source: Statistics Canada, General Social Survey - Time Use, 2022 (Social Research Division calculations).
Among men aged 15 years and over, on average, men with disabilities spent more time in a day on passive leisure activities (3.8 hours) than men without disabilities (3.3 hours). Among women aged 15 years and over, on average, women with disabilities spent more time in a day on passive leisure activities (3.5 hours) than women without disabilities (3.1 hours).