
Statistical annex to the 2023 Voluntary National Review of Canada
Alternate formats

Statistical annex to the 2023 Voluntary National Review of Canada [PDF - 3.15 MB]
Large print, braille, MP3 (audio), e-text and DAISY formats are available on demand by ordering online or calling 1 800 O-Canada (1-800-622-6232). If you use a teletypewriter (TTY), call 1-800-926-9105.
Message from the Chief Statistician of Canada
Statistics Canada's mission, as Canada's national statistical office, is to provide high-quality statistical information that helps Canadians better understand their country—its population, resources, economy, society and culture.
As the central focal point for reporting Canada's progress on the 2030 Agenda for Sustainable Development, we understand the importance of "leaving no one behind" and support the Agenda's focus on the most vulnerable people in our society. To better measure the experiences and outcomes of the most vulnerable people in Canada on both the Global and Domestic Indicator Frameworks, we are constantly looking at leveraging new data sources and methods. In the spirit of collaboration fostered by the Sustainable Development Goals (SDGs), we remain committed to building and strengthening our partnerships with government departments, the private sector, non-governmental organizations (NGOs) and international organizations through international and domestic engagements to support the measurement of the SDGs and further the 2030 Agenda.
This Statistical Annex to the 2023 Voluntary National Review (VNR) of Canada presents an opportunity for the country to look back and evaluate the progress achieved since the implementation of the 2030 Agenda and, more recently, since the last VNR in 2018. As statistics are more than just data, the report leverages statistical and contextual information in addition to robust data to present a picture of Canada through a wide-ranging set of indicators highlighting progress made towards the achievement of the SDGs. It also allows us to shine a light on areas of sustainable development and society where progress has been made and others where progress has stalled or deteriorated. This information provides clarity on areas of society where renewed efforts are required to ensure equitable and sustainable progress that leaves no one behind.
I am pleased to present the Statistical Annex to Canada's second Voluntary National Review.
Signature
Anil Arora
Chief Statistician of Canada
Introduction
This Statistical Annex accompanies Canada's 2023 VNR on the SDGs. This is Canada's second VNR after the first one which was completed in 2018. Significant progress in the implementation of the 2030 Agenda and many accomplishments have been realized in the 5 years since the last review. Statistics Canada's mandate for the national implementation of the 2030 Agenda is to identify or develop and report on Canada specific indicators and their progress for the achievement of the SDGs.
This includes the development and implementation of the Canadian Indicator Framework (CIF) in 2021 to complement the global indicators. The CIF was developed collaboratively with Federal departments and agencies to reflect national priorities. Both the Global and Domestic Frameworks are monitored and reported regularly through interactive data hubs based on Open SDG, an open-source platform. These data hubs are accessible to all and allow users to access the latest and most complete data reporting on the SDGs for Canada.
This Statistical Annex leverages both the Global and Domestic Indicator Frameworks to highlight Canada's overall progress on the SDGs with a focus on the progress made since the last VNR in 2018. It is intended as an accompanying document to the main body of the VNR to allow for further statistical exploration by complementing what is presented in the main report with additional contextual information and to present progress. This statistical annex disaggregates indicator data to analyze and present a more detailed picture of recent trends and their potential impact on progress.
Indicators that present recent progress and trends, especially between the 2018 and 2023 period, were prioritized to be featured in this Statistical Annex. Further, indicators were selected for their potential to present a complete detailed analysis of progress for various sub-national groups such as vulnerable and racialized populations, or to highlight geographic regions in Canada. Both the Global and Domestic indicator frameworks are used to present Canada's progress in this report. While indicators that are part of the Global SDG Framework were prioritized for this Statistical Annex, indicators from the CIF were selected if they presented more recent or relevant data on the themes discussed.Footnote 1
Statistical Profile of Canada
Canada is a geographically large and diverse country comprised of 10 provinces and 3 territories with a population totalling more than 39.5 million inhabitants on January 1, 2023.Footnote 2 Although the country covers a vast area, residents are mainly located in larger population centres along the southern border with the United States. The country's population grew by more than 7.5% between 2018 and 2023, largely a result of international immigration. As reported by the Census of Population, immigrants represented 23% of the total Canadian population in 2021.Footnote 3
Canada benefits from a well-educated population as 63% of its working-age population had attained post-secondary education in 2022, an ongoing increasing trend.Footnote 4 Overall, a larger proportion of women (69%) had achieved post-secondary education than men (56%) with an even more pronounced trend observed among the younger population.
As the effects of the COVID-19 pandemic spread through Canada, the employment rate for persons aged 15 and over fell to a low of 52% in April 2020.Footnote 5 However, as the economy recovered and certain public health measures were lifted, the employment rate returned to its pre-pandemic level at 62% in 2022. The employment rate among men was higher at 66% compared to 58% for women in 2022.
Overall, Canadians benefit from universally accessible health care and social programs administered by various levels of government. The proportion of total government spending on essential services such as education, health and social protection totalled 65.1% in 2021Footnote 6. Nonetheless, some Canadians remain in more vulnerable situations: in 2021, 7.4% of Canadians lived below the national poverty lineFootnote 7, 12.9% could not afford the food they neededFootnote 8, and 10.1% of households lived in core housing need in 2021Footnote 9.
Overview of Canada's Reporting on the SDGs
Statistics Canada is continually working to improve Canada's measurement and reporting of the SDGs. These efforts are geared towards filling existing data gaps in reporting and enhancing the availability of new data to allow further disaggregation to provide a more detailed picture of progress towards the goals.
One method that Statistics Canada has developed to improve SDG reporting is a tool to evaluate the suitability of non-official data to fill existing data gaps. This tool and accompanying methodology were developed to standardize and provide a robust method allowing the agency to assess and harness data from civil society and other non-governmental organizations to fill existing data gaps within Canada's reporting on the SDGs. This approach has already been implemented with success and has resulted in the additional reporting of two indicators. Using this tool, the aim is to be able to assess other data sets for further SDG reporting opportunities.
Figures 1 and 2 below show Canada's reporting improvements on the global indicators made since 2018, highlighting data successes and data gaps remaining. The light-coloured portion of the bar indicates the number of indicators that were reported in 2018 while the darker coloured one shows the additional indicators reported on since.
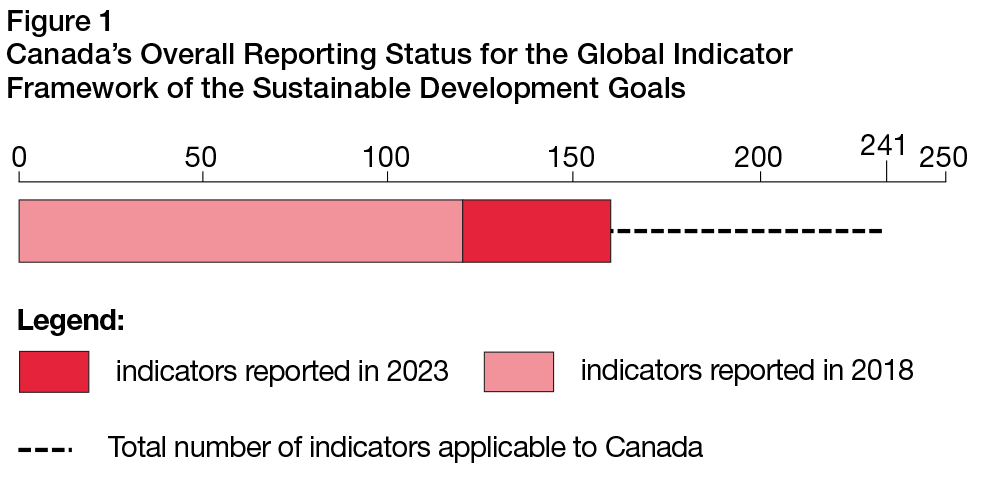
Text description - Figure 1
There are 241 total indicators applicable to Canada's Global Indicator Framework. In 2018, Canada reported on 120 indicators. In 2023, Canada reported on 161 indicators.
| Year | Number of indicators |
|---|---|
| 2018 | 120 |
| 2023 | 161 |
| Total | 241 |
Overall, Canada reports on 161 of the Global SDG indicators, representing 66.8% of all the global indicators applicable to Canada. Across the various goals, the reporting situation varies widely as shown in Figure 2 below, which highlights where reporting improvements occurred, and which SDGs would benefit from additional effort to improve reporting.
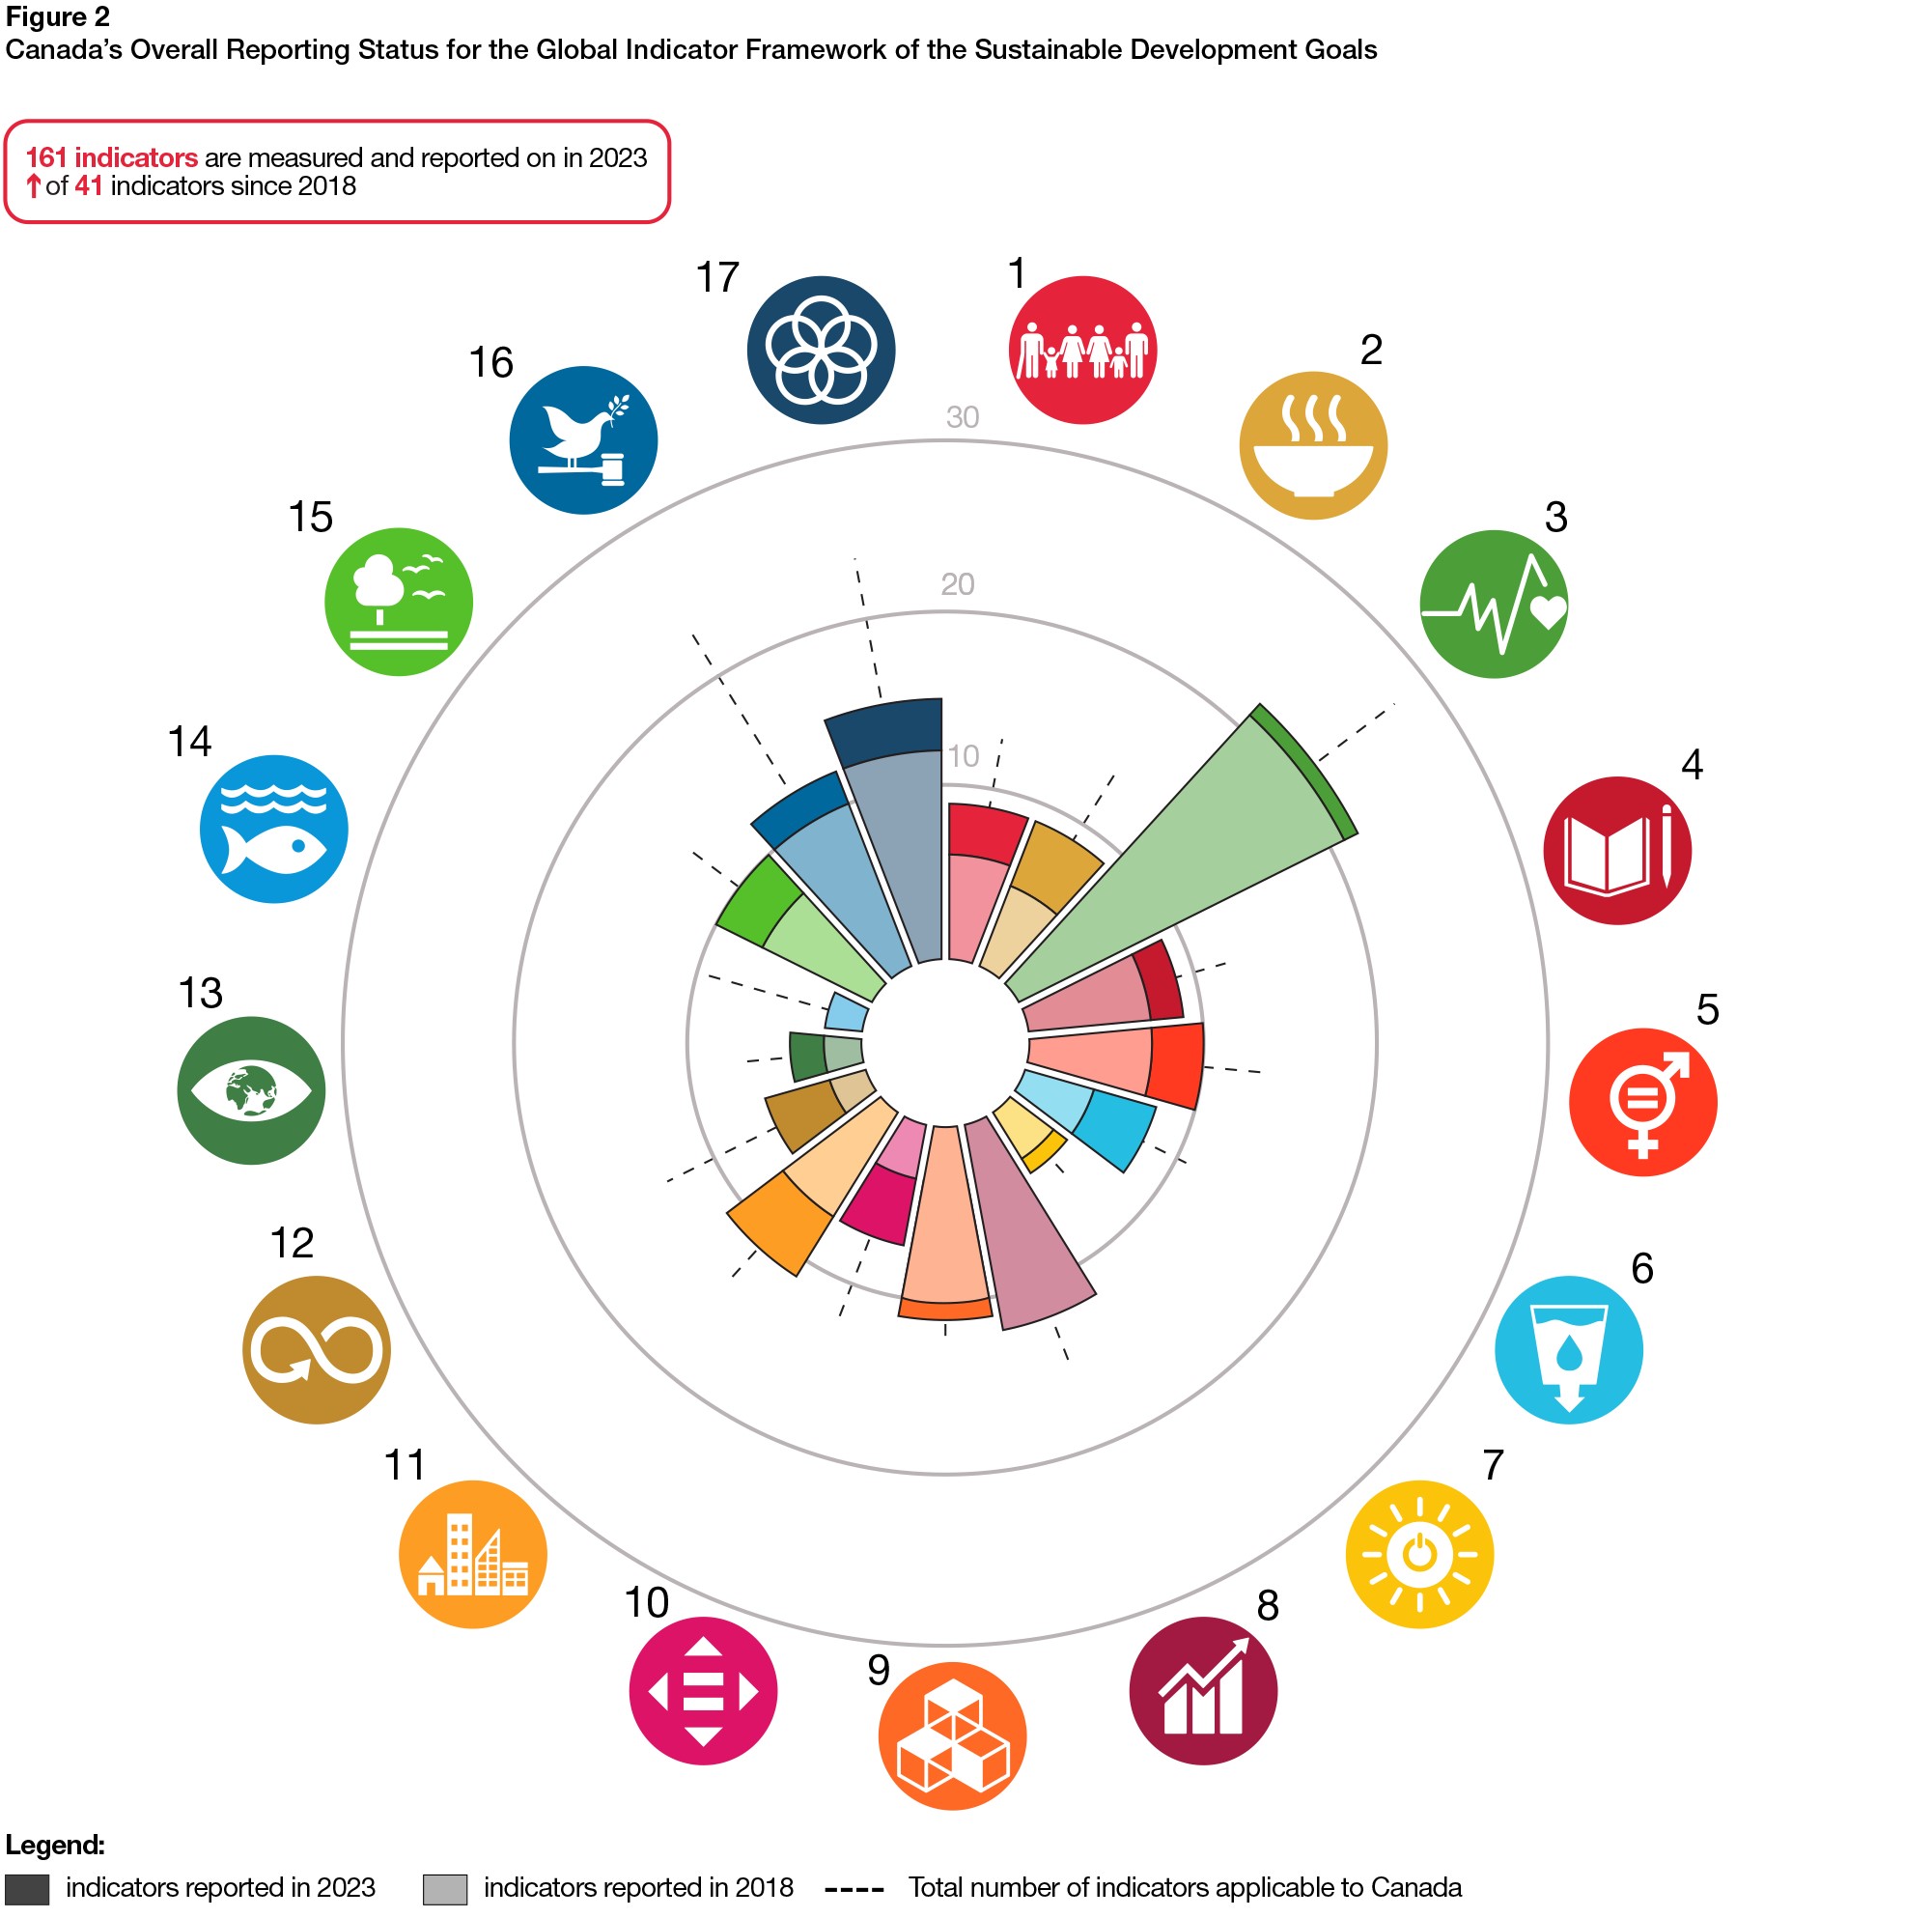
Text description - Figure 2
Between 2018 and 2023, a total of 41 indicators were newly reported to Canada's reporting on the Global Indicator Framework.
| Goal | Indicators reported in 2018 | Indicators reported in 2023 | Total indicators applicable to Canada |
|---|---|---|---|
| 1 | 6 | 9 | 13 |
| 2 | 5 | 9 | 14 |
| 3 | 21 | 22 | 28 |
| 4 | 7 | 9 | 12 |
| 5 | 7 | 10 | 14 |
| 6 | 4 | 8 | 11 |
| 7 | 3 | 4 | 5 |
| 8 | 12 | 12 | 15 |
| 9 | 10 | 11 | 12 |
| 10 | 3 | 7 | 12 |
| 11 | 7 | 11 | 14 |
| 12 | 2 | 6 | 13 |
| 13 | 2 | 4 | 7 |
| 14 | 2 | 2 | 10 |
| 15 | 7 | 10 | 14 |
| 16 | 10 | 12 | 23 |
| 17 | 12 | 15 | 24 |
| Total | 120 | 161 | 241 |
Overview of Canada's Progress on the 2030 Agenda
Measuring and monitoring progress with reliable information is key in understanding how Canada advances towards achieving the SDGs. Monitoring Canada's progress towards the targets and ambitions on SDG indicators illustrates where the country is moving forward but it also serves to highlight where progress is slower.
A robust measure of progress quantifies an indicator's progress towards reaching the target in a scientific manner and can be used as a tool to better understand the success of policies and actions taken to achieve those targets. It can also act as a clear signal to decision makers to readjust or develop effective evidence-based policies to help ensure Canada achieves its targets, especially in areas where progress is weaker.
To present progress towards the SDGs, Statistics Canada has developed a robust and simple method of measuring progress which can be reported using visualizations that allow data users to easily see areas of progress or weakness (Table 1)Footnote 10. Even in the absence of specific quantitative targets, an estimate of progress can inform whether progress in Canada is trending in the desired direction or not, which can be measured and reported on. In essence, this measure of progress provides a simplified illustration of Canada's progress on achieving the SDGs, assuming that the current trends are maintained. These progress visualizations are included throughout this Statistical Annex for featured indicators where it is possible to calculate a measure of progress.
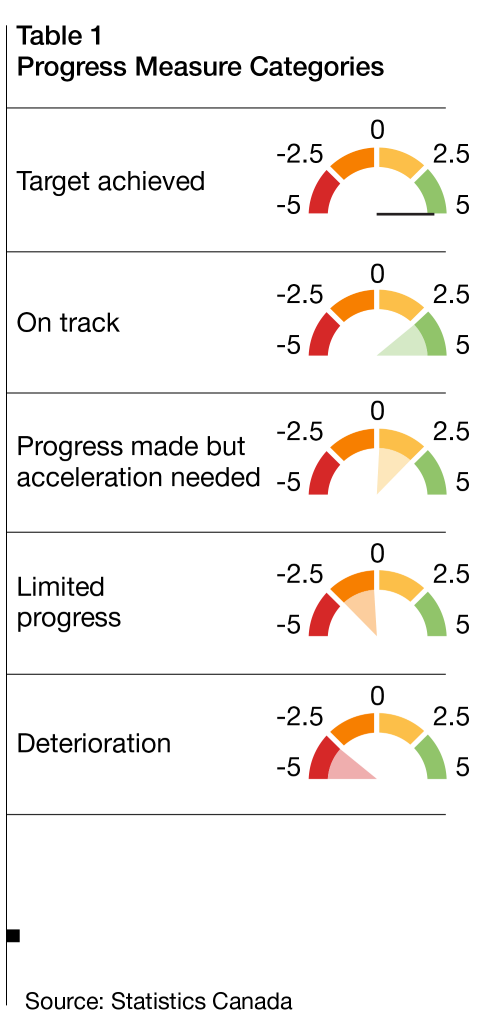
Text description - Table 1
To present progress towards the Sustainable Development Goals, progress measurement icons are used. There are 5 possible progress statuses, including: target achieved, on track, progress made but acceleration needed, limited progress, and deterioration.
| Target achieved |
| On track |
| Progress made but acceleration needed |
| Limited progress |
| Deterioration |
- Source: Statistics Canada
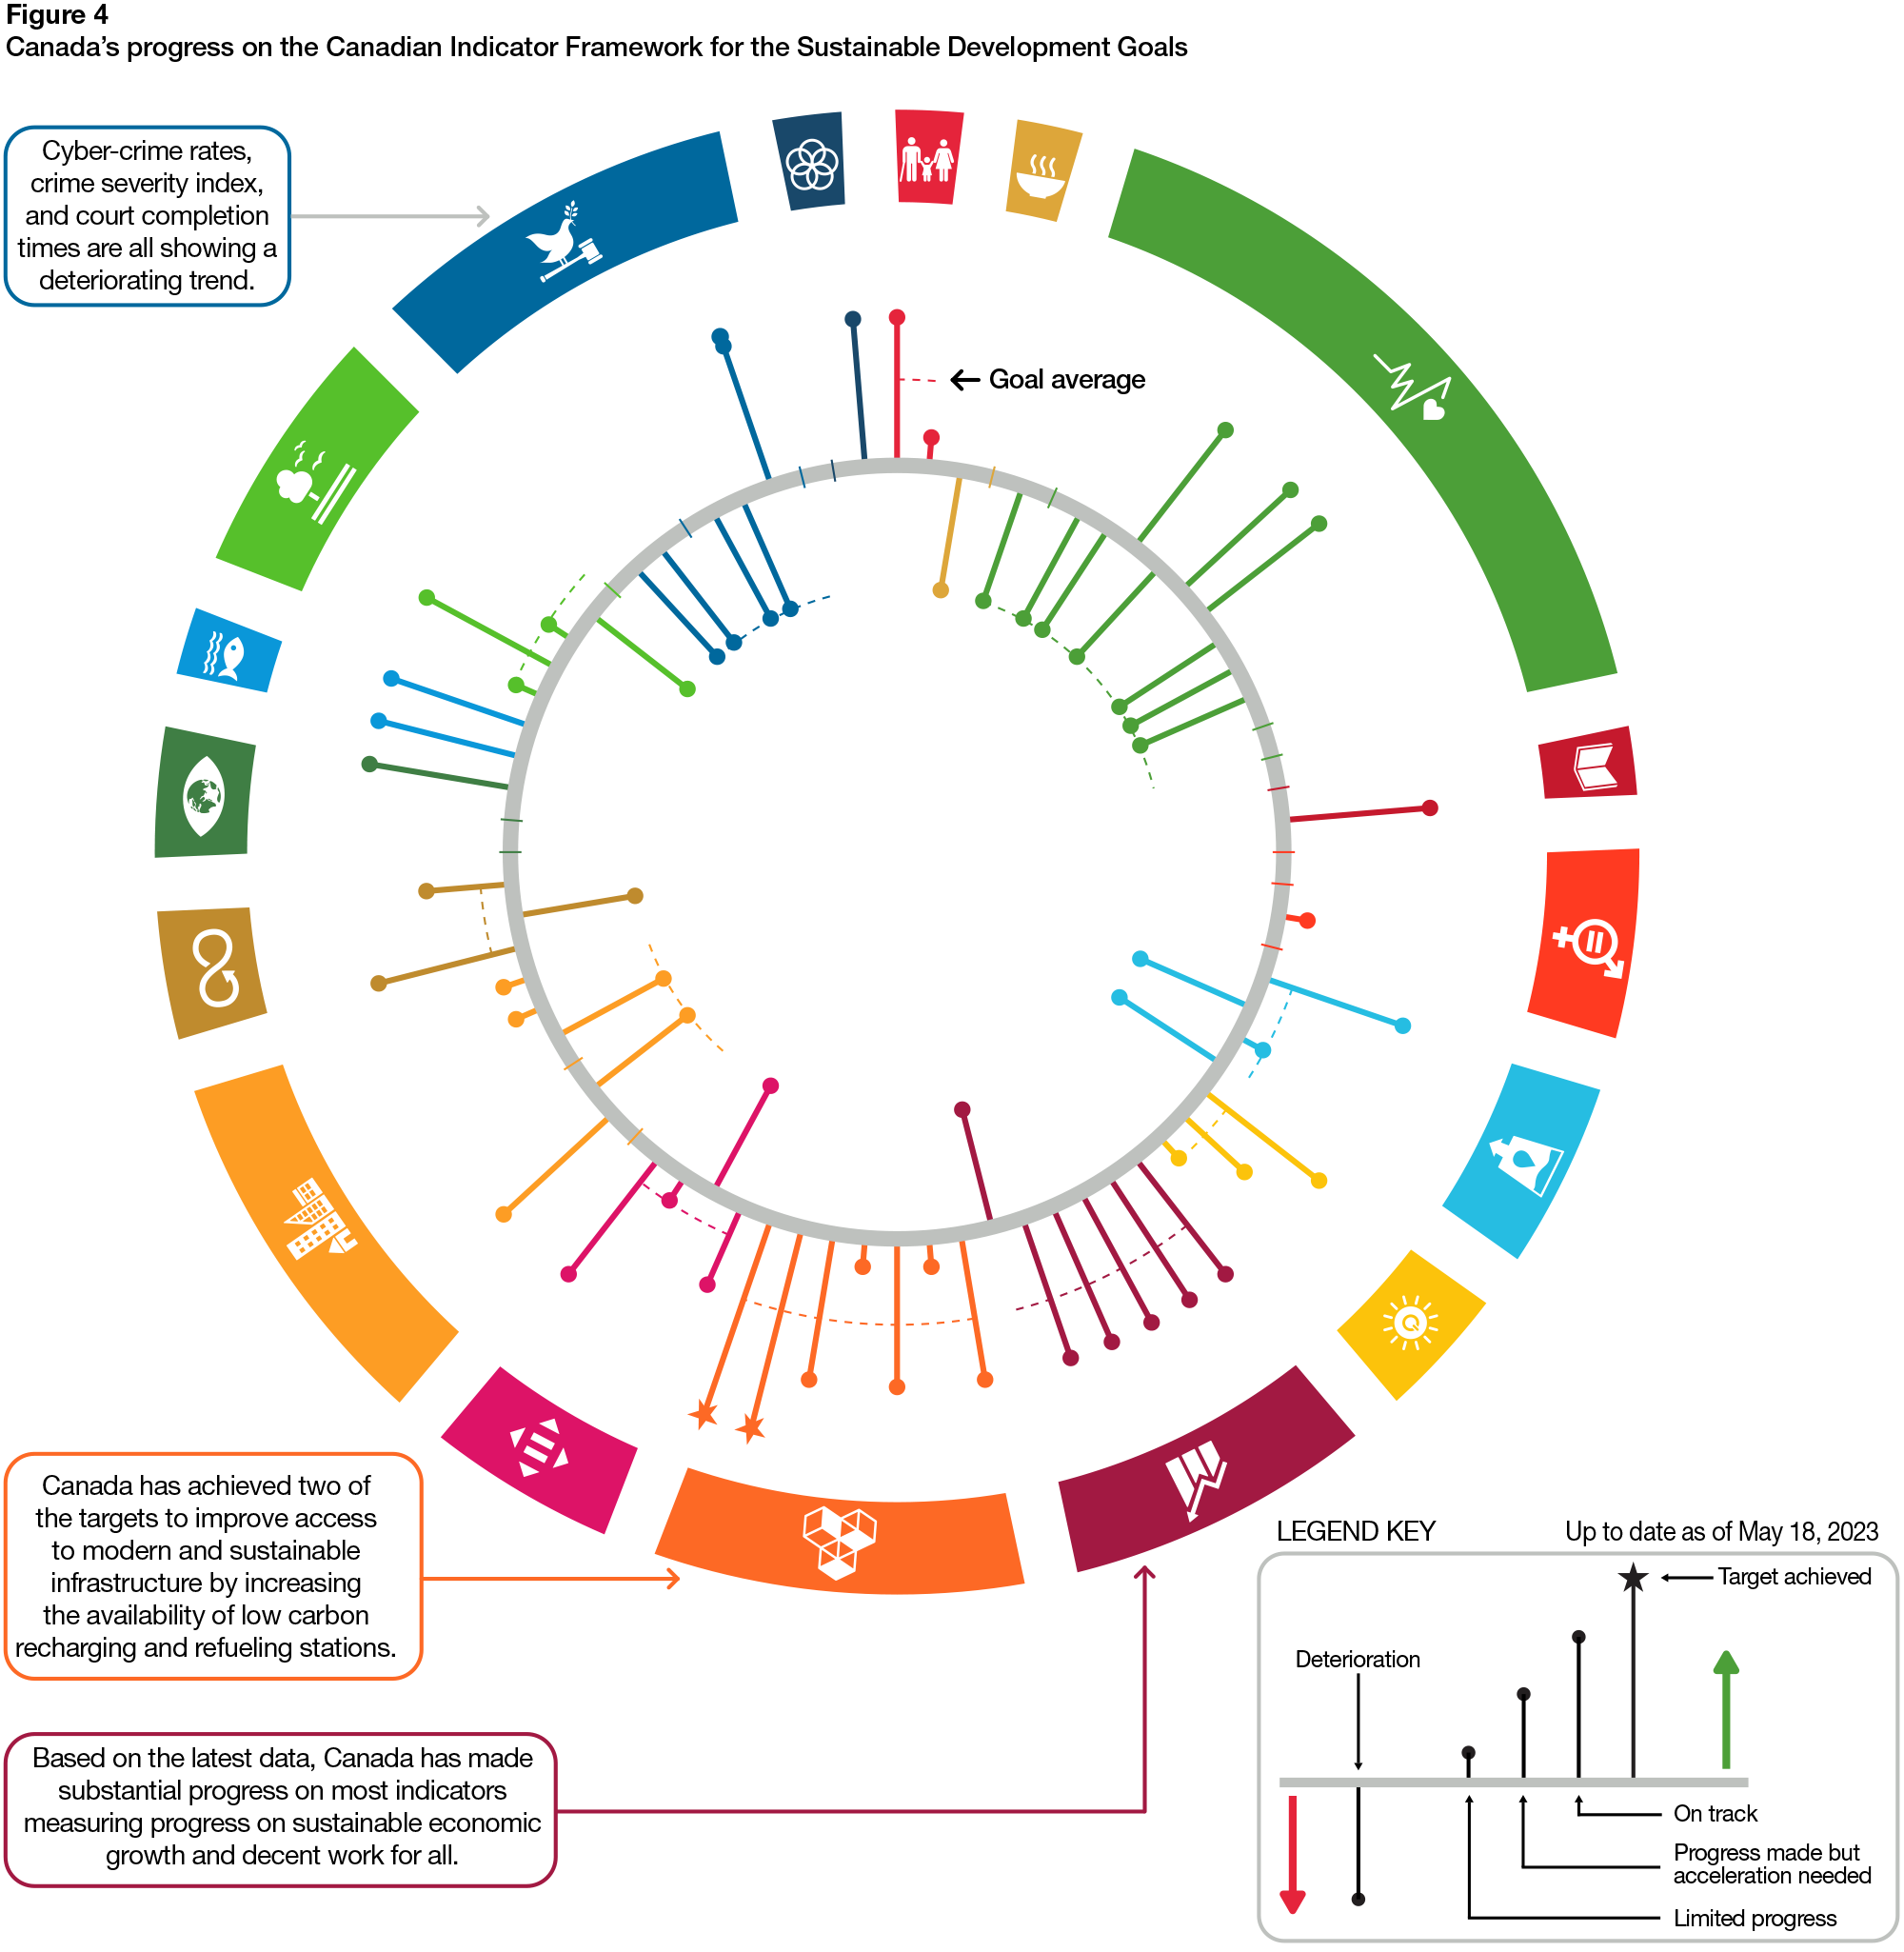
Both Figure 3 and Figure 4 below illustrate Canada's progress on the 2 indicator frameworks underpinning the goals and ambitions of the 2030 Agenda in Canada. Looking at the figures below, progress is shown as a line where the centre circle represents the status quo. The further it reaches away from the central axis, the better the progress. A target that is currently achieved is represented by a star at the end of the bar. On the other hand, as the bar goes inwards towards the middle, the more the indicator is deteriorating away from its target. Indicators for which progress cannot be calculated yet, are denoted as a notch on the axis.
Figure 3 illustrates Canada's progress on the Global indicators which shows that the country has achieved the targets for 17 of the 161 Global indicators that Canada reports on. However, progress remains lacklustre for some, notably SDG 16 – Peace, Justice, and Strong Institutions. Figure 3 shows that for several SDGs, the majority of indicators reported under a goal are showing positive progress as demonstrated by the lines pointing away from the centre.
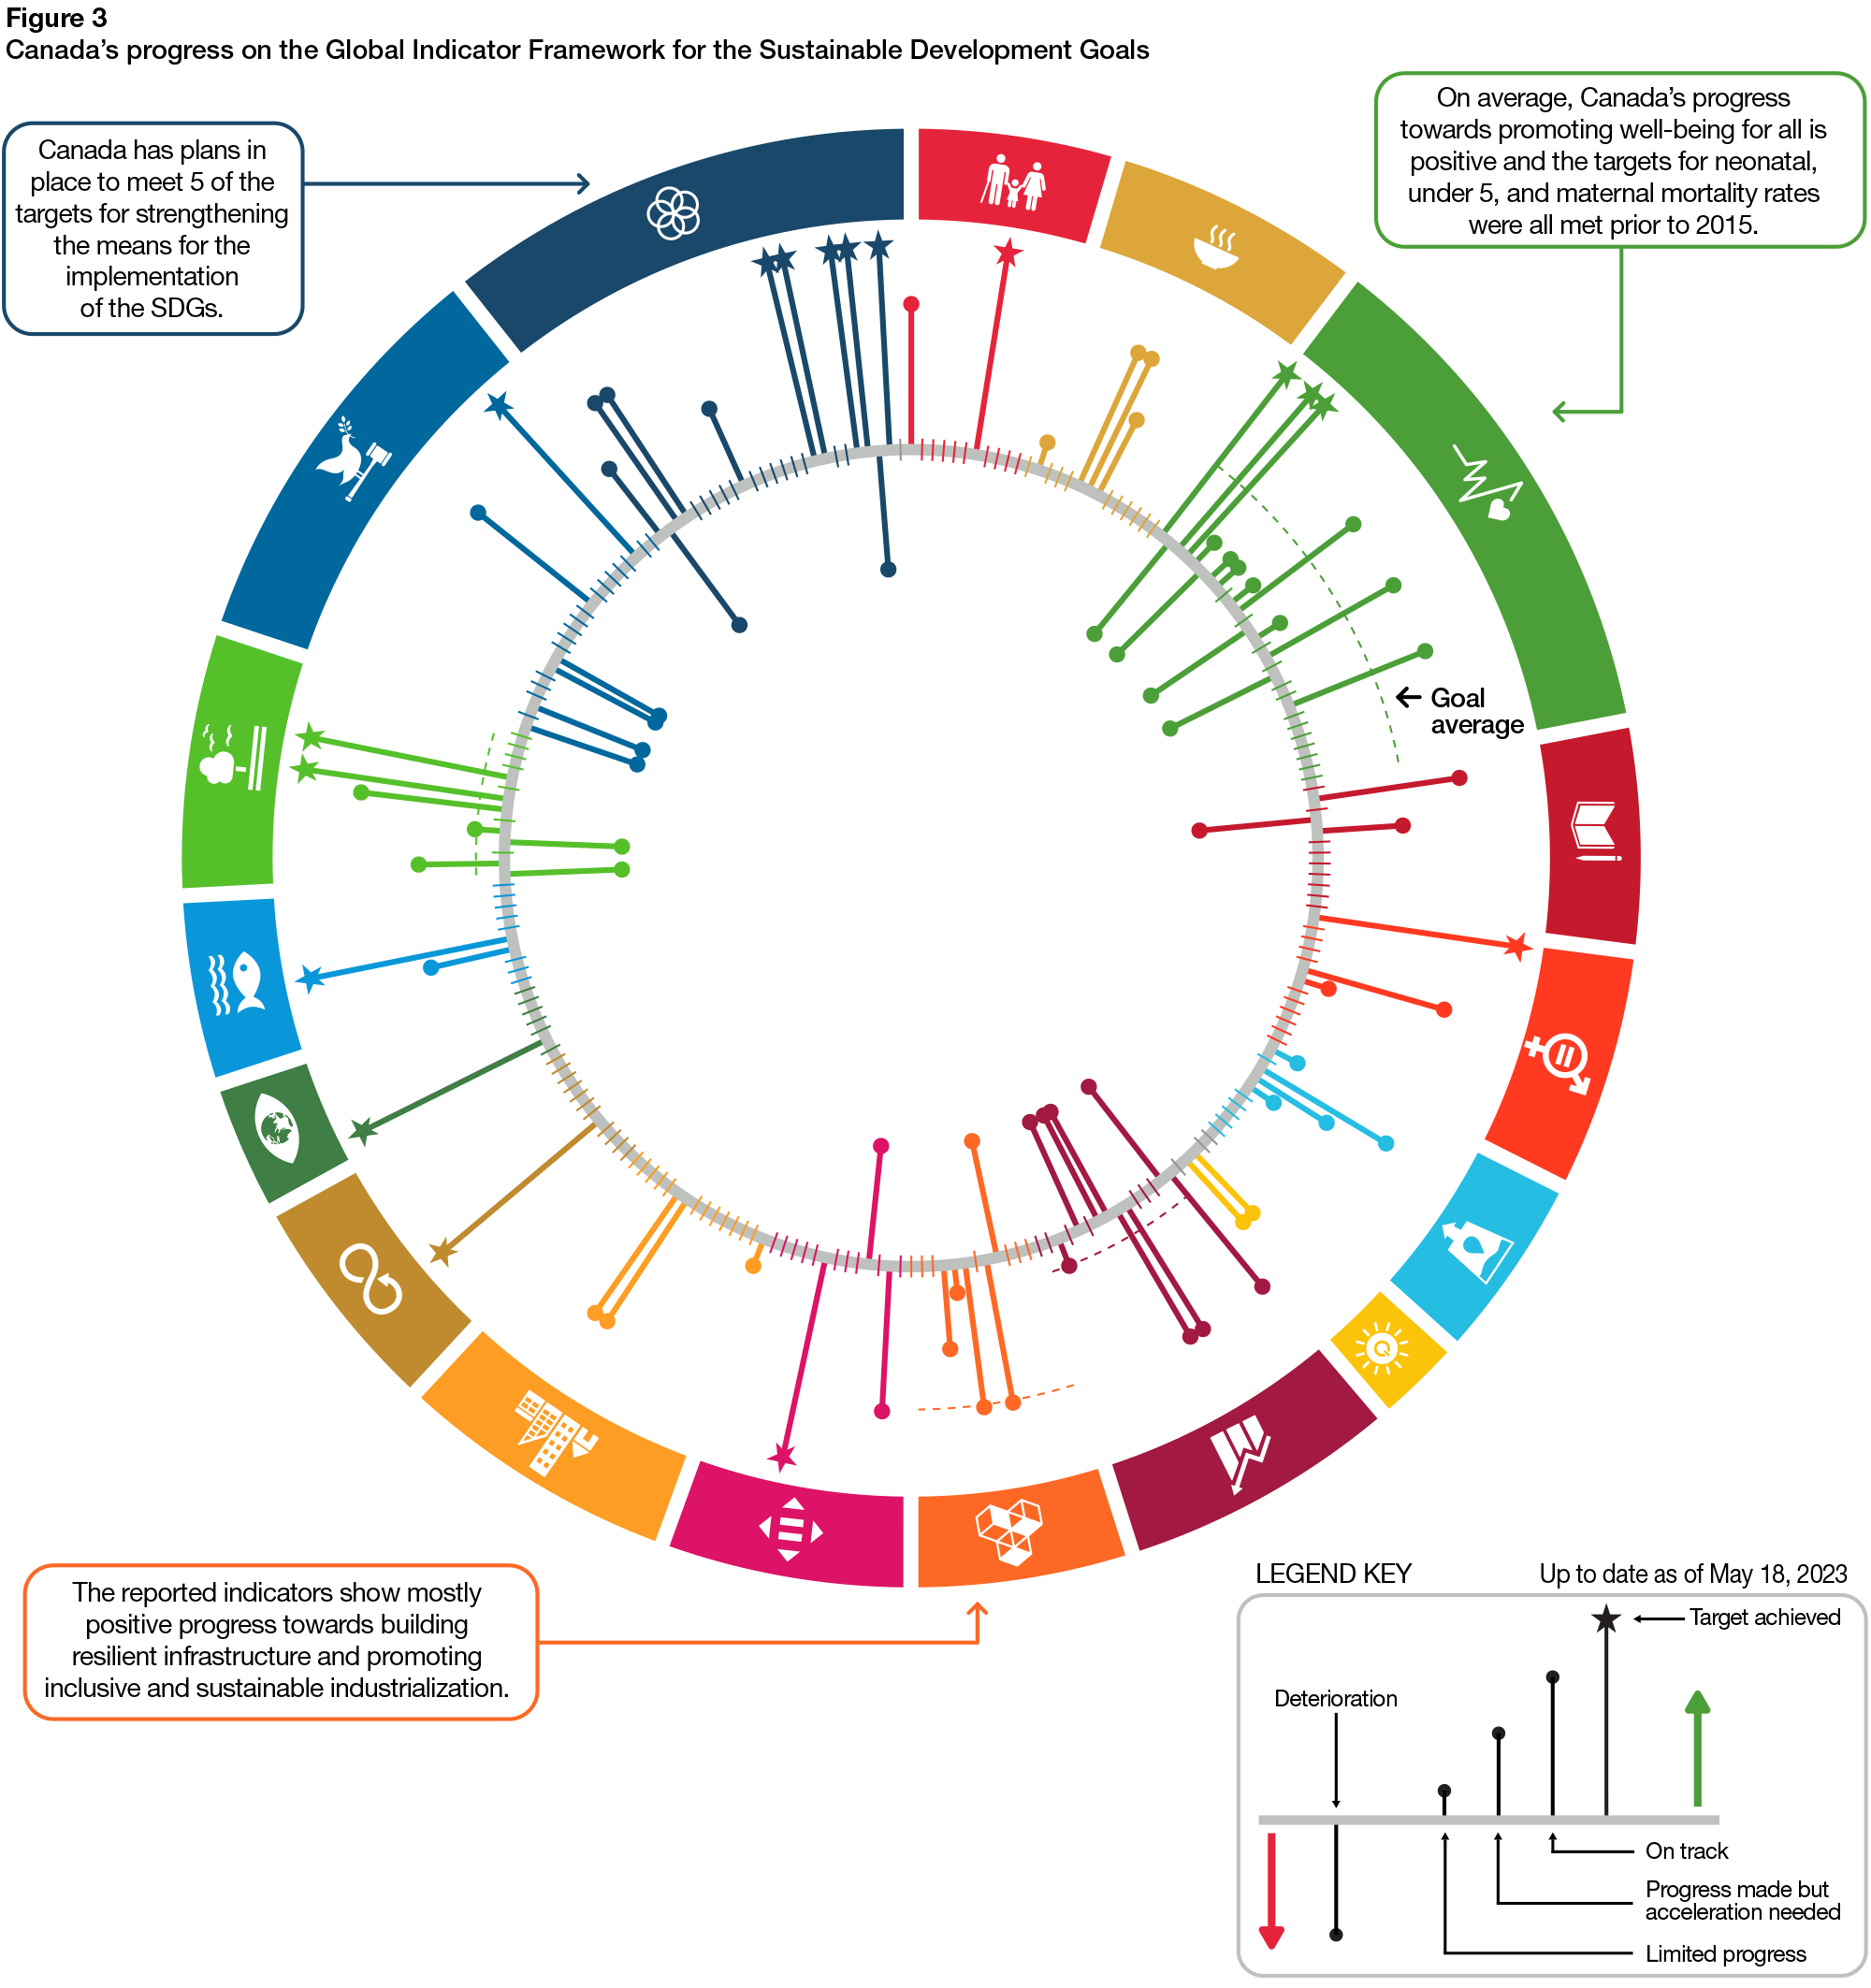
Text description - Figure 3
In 2023, of the indicators for which progress is measurable, 17 indicators have achieved their targets, 21 are on track, 10 have made progress but acceleration is needed, 13 have limited progress and 19 are deteriorating (up to date as of May 18, 2023).
| Goals | Number of indicators by progress measure status | |||||
|---|---|---|---|---|---|---|
| Target Achieved | On Track | Progress made but acceleration needed | Limited progress | Deterioration | Not Available | |
| 1 | 1 | 1 | 9 | |||
| 2 | 2 | 1 | 1 | 10 | ||
| 3 | 3 | 3 | 5 | 4 | 13 | |
| 4 | 1 | 1 | 1 | 9 | ||
| 5 | 1 | 1 | 1 | 10 | ||
| 6 | 1 | 1 | 2 | 6 | ||
| 7 | 2 | 3 | ||||
| 8 | 3 | 1 | 4 | 7 | ||
| 9 | 2 | 1 | 1 | 1 | 7 | |
| 10 | 1 | 1 | 1 | 10 | ||
| 11 | 2 | 1 | 11 | |||
| 12 | 1 | 11 | ||||
| 13 | 1 | 6 | ||||
| 14 | 1 | 1 | 8 | |||
| 15 | 2 | 1 | 1 | 1 | 2 | 7 |
| 16 | 1 | 1 | 4 | 16 | ||
| 17 | 5 | 2 | 2 | 2 | 13 | |
Figure 4 illustrates Canada's progress on the Canadian Indicator Framework which shows that the country has reached the targets for 2 indicators (9.6.1 and 9.7.1). Further, figure 4 shows that there are several indicators under many of the Goals where positive progress is being made (i.e., Goals 1, 8, 9, 14 and 15) as demonstrated by the lines pointing towards the outer edge of the circle. However, it also illustrates a lack of progress on several of the indicators under Goals 3, 6, 11 and 16 as is demonstrated by the lines pointing towards the centre of the circle.
Text description - Figure 4
In 2023, of the indicators for which progress is measurable, 2 indicators have achieved their targets, 25 are on track, 3 have made progress but acceleration is needed, 11 have limited progress and 20 are deteriorating (up to date as of May 18, 2023).
| Goals | Number of indicators by progress measure status | |||||
|---|---|---|---|---|---|---|
| Target Achieved | On Track | Progress made but acceleration needed | Limited progress | Deterioration | Not Available | |
| 1 | 1 | 1 | ||||
| 2 | 1 | 1 | ||||
| 3 | 3 | 7 | 3 | |||
| 4 | 1 | 1 | ||||
| 5 | 1 | 3 | ||||
| 6 | 1 | 1 | 2 | |||
| 7 | 1 | 1 | 1 | |||
| 8 | 5 | 1 | ||||
| 9 | 2 | 3 | 2 | |||
| 10 | 1 | 1 | 1 | 1 | ||
| 11 | 1 | 2 | 2 | 2 | ||
| 12 | 1 | 1 | 1 | |||
| 13 | 1 | 2 | ||||
| 14 | 2 | |||||
| 15 | 1 | 2 | 1 | 1 | ||
| 16 | 2 | 4 | 2 | |||
| 17 | 1 | 1 | ||||
SDG 1: No Poverty
Highlighted Indicators
- Global Indicator 1.2.1 - Proportion of population living below the national poverty line
- Domestic Indicator 1.2.1 - Prevalence of asset resilience
Global Indicator 1.2.1

Text description
Progress status for Global Indicator 1.2.1 - Proportion of the population living in poverty, as measured by Canada's official poverty line
Progress status: Ontrack
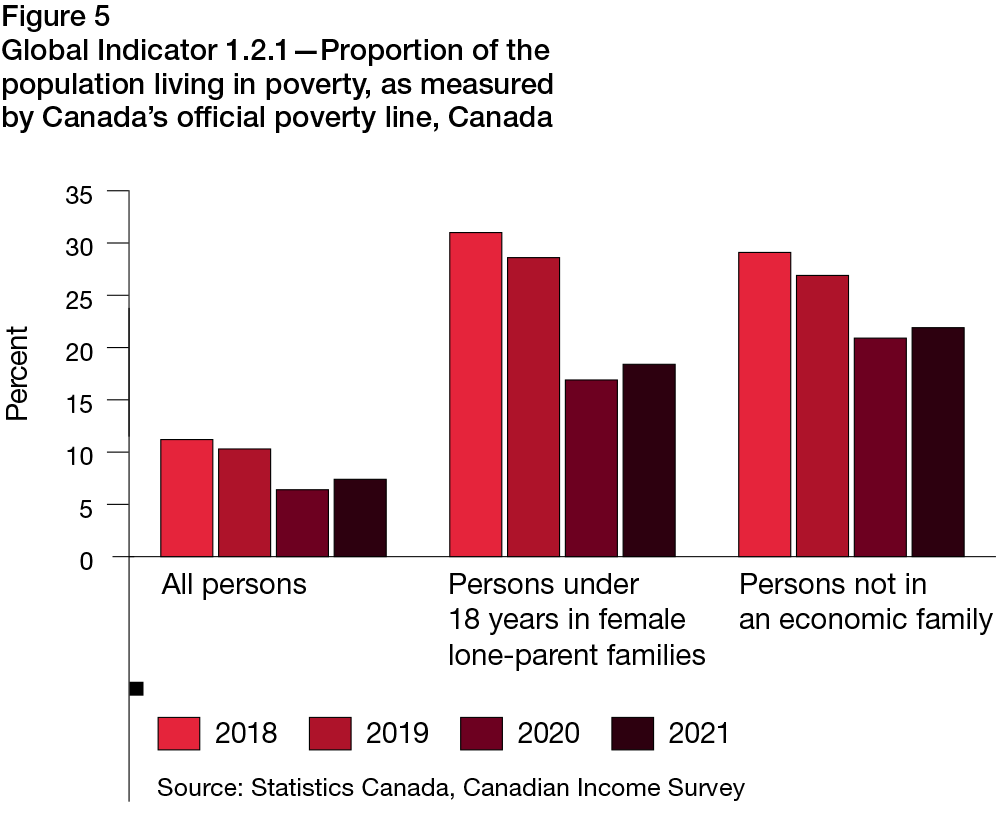
Goal 1 of the SDGs aims to end poverty in all its forms everywhere. In Canada, the proportion of the population living in poverty declined to 7.4% in 2021 from 11.2% in 2018 (Figure 5), largely a result of government transfers from COVID-19 relief programs. Consequently, these helped Canada temporally reached its target of reducing poverty by half from the 2015 level of 14.5% in 2020. Although the poverty rate increased slightly between 2020 and 2021, it remains substantially lower than in 2015 and with a progress score of 5, it indicates that Canada is on track to achieve the target.
Text description - Figure 5
| Year | All persons | Persons under 18 years in female lone-parent families | Persons not in an economic family |
|---|---|---|---|
| 2018 | 11.2 | 31 | 29.1 |
| 2019 | 10.3 | 28.6 | 26.9 |
| 2020 | 6.4 | 16.9 | 20.9 |
| 2021 | 7.4 | 18.4 | 21.9 |
- Source: Statistics Canada, Canadian Income Survey
- Unit of measure: percentage
While improvements have been observed throughout the population for some years now, many groups remain at a higher risk of living in poverty. For example, non-elderly persons living alone were the most vulnerable with more than 1 in 4 living in poverty in 2021. Additionally, Indigenous Peoples aged 16 and older were almost twice as likely to be living in poverty in 2021 (13.9%) than non-Indigenous (7.4%).
Among children and adolescents, the poverty rate for persons aged under 18 declined to 6.4% in 2021 from 10.6% in 2018. The largest decline in poverty occurred for youths living in female lone-parent families where the poverty rate fell to 18.4% in 2021 from 31.0% four years earlier. However, they remain more likely to live in poverty than children in male lone-parent families.
Domestic Indicator 1.2.1
Text description
Progress status for Domestic Indicator 1.2.1 - Percentage of persons who are asset resilient for at least 3 months
Progress status: Limited progress
Uncertainties in life, such as reduced income or unforeseen expenses, can be damaging to anybody's economic well-being but can be devastating for the most vulnerable in society. As such, the prevalence of Canadians with sufficient savings, liquid assets, and adequate retirement plans is a key measure of resiliency. In 2019, 67.1% of Canadians had sufficient savings to cover unexpected expenses or reduced income for a period of 3 months, up slightly from 66.6% in 2016 (Figure 6). While showing a slight increase in asset resiliency, limited progress has occurred towards ensuring that all Canadians have sufficient funds to cover unexpected expenses or reduced income for a period of three months. Indeed, only 41.3% of persons in lone-parent families were considered asset resilient in 2019, illustrating the different financial situations faced by many lone parent families.

Text description - Figure 6
| Year | All persons | Persons in a lone-parent family |
|---|---|---|
| 2016 | 66.6 | 38.7 |
| 2019 | 67.1 | 41.3 |
- Source: Statistics Canada, Survey of Financial Security
- Unit of measure: percentage
SDG 2: Zero Hunger
Highlighted Indicators
- Global Indicator 2.1.2 - Proportion of family living with food insecurity
- Global Indicator 2.4.1 - Proportion of agricultural area under productive and sustainable agriculture
Global Indicator 2.1.2
Text description
Progress status for Global Indicator 2.1.2 - Proportion of persons living in family living with food insecurity
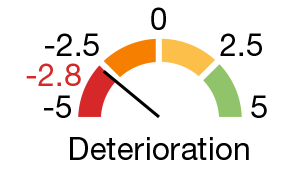
Progress status: Deterioration
Goal 2 of the SDGs aims to end hunger, achieve food security and improved nutrition, and promote sustainable agriculture. Food insecurity increased among Canadians from 11.6% in 2018 to reach 12.9% in 2021 (Figure 7). This increase in food insecurity led to a progress score of -2.8 which indicates that there has been a deterioration in progress and movement away from the goal of ending hunger and food insecurity in Canada.
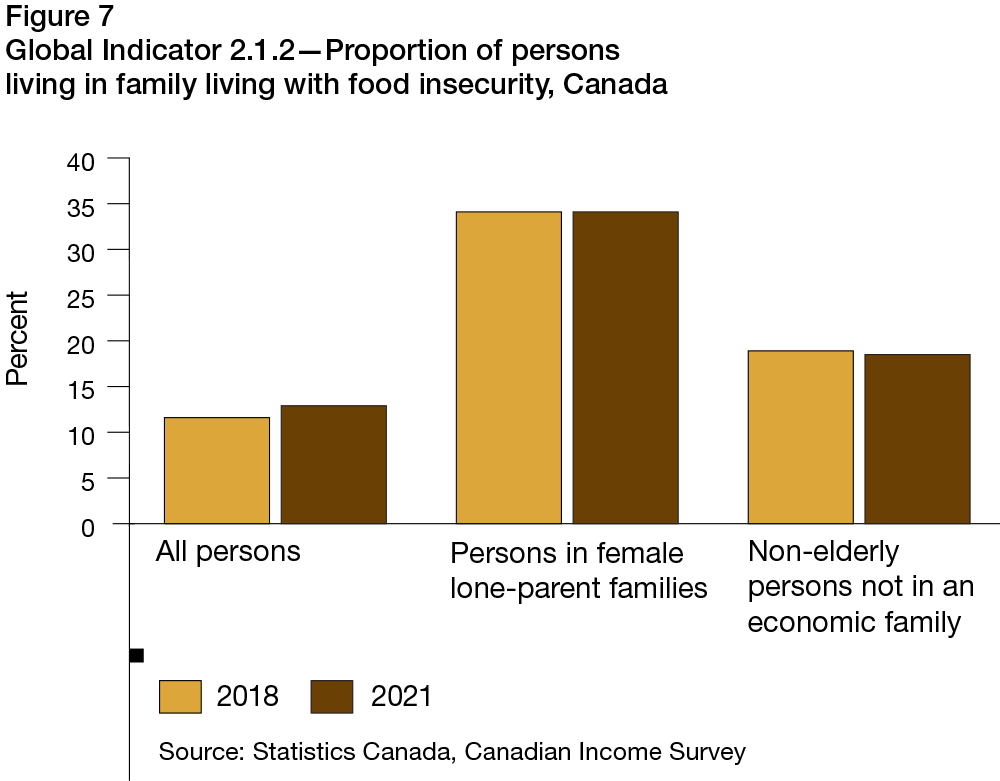
Text description - Figure 7
| Year | All persons | Persons in female lone-parent families | Non-elderly persons not in an economic family |
|---|---|---|---|
| 2018 | 11.6 | 34.1 | 18.9 |
| 2021 | 12.9 | 34.1 | 18.5 |
- Source: Statistics Canada, Canadian Income Survey
- Unit of measure: percentage
Food insecurity is present in Canada at varying levels across regions and socioeconomic profiles. Female lone-parent families are at a higher-risk of food insecurity, with 34.1% living in moderate or severe food insecurity, unchanged from 2018. Among persons younger than 65 (non-elderly) who did not live in an economic family, 18.5% lived in food insecurity in 2021, a rate substantially higher than the national average of 12.9%.
Global Indicator 2.4.1
Text description
Progress status for Global Indicator 2.4.1 - Proportion of agricultural area under productive and sustainable agriculture, Farm output value per hectare
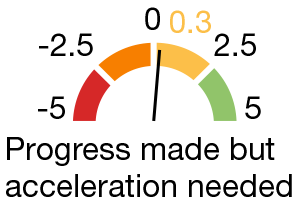
Progress status: Progress made but acceleration needed
Land productivity, as measured through farm output value per hectare, assesses the impact of improvements obtained through technological and production innovation. This indicator provides an overview of whether agricultural lands are used and worked in an economically sustainable manner.
Between 2016 and 2021, the proportion of total agricultural area under productive and sustainable agriculture, classified as desirable or acceptable, grew from 68.5% to 70.6% (Figure 8), while the area that was deemed under unsustainable production decreased to 29.3%. This increase in desirable or acceptable farm output per hectare illustrates moderate progress towards the goal of ensuring sustainable food production systems and implementing resilient agricultural practices that increase productivity and production.Footnote 11
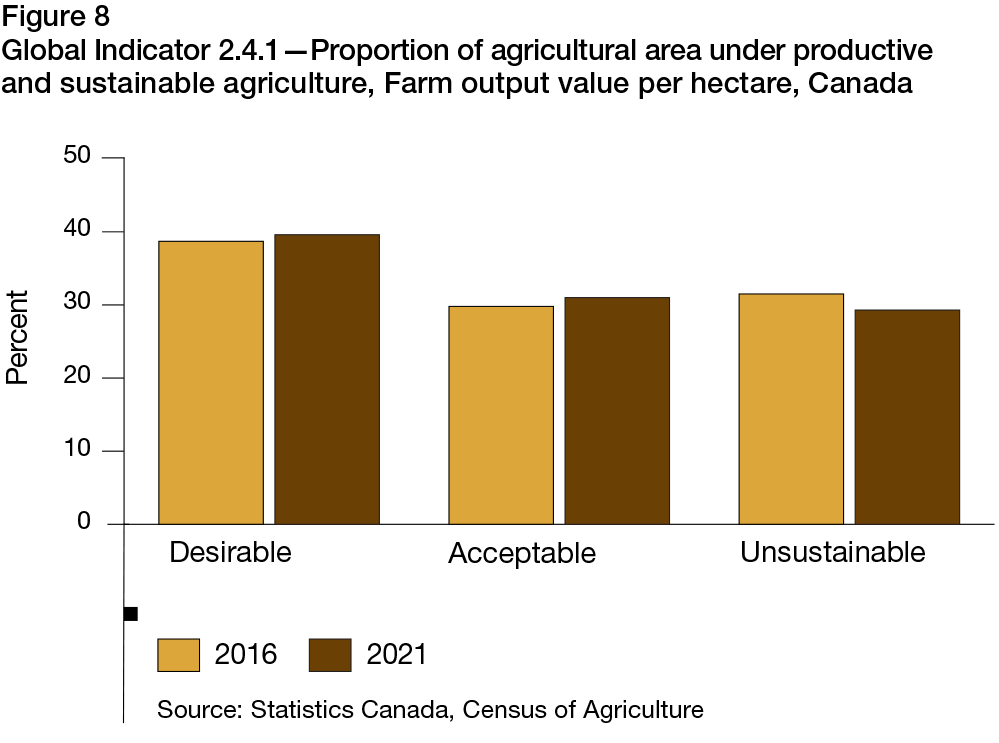
Text description - Figure 8
| Type | 2016 | 2021 |
|---|---|---|
| Desirable | 38.7% | 39.6% |
| Acceptable | 29.8% | 31.0% |
| Unsustainable | 31.5% | 29.3% |
- Source: Statistics Canada, Census of Agriculture
- Unit of measure: percentage
SDG 3: Good Health and Well-Being
Highlighted Indicators
- Domestic Indicator 3.12.1 - Incidence of opioid and stimulant overdose related harms
- Domestic Indicator 3.7.1 - Percentage of Canadians who perceived their mental health as very good to excellent
Domestic Indicator 3.12.1

Text description
Progress status for Domestic Indicator 3.12.1 - Incidence rate of opioid and stimulant related overdose harms, per 100,000 population
Progress status: Deterioration
Goal 3 of the SDGs aims to ensure healthy lives and promote well-being for all at all ages. It is comprised of a series of indicators measuring progress on major health priorities.
Rates of opioid-related deaths and other harms have been elevated since measurement began in Canada and have furthered worsened through the COVID-19 pandemic (Figure 9). This increasing trend shows a deterioration towards the target of reducing the incidence of opioid and stimulant overdose related harms. In 2021, males continued to account for the majority of total apparent opioid-related toxicity deaths (73%) and opioid-related hospitalizations (62%). Overall, opioid toxicity deaths mainly affected persons aged 20 to 59. These patterns remain similar based on available data from January to September 2022. In 2021, the total apparent opioid toxicity death rate was 20.9 per 100,000 population, representing a count of over 8,000 total deaths and an increase of 85% from the rate in 2018; put another way, this represents approximately 22 deaths per day in 2021 compared to 12 deaths per day in 2018. The opioid-related poisoning hospitalization rate in 2021 was 21.2 per 100,000 population, an increase of 20% since 2018.
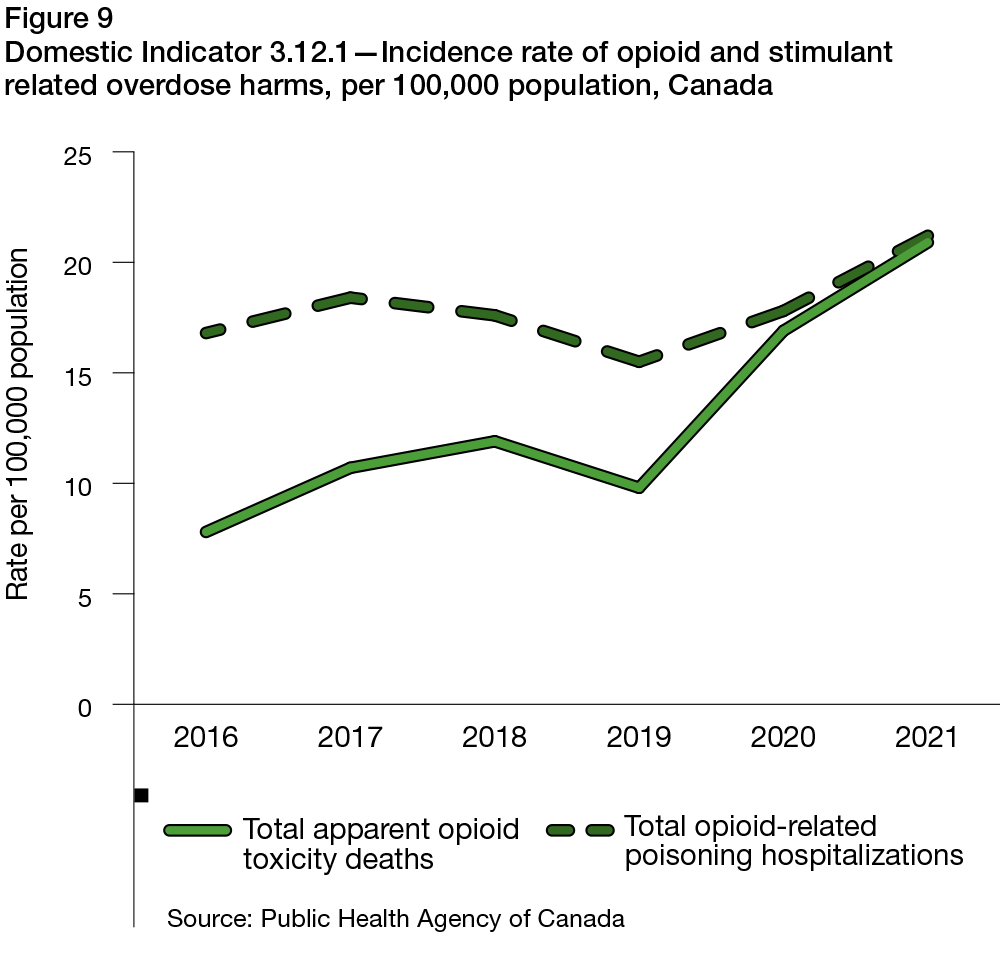
Text description - Figure 9
| Year | Total apparent opioid toxicity deaths | Total opioid-related poisoning hospitalizations |
|---|---|---|
| 2016 | 7.8 | 16.8 |
| 2017 | 10.7 | 18.4 |
| 2018 | 11.9 | 17.6 |
| 2019 | 9.8 | 15.5 |
| 2020 | 16.9 | 17.8 |
| 2021 | 20.9 | 21.2 |
- Source: Public Health Agency of Canada
- Unit of measure: rate per 100,000 population
Domestic Indicator 3.7.1

Text description
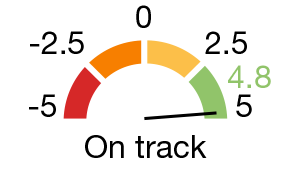
Progress status for Domestic Indicator 3.7.1 - Percentage of Canadians who perceived their mental health as very good to excellent
Progress status: Deterioration
More Canadians perceived their mental health as worsening in 2021 with the onset of the COVID-19 pandemic in 2020 and its continuing societal impacts (Figure 10). Among Canadians, 59.0% perceived their mental health as very good to excellent in 2021, representing a decline from 68.6% in 2018, and indicating a deterioration towards the ambition that Canadians have healthy and satisfying lives.
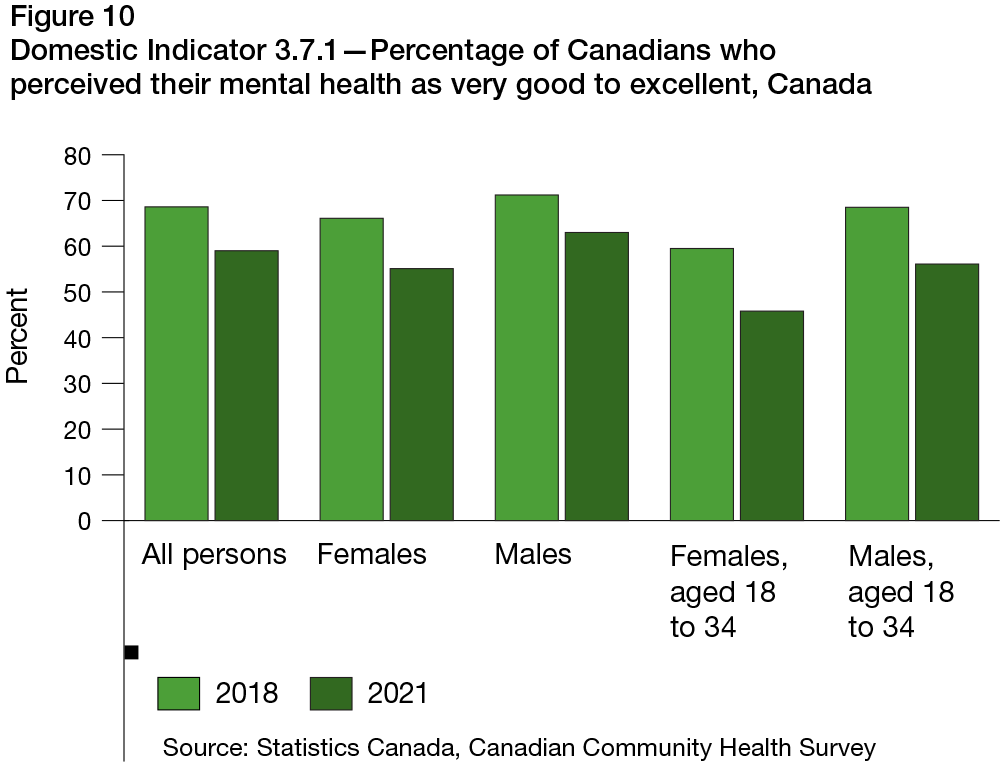
Text description - Figure 10
| Year | All persons | Females | Males | Females, aged 18 to 34 | Males, aged 18 to 34 |
|---|---|---|---|---|---|
| 2018 | 68.6 | 66.1 | 71.2 | 59.5 | 68.5 |
| 2021 | 59 | 55.1 | 63 | 45.8 | 56.1 |
- Source: Statistics Canada, Canadian Community Health Survey
- Unit of measure: percentage
Mental health among women was reported as particularly worse than their male counterparts in both 2018 and 2021. In 2021, 55.1% of women reported very good to excellent mental health compared to 63.0% among men. Among younger women aged 18-34, less than half (45.8%) reported very good to excellent mental health in 2021, substantially fewer than in 2018 and a much lower rate than their male counterparts. While younger men also reported an impact on their mental health between 2018 and 2021, the proportion reporting very good to excellent mental health remained higher than among women.
SDG 4: Quality Education
Highlighted Indicators
- Domestic Indicator 4.2.1 - Post-secondary education attainment rate
- Global Indicator 4.1.2 - Completion rate (primary education, lower secondary education, upper secondary education)
Domestic Indicator 4.2.1
Text description
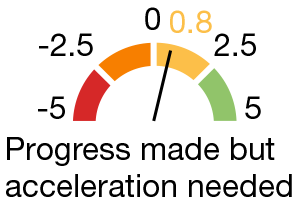
Progress status for Domestic Indicator 4.2.1 - Post-secondary education attainment rate, persons aged 25 to 64
Progress status: On track
Goal 4 of the SDGs aims to ensure inclusive and equitable education and promote lifelong learning opportunities for all. The rate of attainment of certificates or diplomas and degrees from universities, colleges, cégeps and comparable institutions in Canada has been increasing for years and is on track to achieve the Canadian SDG ambition of ensuring that Canadians have access to inclusive and quality education throughout their lives.
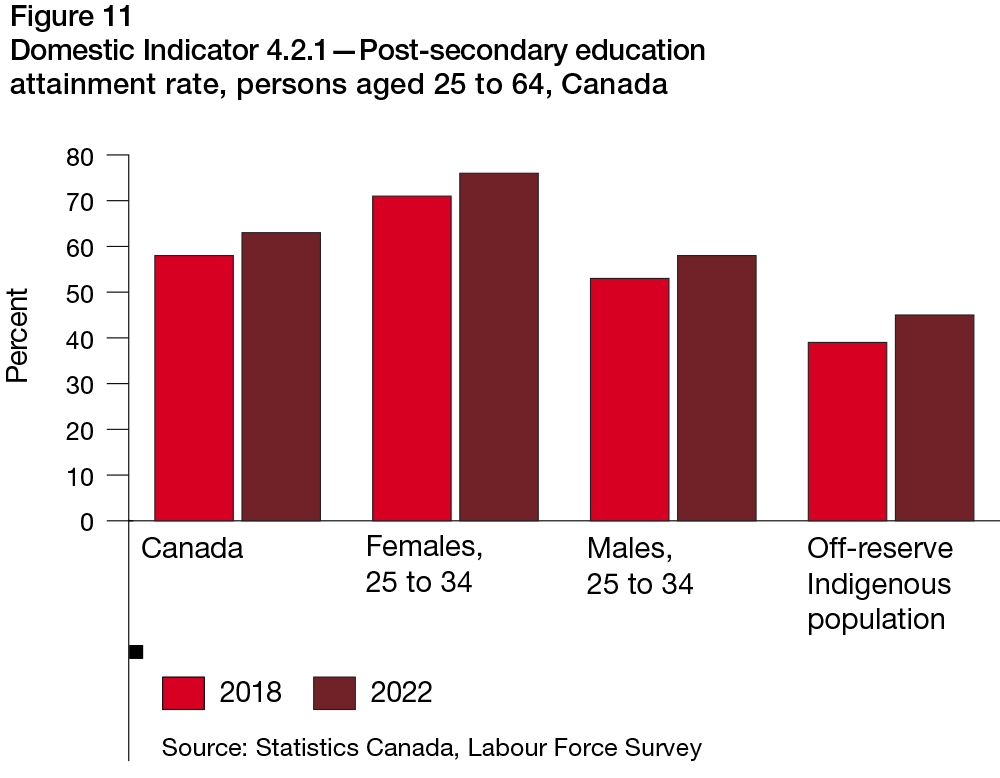
Text description - Figure 11
| Year | Canada | Female, aged 25 to 34 | Male, aged 25 to 34 | Off-reserve Indigenous population |
|---|---|---|---|---|
| 2018 | 58 | 71 | 53 | 39 |
| 2022 | 63 | 76 | 58 | 45 |
- Source: Statistics Canada, Labour Force Survey
- Unit of measure: percentage
Overall, in Canada 63% of persons between the ages of 25 and 64 had attained post-secondary education in 2022, an increase from 58% in 2018 (Figure 11). Among younger women aged 25 to 34, 76% had attained post-secondary education in 2022, the highest rate of attainment in Canada. On the other hand, 58% of younger men had achieved comparable levels of education. Post-secondary attainment rates among Indigenous Peoples living off-reserve substantially increased between 2018 and 2022 (39% to 45%).
Global Indicator 4.1.2
Text description
Progress status for High school completion rate, persons aged 25 to 64, Canada (complement to Global Indicator 4.1.2)
Progress status: Progress made but acceleration needed
The high school completion rate in Canada is relatively high and has continued to strengthen. At the national level, the high school graduation rate was 89% in 2019-2020, up from 87% in 2016-2017, giving it a progress measure of 0.76 which shows that while progress has been made, acceleration is needed to achieve the target of ensuring free, equitable and quality education. Footnote 12
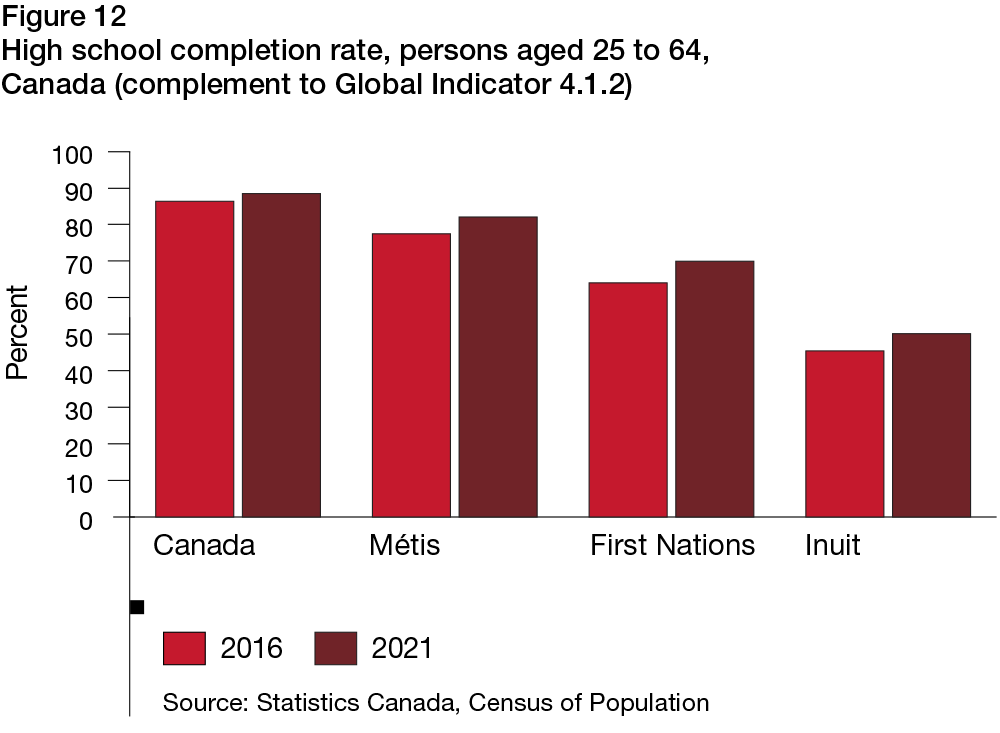
Text description - Figure 12
| Category | 2016 | 2021 |
|---|---|---|
| Canada | 86.3 | 88.4 |
| Métis | 77.4 | 82.0 |
| First Nations | 64.0 | 69.9 |
| Inuit | 45.4 | 50.1 |
- Source: Statistics Canada, Census of Population
- Unit of measure: percentage
The existing completion rate gap between the Indigenous population and the overall population has narrowed substantially (Figure 12). Among Métis, the completion rate has increased to 82.0%, an increase from 77.4% in 2016. The completion rate among First Nations grew from 64.0% in 2016 to 69.9.% in 2021. The Inuit population had the lowest completion rate; however, it has also improved to now reach more than half (50.1%) in 2021 from 45.4% in 2016.
SDG 5: Gender Equality
Highlighted Indicators
- Domestic Indicator 5.2.1 - Proportion of leadership roles held by women
- Global Indicator 5.2.1 - Proportion of ever-partnered women and girls aged 15 years and older subjected to physical, sexual or psychological violence by a current or former intimate partner in the previous 12 months
Goal 5 of the SDGs aims to achieve gender equality and empower all women and girls. To achieve gender equality, it is essential to measure how women and girls are doing in areas where they have traditionally been underrepresented and where women traditionally face challenges.
Domestic Indicator 5.2.1
The representation of women among some leadership positions has been increasing in recent years whereas for others it has remained virtually unchanged. Among members of federal parliament, 30.6% were women in 2022, up from 27.0% in 2018 (Figure 13). Meanwhile, women accounted for nearly half (48.7%) of the members of the federal cabinet in 2022, little change from 2018.
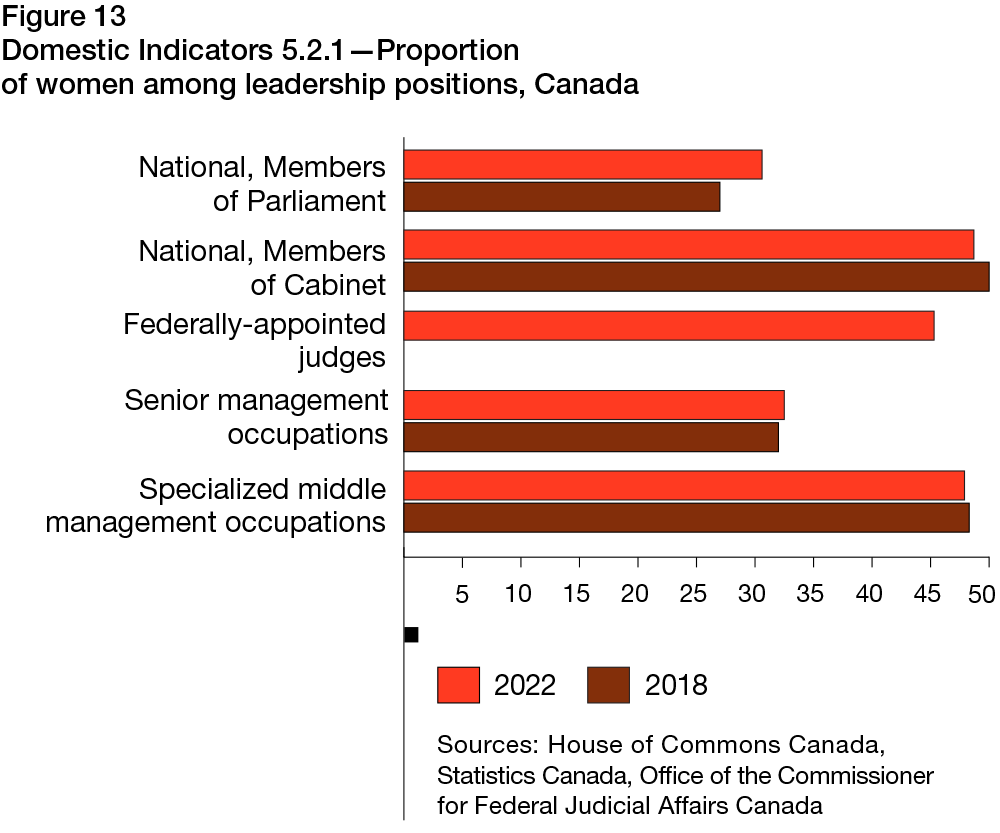
Text description - Figure 13
| Category | 2018 | 2022 |
|---|---|---|
| Specialized middle management occupations | 48.3 | 47.9 |
| Senior management occupations | 32 | 32.5 |
| Federally-appointed judges | n/a | 45.3 |
| National, Members of Cabinet | 50 | 48.7 |
| National, Members of Parliament | 27 | 30.6 |
- Note: n/a = not applicable.
- Sources: House of Commons Canada, Statistics Canada, Office of the Commissioner for Federal Judicial Affairs Canada
- Unit of measure: percentage
Women remain underrepresented in senior management roles in Canada, accounting for just under a third of all senior managers in 2022, essentially unchanged from 2018. However, among specialized middle management occupationsFootnote 13, women accounted for nearly half of all managers in both 2018 and 2022.
Global Indicator 5.2.1
In 2018, more than 1 in 10 women (12%) reported experiencing intimate partner violence in the 12 months preceding the survey (Figure 14). Among younger women, the proportion was even higher as 29% reported experiencing intimate partner violence, the highest rate among women and 142% above the national average. Around 1 in 5 separated or divorced women, LGBTQ2+ women and single women also reported being subjected to intimate partner violence.
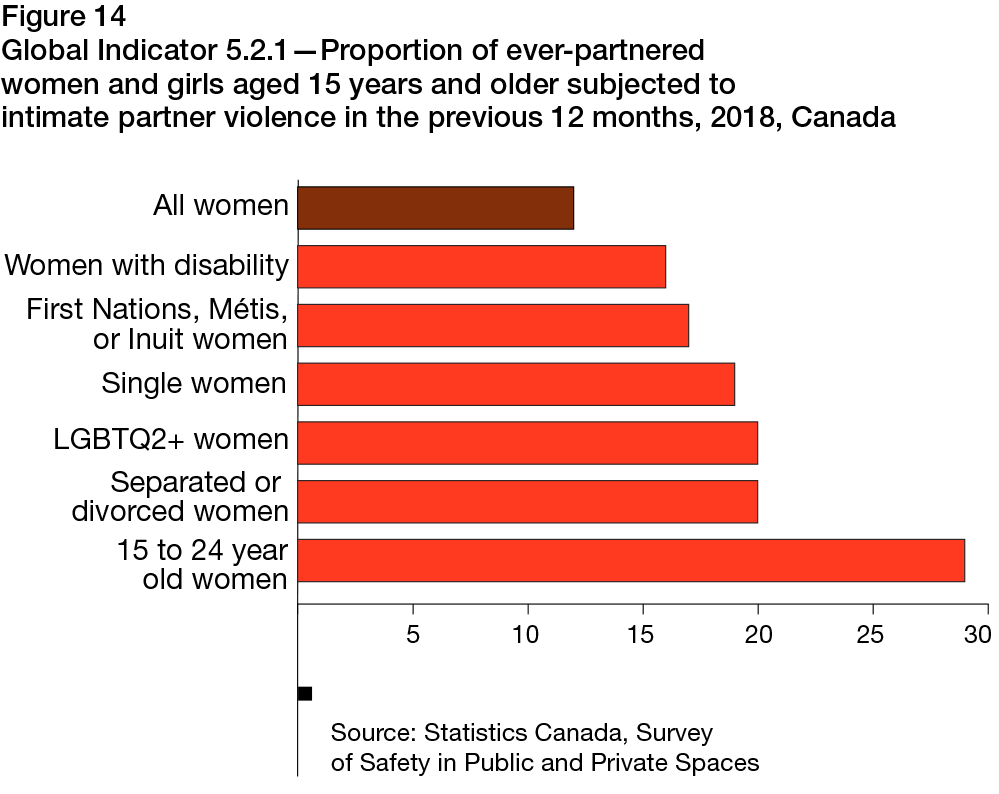
Text description - Figure 14
| 15 to 24 year old women | Separated or divorced women | LGBTQ2+ women | Single women | First Nations, Métis, or Inuit women | Women with disability | All women |
|---|---|---|---|---|---|---|
| 29 | 20 | 20 | 19 | 17 | 16 | 12 |
- Source: Statistics Canada, Survey of Safety in Public and Private Spaces
- Unit of measure: percentage
- Year: 2018
SDG 6: Clean Water and Sanitation
Highlighted Indicators
- Domestic Indicator 6.1.1 - Number of long-term drinking water advisories on public systems on reserves
- Domestic Indicator 6.4.1 - Water quality in Canadian rivers
Goal 6 of the SDGs aims to ensure availability and sustainable management of water and sanitation for all. In Canada, more than 99% of the population were using safely managed drinking water services in 2020.Footnote 14 Overall, water usage has been trending downwards in recent years decreasing 3% between 2015 and 2019.Footnote 15 The residential sector in Canada accounted for half of all water usage and overall, on a per capita basis, Canadians were using 215 litres of water daily in 2019.Footnote 16 In 2019, over half of Canadians reported the use of water conservation practises in their bathrooms, such as low-volume toilets and low-flow shower heads.Footnote 17
Domestic Indicator 6.1.1

Text description
Progress status for Domestic Indicator 6.1.1 - Number of long-term drinking water advisories on public systems on reserves south of the 60th parallel
Progress status: On track
Water quality differs depending on where you live in Canada. In communities on reserves south of the 60th parallel, there were 32 long-term drinking water advisories on public water systems still in effect at the end of 2022 (Figure 15). However, the number of water advisories has been decreasing and is almost half the number of advisories that were in place in 2018, showing that Canada is on track towards the target of eliminating all long-term advisories by 2030.
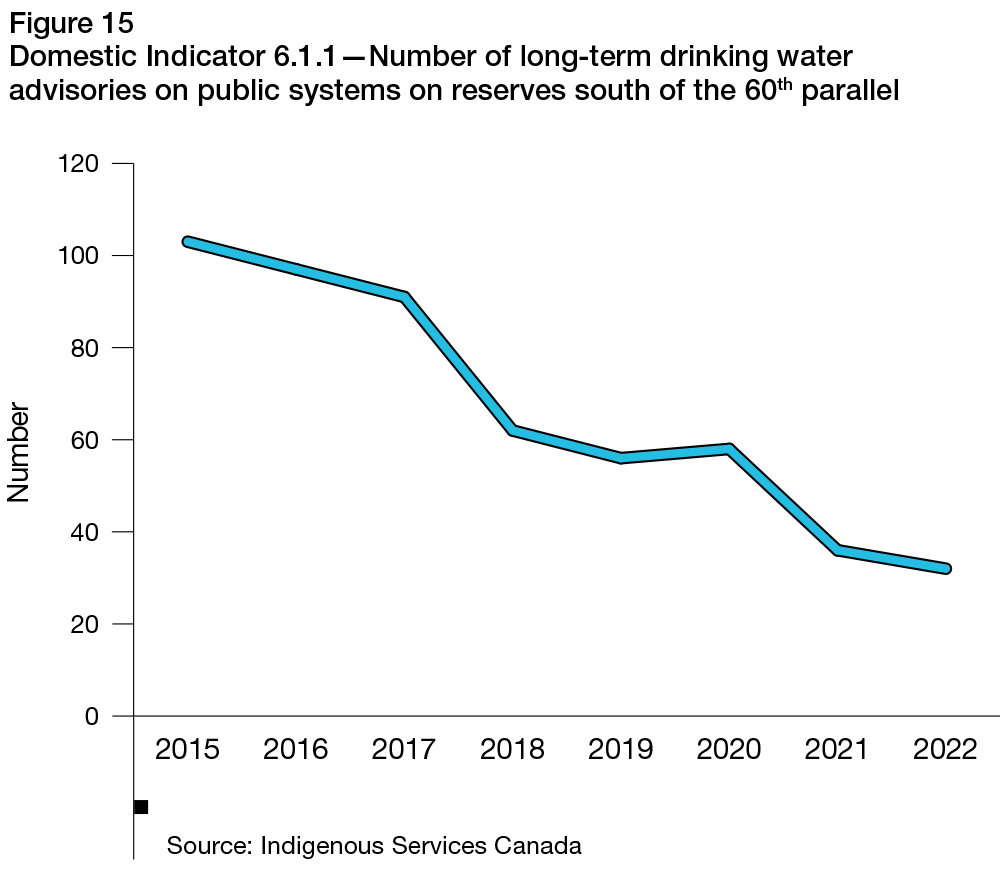
Text description - Figure 15
| Year | Number of long-term drinking water advisories |
|---|---|
| 2015 | 103 |
| 2016 | 97 |
| 2017 | 91 |
| 2018 | 62 |
| 2019 | 56 |
| 2020 | 58 |
| 2021 | 36 |
| 2022 | 32 |
- Source: Indigenous Services Canada
- Unit of measure: number
Domestic Indicator 6.4.1

Text description
Progress status for Domestic Indicator 6.4.1 - Water quality in rivers
Progress status: On track
Water quality in Canadian rivers is an indicator of the overall water quality in Canada. For the period 2018-20, slightly less than half (45%) of rivers were rated as having good to excellent quality water – an increase from 40% in 2016-18 (Figure 16). An increase in the proportion of rivers rated as having good to excellent water quality demonstrates a trend that is on track towards the ambition that Canadians have access to drinking water and use it in a sustainable manner. On the other hand, 16% of rivers were rated as having water of marginal to poor quality, an improvement from 19% in 2016-18. Looking at the longer-term trends, water quality has not changed between 2002 and 2020 at over half of the sites (60%) across southern Canada. Where it has changed, it has deteriorated (30%) more often than it has improved (10%).Footnote 18
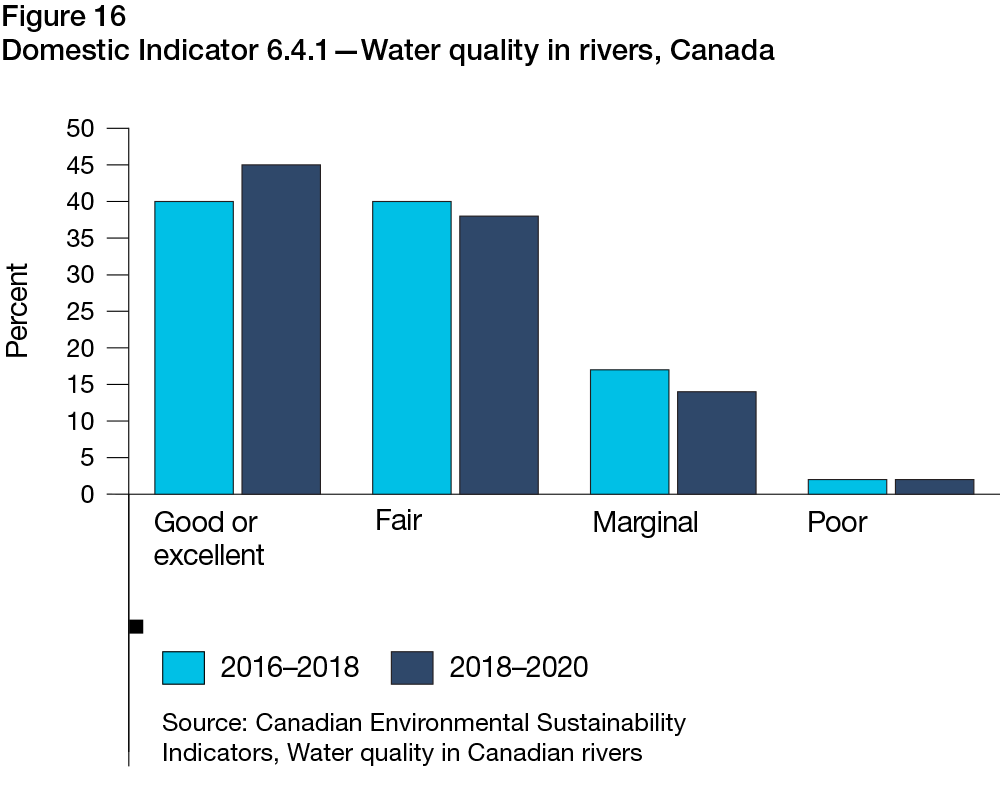
Text description - Figure 16
| Year | Good or excellent | Fair | Marginal | Poor |
|---|---|---|---|---|
| 2016 to 2018 | 40 | 40 | 17 | 2 |
| 2018 to 2020 | 45 | 38 | 14 | 2 |
- Source: Canadian Environmental Sustainability Indicators, Water quality in Canadian rivers
- Unit of measure: percentage of sites
SDG 7: Affordable and Clean Energy
Highlighted Indicators
- Domestic Indicator 7.2.1 - Total energy consumption per capita
- Global Indicator 7.a.1 - International financial flows to developing countries in support of clean energy research and development and renewable energy production, including in hybrid systems
Domestic Indicator 7.2.1

Text description
Progress status for Domestic Indicator 7.2.1 - Total energy consumption per capita, terajoules
Progress status: Progress made but acceleration needed
Goal 7 of the SDGs aims to ensure access to affordable, reliable, sustainable and modern energy for all. As a result of the large variations in temperature experienced throughout the year and the geographical vastness of the country, Canadians are considered one of the largest consumers of energy in the world on a per capita basis. In 2021, the average Canadian consumed 0.21 terajoules, down from 0.24 in 2018 (Figure 17), which shows progress has been made but acceleration is needed to achieve the Canadian SDG ambition of reducing energy consumption.
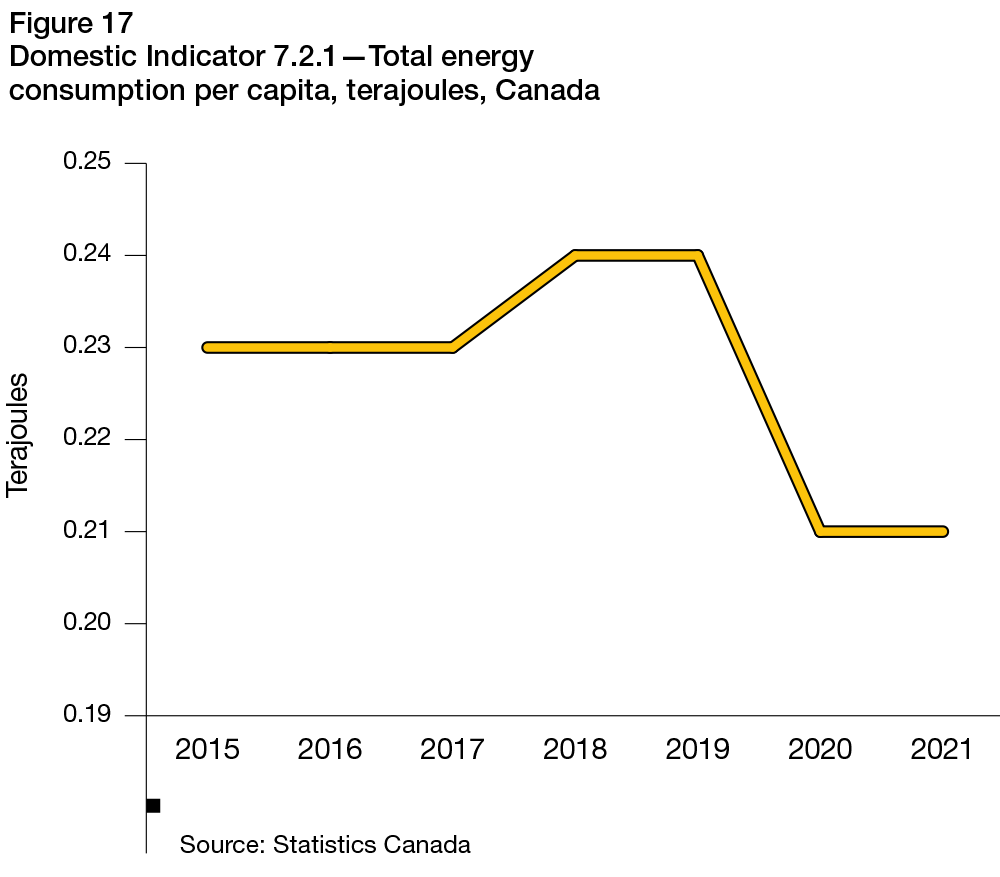
Text description - Figure 17
| Year | Energy consumption per capita |
|---|---|
| 2015 | 0.23 |
| 2016 | 0.23 |
| 2017 | 0.23 |
| 2018 | 0.24 |
| 2019 | 0.24 |
| 2020 | 0.21 |
| 2021 | 0.21 |
- Source: Statistics Canada
- Unit of measure: terajoules
Between 2018 and 2021, total energy consumption decreased by 7.3%, largely precipitated by the reduced economic activity observed at the onset of the COVID-19 pandemic in 2020. While total energy consumption started to increase in 2021, it remained below pre-pandemic levels.
Global Indicator 7.a.1
Canada has substantially increased its international assistance to developing countries in support of clean energy research and development and renewable energy production since the implementation of the 2030 Agenda in 2015.
International financial flows to developing countries in support of clean energy research and development and renewable energy production reached $282.5 million (US dollars) in 2021, a sharp increase from $0.57 million in 2015 (Figure 18).
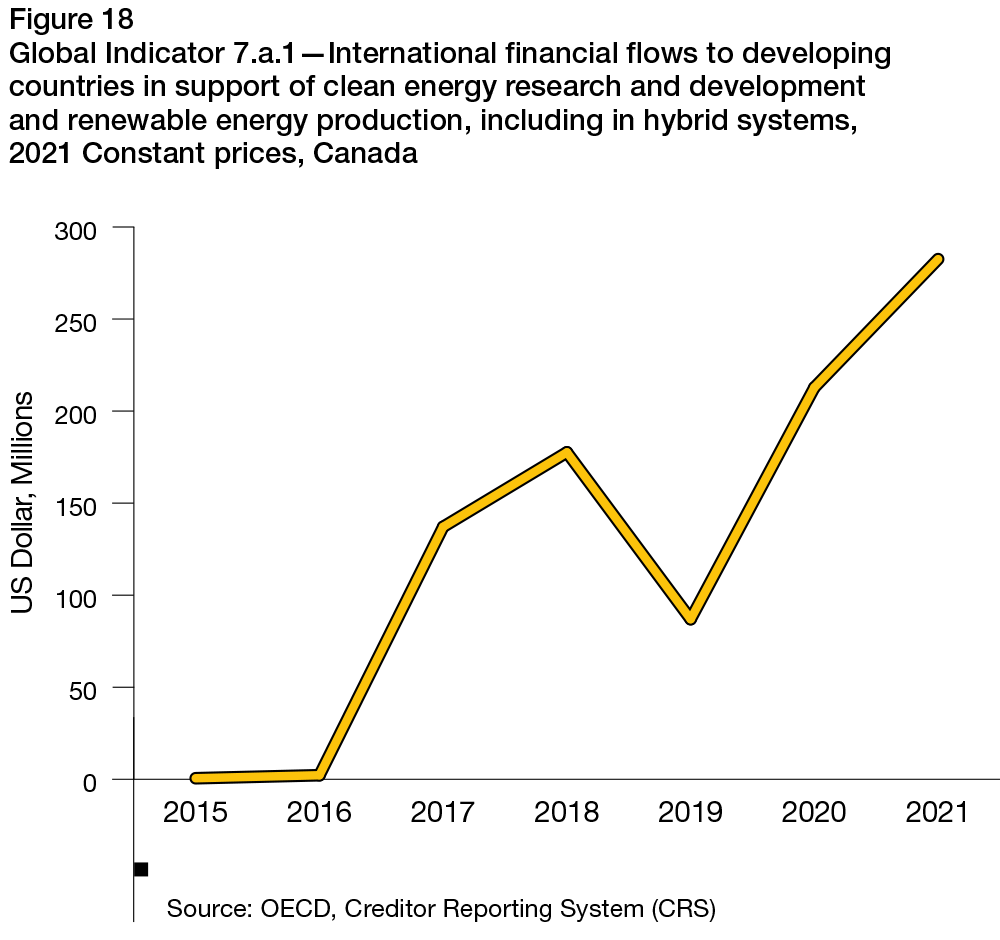
Text description - Figure 18
| Year | Amount |
|---|---|
| 2015 | 0.57 |
| 2016 | 2.20 |
| 2017 | 137.12 |
| 2018 | 177.58 |
| 2019 | 86.97 |
| 2020 | 212.80 |
| 2021 | 282.53 |
- Source: OECD, Creditor Reporting System (CRS)
- Unit of measure: US Dollar, Millions
Financial flows to Africa accounted for nearly half of all gross disbursements with $137.9 million provided in 2021, down slightly from $145.1 million in 2018, which represented more than 80% of total gross disbursements in 2018. As the second-largest recipient in 2021, the Americas received almost 30% of all financial flows in 2021, more than 6 times higher than the amount received in 2018. International assistance to Asia accounted for just over 20% of the total in 2021.
SDG 8: Decent Work and Economic Growth
Highlighted Indicators
- Global Indicator 8.5.1 - Average hourly earnings of employees
- Domestic Indicator 8.4.1 - Rate of involuntary part-time work
Global Indicator 8.5.1

Text description
Progress status for Global Indicator 8.5.1 - Average hourly earnings of full-time and part-time employees aged 15 and over, current dollars
Progress status: On track
Goal 8 of the SDGs aims to promote sustained, inclusive and sustainable growth, full and productive employment and decent work for all. Wages are an important component of equitable and decent work and in recent years their movements reflected the impact of ongoing economic events resulting from the COVID-19 pandemic.
In Canada, average hourly wages of employees increased 15.9% since 2018 to reach $32.00 per hour in 2022 (Figure 19). This increase indicates that this indicator is on track towards the target of achieving full and productive employment and decent work for all. However, the average hourly gender wage gap has remained largely unchanged since 2018 as women were still earning on average around $4.50 less per hour than men in 2022.
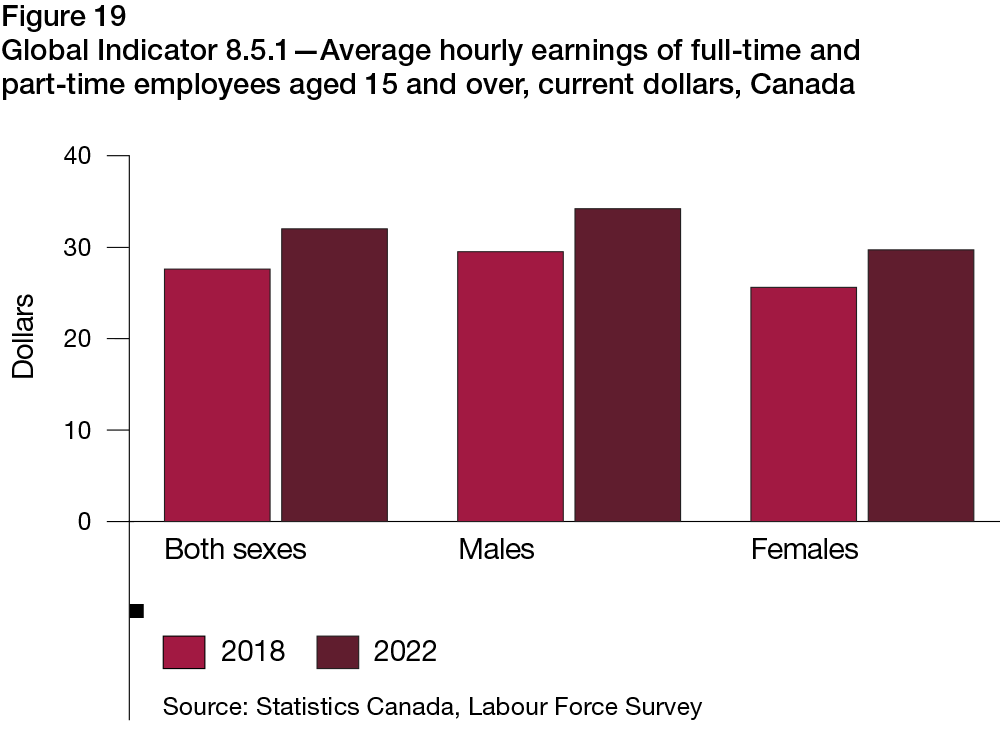
Text description - Figure 19
| Gender | 2018 | 2022 |
|---|---|---|
| Both sexes | 27.6 | 32.0 |
| Males | 29.5 | 34.2 |
| Females | 25.6 | 29.7 |
- Source: Statistics Canada, Labour Force Survey
- Unit of measure: dollars
Among various age groups, employees aged between 25 and 54 had the highest average hourly earnings at $34.55 per hour in 2022. At the other end of the spectrum, younger employees aged between 15 and 24 earned the least with an average of $19.17 per hour in 2022.
Domestic Indicator 8.4.1

Text description
Progress status for Domestic Indicator 8.4.1 - Rate of involuntary part-time work, persons aged 15 and over
Progress status: On track
For some Canadians, working part-time is not optimal and they would prefer full-time employment. As such, the rate of involuntary part-time work is a good indicator of the capacity of the labour market to absorb this additional workforce. Overall, the rate of involuntary part-time work has been on a declining trend in Canada (Figure 20). However, this positive trend was interrupted in 2020 with the beginning of the COVID-19 pandemic and its subsequent economic impacts. While the involuntary part-time rate rose sharply in 2020 and stayed elevated in 2021, it dropped to 15.5% in 2022, which was below its pre-pandemic level (19.5%) and substantially lower than in 2018 (21.8%). Despite the temporary higher rates in 2020 and 2021, the progress measure for this indicator is 5.0 which indicates that this indicator is on track to achieve the target of Canadians having access to quality jobs.
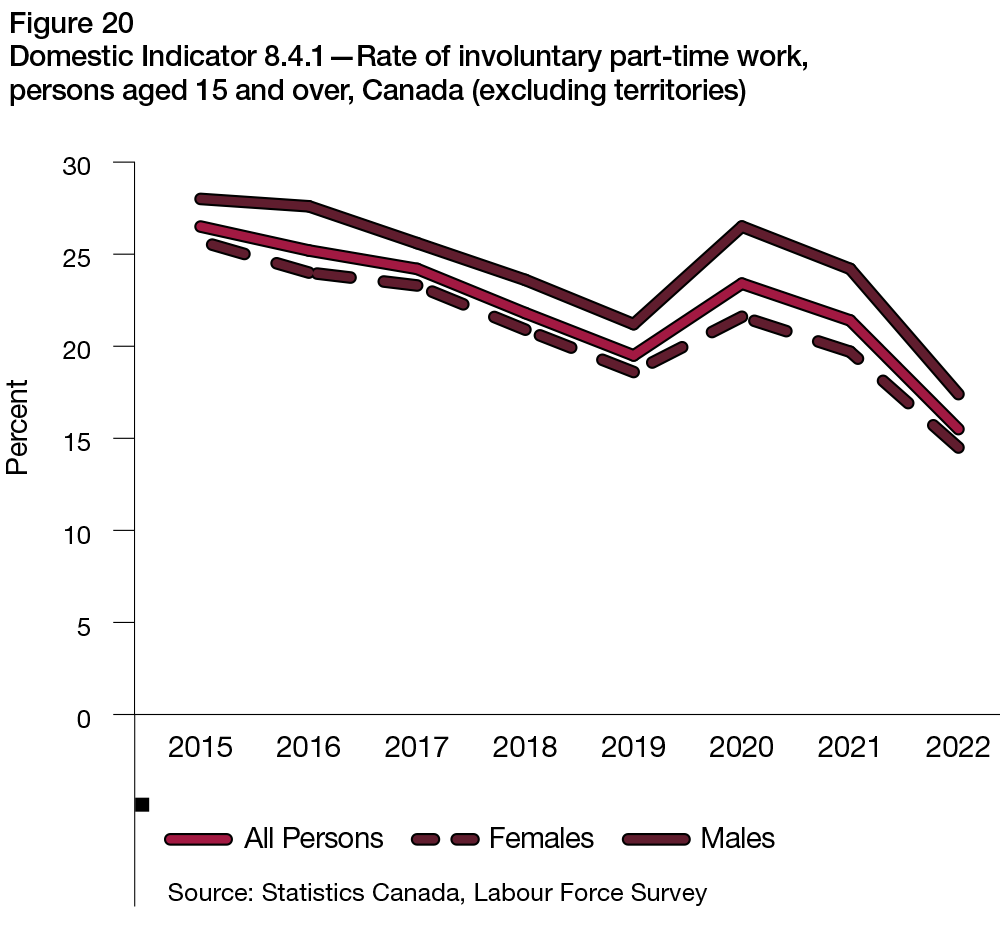
Text description - Figure 20
| Year | All persons | Females | Males |
|---|---|---|---|
| 2015 | 26.5 | 25.7 | 28.0 |
| 2016 | 25.2 | 24.0 | 27.6 |
| 2017 | 24.2 | 23.3 | 25.6 |
| 2018 | 21.8 | 20.9 | 23.6 |
| 2019 | 19.5 | 18.6 | 21.2 |
| 2020 | 23.4 | 21.6 | 26.5 |
| 2021 | 21.4 | 19.7 | 24.2 |
| 2022 | 15.5 | 14.5 | 17.4 |
- Source: Statistics Canada, Labour Force Survey
- Unit of measure: percentage
The increase of the involuntary part-time rate during the COVID-19 pandemic was steeper for men, reaching a high of 26.5% in 2020. However, the rate has since fallen to 17.4% in 2022 as the impacts of the pandemic largely ended. Meanwhile, the involuntary part-time rate among women rose similarly during the pandemic but peaked at a level lower than men and has now fallen to a lower rate than the pre-pandemic low of 18.6%.
SDG 9: Industry, Innovation and Infrastructure
Highlighted Indicators
- Global Indicator 9.5.1 - Research and development expenditures as a proportion of GDP
- Domestic Indicator 9.5.1 - Greenhouse gas emissions per dollar of value-added from the production of infrastructure assets
Global Indicator 9.5.1
Text description
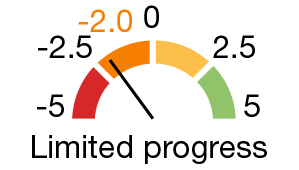
Progress status for Global Indicator 9.5.1 - Research and development expenditures as a proportion of GDP
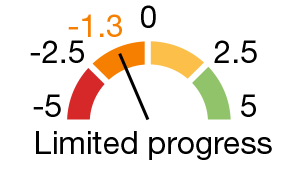
Progress status: Limited progress
Goal 9 of the SDGs aims to build resilient infrastructure, promote inclusive and sustainable industrialization and foster innovation. In Canada, research and development (R&D) expenditures accounted for 1.70% of the Gross Domestic Product (GDP) in 2021, lower than in the 3 previous years and substantially less than the OECD average of 2.5% (Figure 21).
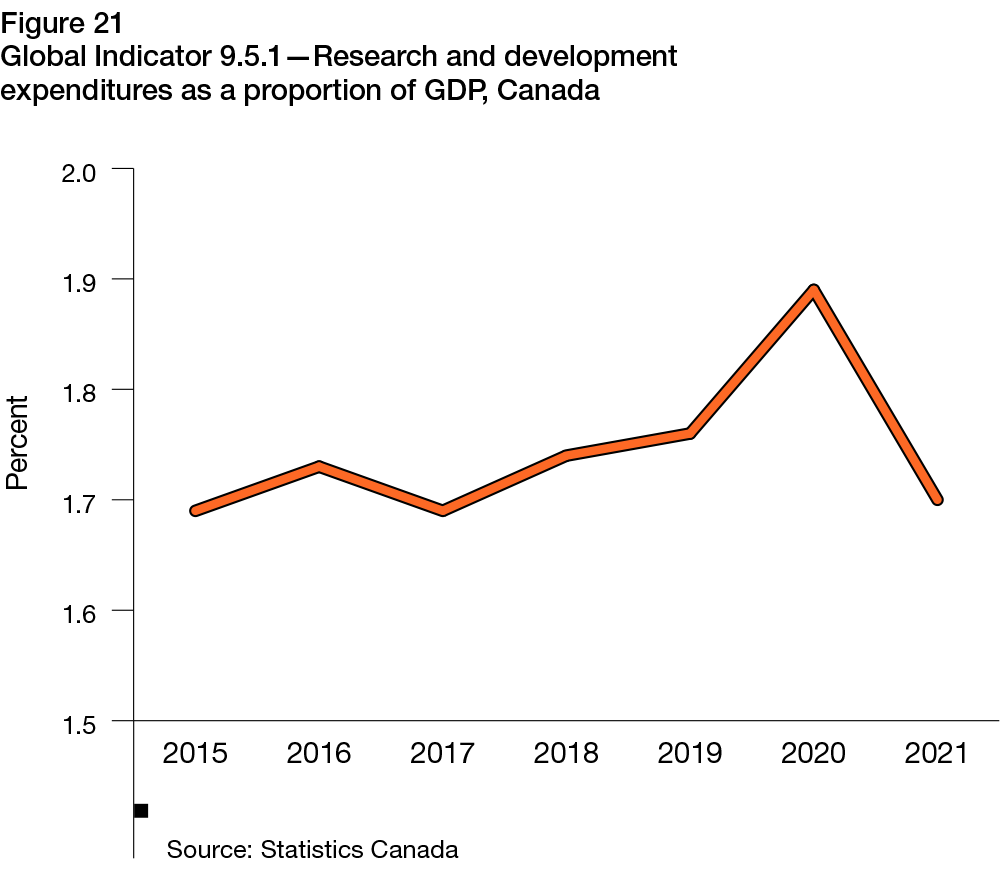
Text description - Figure 21
| Year | Percentage |
|---|---|
| 2015 | 1.69 |
| 2016 | 1.73 |
| 2017 | 1.69 |
| 2018 | 1.74 |
| 2019 | 1.76 |
| 2020 | 1.89 |
| 2021 | 1.7 |
- Source: Statistics Canada
- Unit of measure: percentage
Between 2018 and 2021, the proportion of R&D to GDP peaked in 2020 at 1.89% but has since declined to 1.70%. Total expenditures on research and development grew almost 10% between 2018 and 2021, virtually mirroring the rate of GDP growth over the same period. As a result, the ratio of R&D expenditures to GDP remains relatively stable, which corresponds to a progress measure of -2 indicating limited progress towards the target of enhancing scientific research and upgrading technological capabilities of industrial sectors. Among all sectors, the business enterprise sector accounted for the largest share of R&D at 44% of total expenditures while higher education and the Federal Government accounted for 19% each.
Domestic Indicator 9.5.1
Text description
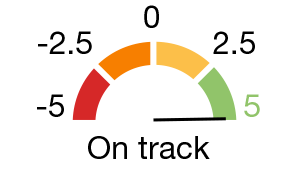
Progress status for Domestic Indicator 9.5.1 - Greenhouse gas emissions per dollar of value-added from the production of infrastructure assets
Progress status: On track
Infrastructure production can be a considerable source of greenhouse gas (GHG) emissions. In 2021, 0.33 tonnes of GHG emissions were emitted per $1,000 of value added from the production of infrastructure assets in Canada (Figure 22). This was an improvement of 10% from the amount emitted in 2015, consequently showing that the indicator is on track to achieve the ambition of ensuring that Canadians have access to modern and sustainable infrastructure. Among all types of assets, the production of transportation machinery and equipment emitted the most GHG with 0.51 tonnes emitted per $1,000 of production.
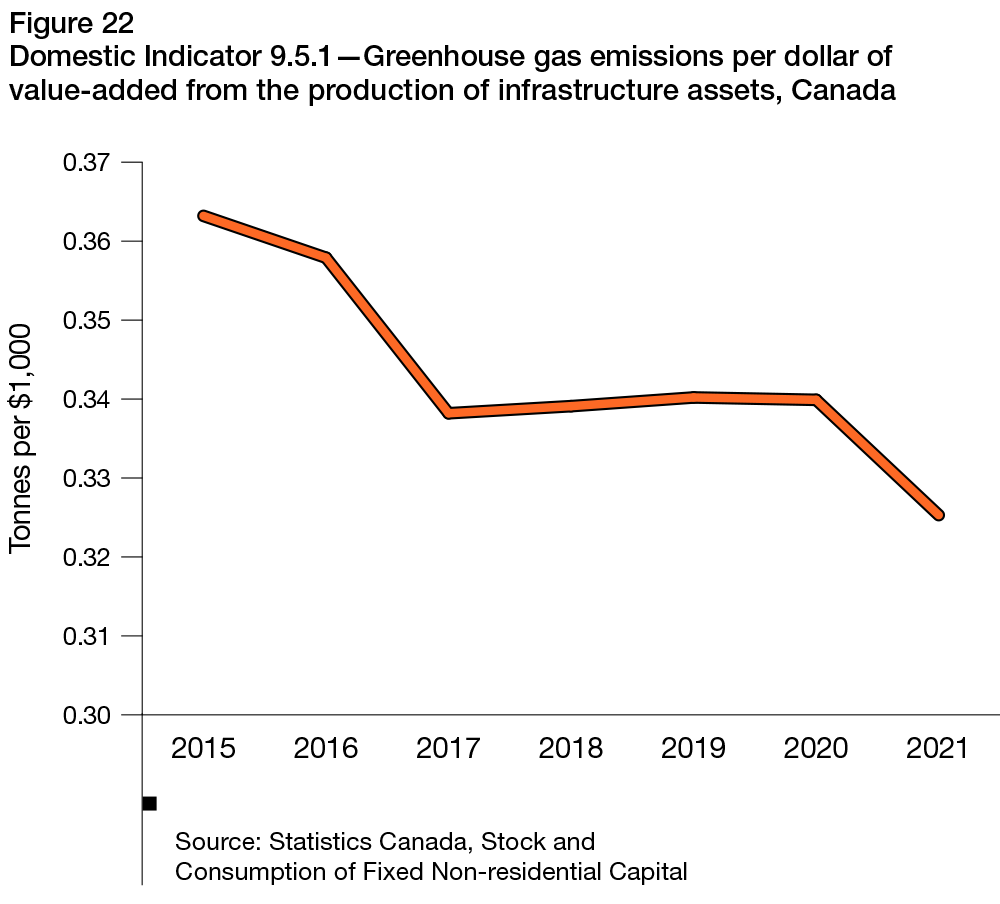
Text description - Figure 22
| Year | Canada, provinces and territories |
|---|---|
| 2015 | 0.3632 |
| 2016 | 0.3579 |
| 2017 | 0.3382 |
| 2018 | 0.3391 |
| 2019 | 0.3402 |
| 2020 | 0.3399 |
| 2021 | 0.3253 |
- Source: Statistics Canada, Stock and Consumption of Fixed Non-residential Capital
- Unit of measure: Tonnes per thousand dollars
SDG 10: Reduced Inequalities
Highlighted Indicators
- Domestic Indicator 10.2.1 - Proportion of the population reporting discrimination or unfair treatment
- Domestic Indicator 10.1.1 - Gini coefficient
Goal 10 of the SDGs aims to reduce inequality within and among countries. Inequalities can take many forms and affect all members of society. As such, it is important to have indicators to accurately monitor progress for different groups and for various facets of inequality.
Domestic Indicator 10.2.1

Text description
Progress status for Domestic Indicator 10.2.1 - Police reported hate crime
Progress status: Deterioration
In Canada, police-reported hate crimes totalled 3,360 incidents in 2021, an increase of almost 85% from 2018 (Figure 23) Footnote 19, or a score of -5 on the progress measure, indicating a deteriorating trend towards the ambition that Canadians live free of discrimination and that inequality is reduced. More than 1 in 2 police-reported hate crimes in 2021 targeted race or ethnicity, more than twice the amount reported in 2018. The second-highest target was religion, with 884 reported crimes, an increase of 35% since 2018. Hate crimes targeting sexual orientation more than doubled since 2018, totalling 423 crimes in 2021.
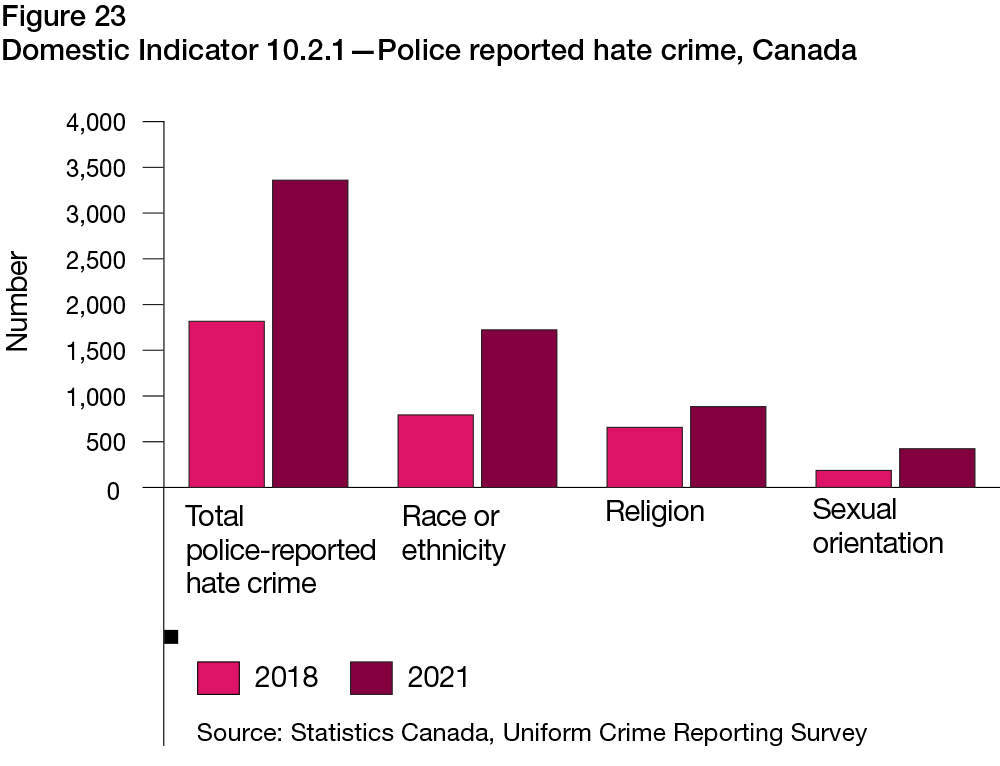
Text description - Figure 23
| Type | 2018 | 2021 |
|---|---|---|
| Total police-reported hate crime | 1,817 | 3,360 |
| Race or ethnicity | 793 | 1,723 |
| Religion | 657 | 884 |
| Sexual orientation | 186 | 423 |
- Source: Statistics Canada, Uniform Crime Reporting Survey
- Unit of measure: number
Among all police-reported hate crime violations, mischief, uttering threats, and level 1 assaultsFootnote 20 were the most prevalent in 2021. A total of 13 hate-motivated homicides occurred in 2021.
Urban areas (Census Metropolitan Areas, CMAs) had a police-reported hate crime rate per 100,000 population two times higher than non-urban areas. Among all CMAs, Ottawa, Ontario, Canada's capital, had the highest police-reported hate crime rate with 23.2 per 100,000 in 2021.
Domestic Indicator 10.1.1
Text description
Progress status for Domestic Indicator 10.1.1 - Gini coefficient
Progress status: Progress made but acceleration needed
The Gini coefficient is a measure of the relative degree of inequality in the distribution of income. In Canada, the Gini coefficient declined substantially between 2019 and 2020, largely as a result of government transfers for COVID-19 relief programs (Figure 24). The Gini coefficient declined from 0.304 in 2018 to 0.281 in 2020. However, as the pandemic relief programs wound down in 2021, the Gini coefficient increased to 0.288 in 2021 but remains lower than in 2019, overall showing that progress has been made but acceleration is needed to meet the ambition that Canadians live free of discrimination and inequalities are reduced.
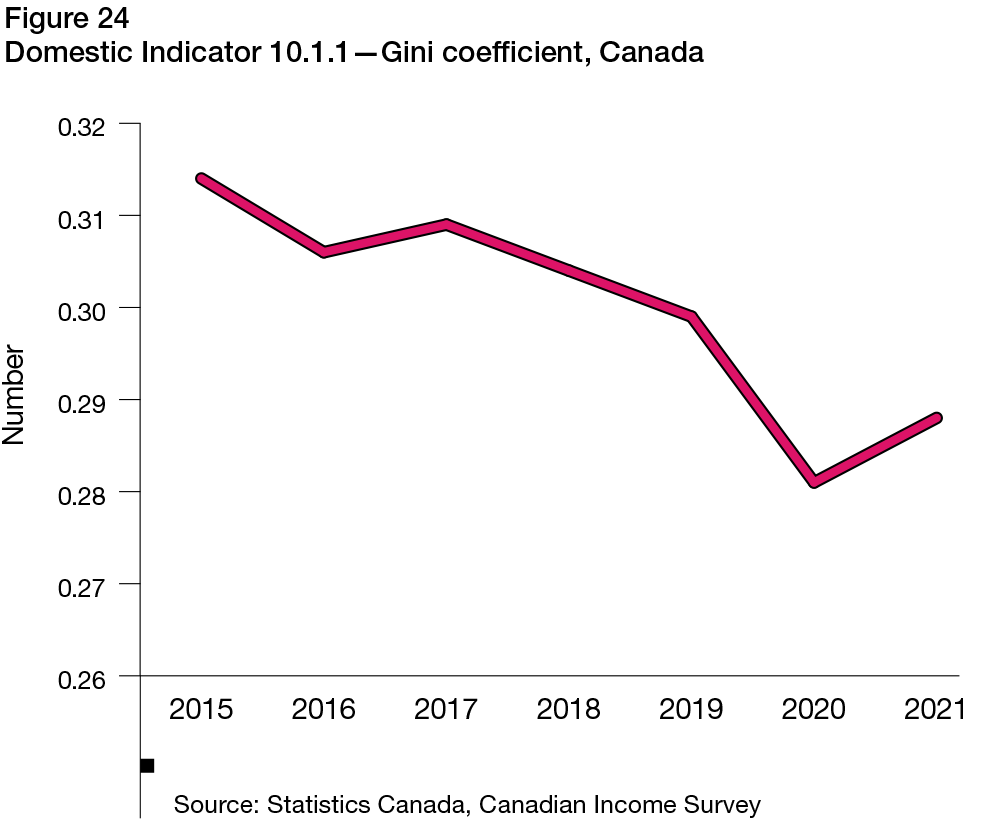
Text description - Figure 24
| Year | Gini coefficient |
|---|---|
| 2015 | 0.314 |
| 2016 | 0.306 |
| 2017 | 0.309 |
| 2018 | 0.304 |
| 2019 | 0.299 |
| 2020 | 0.281 |
| 2021 | 0.288 |
- Source: Statistics Canada, Canadian Income Survey
- Unit of measure: number
SDG 11: Sustainable Cities and Communities
Highlighted Indicators
- Domestic Indicator 11.2.1 - Proportion of households in core housing need
- Domestic Indicator 11.5.1 - Percentage of the population using shared or active transportation for commuting
Goal 11 of the SDGs aims to make cities and human settlements inclusive, safe, resilient and sustainable. In Canada, the percentage of households living in core housing needFootnote 21 has generally improved at the national level, largely as an outcome of government relief programs related to the COVID-19 pandemic. However, core housing need still varies for certain groups.
Domestic Indicator 11.2.1

Text description
Progress status for Domestic Indicator 11.2.1 - Proportion of households in core housing need
Progress status: On track
In Canada, 10.1%Footnote 22 of households lived in core housing need in 2021, down from 12.7% in 2016 (Figure 25), which shows that this indicator is on track to meet the ambition of ensuring that Canadians have access to quality housing. The proportion of renters living in core housing need decreased from 26.8% in 2016 to 20.0% in 2021. However, they remained two times more likely to be living in core housing need than the average Canadian household.
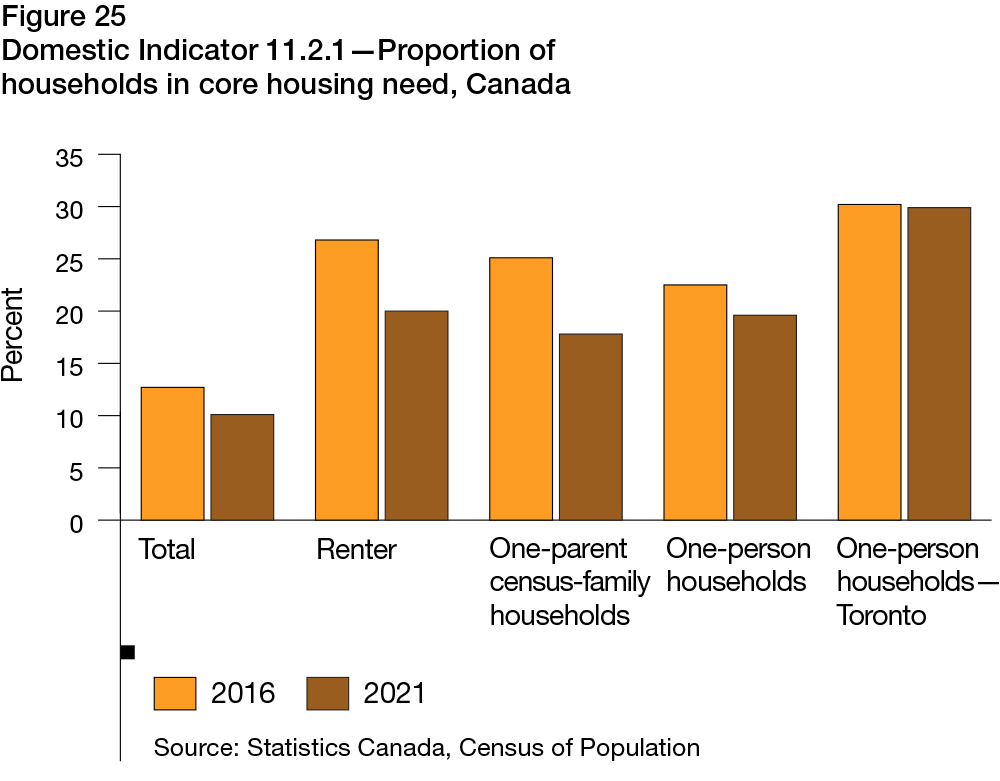
Text description - Figure 25
| Type | 2016 | 2021 |
|---|---|---|
| Total | 12.7 | 10.1 |
| Renter | 26.8 | 20.0 |
| One-parent census-family households | 25.1 | 17.8 |
| One-person households | 22.5 | 19.6 |
| One-person households - Toronto | 30.2 | 29.9 |
- Source: Statistics Canada, Census of Population
- Unit of measure: percentage
Among one-parent census familyFootnote 23 households, 17.8% lived in core housing need in 2021, a decline from 25.1% in 2016, accounting for one of the larger declines in core housing need among all household types. However, they remained the household type, alongside one-person households, that were the most likely to be living in core housing need, with a rate substantially higher than the national average.
The share of households living in core housing need was higher in Canada's larger cities. For example, in the Toronto Metropolitan Area, 16.1% of households lived in core housing need, which, while lower than the incidence of 19.1% in 2016, remains substantially higher than the national average. Among one-person households in Toronto, around 30% lived in core-housing need both in 2016 and 2021, a much higher rate than among average one-person households in Canada.
Domestic Indicator 11.5.1

Text description
Progress status for Domestic Indicator 11.5.1 - Percentage of the population using shared or active transportation for commuting
Progress status: Deterioration
The COVID-19 pandemic had widespread impacts across Canada, and this was especially true for the commuting habits of Canadians. In 2021, 24.3% of the labour force reported working from home, which was more than three times higher than in 2016. Among commuters, 13.9% used public transit or an active transportation option in 2021, a decline from 19.3% in 2016 (Figure 26). A declining share of Canadians opting for sustainable transportation options for commuting demonstrates a deteriorating trend towards the target of having 22% of commuters using shared or active transportation.
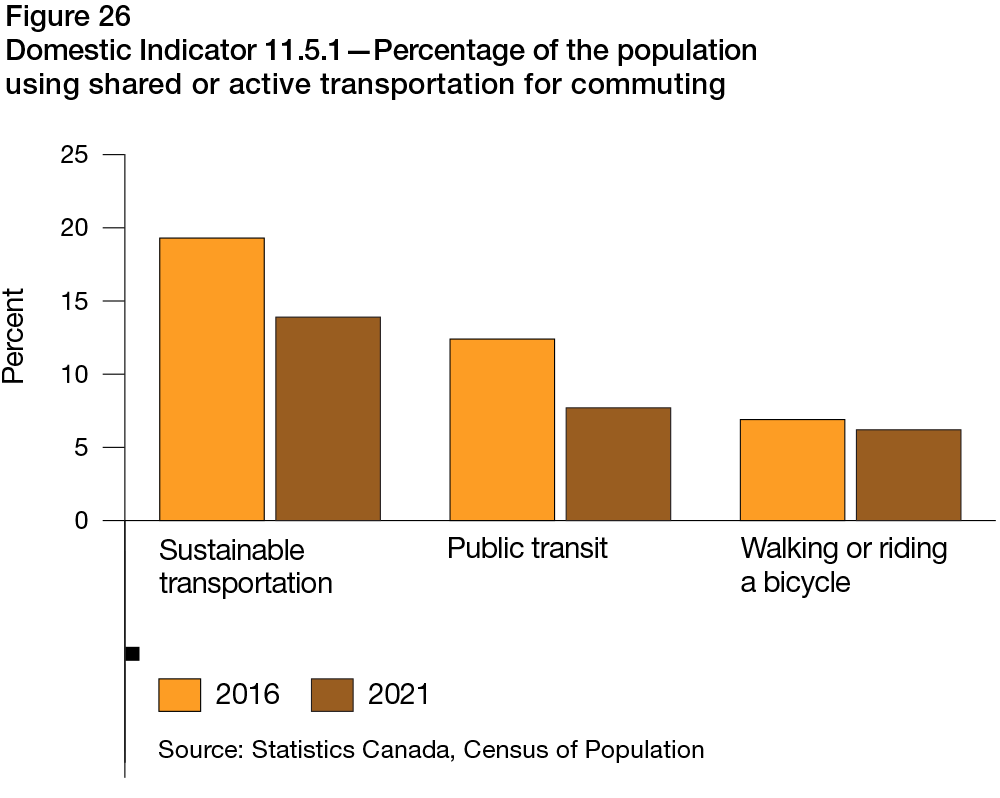
Text description - Figure 26
| Type | 2016 | 2021 |
|---|---|---|
| Sustainable transportation | 19.3 | 13.9 |
| Public transit | 12.4 | 7.7 |
| Walking or riding a bicycle | 6.9 | 6.2 |
- Source: Statistics Canada, Census of Population
- Unit of measure: percentage
SDG 12: Responsible Consumption and Production
Highlighted Indicators
- Domestic Indicator 12.3.1 - Total waste diversion per capita
- Domestic Indicator 12.1.1 - Proportion of new light duty vehicle registrations that are zero-emission vehicles
Domestic Indicator 12.3.1

Text description
Progress status for Domestic Indicator 12.3.1 - Total waste diversion per capita
Progress status: Progress made but acceleration needed
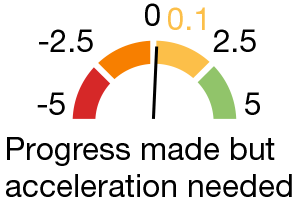
Goal 12 of the SDGs aims to ensure sustainable consumption and production patterns. In 2020, businesses and households diverted almost 10 million tonnes of materials from landfills, an increase of 4% from 2018 to 2020 (Figure 27). This increase in diverted materials per capita yields a progress measure score of 0.14 which demonstrates that progress has been made but acceleration is needed to achieve the ambition that Canadians consume in a sustainable manner.
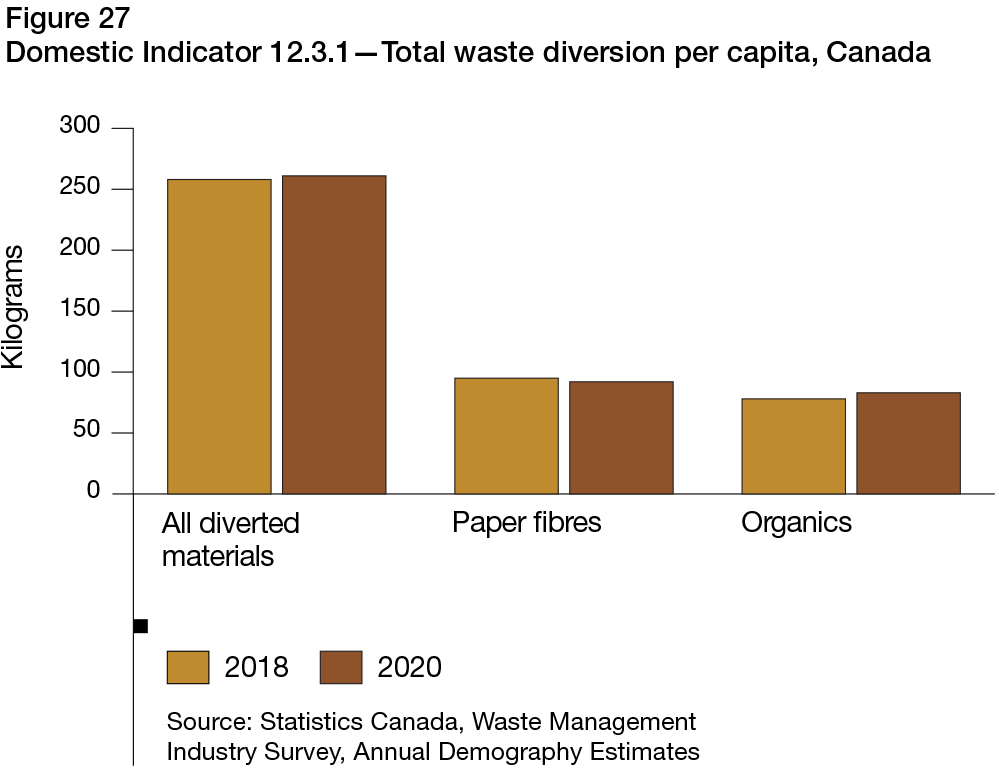
Text description - Figure 27
| Type | 2018 | 2020 |
|---|---|---|
| All diverted materials | 258 | 261 |
| Paper fibres | 95 | 92 |
| Organics | 78 | 83 |
- Sources: Statistics Canada, Waste Management Industry Survey, Annual Demography Estimates
- Unit of measure: kilograms
Among the type of materials diverted from landfill, organic matter from residential sources increased the most with a 10% increase between 2018 and 2020, which may be a sign that households are increasingly benefiting from composting programs in their regions. On a per capita basis, the amount diverted from landfills has remained relatively stable at 261 kilograms in 2020.
Domestic Indicator 12.1.1

Text description
Progress status for Domestic Indicator 12.1.1 - Proportion of new light duty vehicle registrations that are zero-emission vehicles
Progress status: On track
Zero-emission vehicles have grown noticeably in popularity in recent years. The increase observed has been helped by a series of government programs to incentivize the adoption of zero-emission vehicles by Canadians.
Zero-emission vehicles accounted for 8.2% of new vehicles purchased in 2022, more than three and half times the proportion of these types of vehicles purchased in 2018 (2.2%) (Figure 28). A rapidly increasing trend demonstrates that the indicator is on track to achieve the target of having 30% of new light-duty vehicle sales being zero-emission vehicles by 2030.
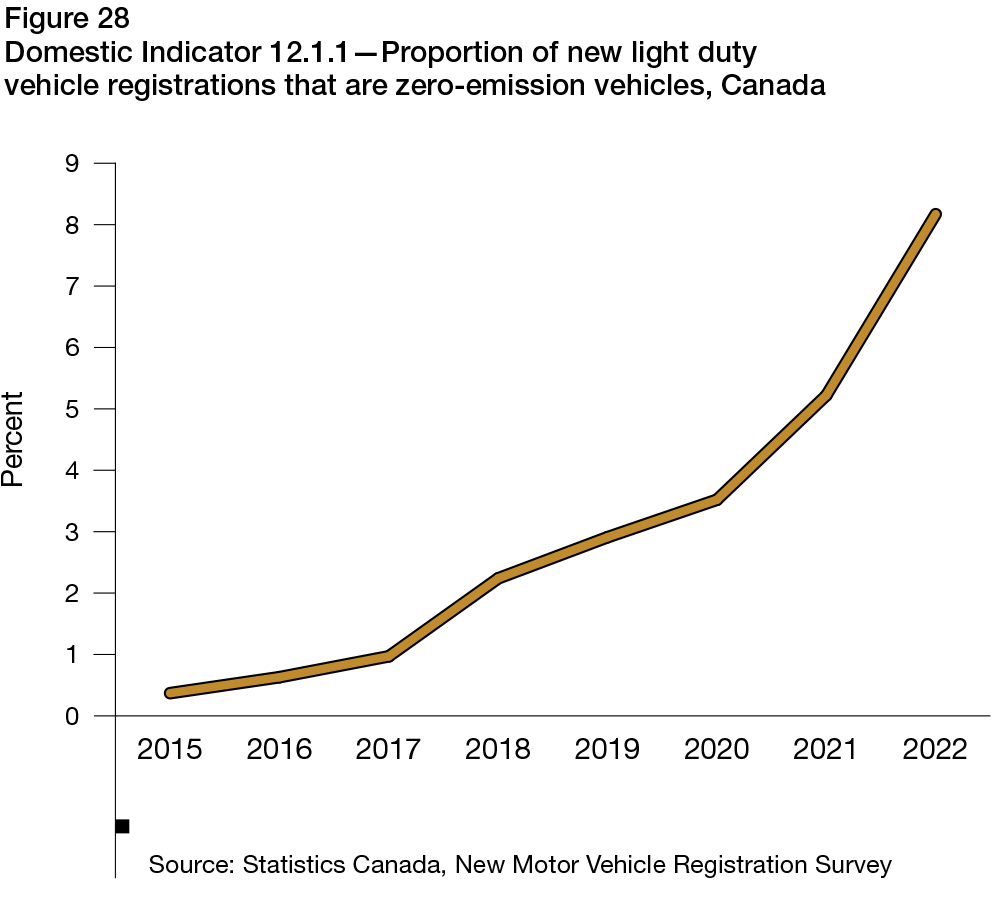
Text description - Figure 28
| Year | Canada, Provinces and Territories |
|---|---|
| 2015 | 0.37 |
| 2016 | 0.63 |
| 2017 | 0.97 |
| 2018 | 2.24 |
| 2019 | 2.91 |
| 2020 | 3.52 |
| 2021 | 5.22 |
| 2022 | 8.17 |
- Source: Statistics Canada, New Motor Vehicle Registration Survey
- Unit of measure: percentage
Among provinces and territories, the largest proportion of zero-emission vehicles were found in provinces with active credit programs, in addition to the newly launched and federally administered program. For example, in British Columbia and the territories, 16.3% of vehicles purchased in 2022 were zero-emission, the highest share in Canada. In Quebec, zero-emission vehicles accounted for 12.3% of all vehicles sold in 2022, the second-largest share in the country. Among new zero-emission vehicle registrations in 2022, nearly 40% were in Quebec, despite the province accounting for just under a quarter of all vehicle registrations that year.
SDG 13: Climate Action
Highlighted Indicators
- Global Indicator 13.2.2 - Total greenhouse gas emissions per year
- Domestic Indicator 13.3.1 - Proportion of municipal organizations who factored climate change adaptation into their decision-making process
Goal 13 of the SDGs aims to take urgent action to combat climate change and its impacts. Tracking greenhouse gas (GHG) emissions is a good measure of the progress made towards addressing climate change.
Global Indicator 13.2.2
The onset of the COVID-19 pandemic led to effects that rippled through the Canadian economy and society as the country entered lockdown and many industries temporally slowed or halted operations. This contributed to a decline of nearly 9% in GHG emissions between 2019 and 2020, which was the largest year-over-year decline since this measurement began. Looking back to the 2018 VNR and comparing it to the latest data, total GHG emissions fell 7.6% to 670 megatonnes of carbon dioxide equivalent (Mt CO2 eq) in 2021 from 725 Mt CO2 eq in 2018.Footnote 24
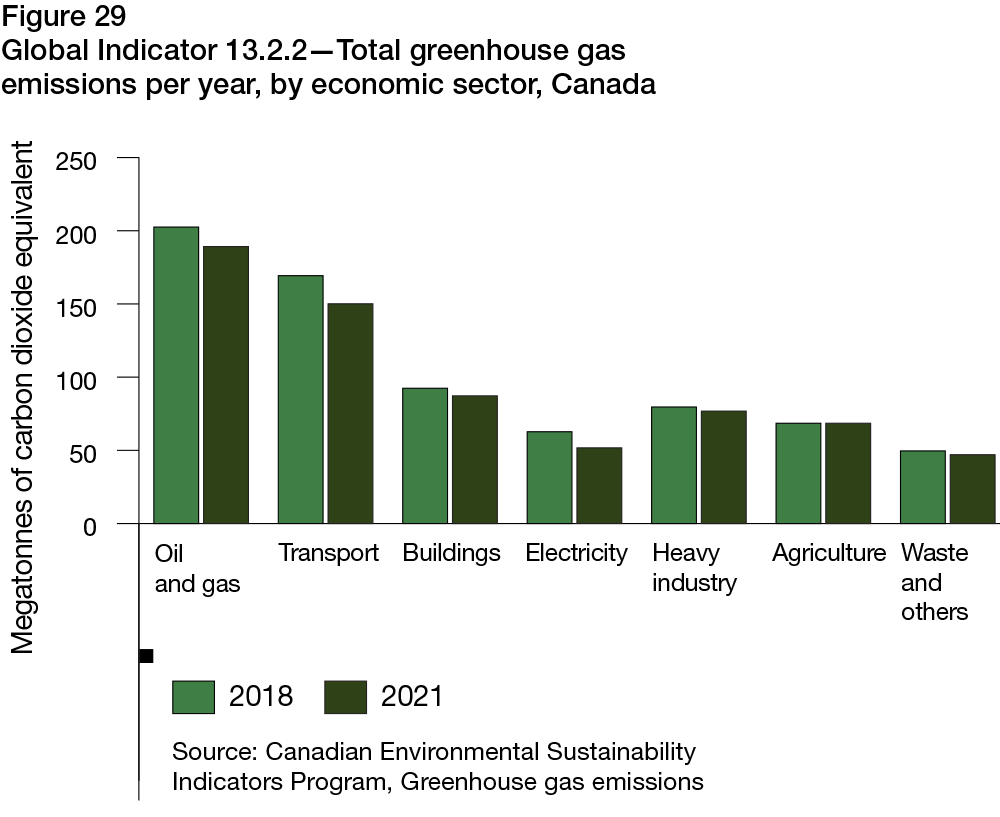
Text description - Figure 29
| Type | 2018 | 2021 |
|---|---|---|
| Oil and gas | 202.5 | 189.2 |
| Transport | 169.3 | 150.1 |
| Buildings | 92.4 | 87.2 |
| Electricity | 62.7 | 51.7 |
| Heavy industry | 79.6 | 76.8 |
| Agriculture | 68.5 | 68.5 |
| Waste and others | 49.6 | 47.0 |
- Source: Canadian Environmental Sustainability Indicators Program, Greenhouse gas emissions
- Unit of measure: Megatonnes of carbon dioxide equivalent
Among economic sectors, the changes since 2018 varied substantially. Emissions from the oil and gas sector, the largest emitting sector in Canada, fell by 6.6% between 2018 and 2021 (Figure 29). The transport sector, which was heavily affected by the restrictions imposed during the COVID-19 pandemic in 2020 fell by 11.3% between 2018 and 2021. Countering the overall declining trends observed in all other sectors, emissions stemming from the agricultural sector remained the same between 2018 and 2021, accounting for just over 10% of all GHG emissions in Canada.
Domestic Indicator 13.3.1

Text description
Progress status for Domestic Indicator 13.3.1 Proportion of municipal organization who factored climate change adaptation into their decision-making process
Progress status: On track
A growing number of municipal, regional, provincial, and territorial government organizations have embraced their role to take action to combat the impacts of climate change. The proportion of organizations that factored climate change adaptation into their decision-making process has been increasing. In 2020, almost 60% of government organizations in Canada factored climate change adaptation into their decision-making process related to at least one core public infrastructureFootnote 25, an increase from 51% in 2018. A growing proportion of organizations adapting these practices demonstrate that the country is on track to achieve the ambition that Canadians are well-equipped and resilient to face the effects of climate change.
Among all types of core public infrastructure, climate change was most factored in for roads, wastewater, stormwater, and potable water infrastructure. Among Canadian municipalities, urban ones were more likely to factor climate change adaptation decision-making across all asset categories than their rural counterparts. The difference was more pronounced for water infrastructure where 62.4% of urban municipalities reported factoring climate change into their decision-making compared to 43.9% of rural municipalities in 2020.
SDG 14: Life Below Water
Highlighted Indicators
- Domestic Indicator 14.1.1 - Proportion of marine and coastal areas conserved
- Global Indicator 14.4.1 - Proportion of fish stocks within biologically sustainable levels
Domestic Indicator 14.1.1
Goal 14 of the SDGs aims to conserve and sustainably use the oceans, seas, and marine resources for sustainable development. At the end of 2022, Canada had conserved 14.7% of its marine and coastal areas, which remains short of the 2025 target (25%) but showing substantial progress towards achievement of the 2030 target.Footnote 26
Global Indicator 14.4.1
Text description
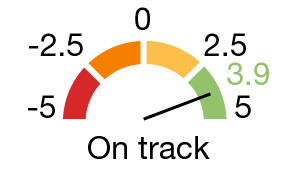
Progress status for Global Indicator 14.4.1 - Proportion of fish stocks within biologically sustainable levels
Progress status: Progress made but acceleration needed
The proportion of key fish stock harvested at or below an approved removal reference or other approved level in Canada has remained relatively high since 2015 and reached just above 98% in 2020 (Figure 30). Consequently, this shows moderate progress towards the target to effectively regulate harvesting and end overfishing, illegal, unreported and unregulated fishing and destructive fishing practices and implement science-based management plans.
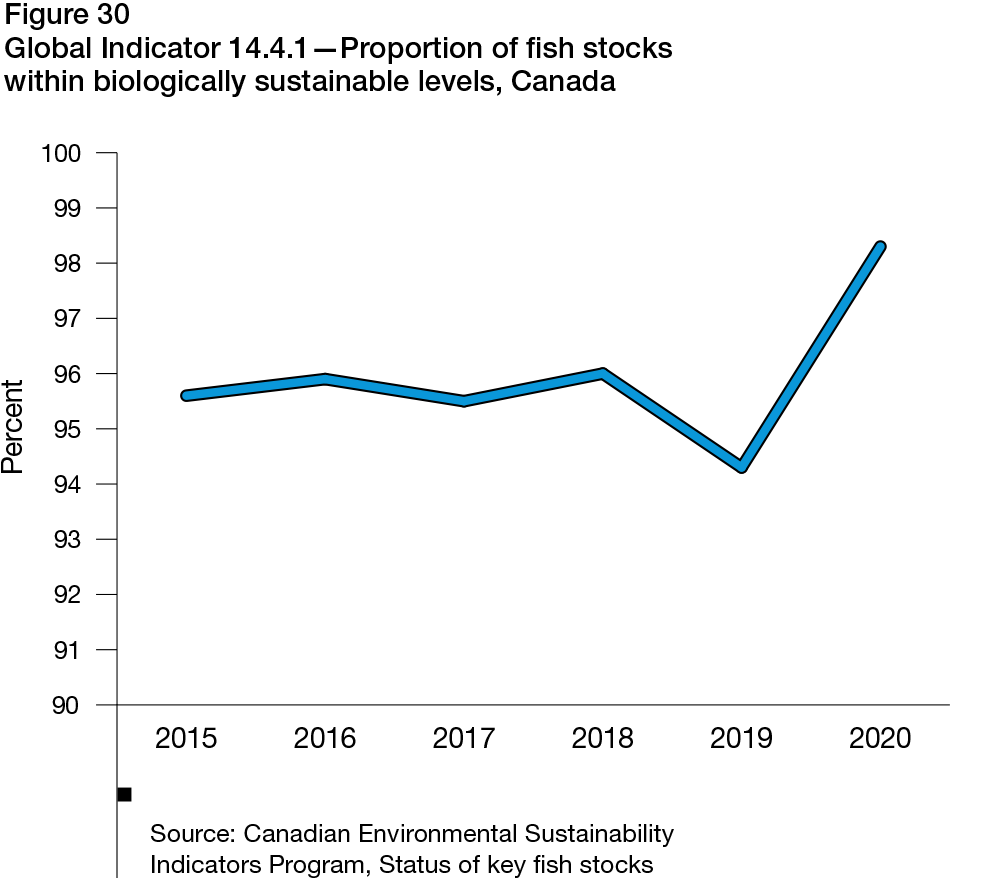
Text description - Figure 30
| Year | Canada |
|---|---|
| 2015 | 95.6 |
| 2016 | 95.9 |
| 2017 | 95.5 |
| 2018 | 96.1 |
| 2019 | 94.3 |
| 2020 | 98.3 |
- Source: Canadian Environmental Sustainability Indicators Program, Status of key fish stocks
- Unit of measure: percentage
Among the assessed fish stocks in Canada, three stocks were identified as being harvested above approved levels. Harvest exceeded approved levels for one Atlantic snow crab stock (Crustaceans), one Northern Quebec beluga stock (Marine mammals), and one Atlantic salmon stock (Salmonids).
SDG 15: Life on Land
Highlighted Indicators
- Domestic Indicator 15.3.1 - Proportion of terrestrial (land and freshwater) area conserved
- Domestic Indicator 15.2.1 - Proportion of species at risk showing progress towards their population and distribution objectives
Goal 15 of the SDGs aims to protect, restore and promote sustainable use of terrestrial ecosystems, sustainably manage forest, combat desertification, and halt and reverse land degradation and halt biodiversity loss. In Canada, between 2015 and 2021, forest area has remained relatively stable covering just over 38% of the country's land area with over 75% of it in the boreal zone.
Domestic Indicator 15.3.1
At the end of 2022, 13.6% of Canada's terrestrial area was conserved, which was an improvement from 11.4% in 2017. Although the proportion of conserved terrestrial area has been on a long-term positive trend, it still falls short of the target to conserve 25% of Canada's land by 2025 and working towards 30% by 2030, illustrating that limited progress has been made to meet either the 2025 or the 2030 target. As shown on the map below (Figure 32), larger conserved areas tend to be in northern Canada, where agriculture, settlements and road networks are less present.
Domestic Indicator 15.2.1
Text description
Progress status for Domestic Indicator 15.2.1 - Proportion of species at risk showing progress towards their population and distribution objectives
Progress status: On track
As of May 2022, of the 144 species at risk for which trends could be determined, 43% show progress towards their population and distribution objectives, virtually unchanged since November 2019 (Figure 31). An increasing number of species showing progress towards their population and distribution objectives indicates that progress is being made towards the ambition to ensure that all species have healthy and viable populations.
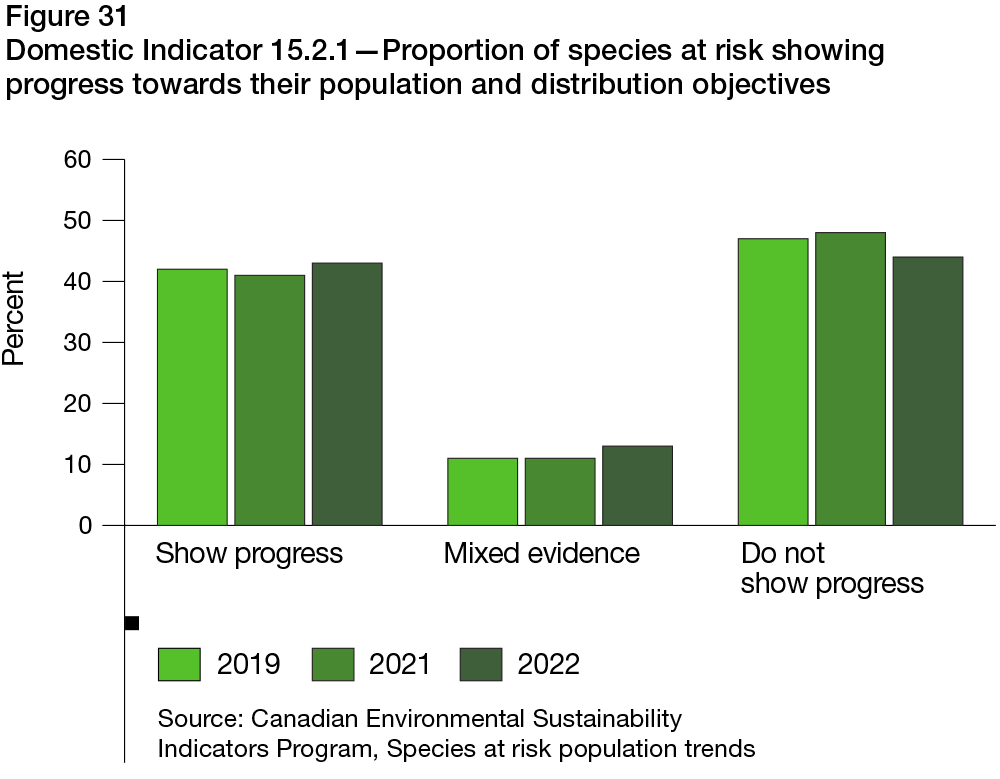
Text description - Figure 31
| Year | Show progress | Mixed evidence | Do not show progress |
|---|---|---|---|
| 2019 | 42 | 11 | 47 |
| 2021 | 41 | 11 | 48 |
| 2022 | 43 | 13 | 44 |
- Source: Canadian Environmental Sustainability Indicators Program, Species at risk population trends
- Unit of measure: percentage
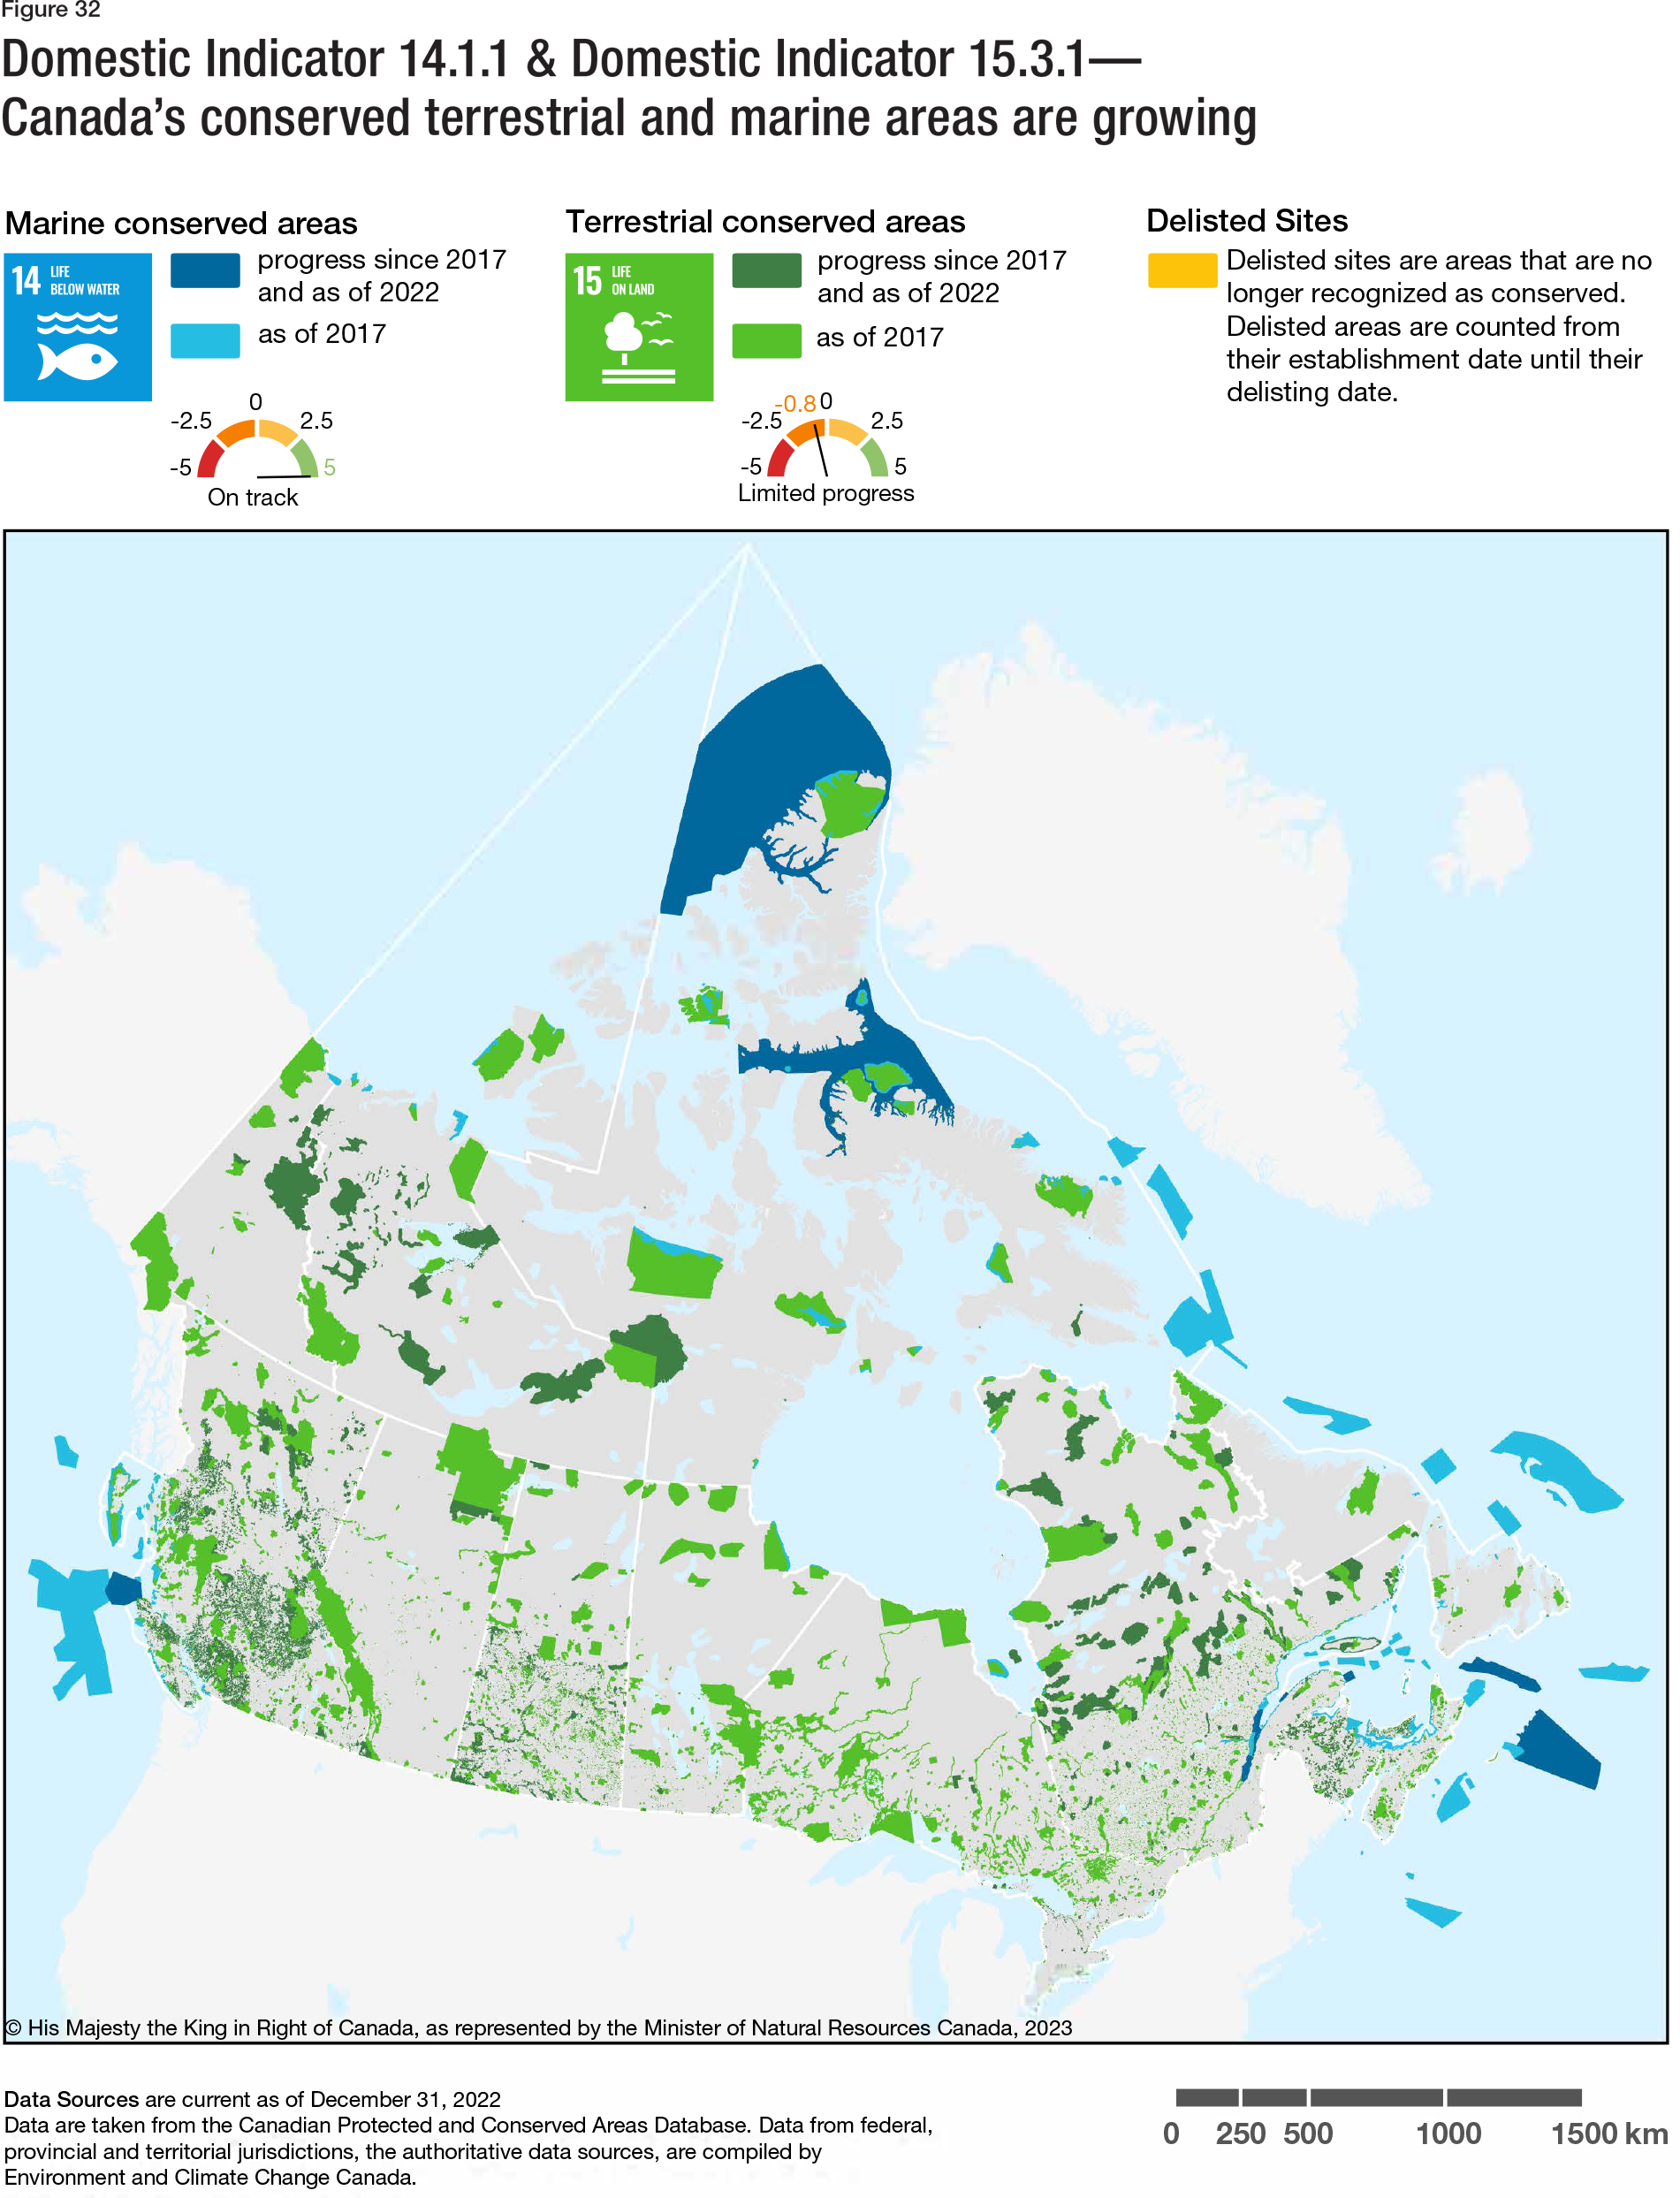
Text description - Figure 32
| Marine conserved areas | Number of Areas |
|---|---|
| progress since 2017 and as of 2022 | 41 |
| as of 2017 | 867 |
| Terrestrial conserved areas | Number of Areas |
|---|---|
| progress since 2017 and as of 2022 | 2947 |
| as of 2017 | 8554 |
| Delisted Sites | Number of Areas |
|---|---|
| Delisted sites are areas that are no longer recognized as conserved. Delisted areas are counted from their establishment date until their delisting date. | 109 |
- Data Sources are current as of December 31, 2022
- Data are taken from the Canadian Protected and Conserved Areas Database. Data from federal, provincial and territorial jurisdictions, the authoritative data sources, are compiled by Environment and Climate Change Canada.
Progress status for Domestic Indicator 14.1.1 Proportion of marine and coast areas conserved
Progress status: On track
Progress status for Domestic Indicator 15.3.1 Proportion of terrestrial (land and freshwater) area conserved
Progress status: Limited progress
SDG 16: Peace, Justice and Strong Institutions
Highlighted Indicators
- Domestic Indicator 16.5.1 - Criminal court case completion time
- Domestic Indicator 16.7.1 - Proportion of the population with high levels of confidence in selected institutions
Goal 16 of the SDGs aims to promote peaceful and inclusive societies for sustainable development, provide access to justice for all and build effective, accountable and inclusive institutions at all levels. The COVID-19 pandemic had substantial impacts across society, and this was especially true for criminal court case completion time in Canada.
Domestic Indicator 16.5.1
Text description
Progress status for Domestic Indicator 16.5.1 - Criminal court case completion time
Progress status: Deterioration
Among adult courts, the median number of days it took to complete a case increased from 137 days in 2017-18 to 186 days in 2020-21, an increase of almost 36% over the four-year period (Figure 33), yielding a progress measure of -5, indicating that there has been deterioration towards the ambition that Canadians have equal access to justice. In youth courts, the increase was even more substantial as the median number of days to completion grew from 141 in 2017-18 to 235 in 2020-21, representing an increase of 67%, almost twice the rate observed in adult courts.
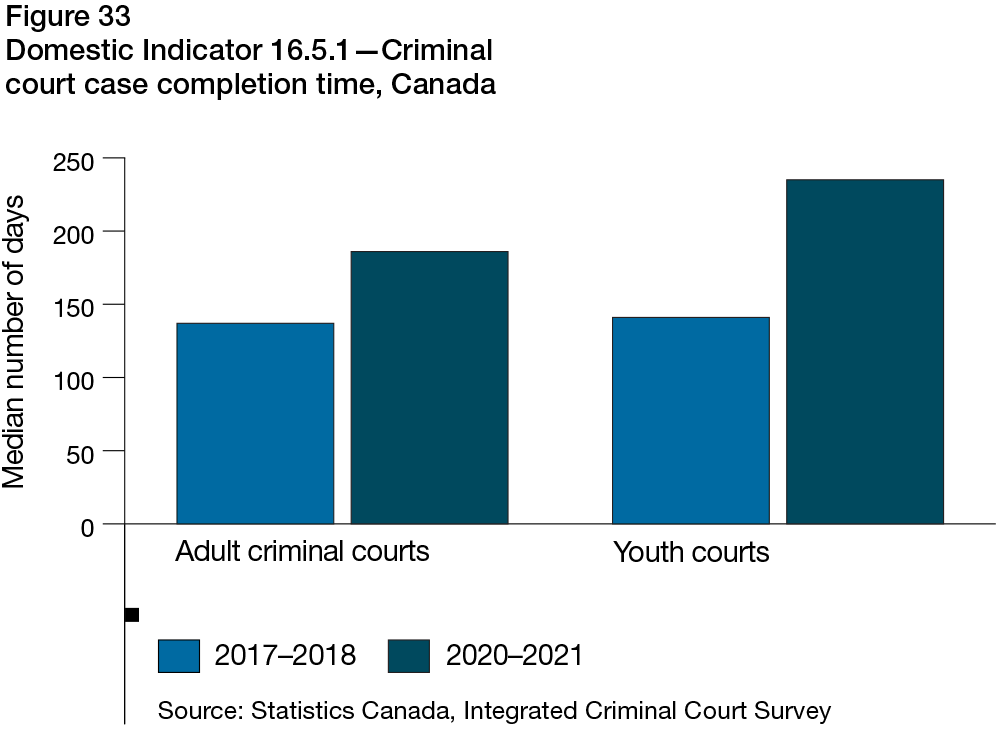
Text description - Figure 33
| Criminal Court case completion time | 2017-18 | 2020-21 |
|---|---|---|
| Adult criminal courts | 137 | 186 |
| Youth courts | 141 | 235 |
- Source: Statistics Canada, Integrated Criminal Court Survey
- Unit of measure: median number of days
Among adult court cases which took longer than 7 days to complete, crimes against the person took the longest with a median of 260 days in 2020-21, up from 197 in 2017-18. A similar situation occurred in youth courts, where cases against the person increased from a median of 186 days to completion in 2017-18 to taking 278 days in 2020-21.
Domestic Indicator 16.7.1
Confidence in institutions is key in providing justice for all while ensuring strong, inclusive, and equitable institutions at all levels. Confidence among certain institutions, such as the police and the justice system and courts, varied substantially across different population groups.
In 2020, 1 in 5 Indigenous and black people had little to no confidence in the police, which was a rate two times higher than the non-Indigenous and non-visible minority population (Figure 34). Confidence in the justice system and courts was lowest for First Nations, Métis, or Inuit, with 30% reporting no confidence in the institution, which was almost double the rate of non-Indigenous Peoples.
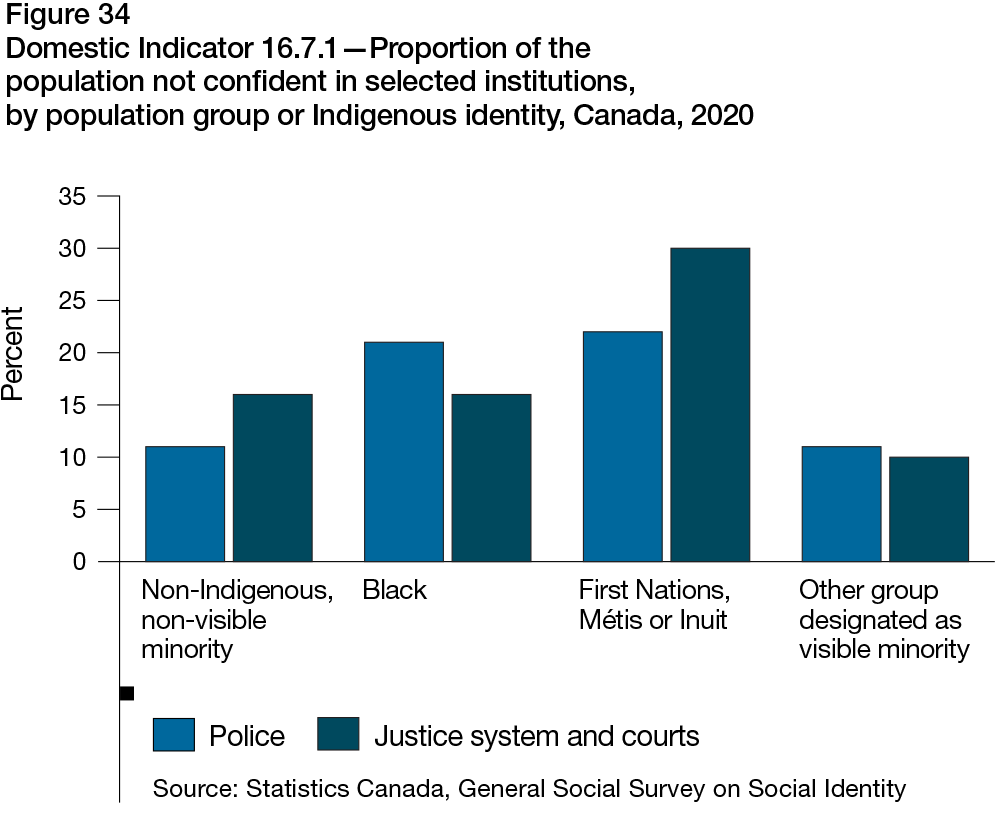
Text description - Figure 34
| Type | Non-Indigenous, non-visible minority | Black | First Nations, Métis or Inuit | Other group designated as visible minority |
|---|---|---|---|---|
| Police | 11 | 21 | 22 | 11 |
| Justice system and courts | 16 | 16 | 30 | 10 |
- Source: Statistics Canada, General Social Survey on Social Identity
- Unit of measure: percentage
SDG 17: Partnerships for the Goals
Highlighted Indicators
- Global Indicator 17.2.1 - Net official development assistance, total, as a proportion of the OECD Development Assistance Committee donors' gross national income (GNI)
- Global Indicator 17.3.1 - Foreign direct investment
Global Indicator 17.2.1
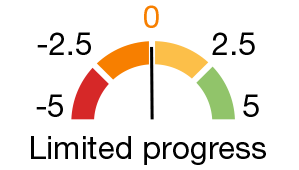
Text description
Progress status for Global Indicator 17.2.1 - Net official development assistance, total, as a proportion of the OECD Development Assistance Committee donors' gross national income (GNI)
Progress status: Limited progress
Goal 17 of the SDGs aims to strengthen the means of implementation and revitalize the Global Partnership for Sustainable Development. Canada's monetary aid to promote economic development and welfare in developing countries has increased to account for 0.319% of the country's Gross National Income (GNI) (Figure 35). Looking back at the last VNR in 2018, the share of GNI attributed to total Official Development Assistance (ODA) was 0.277%.
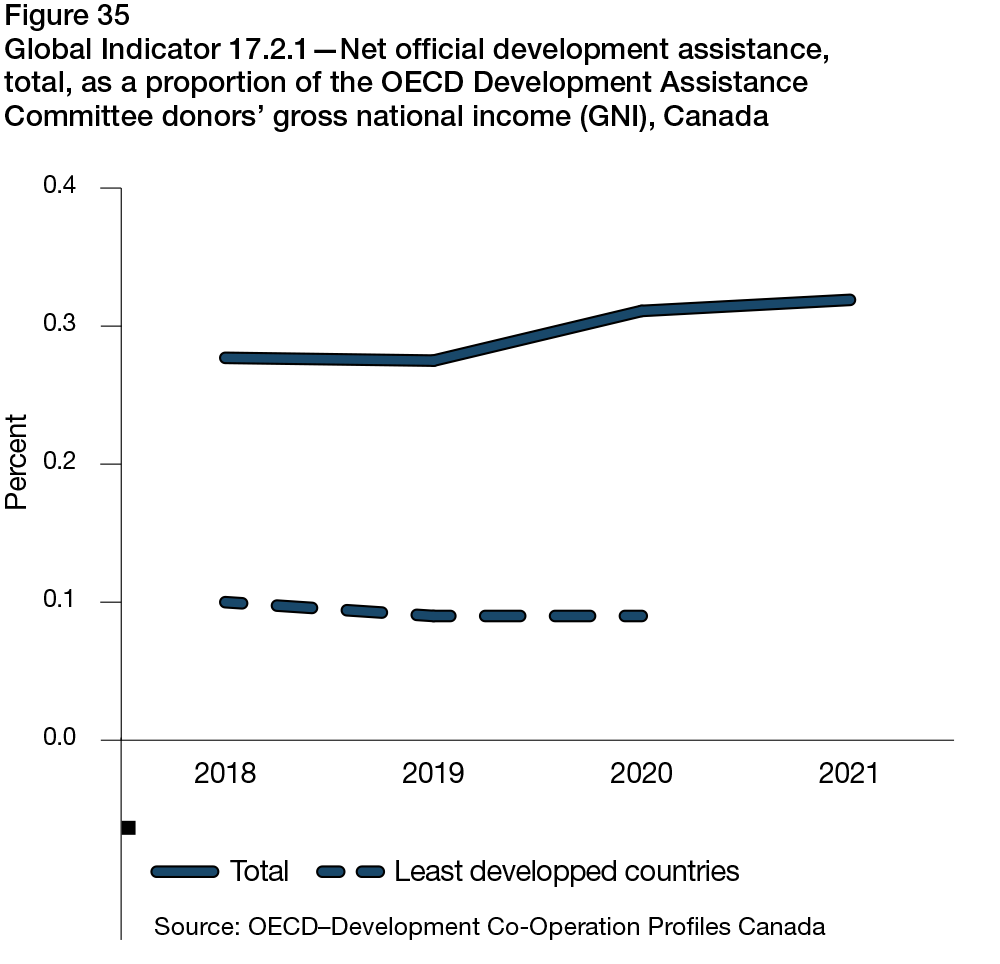
Text description - Figure 35
| Year | Total | Least developped countries |
|---|---|---|
| 2018 | 0.277 | 0.1 |
| 2019 | 0.275 | 0.09 |
| 2020 | 0.311 | 0.09 |
| 2021 | 0.319 | n/a |
- Source: OECD - Development Co-Operation Profiles Canada
- Unit of measure: percentage
While the total share of net ODA to Canada's GNI grew between 2018 and 2021, it remains substantially below the target of 0.7%, which indicates that only limited progress has been made towards the achievement of the target of 0.7 per cent of GNI for official development assistance. Among G7 countries, Canada posted the fifth-largest share of GNI attributed to net ODA and among OECD countries, Canada ranked 14th. The share of total net ODA to Canada's GNI directed to the least developed countries was 0.09% in 2020, which was a slight decrease from 0.10% in 2018. This represented a proportion slightly less than half what the target is for this indicator (0.20%).
Global Indicator 17.3.1

Text description
Progress status for Global Indicator 17.3.1 - Foreign direct investment, in billions of Canadian dollars
Progress status: On track
Canadian foreign direct investment abroad to developing countriesFootnote 27 continued its upward trend as it increased 56% between 2018 and 2022 to reach a total of $437.5 billion (Figure 36) or 22% of all Canadian foreign direct investment abroad. Increasing foreign direct investment to developing countries, with a progress score of 5.0, indicates that with current levels of growth, this indicator is on track to meet the target of mobilizing additional financial resources for developing countries.
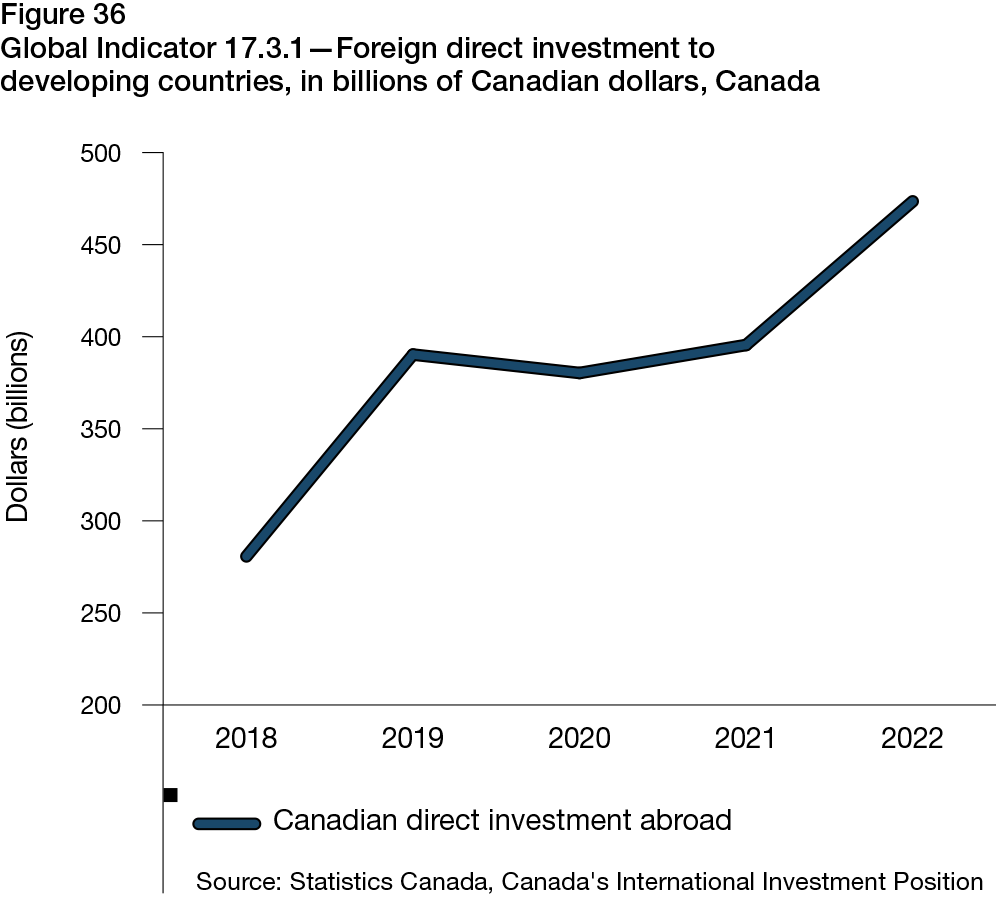
Text description - Figure 36
| Year | Canadian direct investment abroad |
|---|---|
| 2018 | 280.7 |
| 2019 | 390.3 |
| 2020 | 380.3 |
| 2021 | 395.5 |
| 2022 | 437.5 |
- Source: Statistics Canada, Canada's International Investment Position
- Unit of measure: dollars (billions)