
Canada Disability Savings Program: 2024 Annual Report
On this page
Alternate formats

Canada Disability Savings Program: 2024 Annual Report [PDF - 2 MB]
Large print, braille, MP3 (audio), e-text and DAISY formats are available on demand by ordering online or calling 1 800 O-Canada (1-800-622-6232). If you use a teletypewriter (TTY), call 1-800-926-9105.
List of figures
- Figure 1: CDSP statistics summary, as of December 2024
- Figure 2: RDSP take-up rate by geography, age group, and gender
- Figure 3: Number of beneficiaries with an active, new, and closed RDSP from 2018 to 2024
- Figure 4: RDSP beneficiaries by province or territory of residence, 2024
- Figure 5: Number of RDSP beneficiaries by age group and gender (left panel), and percentage (%) of RDSP beneficiaries by age group and income level (right panel), 2024
- Figure 6: Number (in thousands) and percentage (%) of RDSP beneficiaries by age group (left panel) and income level (right panel), 2024
- Figure 7: Number (upper panel) and percentage (%, bottom panel) of new RDSP beneficiaries by age group, 2018 to 2024
- Figure 8: Number (upper panel) and percentage (%, bottom panel) of new RDSP beneficiaries by income level, 2018 to 2024
- Figure 9: Cumulative amount ($) of RDSP financial transactions, compared with the fair market value of the total RDSP assets, over the past 10 years as of December 2024
- Figure 10: Annual number of beneficiaries with selected financial transactions, 2018 to 2024
- Figure 11: Number of beneficiaries who made withdrawals, and the total amount ($) of withdrawals, from 2019 to 2024, with focus in 2024 by age group
- Figure 12: Number of beneficiaries turning 60 and making a withdrawal, their average withdrawals and fair market value of RDSP, from 2019 to 2024, with a focus on the 2024 cohort beneficiaries' distribution and components of the total assets
- Figure 13: Profile of the beneficiary turning 60 and making a withdrawal in 2024
- Figure 14: RDSP asset growth (2008 to 2024) for beneficiaries turning 60 in 2024
- Figure 15: CDSP outreach activities, 2024
List of tables
About this report
The Canada Disability Savings Program (CDSP) 2024 Annual Report provides key statistics on Registered Disability Savings Plan (RDSP) take-up rates, beneficiaries, and financial details, with data up to December 31, 2024. It also highlights the CDSP's outreach activities for the year.
Terminologies are defined in the "Definitions and glossary" section. More information on the data and methodology can be found in the Annex. Additional CDSP data is available on the Open Government Portal. For customized statistics, please contact the CDSP at NC-RDSP-ORGS-REEI-GD@hrsdc-rhdcc.gc.ca.
CDSP at a glance, 2024
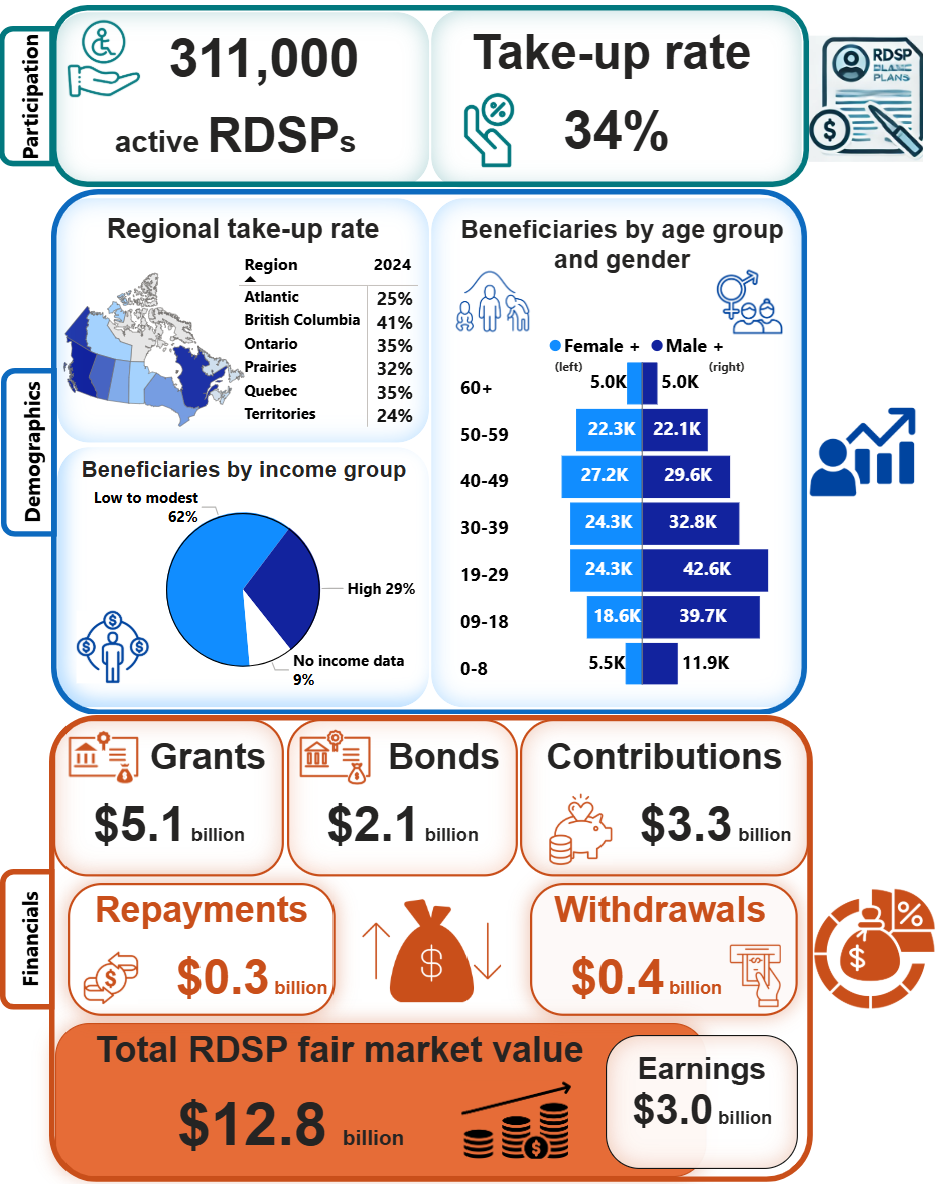
Text description – Figure 1
As of December 2024, there were over 311,000 active Registered Disability Savings Plans (RDSPs). The national take-up rate of beneficiaries aged 0 to 49 was at 34%.
There continues to be notable demographic variation in participation in 2024. Male beneficiaries outnumbered females, particularly in the younger age groups (0 to 29). In terms of income, the majority (62%) of beneficiaries reported low to modest family income. Meanwhile, 29% reported higher income levels, and 9% have no income data reported. Regionally, the highest take-up rate was in British Columbia (41%), followed by Ontario and Quebec (both 35%), the Prairies (32%), Atlantic Canada (25%), and the Territories (24%).
Since the program's inception, the Government of Canada has contributed $5.1 billion in the Canada Disability Savings Grant (CDSG or the Grants) and $2.1 billion in the Canada Disability Savings Bond (CDSB or the Bonds), while private contributions have totaled over $3.3 billion. Beneficiaries have made $0.3 billion in repayments and $0.4 billion in withdrawals. The fair market value for the total RDSP assets has reached $12.8 billion, which represents $3.0 billion in earnings.
| Age group | Number of RDSP beneficiaries (in thousands), Female+ | Number of RDSP beneficiaries (in thousands), Male+ |
|---|---|---|
| 60 and over | 5.0 | 5.0 |
| 50 to 59 | 22.3 | 22.1 |
| 40 to 49 | 27.2 | 29.6 |
| 30 to 39 | 24.3 | 32.8 |
| 19 to 29 | 24.3 | 42.6 |
| 9 to 18 | 18.6 | 39.7 |
| 0 to 8 | 5.5 | 11.9 |
| Income group | Percentage of RDSP beneficiaries (%) |
|---|---|
| Low to modest | 62 |
| High | 29 |
| No income data | 9 |
- Note: K represents 1,000. Male+ includes male and some non-binary individuals, and female+ includes female and some non-binary individuals. Grants represent the Canada Disability Savings Grant, and Bonds represent the Canada Disability Savings Bond. More details in terminologies and classification variables are defined in “Definitions and glossary” and Annex A1.3.
Introduction
Program overview
Launched in 2008, the Registered Disability Savings Plan (RDSP) is a long-term savings plan designed to help individuals approved for the Disability Tax Credit (DTC) and their families save for the future.
The Government of Canada contributes to RDSPs through two saving incentives, the Canada Disability Savings Grant (CDSG) and the Canada Disability Savings Bond (CDSB). Matching CDSGs of 300%, 200%, and 100% are available, depending on a beneficiary's family income and the amount contributed. Contributions to an RDSP earn tax-deferred income. With permission from the plan holder, anyone can contribute to an RDSP on behalf of a beneficiary. CDSBs of up to $1,000 per year are available to those with low to modest income while no contributions are required.
| Income group | Income level | Income thresholdsFootnote 1 and range | CDSB | Maximum CDSG |
|---|---|---|---|---|
| Low to modest | Level 1 | Less than or equal to $36,502 | $1,000 | $3,500 |
| Low to modest | Level 2 | Between $36,502 and $55,867 | < $1,000Footnote 2 | $3,500 |
| High | Level 3 | Greater than or equal to $55,867 and less than or equal to $111,733 | None | $3,500 |
| High | Level 4 | Greater than $111,733 | None | $1,000 |
| No income data | Other | No income information provided | None | $1,000 |
Roles and responsibilities
Employment and Social Development Canada (ESDC), the Canada Revenue Agency (CRA), the Department of Finance Canada, and participating financial institutions jointly administer the CDSP.
- ESDC has delegated responsibility for the Canada Disability Savings Act and the Canada Disability Savings Regulations, which govern the administration of the grant and bond
- CRA is responsible for administering the Income Tax Act, which provides the legislative framework for RDSPs. The CRA reviews and approves RDSP specimen plans, authorizes financial institutions to offer RDSPs, and registers plans. The CRA is also responsible for administering the DTC, which is an eligibility requirement to open an RDSP
- Finance Canada oversees the policy orientation and fiscal impact of the program and is responsible for setting overall parameters through the Income Tax Act
- Financial institutions offer RDSPs to the public
Program statistics
RDSP take-up rate
| Year | 2015 | 2016 | 2017 | 2018 | 2019 | 2020 | 2021 | 2022 | 2023 | 2024 |
|---|---|---|---|---|---|---|---|---|---|---|
| RDSP take-up rate (%) | 24 | 29 | 31 | 34 | 35 | 35 | 37 | 36 | 35 | 34 |
The annual RDSP take-up rate measures the percentage of DTC-approved individuals aged 0 to 49 who have an RDSP by the end of the year. As of December 31, 2024, the national RDSP take-up rate was 34% (Table 2). A key reason for the recent decline is a legislative changeFootnote 3 in 2022 that grants DTC eligibility to people with type 1 diabetes. This change applied retroactively to 2021, causing a surge in DTC approvals since 2021Footnote 4. While the number of new RDSPs opened each year has stayed relatively stable (Figure 3), the larger pool of eligible individuals has lowered the overall take-up rate. It may take years for this rate to stabilize as awareness and participation among new DTC recipients grow.
In 2024, British Columbia had the highest provincial rate at 41%. Lower rates were observed in the Territories and Atlantic provinces. Historical take-up rates by age group from 2018 to 2024 show a significantly lower participation of the 0-18 compared to older groups. Over time, the rate for youth (0 to 18) gradually increased, while the rate for young adults (19 to 34) is on a slight downward trend, and the rate for the 35-to-49 group has remained relatively steady. Male+Footnote 5 participation is higher, especially among those aged 19 to 49.
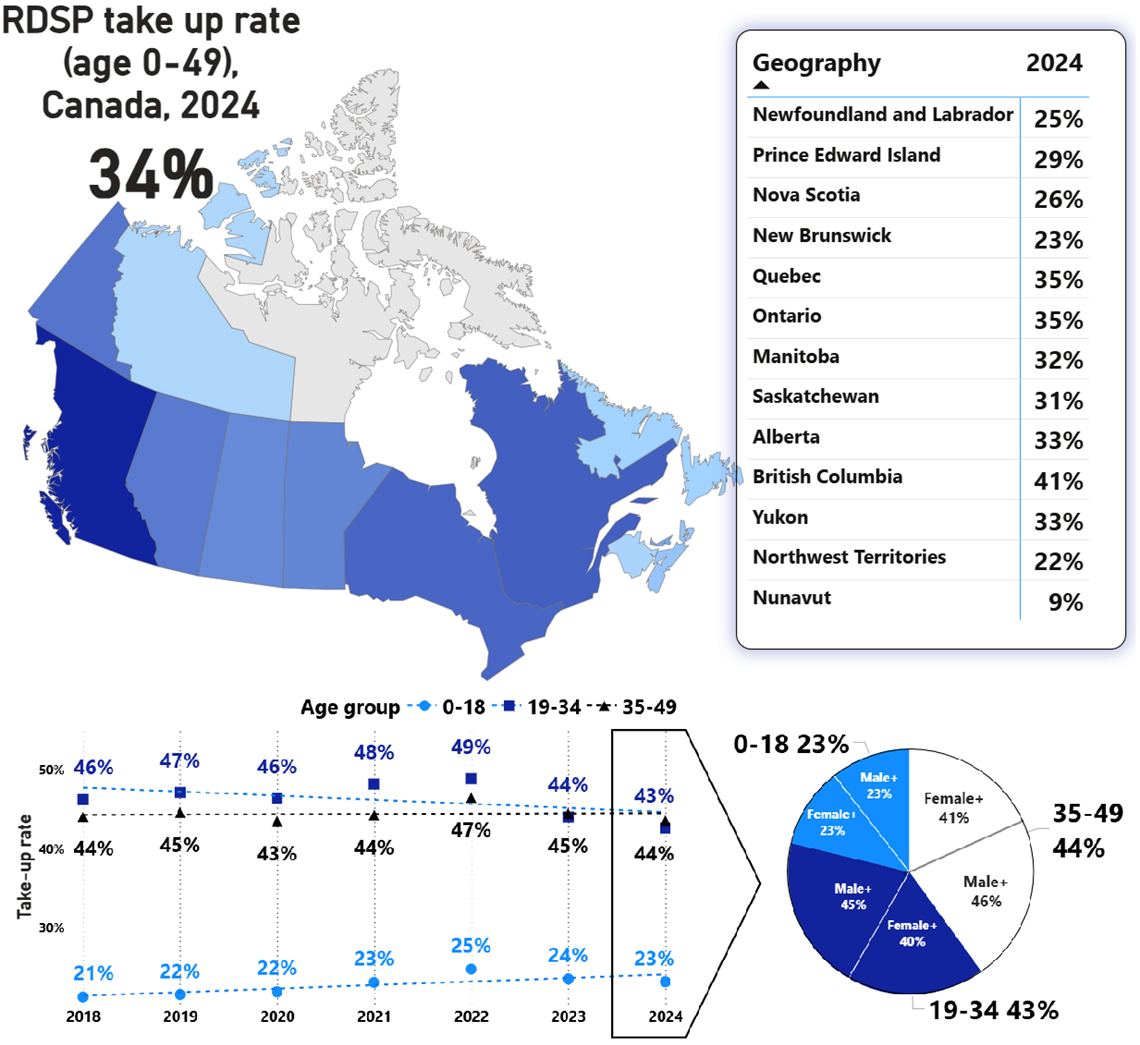
Text description – Figure 2
| Geography | RDSP take-up rate (%), 2024 |
|---|---|
| Canada | 34 |
| Newfoundland and Labrador | 25 |
| Prince Edward Island | 29 |
| Nova Scotia | 26 |
| New Brunswick | 23 |
| Quebec | 35 |
| Ontario | 35 |
| Manitoba | 32 |
| Saskatchewan | 31 |
| Alberta | 33 |
| British Columbia | 41 |
| Yukon | 33 |
| Northwest Territories | 22 |
| Nunavut | 9 |
| Year | Take-up rate, age 0 to 18 (%) | Take-up rate, age 19 to 34 (%) | Take-up rate, age 35 to 49 (%) |
|---|---|---|---|
| 2018 | 21 | 46 | 44 |
| 2019 | 22 | 47 | 45 |
| 2020 | 22 | 46 | 43 |
| 2021 | 23 | 48 | 44 |
| 2022 | 25 | 49 | 47 |
| 2023 | 24 | 44 | 45 |
| 2024 | 23 | 43 | 44 |
| Age groups | 2024 RDSP take-up rate, female+ (%) | 2024 RDSP take-up rate, male+ (%) |
|---|---|---|
| 0 to 18 | 23 | 23 |
| 19 to 34 | 40 | 45 |
| 35 to 49 | 41 | 46 |
RDSP beneficiaries
| Description | Persons (rounded to 1,000) |
|---|---|
| Cumulative number of RDSP beneficiaries | 334,000 |
| Number of beneficiaries with an active RDSP | 311,000 |
The annual number of beneficiaries with an active RDSP steadily increased from 191,000 in 2018 to 311,000 in 2024 (Figure 3). The number of beneficiaries opening new RDSPs per year has varied between 15,000 and 31,000 over the past 7 years, with a surge occurring in 2021. The variation in the number of beneficiaries with a closed RDSP per year has been stable, ranging from 2,000 to 5,000 from 2018 to 2024.
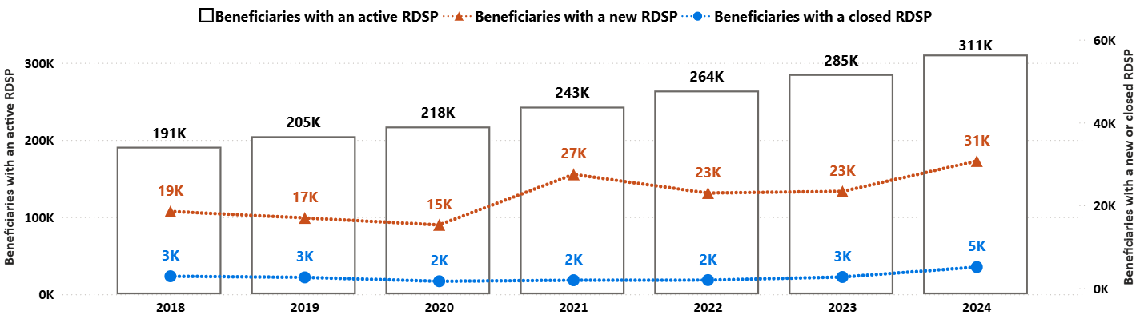
Text description – Figure 3
| Description | 2018 | 2019 | 2020 | 2021 | 2022 | 2023 | 2024 |
|---|---|---|---|---|---|---|---|
| Number of beneficiaries with an active RDSP in the calendar year (in thousands) | 191 | 205 | 218 | 243 | 264 | 285 | 311 |
| Number of beneficiaries with a new RDSP opened in the calendar year (in thousands) | 19 | 17 | 15 | 27 | 23 | 23 | 31 |
| Number of beneficiaries with an RDSP closed in the calendar year (in thousands) | 3 | 3 | 2 | 2 | 2 | 3 | 5 |
- Note: K represents 1,000.
The number of RDSP beneficiaries varies across Canada (Figure 4). Ontario had the highest number, followed by British Columbia, Quebec, and Alberta, while the territories had the fewest.
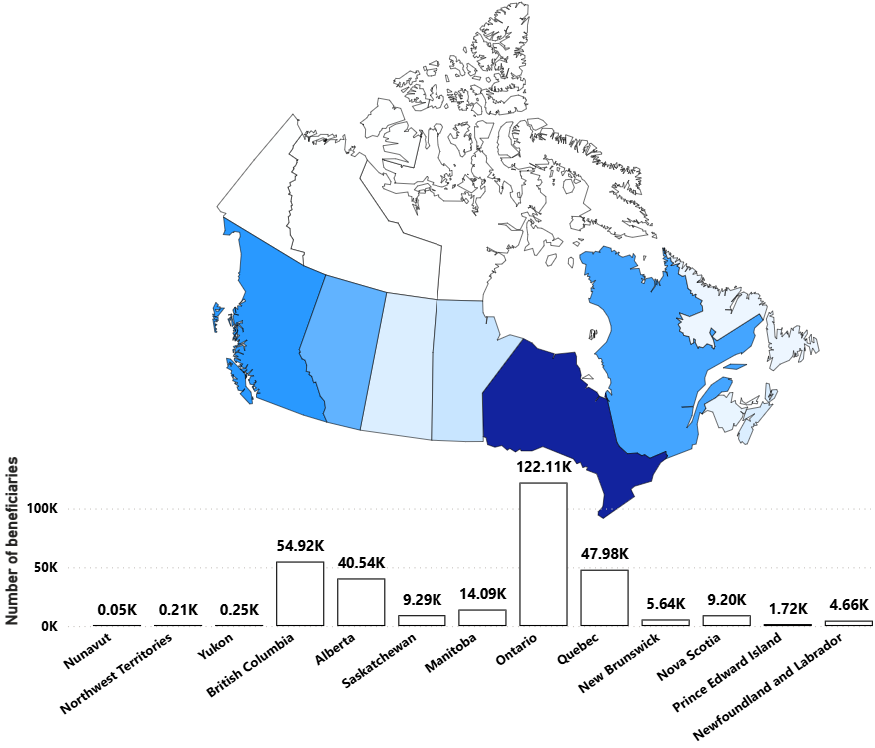
Text description – Figure 4
| Province or territory of residence | RDSP beneficiaries (in thousands), 2024 |
|---|---|
| Newfoundland and Labrador | 4.66 |
| Prince Edward Island | 1.72 |
| Nova Scotia | 9.20 |
| New Brunswick | 5.64 |
| Quebec | 47.98 |
| Ontario | 122.11 |
| Manitoba | 14.09 |
| Saskatchewan | 9.29 |
| Alberta | 40.54 |
| British Columbia | 54.92 |
| Yukon | 0.25 |
| Northwest Territories | 0.21 |
| Nunavut | 0.05 |
- Note: K represents 1,000. The color shading on the map is for illustrative purposes. Darker colors indicate higher numbers of beneficiaries but are not scaled precisely to the data. The map complements the bar chart.
The age pyramid of RDSP beneficiaries by gender (Figure 5, left panel) shows that younger age groups are larger and with male+ making up a noticeably larger share, reflecting trends seen in the DTC populationFootnote 6.
The majority of adult beneficiaries (aged 19+) are concentrated in Level 1, the lowest income category (Figure 5, right panel). In contrast, beneficiaries aged 0 to 18 have reported higher income, as family income for this group is based on their parents' or guardians' income.
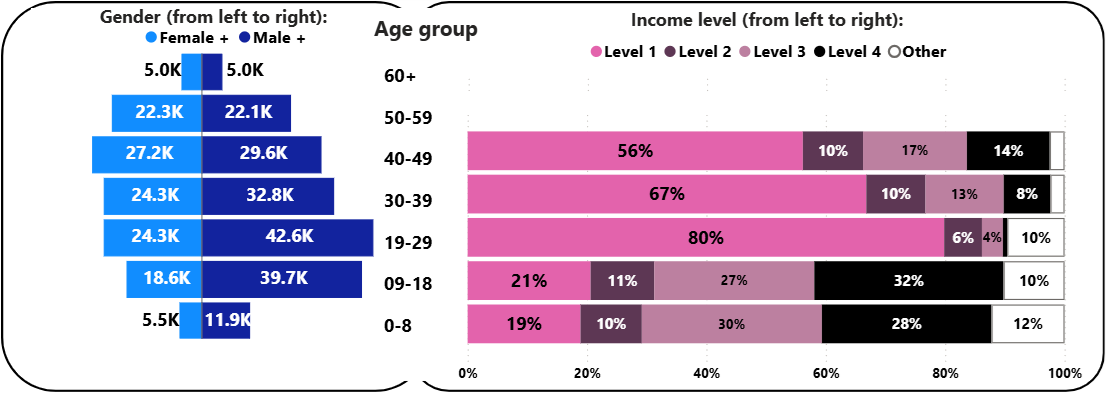
Text description - Figure 5
| Age group | Number of RDSP beneficiaries (in thousands), Female+ | Number of RDSP beneficiaries (in thousands), Male+ |
|---|---|---|
| 60 and over | 5.0 | 5.0 |
| 50 to 59 | 22.3 | 22.1 |
| 40 to 49 | 27.2 | 29.6 |
| 30 to 39 | 24.3 | 32.8 |
| 19 to 29 | 24.3 | 42.6 |
| 9 to 18 | 18.6 | 39.7 |
| 0 to 8 | 5.5 | 11.9 |
| Age group | Level 1 (%) | Level 2 (%) | Level 3 (%) | Level 4 (%) | Other (%) |
|---|---|---|---|---|---|
| 40 to 49 | 56 | 10 | 17 | 14 | 3 |
| 30 to 39 | 67 | 10 | 13 | 8 | 2 |
| 19 to 29 | 80 | 6 | 4 | 1 | 10 |
| 9 to 18 | 21 | 11 | 27 | 32 | 10 |
| 0 to 8 | 19 | 10 | 30 | 28 | 12 |
- Note: K represents 1,000. Totals may not add up due to rounding. Some numbers are too small to be shown in the visual, which can be found in the text description of this figure from the Web version report.
Looking at the age groups of individuals with RDSPs, young beneficiaries aged 0 to 18 represent almost a quarter of the total RDSP population, and the proportions of other age groups gradually reduce with age (Figure 6, left panel). In terms of income, over half (53%) of the beneficiaries are at the lowest income level (Level 1) (Figure 6, right panel).
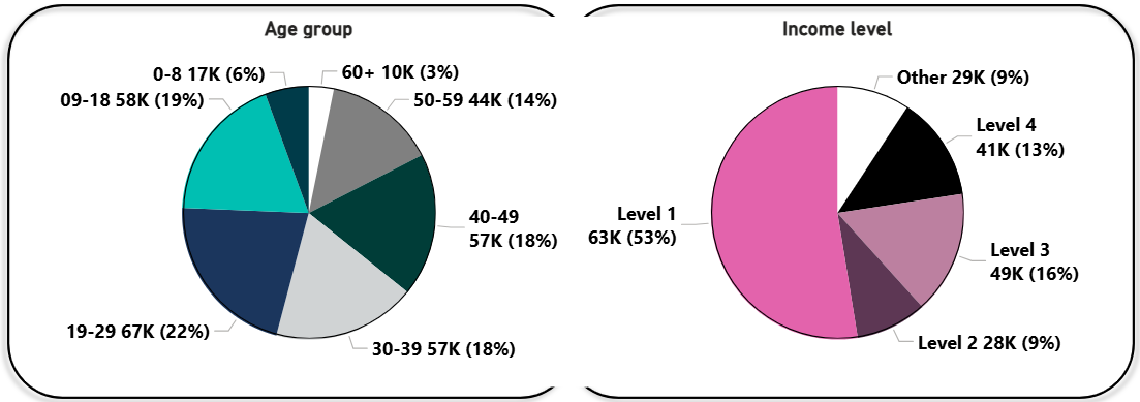
Text description - Figure 6
| Age groups | Number of RDSP beneficiaries (in thousands) | Percentage of RDSP beneficiaries (%) |
|---|---|---|
| 60 and over | 10 | 3 |
| 50 to 59 | 44 | 14 |
| 40 to 49 | 57 | 18 |
| 30 to 39 | 57 | 18 |
| 19 to 29 | 67 | 22 |
| 09-18 | 58 | 19 |
| 0 to 8 | 17 | 6 |
| Income level | Number of RDSP beneficiaries (in thousands) | Percentage of RDSP beneficiaries (%) |
|---|---|---|
| Level 1 | 63 | 53 |
| Level 2 | 28 | 9 |
| Level 3 | 49 | 16 |
| Level 4 | 41 | 13 |
| Other | 29 | 9 |
- Note: K represents 1,000. Totals may not add up due to rounding.
Historically, most new beneficiaries have reported family income from the lowest income level (Level 1). However, their share has dropped from 53% in 2018 to 41% in 2024 (Figure 8). This decline is mainly due to the growing share of young beneficiaries (aged 0 to 18) joining the program (Figure 7), whose income is based on their parents’ or guardians’ income, which is often higher (Figure 5).
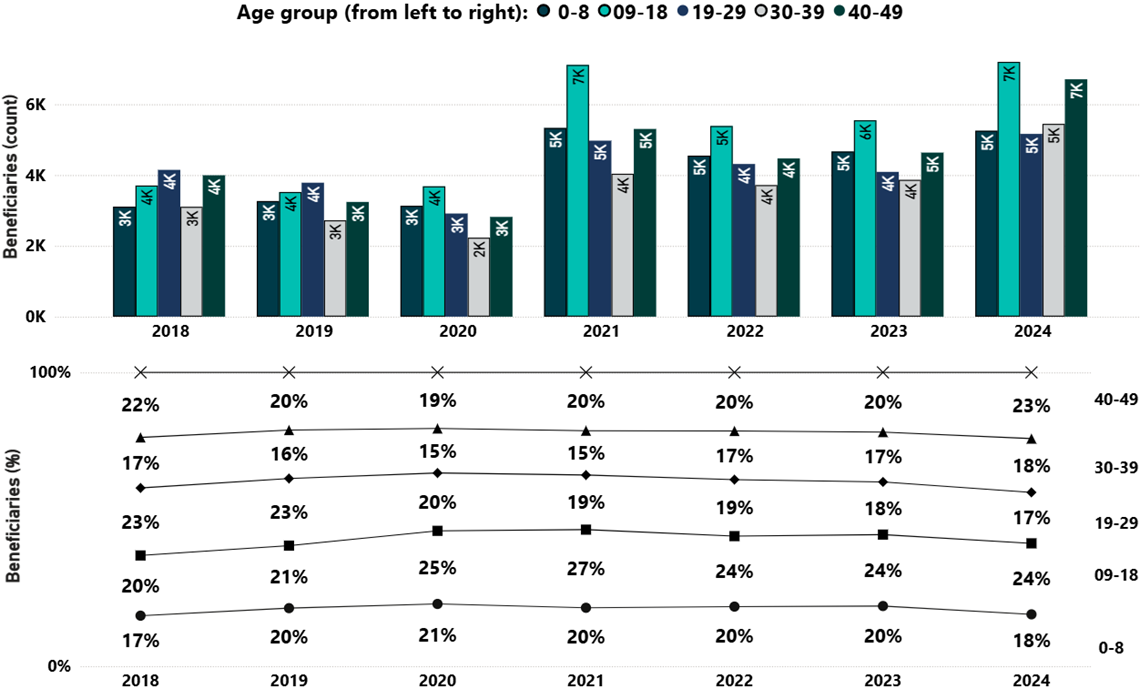
Text description - Figure 7
| Description | Age 0 to 8 | Age 09 to 18 | Age 19 to 29 | Age 30 to 39 | Age 40 to 49 |
|---|---|---|---|---|---|
| Number (in thousands) of new beneficiaries, 2018 | 3.1 | 3.7 | 4.1 | 3.1 | 4.0 |
| Number (in thousands) of new beneficiaries, 2019 | 3.3 | 3.5 | 3.8 | 2.7 | 3.2 |
| Number (in thousands) of new beneficiaries, 2020 | 3.1 | 3.7 | 2.9 | 2.2 | 2.8 |
| Number (in thousands) of new beneficiaries, 2021 | 5.3 | 7.1 | 5.0 | 4.0 | 5.3 |
| Number (in thousands) of new beneficiaries, 2022 | 4.5 | 5.4 | 4.3 | 3.7 | 4.5 |
| Number (in thousands) of new beneficiaries, 2023 | 4.7 | 5.5 | 4.1 | 3.9 | 4.6 |
| Number (in thousands) of new beneficiaries, 2024 | 5.3 | 7.2 | 5.2 | 5.4 | 6.7 |
| Percentage (%) of new beneficiaries, 2018 | 17 | 20 | 23 | 17 | 22 |
| Percentage (%) of new beneficiaries, 2019 | 20 | 21 | 23 | 16 | 20 |
| Percentage (%) of new beneficiaries, 2020 | 21 | 25 | 20 | 15 | 19 |
| Percentage (%) of new beneficiaries, 2021 | 20 | 27 | 19 | 15 | 20 |
| Percentage (%) of new beneficiaries, 2022 | 20 | 24 | 19 | 17 | 20 |
| Percentage (%) of new beneficiaries, 2023 | 20 | 24 | 18 | 17 | 20 |
| Percentage (%) of new beneficiaries, 2024 | 18 | 24 | 17 | 18 | 23 |
- Note: K represents 1,000. Totals may not add up due to rounding.
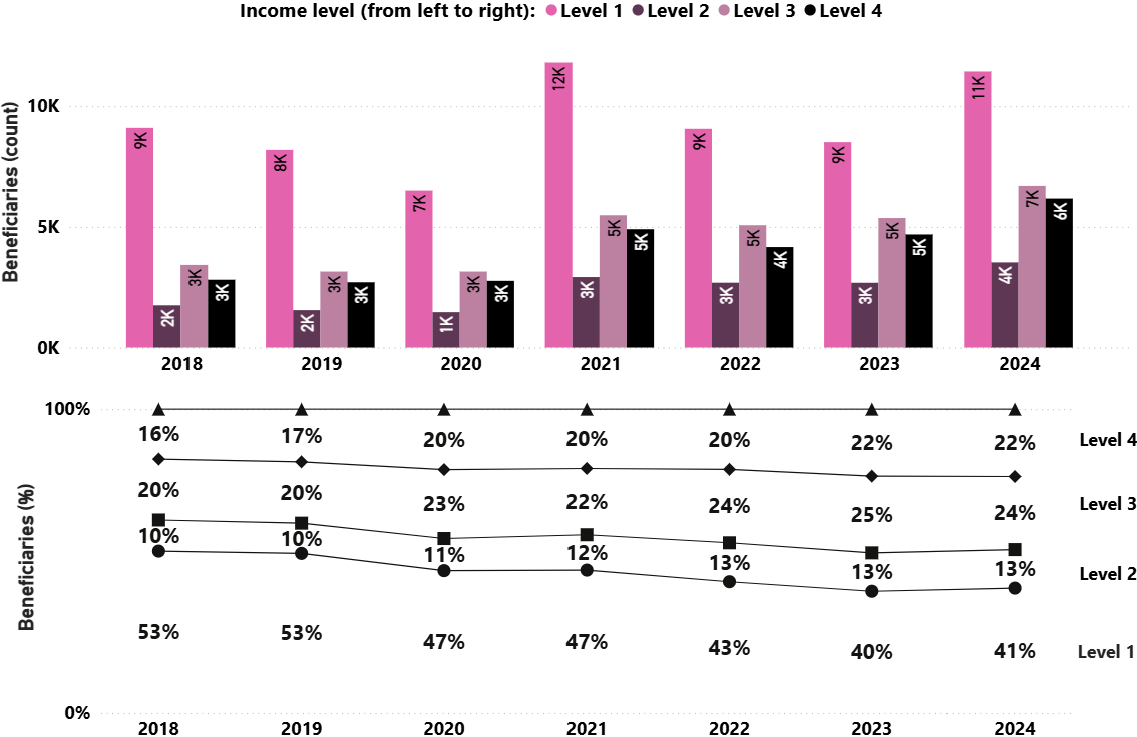
Text description
| Description | Level 1 | Level 2 | Level 3 | Level 4 |
|---|---|---|---|---|
| Number (in thousands) of new beneficiaries, 2018 | 9.1 | 1.8 | 3.4 | 2.8 |
| Number (in thousands) of new beneficiaries, 2019 | 8.2 | 1.6 | 3.1 | 2.7 |
| Number (in thousands) of new beneficiaries, 2020 | 6.5 | 1.5 | 3.1 | 2.8 |
| Number (in thousands) of new beneficiaries, 2021 | 11.8 | 2.9 | 5.5 | 4.9 |
| Number (in thousands) of new beneficiaries, 2022 | 9.1 | 2.7 | 5.1 | 4.2 |
| Number (in thousands) of new beneficiaries, 2023 | 8.5 | 2.7 | 5.4 | 4.7 |
| Number (in thousands) of new beneficiaries, 2024 | 11.4 | 3.5 | 6.7 | 6.2 |
| Percentage (%) of new beneficiaries, 2018 | 53 | 10 | 20 | 16 |
| Percentage (%) of new beneficiaries, 2019 | 53 | 10 | 20 | 17 |
| Percentage (%) of new beneficiaries, 2020 | 47 | 11 | 23 | 20 |
| Percentage (%) of new beneficiaries, 2021 | 47 | 12 | 22 | 20 |
| Percentage (%) of new beneficiaries, 2022 | 43 | 13 | 24 | 20 |
| Percentage (%) of new beneficiaries, 2023 | 40 | 13 | 25 | 22 |
| Percentage (%) of new beneficiaries, 2024 | 41 | 13 | 24 | 22 |
- Note: K represents 1,000. Totals may not add up due to rounding.
RDSP financial information
The cumulative value of contributions, CDSBs, CDSGs, withdrawals, and repayments has grown steadily since the program began. By 2024, the Government of Canada has contributed $5.1 billion in grants and $2.1 billion in bonds, while private contributions have totaled over $3.3 billion. Beneficiaries have made $0.4 billion in withdrawals and $0.3 billion in repayments. The fair market value (FMV) of total RDSP assets show steady growth, with a notable slowdown between 2021 and 2023 during the pandemic, climbing again in 2024. Along with $3.0 billion in investment earnings, total RDSP assets reached a new high of $12.8 billion (Figure 9).
From 2018 to 2024, the annual contributions, CDSBs, and CDSGs, increased with a brief rise in 2021 (Figure 9 and Figure 10). Withdrawals have steadily increased while remaining low.
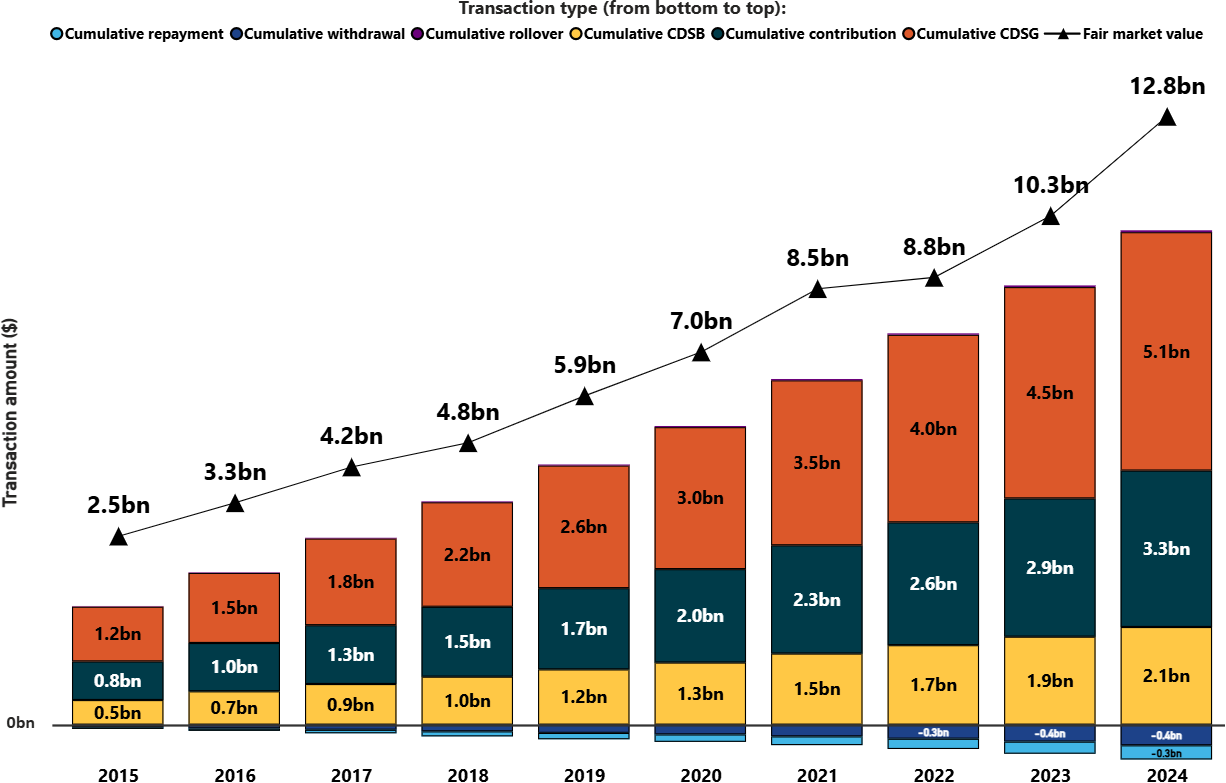
Text description – Figure 9
| Year | Cumulative CDSG ($ in billions) | Cumulative contribution ($ in billions) | Cumulative CDSB ($ in billions) | Cumulative rollover ($ in billions) | Cumulative withdrawal ($ in billions) | Cumulative repayment ($ in billions) | Fair market value ($ in billions) |
|---|---|---|---|---|---|---|---|
| 2015 | 1.16 | 0.82 | 0.52 | 0.01 | -0.06 | -0.04 | 2.48 |
| 2016 | 1.49 | 1.03 | 0.71 | 0.01 | -0.08 | -0.05 | 3.30 |
| 2017 | 1.84 | 1.25 | 0.87 | 0.01 | -0.11 | -0.08 | 4.18 |
| 2018 | 2.22 | 1.49 | 1.02 | 0.02 | -0.14 | -0.11 | 4.77 |
| 2019 | 2.61 | 1.73 | 1.18 | 0.02 | -0.17 | -0.14 | 5.92 |
| 2020 | 3.02 | 1.99 | 1.32 | 0.02 | -0.21 | -0.16 | 7.00 |
| 2021 | 3.51 | 2.30 | 1.51 | 0.03 | -0.25 | -0.19 | 8.55 |
| 2022 | 3.99 | 2.61 | 1.69 | 0.03 | -0.30 | -0.22 | 8.83 |
| 2023 | 4.50 | 2.94 | 1.87 | 0.03 | -0.36 | -0.26 | 10.34 |
| 2024 | 5.07 | 3.33 | 2.08 | 0.04 | -0.44 | -0.30 | 12.78 |
- Note: bn represents 1,000,000,000. Financial transactions for withdrawal and repayment are indicated as negative values. Some rollovers, withdrawal, and repayment amounts are too small to appear in the visual but are included in the figure’s text description.
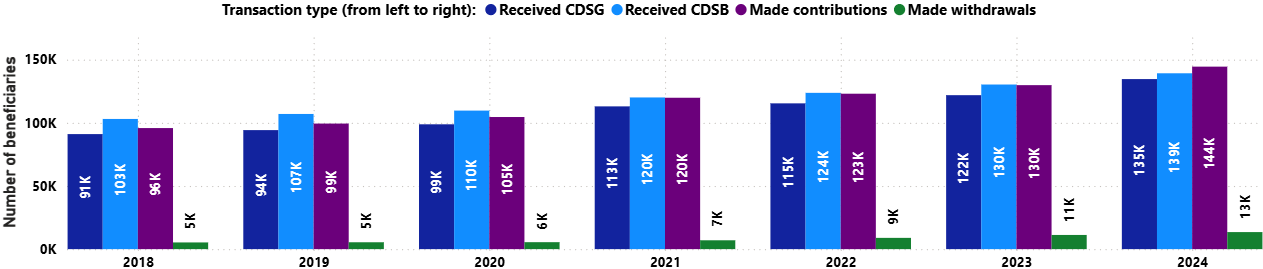
Text description – Figure 10
| Description | 2018 | 2019 | 2020 | 2021 | 2022 | 2023 | 2024 |
|---|---|---|---|---|---|---|---|
| Number of beneficiaries who received CDSG (in thousands) | 91 | 94 | 99 | 113 | 115 | 122 | 135 |
| Number of beneficiaries who received CDSB (in thousands) | 103 | 107 | 110 | 120 | 124 | 130 | 139 |
| Number of beneficiaries who made contributions (in thousands) | 96 | 99 | 105 | 120 | 123 | 130 | 144 |
| Number of beneficiaries who made withdrawals (in thousands) | 5 | 5 | 6 | 7 | 9 | 11 | 13 |
- Note: K represents 1,000.
In focus: an early insight into withdrawal trends and savings growth
The RDSP was launched in 2008, and the program is still maturing. Most beneficiaries haven't yet reached the age or conditions required for withdrawals, and many plans have only been open for a few years. This means most beneficiaries have only used a small part of the program's benefits. While it is too early to fully assess the program's impact or withdrawal outcomes, an early look reveals some interesting trends.
This preliminary analysis explores withdrawal patterns, and the profiles and financial behaviours of beneficiaries making withdrawals. By drilling through the small cohort of beneficiaries turning 60 who made a withdrawal in 2024, this snapshot sheds light on how RDSPs are evolving as long-term savings vehicle.
Overview of withdrawal rules
There are two types of withdrawals that can be made from an RDSP:
- Disability Assistance Payment (DAP): an ad hoc, lump-sum payment made to the beneficiary or their estate
- Lifetime Disability Assistance Payment (LDAP): an LDAP is part of a series of payments that, once started, must be made at least once a year until the beneficiary passes away, the funds are exhausted, or the plan is terminated
Withdrawals include a portion of contributions, grants, bonds, and earnings - as applicable -proportional to their share in the plan. DAPs and LDAPs can begin at any time, but LDAPs must start no later than December 31 of the year the beneficiary turns 60.
If the plan has more CDSG and CDSB than private contributions before the beginning of the calendar year, the maximum withdrawal amount permitted in that particular year is the greater of 10% of the RDSP's fair market value at the end of the previous calendar year or the amount as determined by the formula in the Income Tax Act (146.4(4)(l)). This formula prescribes equal withdrawal payments up to age 80, and declining payments afterwards. Where private contributions are equal or greater than Government of Canada grants and bonds before the beginning of a year, there is no withdrawal limit for that particular year.
Money can be withdrawn from an RDSP at any age, but rules apply. As the RDSP is meant for long-term savings, early withdrawals face penalties. If fewer than 10 years have elapsed since the last grant or bond was paid, up to $3 of grant and/or bond for every $1 withdrawn must be repaid to the Government of Canada, up to the total amount of grant and bond paid in the last 10 years.
RDSP withdrawal patterns
In 2024, 13,500 beneficiaries made withdrawals for a total of $78 million, most of those (65% or 8,800 beneficiaries) were aged 60 and over (Figure 11). The 60+ group accounted for the largest share of withdrawals ($29 million or 37%). The 50 to 59 age group also represented a significant portion, withdrawing $21 million (27%). These two groups combine for nearly two thirds of total withdrawals in 2024.
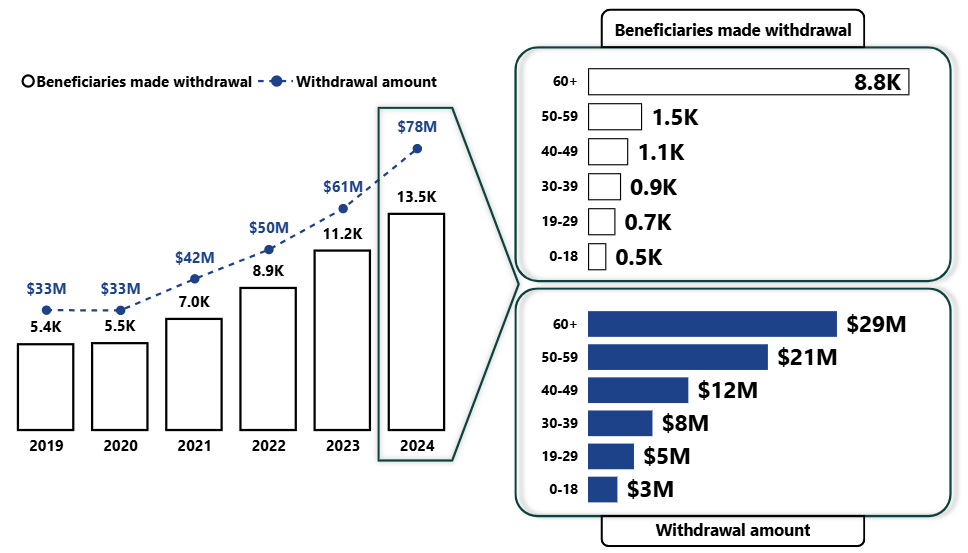
Text description – Figure 11
| Description | 2019 | 2020 | 2021 | 2022 | 2023 | 2024 |
|---|---|---|---|---|---|---|
| Number of beneficiaries made withdrawal (in thousands) | 5.4 | 5.5 | 7.0 | 8.9 | 11.2 | 13.5 |
| Amount of withdrawal ($ in millions) | 33 | 33 | 42 | 50 | 61 | 78 |
| Age group | Number (in thousands) of beneficiaries made withdrawal in 2024 |
|---|---|
| 60 and over | 8.8 |
| 50 to 59 | 1.5 |
| 40 to 49 | 1.1 |
| 30 to 39 | 0.9 |
| 19 to 29 | 0.7 |
| 0 to 18 | 0.5 |
| Age group | Amount ($ in millions) of withdrawal in 2024 |
|---|---|
| 60 and over | 29 |
| 50 to 59 | 21 |
| 40 to 49 | 12 |
| 30 to 39 | 8 |
| 19 to 29 | 5 |
| 0 to 18 | 3 |
- Note: K represents 1,000. M represents 1,000,000.
RDSP beneficiaries turning 60 in 2024
The number of beneficiaries turning 60 and drawing from their RDSP keeps rising, reaching about 2,100 persons in 2024 (Figure 12, left panel). For individuals turning 60 and withdrawing money in a given year:
- The average RDSP value at age 60 grew from $23,000 in 2019 to $40,000 in 2024
- The average annual withdrawal at age 60 increased from $2,000 to $4,000 over the same period
With a focus on the cohort of beneficiaries turning 60 and drawing from RDSP in 2024 (Figure 12, right panel):
- 40% hold less than $20,000 in their RDSP
- 51% hold between $20,000 and $79,999 in their RDSP
- 9% hold more than $80,000 in their RDSP
Together, this cohort holds $86.5M in RDSP assets at the beginning of 2024, made up of:
- 42% private contributions (including rollovers)
- 31% government grants and bonds (CDSG and CDSB)
- 27% earnings
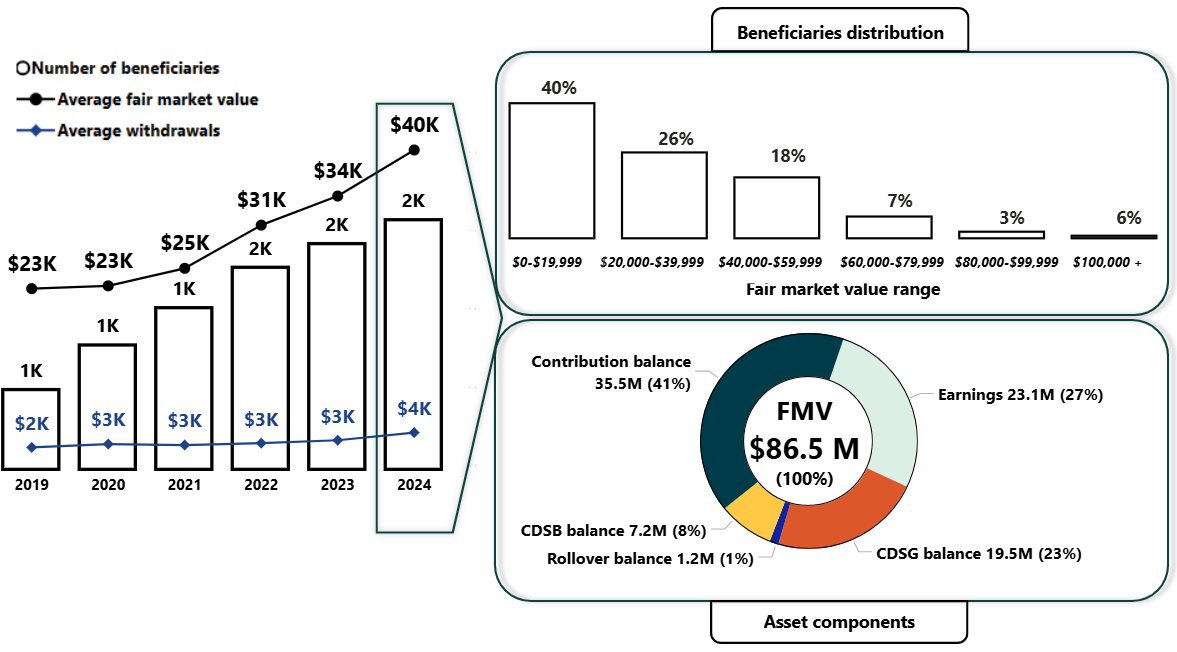
Text description – Figure 12
| Description | 2019 | 2020 | 2021 | 2022 | 2023 | 2024 |
|---|---|---|---|---|---|---|
| Number of beneficiaries turning 60 and drawing from RDSP in the year (in thousands) | 0.70 | 1.07 | 1.38 | 1.72 | 1.92 | 2.12 |
| Average fair market value of the RDSPs from beneficiaries turning 60 in the year ($ in thousands) | 23 | 23 | 25 | 31 | 34 | 40 |
| Average withdrawals of the beneficiaries turning 60 in the year ($ in thousands) | 2 | 3 | 3 | 3 | 3 | 4 |
| Fair market value range | The percentage (%) of beneficiaries turning 60 in 2024 |
|---|---|
| 0 to 19,999 | 40 |
| 20,000 to 39,999 | 26 |
| 40,000 to 59,999 | 18 |
| 60,000 to 79,999 | 7 |
| 80,000 to 99,999 | 3 |
| 100,000 + | 6 |
| RDSP asset components of the cohort | The amount ($ in millions) | The proportion (%) |
|---|---|---|
| CDSB balance | 7.2 | 8 |
| CDSG balance | 19.5 | 23 |
| Contribution balance | 35.5 | 41 |
| Rollover balance | 1.2 | 1 |
| Earnings | 23.1 | 27 |
| FMV | 86.5 | 100 |
- Note: K represents 1,000. M represents 1,000,000. The definition of “Canada Disability Savings Grant (CDSG) balance”, “Canada Disability Savings Bond (CDSB) balance”, “contribution balance”, “rollover balance”, and “earnings” can be found in section “Definitions and glossary”.
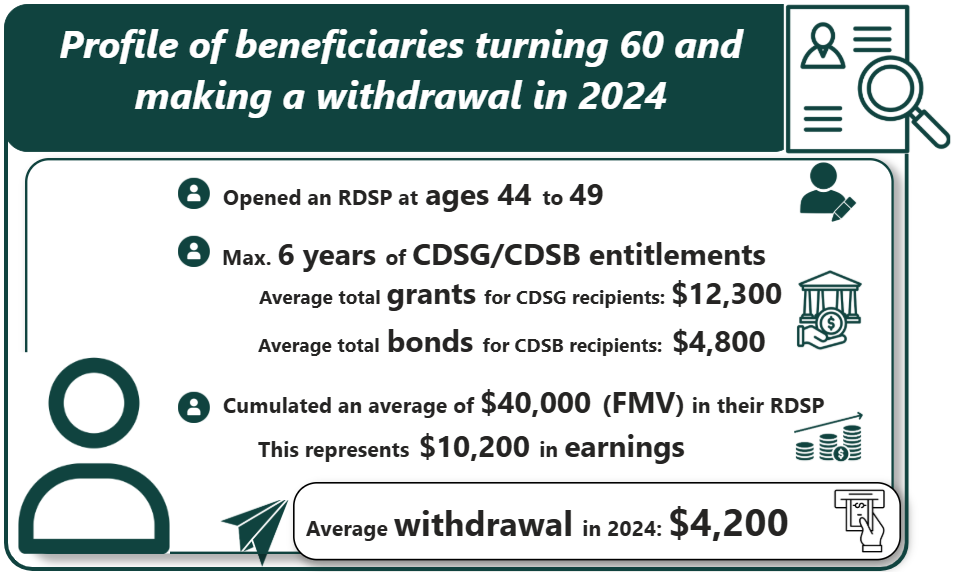
Text description – Figure 13
Beneficiaries in this cohort opened their RDSPs between 2008 and 2013, when they were 44 to 49 years old. They could only receive up to 6 years of CDSG and/or CDSB.
By the time they turn 60 in 2024, the average beneficiary has built up:
- $12,300 in grants (CDSG)
- $4,800 in bonds (CDSB)
Their RDSP is worth $40,000 on average, including $10,200 in investment growth (earnings). In 2024, they begin withdrawals, averaging $4,200.
- Note: Average is calculated only on individuals who had the transactions.
RDSP assets growth over time
The RDSP assets of beneficiaries turning 60 in 2024 (the cohort) were built up over a very limited time (Figure 14). There is a noticeable increase in grants and bonds received, as well as a peak in private contributions in 2013, as beneficiaries approach age 50. This is likely due to individuals trying to catch up on unused entitlements before losing access to grants and bonds after December 31 of the year the beneficiary turns 49. After that, members of this cohort have massively increased their private contributions until age 60. This may be driven by a tax deferral strategy or convert a plan into one that has as much or more private contributions than CDSG and CDSB before the beginning of the calendar year to gain flexibility with withdrawals. Then, withdrawals began to increase notably from age 58 onward and start surging at age 60, the age at which withdrawal must begin.
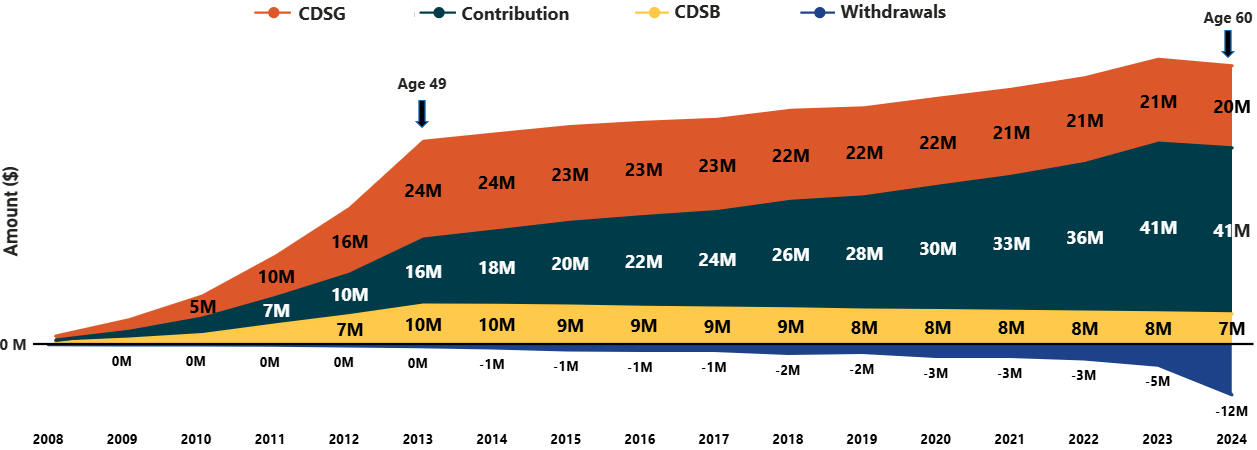
Text description – Figure 14
| Year | Amount ($ in millions) of CDSG received by beneficiaries turning 60 in 2024 | Amount ($ in millions) of CDSB received by beneficiaries turning 60 in 2024 | Amount ($ in millions) of contribution by beneficiaries turning 60 in 2024 | Amount ($ in millions) of withdrawal by beneficiaries turning 60 in 2024 |
|---|---|---|---|---|
| 2008 | 1.0 | 0.5 | 0.5 | 0.0 |
| 2009 | 2.8 | 1.3 | 1.9 | 0.0 |
| 2010 | 5.4 | 2.4 | 4.1 | 0.1 |
| 2011 | 10.1 | 4.8 | 6.7 | 0.1 |
| 2012 | 16.1 | 7.0 | 10.1 | 0.3 |
| 2013 | 23.9 | 9.6 | 16.1 | 0.5 |
| 2014 | 23.7 | 9.5 | 18.2 | 0.8 |
| 2015 | 23.4 | 9.4 | 20.5 | 1.3 |
| 2016 | 23.0 | 9.1 | 22.2 | 1.4 |
| 2017 | 22.6 | 8.8 | 23.6 | 1.4 |
| 2018 | 22.3 | 8.7 | 26.3 | 2.1 |
| 2019 | 21.7 | 8.4 | 27.7 | 1.9 |
| 2020 | 21.5 | 8.2 | 30.4 | 2.8 |
| 2021 | 21.3 | 8.0 | 33.0 | 2.9 |
| 2022 | 20.9 | 7.9 | 36.3 | 3.5 |
| 2023 | 20.5 | 7.7 | 41.5 | 5.0 |
| 2024 | 20.1 | 7.4 | 40.6 | 12.2 |
- Note: M represents 1,000,000. Some of the numbers are too small to be shown in the visual, which can be found in the text description of this figure. Declines in grant and bond amounts are a result of withdrawals. Withdrawal payments (indicated as negative value) include a proportion of contributions (including rollovers, if applicable), grant amounts, bond amounts and interest earned on investments.
Looking ahead
Early results show that beneficiaries have been able to leverage the program to build savings, despite only having a very limited number of years to do so. As the program matures, the CDSP team will continue monitoring and reporting on withdrawal patterns.
This snapshot of beneficiaries turning 60 and making withdrawals in 2024 provides an early view of what future beneficiaries may experience. Even with only up to 6 years of grants and bonds, and up to 16 years to contribute, this group has accumulated an average of $40,000 in their RDSP by age 60. In average, this represents an ongoing $1,750 a year in LDAP for the next 20 years, or up to a maximum of $4,000 (10% of FMV) in 2024 if coupled with a DAP. Beneficiaries who have accumulated as much or more private contributions than the amount of grants and bonds they received have even more flexibility, since they are not limited by the 10% withdrawal cap.
Future beneficiaries will have many more years of eligibility-with 20 years or more of eligibility, they could receive up to $20,000 in bonds and $70,000 in grants. Additionally, with more time to grow, their savings at age 60 are expected to be significantly higher, allowing them to receive greater payments out of their RDSP.
Program outreach activities
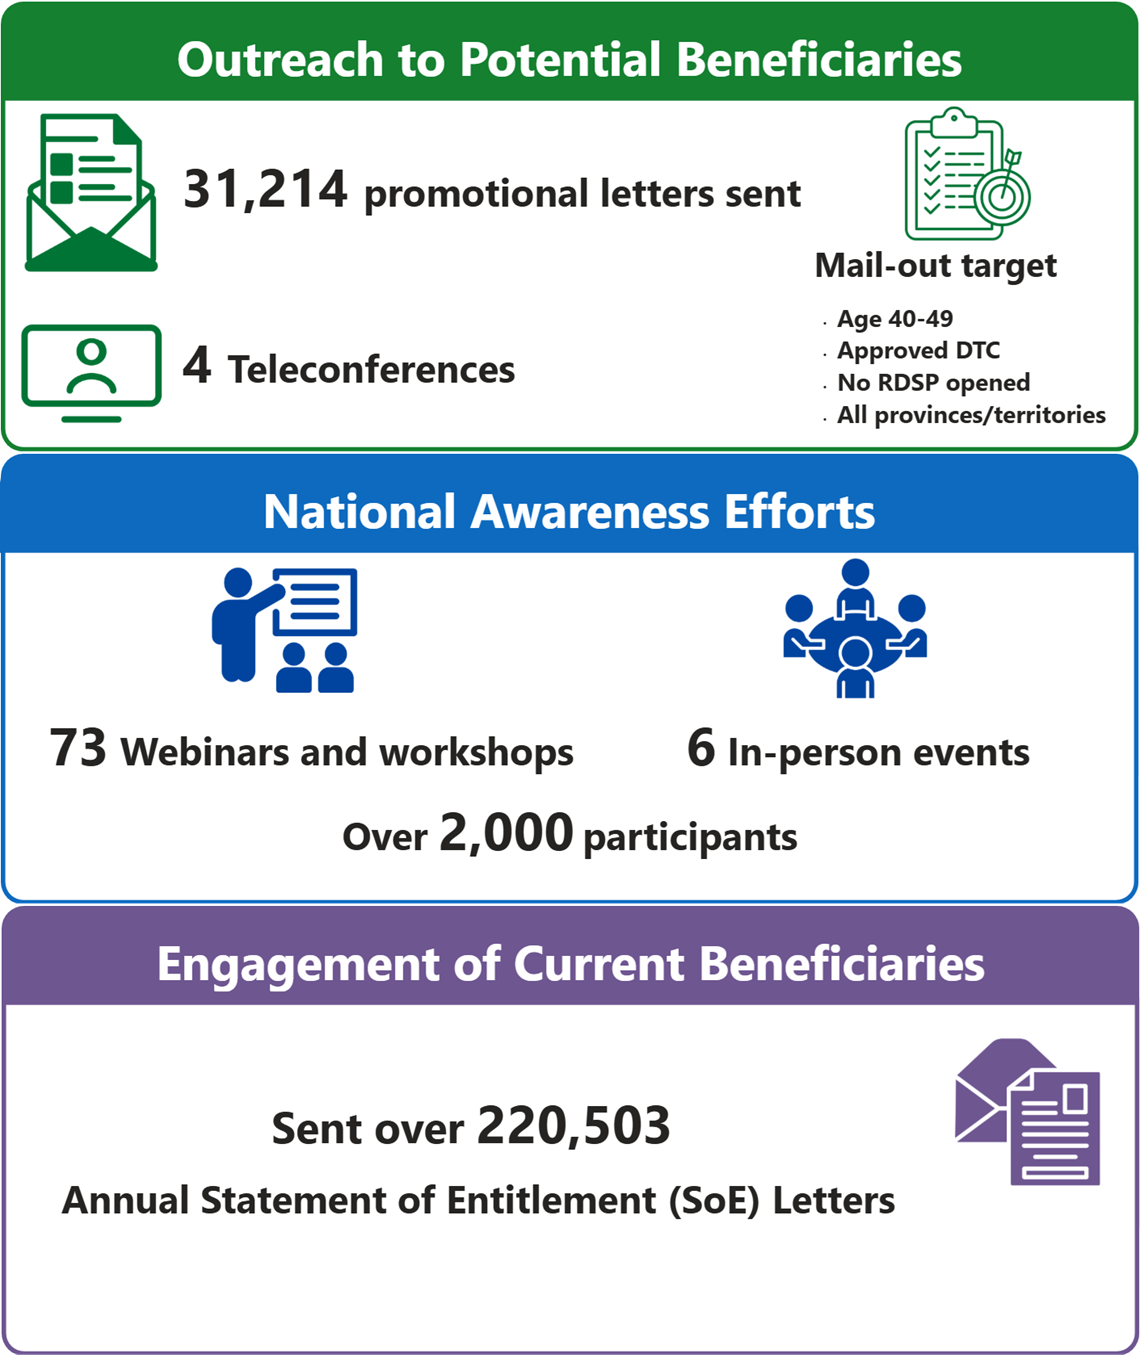
Text description – Figure 15
In 2024-2025, the program engaged potential beneficiaries of the RDSP through a mail-out strategy that targeted individuals aged 40-49 with an approved DTC in all provinces and territories, who had not yet opened an RDSP. In collaboration with CRA, 31,214 promotional letters were sent and then supported by a series of four teleconferences that were hosted by the outreach team to allow letter recipients to learn more about the CDSP.
The CDSP, in partnership with the CRA, Service Canada and disability-related stakeholder organizations across Canada, hosted 73 webinars and workshops to provide information, raise awareness and foster an understanding about the RDSP, and the CDSG and CDSB. Approximately 2330 participants were engaged through these webinars, and 90% of these sessions were given in partnership with CRA and were a joint presentation about DTC, RDSP and the CDSG and CDSB. The team also engaged with persons with disabilities, their families and community-based stakeholders at six in-person events.
In addition, the program continued to engage current beneficiaries through its annual Statement of Entitlement (SoE) letters. The letters are sent to plan holders highlighting the grant entitlements available to them and the amount of contributions that would be required to maximize their grants over the specified year. The program sent 220,503 SoE letters in February 2024.
Definitions and glossary
Beneficiary's family income: Until December 31 of the year the beneficiary turns 18, the beneficiary's family income is calculated using the combined income of their parents or guardians and is based on the family income information used to determine the Canada Child Benefit. Beginning the year the beneficiary turns 19 until the RDSP is closed, family income is based on the beneficiary's income plus that of their spouse or common-law partner. Where an allowance under the Children's Special Allowances Act is payable for at least one month in respect of a child in the care of a department, agency, or institution, they are entitled to the maximum amount of grant and bond for that year. Grants and bonds entitlements are based on the family income reported on tax returns from two years before the reference year.
Canada Disability Savings Bond (CDSB): Referred to as "bond" in this report, CDSB is government funding for low to modest income individuals with disabilities. The bond is available until December 31 of the year the beneficiary turns 49, offering up to $1,000 per year, with a lifetime maximum of $20,000. CDSB amounts shown in this report have not been adjusted with amounts repaid.
Canada Disability Savings Bond (CDSB) balance: Total amount of CDSB in the RDSP, net of any amounts repaid or withdrawn.
Canada Disability Savings Grant (CDSG): Referred to as "grant" in this report, CDSG is government funding that matches private contributions to RDSPs. CDSG in this report has not been adjusted with amounts repaid. The grant can provide up to $3,500 annually, with a lifetime maximum of $70,000. The CDSG is only available for contributions made by December 31 of the year the beneficiary turns 49.
Canada Disability Savings Grant (CDSG) balance: Total amount of CDSG in the RDSP, net of any amounts repaid or withdrawn.
Contribution: Money contributed to an RDSP, by the beneficiary or by someone else with the approval of the plan holder. Contributions can be made to the RDSP until December 31 of the calendar year in which the beneficiary turns 59 years old. There are no annual contribution limits with a lifetime limit of $200,000.
Contribution balance: Total contributions made to the RDSP, net of any amounts withdrawn from the contribution portion and net of earnings.
Cumulative number of RDSP beneficiaries: This is the number of individuals who have had an RDSP at any time between program inception in 2008 and the reference date. This includes individuals who have since closed their RDSP. Each individual is counted only once, even if they have had multiple plans over the relevant period.
Disability tax credit (DTC): Administered by the CRA, the DTC is a non-refundable tax credit that helps people with disabilities or the family members that support them to reduce the amount of income tax they may have to pay. More details can be found: How to apply - Disability tax credit (DTC).
Earnings: The growth of the RDSP investment. It is calculated as the Fair Market Value (FMV) of the RDSP after accounting for money put in (total contributions, grants, bonds, and rollovers) and money taken out (withdrawals and repayments).
Number of beneficiaries with an active RDSP: This is the number of individuals who had an open RDSP on the reference date.
Number of beneficiaries with an active RDSP in the year: This is the number of people who had an active RDSP at any time during the calendar year. This includes those whose plans closed at some point in the year. Individuals are counted once in the annual number of RDSP beneficiaries.
Number of beneficiaries opening a new RDSP in the year: This is the number of people who have an RDSP that was registered during that calendar year. This does not include existing beneficiaries with RDSPs opened pursuant to a plan transfer.
Number of beneficiaries with an RDSP closed in the year: This is the number of people who have an RDSP that was closed during that calendar year. This does not include existing beneficiaries with RDSPs closed pursuant to a plan transfer.
RDSP assets: Represented by the Fair Market Value (FMV) at the end of the calendar year, total RDSP assets include all contributions, bonds, grants, rollovers, and earnings, less withdrawals, fees, and repayments.
Registered Disability Savings Plan (RDSP): The Registered Disability Savings Plan (RDSP) is a long-term savings plan to help people with disabilities who are approved for the Disability Tax Credit and their family save for the future. To open an RDSP at a participating financial institution, the beneficiary must (1) be a resident of Canada, (2) have a valid Social Insurance Number, (3) be eligible for the DTC, and (4) open the plan by December 31 of the calendar year in which the beneficiary turns 59 years old.
Repayment: Under certain circumstances, some grant and bond amounts must be repaid to the government. Information on repayments can be found: Registered Disability Savings Plan (RDSP).
Rollover: Funds that can be transferred tax-free from a Registered Retirement Savings Plan (RRSP) or Registered Education Savings Plan (RESP) into an RDSP under certain conditions. Details on rollovers can be found: Registered Disability Savings Plan (RDSP).
Rollover balance: The total amount transferred into the RDSP from RRSPs or RESPs, net of any amounts withdrawn from the rollover portion.
Annex
Annex 1: Data and methodology
A1.1 Data sources, contents, and data processing
The CDSP Annual Report is based on data from ESDC's CDSP administrative database, which includes information on RDSP registration, beneficiaries and plan holders, CDSG/CDSB entitlements, and financial transactions involving RDSPs. ESDC processes the data in collaboration with CRA and financial institutions. The data in this report was processed in June 2024, covering historical statistics up to December 2024. Due to retroactive updates, historical statistics may differ from earlier published statistics. The RDSP take-up rate is calculated using DTC data shared by CRA.
A1.2 Confidentiality procedures
To protect personal information, data is aggregated and de-identified, and follows suppression rules per the Treasury Board of Canada's Privacy Implementation Notice 2020-03. Due to rounding, some numbers and percentages may not add exactly to the totals or 100%.
A1.3 Major classification variables
- Geography: indicates the beneficiary's province or territory of residence as of December 31. The Territories (Yukon, Northwest Territories, Nunavut) and Atlantic (Newfoundland and Labrador, Prince Edward Island, Nova Scotia) are grouped collectively as a single entry when necessary. Some charts may exclude beneficiaries residing outside of Canada.
- Age group: defines which of the age categories a beneficiary belongs to. Age is calculated on December 31 of a particular year.
- GenderFootnote 7: reflects the beneficiary's reported gender (female, male, another gender, or not provided). Given the small number of individuals who either declined to report a gender or reported "another gender", gender data is grouped into two categories for confidentiality:
- Male+ includes individuals who identified as male, and a proportional number of individuals that did not identify as either male or female randomly assigned to this group
- Female+ includes individuals who identified as female, and a proportional number of individuals that did not identify as either male or female randomly assigned to this group
- Income group: classifies a beneficiary's income level (as defined in Table 1) into categories:
- Low to modest income includes income levels 1 and 2
- High income includes income level 3 and 4
- No income data includes "No Income Found", "No Match" and "Null"
A1.4 RDSP take-up rate calculation
The annual RDSP take-up rate is calculated by dividing the number of active RDSP beneficiaries by the number of DTC-approved individuals in that age group for a given year:
The take-up rates are static as of the calculation date and do not include retroactive updates. In 2022, changes were made to the methodology for calculating the RDSP take-up rate (refer to Annex 2 in CDSP 2023 Annual Report for details). Therefore, comparisons with previously reported results should be made with caution.
Annex 2: Additional CDSP statistics
Table 4 presents the breakdown of the national annual RDSP take-up rate by age group and gender from 2022 to 2024.
| Year | Age group | Take-up rate (%), Female+ | Take-up rate (%), Male+ |
|---|---|---|---|
| 2022 | 0 to 18 | 24 | 24 |
| 2022 | 19 to 34 | 45 | 49 |
| 2022 | 35 to 49 | 43 | 48 |
| 2023 | 0 to 18 | 24 | 24 |
| 2023 | 19 to 34 | 42 | 45 |
| 2023 | 35 to 49 | 42 | 47 |
| 2024 | 0 to 18 | 23 | 23 |
| 2024 | 19 to 34 | 40 | 45 |
| 2024 | 35 to 49 | 41 | 46 |
Beginning with the 2023 Annual Report, CDSP statistics started being published annually on the Open Government Portal. The release includes four data tables:
- Table 1: Annual Registered Disability Savings Plan (RDSP) take-up rate by year, age group, gender, and geography, 2022 to 2024
- Table 2: Annual Registered Disability Savings Plan (RDSP) beneficiaries by year, age group, gender, and geography, 2015 to 2024
- Table 3: Annual Canada Disability Savings Program (CDSP) financial details by year, age group, gender, geography, and transaction types, 2015 to 2024
- Table 4: Annual Registered Disability Savings Plan (RDSP) total assets (fair market value) by year, age group, gender, and geography, 2015 to 2024