Disability in Canada: A 2006 Profile presents some key statistical findings on persons with disabilities in an accessible, plain language document. Profile 2006 is intended as a resource tool to assist anyone interested in disability issues by presenting a national picture of disability in Canada.
Section 1: Introduction
Concept of disability and survey methodology
The UN Convention on the Rights of Persons with Disabilities uses the following definition for people with disabilities:
"Persons with disabilities include those who have long-term physical, mental, intellectual or sensory impairments which in interaction with various barriers may hinder their full and effective participation in society on an equal basis with others."
In 2006, the second cycle of Canada's national survey of people with disabilities—the Participation and Activity Limitation Survey (PALS)—was conducted. Information was gathered on children aged 14 and under through interviews with parents or guardians, using a children's questionnaire. A different questionnaire was used to interview youth and adults aged 15 and over.
Under the terminology used by the survey, people with disabilities are those who reported difficulties with daily living activities, or who indicated that a physical or mental health condition or health problem reduced the kind or amount of activities they could do.
It is important to note that the respondents' answers represent their perceptions of their situations (or in the case of children under 15, their parent or guardian's perception) and are therefore subjective; many factors may affect an individual's perception of the severity of disability and the limitations it places on participation and activity.
Structure of this report
This report is organized using a life-cycle approach, beginning with a brief overview of national statistics, and then presenting information for all age groups, ranging from preschool children to older seniors.
This approach is used because disability rates and experiences differ across age groups. Among very young children aged 0 to 4, the disability rate is comparatively low at 1.7%. Among older seniors aged 75 and over, the disability rate is 56.3%. As well, disability supports are important across all ages. However, certain topics are more relevant to some ages than others. In measuring outcomes of children and youth with disabilities, this report focuses on access to education and access to needed supports and services; among working-age adults, equitable employment and income; and among seniors, income and access to caregiving.
This report is broken down into eight main sections. Following the overview, Section 2 presents a national profile of disability that shows disability rates and the prevalence of different types and severity levels of disabilities. Sections 3 to 7 summarize data on key issues for four age groups: children, youth and young adults, working-age adults and seniors. Section 8 contains highlighted statistics on topics that are important to each of the age groups for each of the provinces and territories.
Glossary
Disability: The Participation and Activity Limitation Survey (PALS) uses selfreporting to identify disability. Respondents are considered to have a disability if they (or their parents or guardians, in the case of children 14 and under) report having a physical or mental health condition or a health problem that restricts their ability to engage in activities of daily living. This approach was developed by Statistics Canada through work with the World Health Organization.
Severity of disability: Statistics Canada constructed a PALS index to measure severity of disability based on the intensity and frequency of the activity limitations reported. Since the survey questions differed depending on the survey respondent's age, there are separate severity ratings for children under 5, for children aged 5 to 14 and for youth and adults 15 years and over. For adults, youth and children over 5, severity is classified into four groups (mild, moderate, severe and very severe), whereas for children under 5 it is divided into two groups (mild to moderate and severe to very severe).
Type of disability: PALS survey questions allow the identification of different types of disabilities based on the nature of the activity limitation. For children 0 to 4, 5 types of disabilities are identified; for children 5 to 14, PALS distinguishes 10 types; and for youth and adults 15 and over, 11 types of disabilities are identified. Hearing and seeing disabilities can be identified for all ages but the remaining types vary for the three age groups. For all age groups, the type of disability may be identified as "other" if none of the specific types apply. PALS allowed people to report more than one type of disability and many survey respondents did have more than one type.
After-Tax Low Income Cut-Off (LICO): Developed by Statistics Canada, the LICO is an income threshold below which a family will likely devote a larger share of its income on the necessities of food, shelter and clothing than the average family. To reflect differences in the costs of necessities among different community and family sizes, LICOs are defined across five categories of community size and seven of family size. LICOs are not applicable to territories.
Employment income: Refers to the total income received by people 15 years of age and over during 2005 as wages and salaries, net income from unincorporated non-farm business and/or professional practice and net farm self-employment income. In this report, those earning no employment income are excluded from employment income calculations.
Total income: Refers to the total income received by people 15 years of age and over during 2005 as wages and salaries, net income from unincorporated non-farm business and/or professional practice and net farm self-employment income, child benefits, Old Age Security pension and Guaranteed Income Supplement, benefits from Canada or Quebec Pension Plan, benefits from Employment Insurance, other income from government sources, retirement pensions and investment income. In this report, those earning no total income are excluded from total income calculations.
Household income: The sum of the total incomes of all members of that household. In this report, those earning no household income are excluded from household income calculations.
Labour force participation rate: The percentage of the population identified as either employed or unemployed and seeking employment relative to the entire population. Labour force participation rates are age-standardized.
Unemployment rate: The percentage of the population identified as unemployed and seeking employment relative to the population participating in the labour force. Unemployment rates are age-standardized.
Section 2: Disability in Canada
Disability is becoming increasingly common in Canada. The disability rate in 2006 was 14.3%, meaning that over 4.4 million Canadians, or about one in seven, had a disability. Disability rates vary across Canada's provinces and territories, and also steadily increase with age. The disability rate among seniors is much higher than among children—43.4% of seniors aged 65 and over compared to 3.7% of children aged 14 and under have a disability.
Every person with a disability has a unique experience. Severity of a disability can impact all dimensions of a person's life. The more severe a person's disability, the more barriers he or she may encounter. The majority of Canadians with disabilities have mild to moderate activity limitations. Overall, across Canada, 8.6% of people experience mild to moderate disabilities, and another 5.7% experience severe to very severe disabilities.
Certain types of disabilities are also much more common than others. Children are more likely to be diagnosed with disabilities related to their academic and social functioning. The most common types of disabilities for children are learning limitations, communication limitations and developmental (5 and older) or delay (0 to 4) limitations. In contrast, adults are more likely to be diagnosed with disabilities commonly associated with aging. The most common types of disabilities for adults are pain-related, mobility and agility disabilities.
Section 3: Children (aged 0 to 14)
Children with disabilities and their families face many challenges. At early ages, disabilities can be difficult to diagnose, since children develop at different rates, and finding a suitable health professional can be challenging.
School-aged children face additional barriers with respect to their education. Finding the most appropriate school and the classroom style that best benefits the child can be trying, as can ensuring children have their needs met for assistive aids in the classroom. Children may also face barriers to participating in social and leisure activities.
When a child has a disability, the family is affected as well. The child's condition can make it challenging for parents or guardians to obtain child care. Many parents of children with disabilities have altered their employment situation as a result of the increased need for care and support. Help for parents to fulfill their other family or personal obligations can be difficult to find.
Preschool-aged children (aged 0 to 4)
Demographic profile
Across Canada, 27 540 children under the age of five have an identified disability. This represents 1.7% of the younger child population, the lowest disability rate for any age group. However, because the experiences and development of young children at home vary, barriers can be difficult to observe and disability difficult to detect.
There are four specific types of disability identified in children aged 0 to 4: hearing, seeing, developmental delay and chronic conditions. More than one disability type may be identified for the same child, and some conditions, such as autism, can result in multiple disability types being identified in the survey. Young children with disabilities who do not fit into any of those categories are classified as "other", though there were not many young children identified in the survey who were part of this category.
The breakdown of children with disabilities under the age of five by disability type is shown in Table 3.1. The most common types of disabilities among small children are activity limitations caused by chronic conditions and developmental delays. The most common chronic conditions that result in disability are asthma or severe allergies, autism, cerebral palsy and heart conditions or heart disease.
At this young age, boys are more likely to have a reported disability than girls. The difference between boys and girls is concentrated in chronic conditions and developmental delays, which are both significantly higher for boys. At this young age, there is no significant difference between the rates of seeing and hearing limitations amongst boys and girls.
Among young children with a disability, 63.4% have their disability classified as mild or moderate, while 36.6% have their disability classified as severe or very severe.
Many parents or guardians of younger children with disabilities indicate their children experience disadvantages in the home or while playing as a result of their disability. 52.5% of young children with disabilities experience mild or moderate difficulties in home life and 5.2% experience severe difficulties at home. 69.7% of parents of young children with disabilities reported their child was mildly or moderately disadvantaged while playing, while 8.8% reported their child was severely disadvantaged while at play.
Table 3.1: Disability type by gender for young children with disabilities aged 0 to 4, Canada, 2006
Disability type
Boys
Girls
Number
%
Number
%
Chronic condition
12120
1.4
7110
0.9
Developmental delay
10840
1.3
6250
0.8
Hearing
1810
0.2
1460
0.2
Seeing
1700
0.2
1330
0.2
Percentages are over entire Canadian young children (0 to 4 years) population.
More than one disability type could be identified for each survey respondent.
Source: Statistics Canada, Participation and Activity Limitation Survey, 2006.
Childcare
Approximately half (51.6%) of parents of young children with disabilities use some form of child care, such as a babysitter or a daycare centre. Another 18.9% would like to use a childcare service but do not, with the most common reason being that costs were too high.
Of parents who place their young children in childcare or who want to, 13.3% report that their children have been either refused care because of their condition, or could not be placed in the preferred arrangement because of a lack of places for children with special needs. Childcare providers that have most commonly refused to provide care are daycare centres, followed by before- and after-school programs and providers operating out of their homes.
20.3% of parents of young children with disabilities do not use child care because they prefer to care for their children full-time.
Health professionals
Parents of young children with disabilities are typically able to receive diagnoses for their children. 89.6% of children aged 0 to 4 have obtained a diagnosis for the condition that resulted in their disability. It is common, however, for Canadian parents to encounter a variety of obstacles while obtaining a diagnosis for their child:
46.7% had doctors or health professionals who took a "wait and see" approach with the child's disability;
39.3% experienced long waiting periods to get the diagnosis;
29.5% had difficulty getting referrals or appointments;
25.7% could not obtain the diagnosis locally;
23.0% encountered health professionals who were not familiar with the child's condition.
Only 9.6% of parents reported finding the cost of obtaining the diagnosis too expensive.
Apart from general practitioners and pediatricians, the health professionals that young children with disabilities see most commonly on a regular basis are speech therapists (58.9%), specialist physicians such as cardiologists or neurologists (57.4%) and occupational therapists (39.5%).
14.8% of parents of young children with disabilities reported that they were unable to see the health professional they needed for their child. In 77.0% of those cases, parents reported that the need went unmet because waiting lists were too long. The greatest unmet need by far was for speech therapists.
Older children (aged 5 to 14)
Demographic profile
Children aged 5 to 14 have a disability rate of 4.6%. Across Canada, 174 810 children between the ages of 5 and 14 have an identified disability. As children enter the school system, barriers and challenges are more likely to be encountered and disability is more likely to be identified. Whereas only four specific disability types were identified for children aged 0 to 4, nine specific disability types are identified for children aged 5 to 14. The five additional types measured are emotional/psychological, communication and learning disabilities and disabilities related to agility and mobility.
The most common types of disability reported for children aged 5 to 14 are chronic conditions and learning and/or communication limitations. Boys were more likely to experience each of these disability types than were girls, in addition to most other types of disability as well. Table 3.2 displays the disability rates for each disability type by gender.
Among children aged 5 to 14 with disabilities, 57.6% have mild to moderate disabilities and 42.4% have severe to very severe disabilities.
As children grow older, they encounter more areas of life where they may experience disadvantage. As is the case with children aged 0 to 4, the majority of parents of older children with disabilities reported their child is at a disadvantage in home life and at play, but now also report that their child can be at a disadvantage at school and in other areas. 77.4% of parents reported their child was at a disadvantage in life at school, and 44.3% reported their child was at a disadvantage in areas such as transportation or leisure.
Table 3.2: Disability type by gender for older children with disabilities aged 5 to 14, Canada, 2006
Disability type
Boys
Girls
Number
%
Number
%
Agility
25540
1.3
11700
0.6
Chronic condition
75120
3.8
41220
2.2
Communication
54130
2.8
24100
1.3
Developmental
37660
1.9
16080
0.9
Emotional/Psychological
40840
2.1
19470
1.0
Hearing
12620
0.6
7410
0.4
Learning
80990
4.1
40090
2.2
Mobility
11210
0.6
11940
0.6
Seeing
10190
0.5
6490
0.3
Other
3450
0.2
2840
0.2
Percentages are over entire Canadian older children (5 to 14 years) population.
More than one disability type could be identified for each survey respondent.
Source: Statistics Canada, Participation and Activity Limitation Survey, 2006.
Education
Access to the education system is one of the most important issues for older children with disabilities. Among children with disabilities aged 5 to 14, 94.0% attend school. Of children aged 5 to 14 with a disability, 90 590 attend mainstream schools with no special education classes, 55 650 attend mainstream schools with at least some special education classes and 12 880 attend special education schools.
Disability severity can have an impact on what type of school children with disabilities attend. Among those who attend mainstream or special schools, 14.5% of children with severe or very severe disabilities attend special schools, while only 3.0% of children with mild or moderate disabilities attend special schools.
In addition to special education classes, many schools throughout Canada now practice inclusive education, where children who have special education requirements are able to participate fully in regular classroom settings with the help of aides such as tutors:
35 100 children with disabilities who attend only regular classes have tutors or teachers' aides;
10 470 children who attend only regular classes have note-takers or readers;
4 020 receive attendant care;
3 480 use talking books.
Children with disabilities are in general reported to be doing well at school. 73.9% of parents report that their children did average, well or very well on their latest report card.
Schoolyard violence can be a reality for children with disabilities. 30.1% of parents of school-aged children with disabilities reported their child had been physically assaulted or attacked by another child at school within the twelve months prior to being surveyed. Disability severity is a significant factor with respect to violence: for children with severe or very severe disabilities, the reported rate of assault by other children is 38.2%.
Health care
Similar to young children aged 0 to 4, most school-aged children aged 5 to 14 were able to obtain a diagnosis for their condition (88.4%). For those that obtained a diagnosis, experiencing a long waiting period was the most common obstacle. Cost is more likely to be a difficulty for parents of older children with disabilities than for those with younger children (17.8% versus 9.6%).
School-aged children with disabilities are less likely than young children to visit most types of health professionals. The major exception is child psychologists and psychotherapists, whom 28.1% of school-aged children with disabilities have visited.
General practitioners (76.4%), pediatricians (50.8%) and specialist physicians (42.0%) are the health professionals most commonly seen. 84.0% of parents of school-aged children with disabilities report their children had received services from the appropriate health professionals when necessary. For those with unmet needs, speech therapists, child psychologists and specialized physicians are the health professionals most commonly sought. As is the case with young children, for older children the most common obstacle to seeing a health professional is long waiting lists.
Impact on the families of children (aged 0 to 14)
Employment
Families of children with disabilities experience an impact on their employment as a result of caring for their children beyond that which is experienced by families of children without disabilities. Caring for children with disabilities can result in a great deal of pressure on families.
In almost 50% of cases of disability in children, one or more family members have altered their employment situation because of the child's condition. The choices families make can differ, from working more hours to help financially support the child's needs, to working fewer hours or outright quitting a job to care for the child.
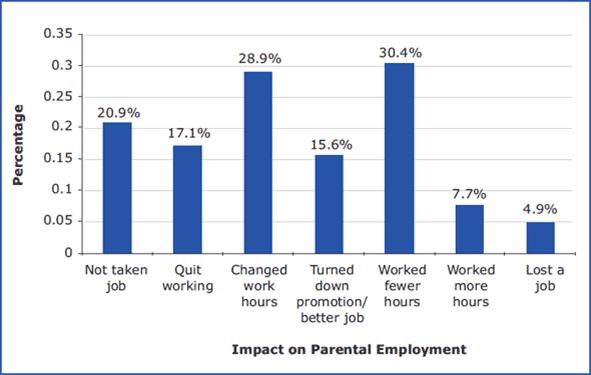
The most common effects of child disability on family employment are shown in Chart 3.1.
While the effect of child disability on family employment does not generally vary with the age of the child, it does vary with the level of disability severity. Parents of children with severe or very severe disabilities are over twice as likely to have quit a job because of the child's condition than parents of children with mild or moderate disabilities (26.8% versus 10.2%).
In the wide majority of cases, it is the mother's employment situation that is most affected. 64.1% of families whose employment situation was altered reported that the mother was most affected, while only 8.3% reported that the father was most affected. 24.6% reported that both parents experienced the effects on employment, meaning the employment situation of mothers was affected almost 90% of the time, and for fathers approximately 33% of the time.
Chart 3.1: Impact of child's condition on parental employment for parents of children with disabilities aged 0 to 14, Canada, 2006
Text description of Chart 3.1
This is a vertical bar graph that illustrates the impact of the child's condition on parental employment for parents of children with disabilities, aged 0 to 14, in 2006
The Y axis is measured by percentages and increases by increments of five from 0 up to 35.
The X axis is comprised of seven types of impacts on parental employment. On the X axis from left to right, the types of impacts on parental employment are:
Not taken job
Quit working
Changed work hours
Turned down promotion/ better job
Worked fewer hours
Worked more hours
Lost a job
The percentage of parents of children with disabilities, aged 0 to 14, who have not taken a job due to their child's condition is 20.9% in 2006.
The percentage of parents of children with disabilities, aged 0 to 14, who have quit working due to their child's condition is 17.1% in 2006.
The percentage of parents of children with disabilities, aged 0 to 14, who have changed their work hours due to their child's condition is 28.9% in 2006.
The percentage of parents of children with disabilities, aged 0 to 14, who have turned down a promotion or a better job due to their child's condition is 15.5% in 2006.
The percentage of parents of children with disabilities, aged 0 to 14, who have worked fewer hours due to their child's condition is 30.4% in 2006.
The percentage of parents of children with disabilities, aged 0 to 14, who have worked more hours due to their child's condition is 7.7% in 2006.
The percentage of parents of children with disabilities, aged 0 to 14, who have lost a job due to their child's condition is 4.9% in 2006.
Income
Children with disabilities are more likely to live in low-income households than children without disabilities. In 2006, the average household yearly income for families with children with disabilities was $69,440, which is only 81.4% of the average household income for families with children with no disabilities ($85,294).
Moreover, 19.1% of families with children with disabilities have a household income less than the after-tax low income cut-off (LICO), compared to only 13.4% of families with children without disabilities.
In general, families of younger children with and without disabilities have lower household incomes than families with older children, due to different workforce factors and childcare obligations. Families with children aged 0 to 4 have a household income that is on average about 94% of that of families with children aged 5 to 14. That percentage holds for families of children with disabilities and for families of children without disabilities, meaning that while child disability does affect household income, there is no evidence of it modifying the effect of child age on household income.
A number of factors may explain the household income discrepancies between families of children with disabilities and families of children without disabilities. The reported negative impact on family employment that is shown above can often lead to a negative impact on household income. It is also possible that children living in low-income situations are more likely to develop health problems and consequently experience disability.
Support
A child's disability can affect the family in more ways than financially. The additional demands it creates can sometimes impact parents' abilities to meet other family obligations.
Parents of children with disabilities were surveyed about their need for extra help, specifically because of the child's condition, with housework, family responsibilities or respite time for personal activities. The results were largely dependent on the severity of the child's disability. For children with mild or moderate disabilities, 18.3% of families reported needing help, while for children with severe or very severe disabilities, 55.3% of families reported needing help.
The need for help of families with children with disabilities often goes unmet. Of families who reported they needed help with housework or family responsibilities, 92.0% reported they had at least some unmet needs for help. This percentage did not vary with the age of the child.
A variety of factors were reported for the reasons families were unable to meet their needs for help. Over half (52.4%) of those with unmet needs cited cost as a major reason they could not get help. Other common reasons mentioned were that help was not available from family or friends (43.6%), services and programs were not available locally (26.8%) and the family did not know where to look for help (25.9%).
Section 4: Youths and young adults (aged 15 to 24)
Youths (aged 15 to 19)
Demographic profile
96 060 youths aged 15 to 19 in Canada experienced disability in 2006, which represents 4.6% of the youth population.
Men (4.7%) at this age are still more likely to have a disability than women (4.4%), but the reported rates are closer together for this age group than for children. A large contributing factor to the increased disability rate in women is that pain disabilities are identified for the first time. Women are much more likely than men to experience disability related to pain (2.5% versus 1.6%). Men in this age group remain more likely than women to have a learning or developmental disability. The youth disability rates by disability type for men and women are listed in Table 4.1.
Youths with disabilities are more likely to have their disability categorized as mild or moderate (70.2%) than severe or very severe (29.8%). Among youths with disabilities, 69.4% reported that they have more than one type of disability.
Table 4.1: Disability type by gender for youths with disabilities aged 15 to 19, Canada, 2006
Disability type
Boys
Girls
Number
%
Number
%
Agility
14600
1.3
13820
1.4
Communication
17270
1.6
11090
1.1
Developmental
14730
1.4
7660
0.8
Emotional/Psychological
9010
0.8
10820
1.1
Hearing
5000
0.5
5330
0.5
Learning
36040
3.3
21730
2.1
Memory
11470
1.1
7010
0.7
Mobility
17710
1.6
18630
1.8
Pain
17770
1.6
25560
2.5
Seeing
5070
0.5
5770
0.6
Other
2180
0.2
2650
0.3
Percentages are over entire Canadian youth (15 to 19 years) population.
More than one disability type could be identified for each survey respondent.
Source: Statistics Canada, Participation and Activity Limitation Survey, 2006.
Education
Youths with disabilities have a more difficult time remaining in school than youths without disabilities. Youths who do not have a high school diploma and who are not currently attending school are identified as high school drop-outs. The high school drop-out rate for youths with disabilities is 14.2%, compared to 9.7% for those without a disability. Severity plays a large role in high school drop-out rates: 18.2% of youths with severe or very severe disabilities dropped out, whereas the drop-out rate for youths with mild or moderate disabilities was 12.5%.
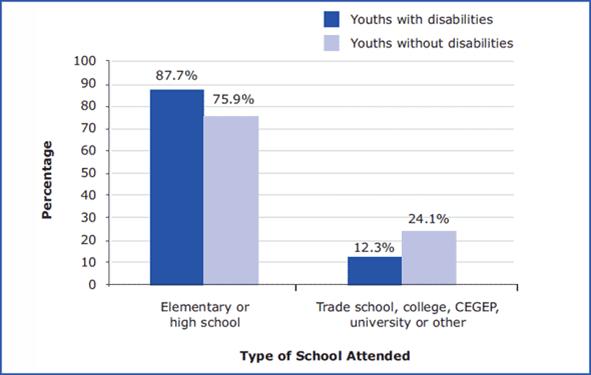
Youths with disabilities are also more likely to remain in high school at older ages. Chart 4.1 displays the percentages of youths with and without disabilities attending primary or secondary school versus those attending post-secondary education. Among youths with a disability attending school in 2006, 87.7% remained in junior high or high school. For youths without disabilities, that percentage is 75.9%.
Chart 4.1: Type of school attended by disability status for youths aged 15 to 19, Canada, 2006
Text description of Chart 4.1
This is a vertical bar graph that illustrates the type of school attend by disability status for youth aged 15 to 19, in 2006
The Y axis is measured by percentages and increases by increments of ten from 0 up to 100.
The X axis is comprised of two categories of types of school attend: from left to right, 'Elementary or high school' and 'Trade school, college, CEGEP, university or other'.
Each type of school attended has two vertical bars, one for youth with disabilities and one for youth without disabilities, depicting the percentage of youth, age 15 to 19, attending the specific type of school by disability status in 2006.
The percentage of youth attending elementary or high school is 87.7% for youth with disabilities and 75.9% for youth without disabilities in 2006.
The percentage of youth attending trade school, college, CEGEP, university or other is 12.3% for youth with disabilities and 24.1% for youth without a disability in 2006.
Employment
The employment situation for youths can vary widely depending on their circumstances. Some youths aged 15 to 19 might be looking for full-time employment, while others may be looking for a part-time job while they continue their education. Obtaining employment at a young age can be an important step for young Canadians.
The labour force participation rate for youths with disabilities, i.e. the percentage who are identified as either employed or unemployed and seeking employment, is 40.1%, compared to 51.4% for youths without disabilities. Since youths with disabilities on average remain in primary or secondary school longer, they may not be ready to transition to employment as quickly.
Women with disabilities are both far more likely to participate in the labour force and far more likely to obtain employment than men with disabilities in the 15 to 19 age group. Labour force participation and unemployment rates are shown in Table 4.2.
For women youths with disabilities, the labour force participation and unemployment rates are not significantly different from those for women youths without disabilities. Men with disabilities have a much more difficult time obtaining employment than their counterparts without disabilities.
Table 4.2: Labour force status by disability status for youths aged 15 to 19, Canada, 2006
Gender
Youths with disabilities
Youths without disabilities
Labour force participation rate
Unemployment rate
Labour force participation rate
Unemployment rate
Men
34.1%
26.9%
50.5%
13.8%
Women
47.1%
16.8%
52.4%
18.0%
Source: Statistics Canada, Participation and Activity Limitation Survey, 2006.
Young adults (aged 20 to 24)
Demographic profile
99 440 young adults aged 20 to 24 had a disability in 2006, representing 4.9% of the Canadian young adult population.
The 20 to 24 age group is the first age group where the disability rate for women is higher than that for men (4.9% versus 4.8%). Table 4.3 displays the disability type rates by gender for 2006. As with the 15 to 19 age group, pain disabilities are significantly more common for women aged 20 to 24 than they are for men.
Learning disabilities are still more common for men, but the percentage of the population who experienced learning disabilities is lower for this age group than for young people aged 15 to 19. Note that this may mean the percentage of the population with the underlying condition has remained the same, but that those with the condition are less likely to encounter a barrier related to learning.
Similar to youths, young adults with disabilities are more likely to have their disability categorized as mild or moderate (70.7%) than severe or very severe (29.3%). Over two-thirds (69.4%) had more than one disability.
Table 4.3: Disability type by gender for young adults with disabilities aged 20 to 24, Canada, 2006
Disability type
Boys
Girls
Number
%
Number
%
Agility
17060
1.7
18690
1.8
Communication
13500
1.3
10760
1.1
Developmental
10020
1.0
5540
0.5
Emotional/Psychological
12490
1.2
12580
1.2
Hearing
6720
0.7
4750
0.5
Learning
26060
2.5
18850
1.9
Memory
10140
1.0
9420
0.9
Mobility
19400
1.9
22240
2.2
Pain
23710
2.3
31030
3.1
Seeing
4780
0.5
7030
0.7
Other
2350
0.2
2360
0.2
Percentages are over entire Canadian young adult (20 to 24 years) population.
More than one disability type could be identified for each survey respondent.
Source: Statistics Canada, Participation and Activity Limitation Survey, 2006.
Education
Young adults with disabilities are more likely to have discontinued their education without obtaining their high school diploma than young adults without disabilities. 20.1% of young adults with disabilities report they have not completed high school and are not attending school, compared to 9.9% of young adults without a disability. Severity is again a significant factor for high school completion: 33% of young adults with severe or very severe disabilities have dropped out of high school without their diplomas.
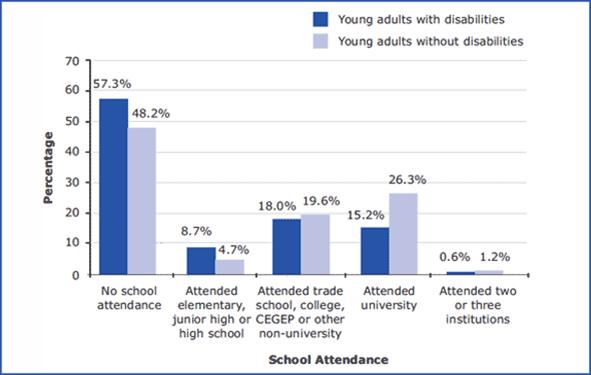
Chart 4.2 displays that young adults with disabilities are more likely to have ceased their education (57.3% versus 48.2%). Young adults with disabilities aged 20 to 24 tend to remain in elementary, junior high or high school longer than young adults without disabilities (8.7% versus 4.7%). Similarly, young adults with disabilities are less likely to attend post-secondary institutions. Among young adults who do move on to post-secondary education, those with disabilities are more likely to attend colleges or trade schools, whereas those without disabilities are more likely to attend university.
Chart 4.2: School attendance by disability status for young adults aged 20 to 24, Canada, 2006
Source: Statistics Canada, Participation and Activity Limitation Survey, 2006.
Text description of Chart 4.2
This is a vertical bar graph that illustrates the school attendance by disability status for young adults aged 20 to 24, in 2006
The Y axis is measured by percentages and increases by increments of ten from 0 up to 70.
The X axis is comprised of five types of school attendance. On the X axis from left to right, the types of school attendance are:
No school attendance
Attended elementary, junior high or high school
Attended trade school, college, CEGEP or other non-university
Attended university
Attended two or three institutions
Each type of school attendance has two vertical bars, one for young adults with disabilities and one for young adults without disabilities, depicting the percentage of young adults, age 20 to 24, attending the specific type of school by disability status in 2006.
The percentage of young adults with no school attendance is 57.3% for young adults with disabilities and 48.2% for young adults without disabilities in 2006.
The percentage of young adults who attended elementary, junior high or high school is 8.7% for young adults with disabilities and 4.7% for young adults without disabilities in 2006.
The percentage of young adults who attended trade school, college, CEGEP or other non-university is 18.0% for young adults with disabilities and 19.6% for young adults without disabilities in 2006.
The percentage of young adults who attended university is 15.2% for young adults with disabilities and 26.3% for young adults without disabilities in 2006.
The percentage of young adults who attended two or three institutions is 0.6% for young adults with disabilities and 1.2% for young adults without disabilities in 2006.
Employment
As was the case for youths, the employment situation for young adults varies. They might be looking for their first full-time job after finishing their education, or looking for part-time work to help finance their continued education.
The overall labour force participation rate (percentage either employed or seeking employment) for young adults in 2006 was 80.7%. The labour force participation rate for young adults with disabilities was much lower at 63.7%, compared to 81.5% for young adults without disabilities. Young adults with severe and very severe disabilities had a labour force participation rate of 41.3%.
Similar to youth aged 15 to 19, young women aged 20 to 24 with disabilities are more likely to participate in the labour force than young men with disabilities, but the gap is narrower (65.4% versus 62.0%). The labour force participation gap is still quite wide between young women and men with severe or very severe disabilities (48.7% versus 34.7%).
For those who seek work, unemployment is higher for young adults with disabilities than for those without. The unemployment rate for young adults with disabilities was 15.1%, compared to 9.9% for young adults without disabilities. Severity again plays a significant role: those with severe and very severe disabilities experienced an unemployment rate of 22.7%.
Contrary to the trends for the 15 to 19 age group, where men had a significantly higher unemployment rate than women, women aged 20 to 24 with disabilities had a slightly higher unemployment rate than men with disabilities of that age (16.5% versus 13.5%). The high unemployment rate for young adults with severe and very severe disabilities is especially felt by women; their unemployment rate was 29.2%.
Social participation of youths and young adults (aged 15 to 24)
Youths and young adults with disabilities are leading active social lives. 93.6% reported they visited family and friends, 84.8% report they either played sports or exercised and 78.9% reported they attended sporting events, cultural events or visited public attractions such as museums or parks.
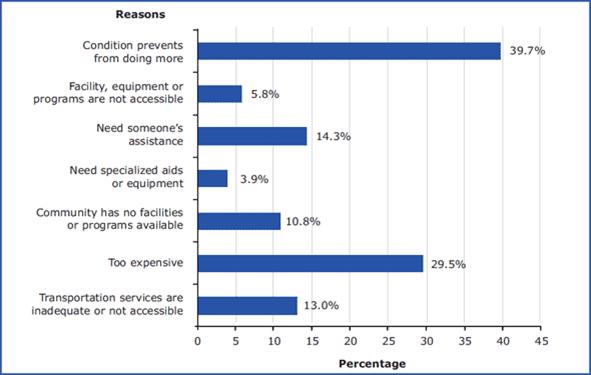
Over half of youths and young adults with disabilities felt they would like to do more social activities during their spare time. Most commonly, their condition and the cost of activities were the factors preventing them from doing more, although requiring assistance and inaccessible transportation were also common reasons.
Chart 4.3: Reasons youth and young adults with disabilities aged 15 to 24 do not participate in more social activities, Canada, 2006
1. More than one reason could be selected.
Source: Statistics Canada, Participation and Activity Limitation Survey, 2006.
Text description of Chart 4.3
This is a horizontal bar graph that illustrates the reasons youth and young adults with disabilities aged 15 to 24 do not participate in more social activities in 2006.
The X axis is measured by percentages and increases by increments of five from 0 up to 45.
The Y axis is comprised of seven reasons. On the X axis from left to right, the reasons are:
Conditions prevent from doing more
Facility, equipment or programs are not accessible
Need someone's assistance
Need specialized aids or equipment
Community has no facilities or programs available
Too expensive
Transportation services or inadequate or not accessible
The percentage of youth and young adults with disabilities who identify that the reason they do not participate in more social activities is that their condition prevents them from doing more is 39.7% in 2006.
The percentage of youth and young adults with disabilities who identify that the reason they do not participate in more social activities is because the facility, equipment or programs are not accessible is 5.8% in 2006.
The percentage of youth and young adults with disabilities who identify that the reason they do not participate in more social activities is because they need someone's assistance is 14.3% in 2006.
The percentage of youth and young adults with disabilities who identify that the reason they do not participate in more social activities is because they need specialized aids or equipment is 3.9% in 2006.
The percentage of youth and young adults with disabilities who identify that the reason they do not participate in more social activities is because their community has no facilities or programs available is 10.8% in 2006.
The percentage of youth and young adults with disabilities who identify that the reason they do not participate in more social activities is because it is too expensive is 29.5% in 2006.
The percentage of youth and young adults with disabilities who identify that the reason they do not participate in more social activities is because transportation services or inadequate or not accessible is 13.0% in 2006.
Section 5: Younger working-age adults (aged 25 to 54)
Demographic profile
There are over 1.4 million Canadians aged 25 to 54 living with a disability, which represents 10.6% of the total population for that age group. The disability rate increases steadily with age beginning around age 25. Adults aged 25 to 34 have a disability rate of 6.1%, adults aged 35 to 44 have a disability rate of 9.6% and adults aged 45 to 54 have a disability rate of 15.1%.
The most common types of disability for younger working-age adults are pain, mobility and agility disabilities. The percentages of women and men populations that experience the different types of survey-identified disabilities are listed in Table 5.1.
In addition to being more likely to experience disabilities related to pain, mobility and agility, women are also more likely to experience emotional or psychological disabilities. Overall, women of this age group are slightly more likely to experience disability than men (11.1% versus 9.9%).
For younger working-age adults, disabilities are still more likely to be classified as being of mild or moderate severity (59.9%) than severe or very severe (40.1%). Still, more people in this age group reported severe or very severe disabilities than in the 15 to 24 age group. Also, for the 25 to 54 age group, 80.4% of people who reported a disability reported having more than one type, a significant increase over the 15 to 24 age group.
Table 5.1: Disability type by gender for younger working-age adults with disabilities aged 25 to 54, Canada, 2006
Disability type
Boys
Girls
Number
%
Number
%
Agility
397000
6.0
486670
7.0
Communication
99150
1.5
103870
1.5
Developmental
37960
0.6
34210
0.5
Emotional/Psychological
127070
1.9
212730
3.1
Hearing
144700
2.2
133190
1.9
Learning
166940
2.5
149210
2.1
Memory
92460
1.4
103730
1.5
Mobility
378120
5.7
519890
7.5
Pain
486550
7.3
621080
8.9
Seeing
120450
1.8
157880
2.3
Other
21460
0.3
20230
0.3
Percentages are over entire Canadian younger working-age adult (25 to 54 years) population.
More than one disability type could be identified for each survey respondent.
Source: Statistics Canada, Participation and Activity Limitation Survey, 2006.
Employment
Younger working-age adults with disabilities are far less likely to participate in the labour force (i.e. work or seek work) than their counterparts without disabilities. The labour force participation rate for adults with disabilities aged 25 to 54 is 66.0%, compared to 88.2% for adults without disabilities from the same age group. As severity of disability increases, younger working-age adults have a much lower labour force participation rate (79.2% for younger working-age adults with a mild level of disability versus 51.9% for those with a severe of very severe level of disability).
Younger working-age women with disabilities are less likely to participate in the labour force than younger working-age men with disabilities (63.0% versus 69.6%). The relative ratio of women's participation to men's participation for adults with disabilities is not significantly different from that of adults without disabilities.
However, when disability severity is factored in, the effect of gender on labour force participation changes. The labour force participation rates for men and women aged 25 to 54 by disability severity are shown in Chart 5.1. As can be seen, as disability becomes more severe, the percentage difference between the participation rates of men and women diminishes. For younger working-age adults with severe or very severe disabilities, the labour force participation rates for men and women are almost identical.
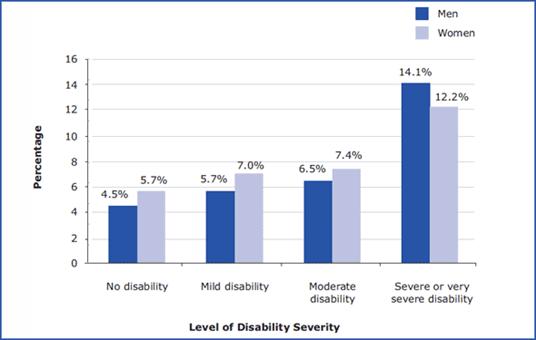
A similar trend exists for unemployment among those who seek work. For this age group, adults with disabilities are more likely to be unemployed than adults without disabilities (8.7% versus 5.1%). Women are more likely to be unemployed than men (6.0% versus 4.8%). Younger working-age adults with severe or very severe disabilities are more likely to be unemployed than younger working-age adults with mild disabilities (13.4% versus 6.3%). However, the effect of gender on unemployment changes with disability severity, as shown in Chart 5.2. Men with severe or very severe disabilities actually have a higher unemployment rate than do women with severe or very severe disabilities (14.1% versus 12.2%).
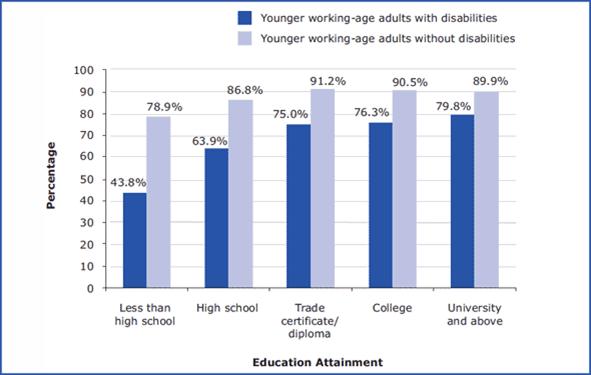
Displayed in Chart 5.3, education attainment has a large impact on labour force participation for people with disabilities. The labour force participation rate for working-age adults with disabilities with less than a high school education is 43.8% compared to 78.9% for working-age adults without disabilities. Working-age adults with disabilities who have higher levels of education experience labour force participation and unemployment rates closer to those of working-aged adults without disabilities. Working-age adults with a disability who have a university degree have a labour force participation rate of 79.8% (compared to 89.9% for working-age adults without disabilities).
Working-age adults with disabilities who have not completed high school have a higher unemployment rate than their counterparts without disabilities (13.3% versus 9.0%). However, adults with disabilities with a university degree have a slightly lower unemployment rate than those without disabilities (3.1% versus 4.0%).
Chart 5.1: Labour force participation by level of disability severity and gender for younger working-age adults aged 25 to 54, Canada, 2006
Source: Statistics Canada, Participation and Activity Limitation Survey, 2006.
Text description of Chart 5.1
This is a vertical bar graph that illustrates the labour force participation by level of disability severity for younger working-age adults with disabilities aged 25 to 54 in 2006.
The Y axis is measured by percentages and increases by increments of ten from 0 up to 100.
The X axis is comprised of four levels of disability severity. On the X axis from left to right, the levels of disability severity are:
No disability
Mild disability
Moderate disability
Severe or very severe disability
Each level of disability severity has two vertical bars, one for men and one for women, depicting the percentage of younger working-age adults, age 25 to 54, participating in the labour force by level of disability severity and gender in 2006.
The percentage of labour force participation for men with no disability is 93.4% in 2006. The percentage of labour force participation for women with no disability is 83.1% in 2006.
The percentage of labour force participation for men with a mild disability is 84.1% in 2006. The percentage of labour force participation for women with a mild disability is 74.9% in 2006.
The percentage of labour force participation for men with a moderate disability is 73.3% in 2006. The percentage of labour force participation for women with a moderate disability is 67.6% in 2006.
The percentage of labour force participation for men with a severe or very severe disability is 52.6% in 2006. The percentage of labour force participation for women with a severe or very severe disability is 51.1% in 2006.
Chart 5.2: Unemployment rates by level of disability severity and gender for younger working-age adults aged 25 to 54, Canada, 2006
Source: Statistics Canada, Participation and Activity Limitation Survey, 2006.
Text description of Chart 5.2
This is a vertical bar graph that illustrates the unemployment rate by level of disability severity for younger working-age adults with disabilities aged 25 to 54 in 2006.
The Y axis is measured by percentage and increases by increments of two from 0 up to 16.
The X axis is comprised of four levels of disability severity. On the X axis from left to right, the levels of disability severity are:
No disability
Mild disability
Moderate disability
Severe or very severe disability
Each level of disability severity has two vertical bars, one for men and one for women, depicting the percentage of younger working-age adults, age 25 to 54, who are unemployed by level of disability severity and gender in 2006.
The unemployment rate for men with no disability is 4.5% in 2006. The unemployment rate for women with no disability is 5.7% in 2006.
The unemployment rate for men with a mild disability is 5.7% in 2006. The unemployment rate for women with a mild disability is 7.0% in 2006.
The unemployment rate for men with a moderate disability is 6.5% in 2006. The unemployment rate for women with a moderate disability is 7.4% in 2006.
The unemployment rate for men with a severe or very severe disability is 14.1% in 2006. The unemployment rate for women with a severe or very severe disability is 12.2% in 2006.
Chart 5.3: Labour force participation rates by highest level of education attained for younger working-age adults with and without disabilities aged 25 to 54, Canada, 2006
Source: Statistics Canada, Participation and Activity Limitation Survey, 2006.
Text description of Chart 5.3
This is a vertical bar graph that illustrates the labour force participation rates by highest level of education attained for younger working-age adults with and without disabilities aged 25 to 54 in 2006
The Y axis is measured by percentage and increases by increments of ten from 0 up to 100.
The X axis is comprised of five levels of education attainment. On the X axis from left to right, the levels of education attainment are:
Less than high school
High school
Trade certificate/diploma
College
University and above
Each level of education attainment has two vertical bars, one for younger working-age adults with disabilities and one for younger working-age adults without disabilities, depicting the percentage of young adults, age 25 to 54, participating in the labour force by highest level of education attained and disability status in 2006.
The percentage of labour force participation is 43.8% for younger working-age adults with disabilities who have a less than high school as their highest level of education attainment. The percentage of labour force participation is 78.9% for younger working-age adults without disabilities who have less than high school as their highest level of education attainment.
The percentage of labour force participation is 63.9% for younger working-age adults with disabilities who have high school as their highest level of education attainment. The percentage of labour force participation is 86.8% for younger working-age adults without disabilities who have high school as their highest level of education attainment.
The percentage of labour force participation is 75.0% for younger working-age adults with disabilities who have a trade certificate/diploma as their highest level of education attainment. The percentage of labour force participation is 91.2% for younger working-age adults without disabilities who have a trade certificate/diploma as their highest level of education attainment.
The percentage of labour force participation is 76.3% for younger working-age adults with disabilities who have college as their highest level of education attainment. The percentage of labour force participation is 90.5% for younger working-age adults without disabilities who have college as their highest level of education attainment.
The percentage of labour force participation is 79.8% for younger working-age adults with disabilities who have university and above as their highest level of education attainment. The percentage of labour force participation is 89.9% for younger working-age adults without disabilities who have university and above as their highest level of education attainment.
Income and the workplace
Younger working-age adults with disabilities have much lower average employment incomes than those without. The average employment income for adults with disabilities aged 25 to 54 in 2006 was $32,155, approximately 73.4% of the average income for adults without disabilities in the same age group ($43,785).
Younger working-age women with disabilities have lower average employment incomes than younger working-age men with disabilities, earning approximately 65.4% of what their men counterparts earn (see Table 5.2). Similarly, younger working-age women without disabilities earn 64.9% of what younger working-age men without disabilities earn. While the gender effect is similar across disability status, women with disabilities aged 25 to 54 earned on average less than half of what men without disabilities of the same age group earned.
The employment landscape for people with and without disabilities differs, which partially contributes to income discrepancies. The percentage of the workforce with and without disabilities by different occupation types is displayed in Table 5.3. People with disabilities are significantly more likely to work in sales and service positions, and to a lesser degree manufacturing and utilities positions, than people without disabilities. They are less likely to hold positions in management, natural and applied science, health and social science, education, government service and religion.
For those in management positions, younger working-aged adults with disabilities have average employment incomes equal to approximately 68.9% of the incomes of younger working-aged adults without disabilities ($50,180 versus $72,863). A similar discrepancy can be seen for working-age adults in business, finance and administrative positions ($28,163 versus $39,760). For working-age adults with and without disabilities in processing, manufacturing and utilities positions, average employment incomes are almost identical ($35,468 versus $35,959).
Table 5.2: Mean employment income by disability status and gender for younger working-age adults aged 25 to 54, Canada, 2006
Disability status
Men
Women
People with disabilities
$39,245
$25,678
People without disabilities
$52,865
$34,305
Source: Statistics Canada, Participation and Activity Limitation Survey, 2006.
Table 5.3: Type of occupation by disability status for younger working-age adults aged 25 to 54, Canada, 2006
Type of occupation
Adults with disabilities
Adults without disabilities
Number
%
Number
%
Management
80030
8.0
1250820
11.4
Business, finance and administrative
179860
18.0
1979120
18.1
Natural and applied sciences
47280
4.7
935320
8.5
Health
56750
5.7
705500
6.4
Social science, education, government service and religion
83540
8.3
1003530
9.2
Art, culture, recreation and sport
35390
3.5
348670
3.2
Sales and service
252740
25.2
2098510
19.1
Trades, transport and equipment operators
155710
15.6
1619910
14.8
Occupations unique to primary industry
36420
3.6
324460
3.0
Occupations unique to processing, manufacturing and utilities
73400
7.3
692640
6.3
Source: Statistics Canada, Participation and Activity Limitation Survey, 2006.
Family characteristics and household income
In 2006, for the 25 to 54 age group, people with disabilities were less likely to be in marriages or common-law relationships than people without disabilities (56.2% versus 71.4%). Younger working-age adults with disabilities are more likely to be divorced or separated from their spouse than younger working-age adults without disabilities (24.2% versus 15.3% of the population who is or had been married at one time).
Average household income by relationship status for working-age adults with and without disabilities can be seen in Chart 5.4. Working-age adults with disabilities who are either married or in a common-law relationship have, on average, household incomes equal to about 80.3% of the incomes of working-age adults without disabilities who are in relationships. However, average household income for working-age single adults with disabilities is only 67.0% of the average household income for single working-age adults without disabilities.
20.5% of younger working-aged adults with disabilities live below the after-tax low income cut-off (LICO) threshold, compared to 10.0% of their counterparts without disabilities.
Chart 5.4: Average household income by disability and marital status for younger working-age adults aged 25 to 54, Canada, 2006
Source: Statistics Canada, Participation and Activity Limitation Survey, 2006.
Text description of Chart 5.4
This is a vertical bar graph that illustrates the average household income by disability and marital status for younger working-age adults aged 25 to 54 in 2006.
The Y axis is measured by average household income and increases by increments of $20,000 from 0 up to $120,00.
The X axis is comprised of two types of marital status: from left to right, 'Married/Common law' and 'Single'.
Each type of marital status has two vertical bars, one for younger working-age adults with disabilities and one for younger working-age adults without disabilities, depicting the average household income of younger working-age adults, age 25 to 54, by disability status in 2006.
The average household income for younger working-age adults who are married/common law is $78,020 for younger working-age adults with disabilities and $97,140 for younger working-age adults without disabilities.
The average household income for younger working-age adults who are single is $45,730 for younger working age adults with a disability and $68,180 for younger working-age adults without a disability.
Section 6: Older working-age adults (aged 55 to 64)
Demographic profile
Older working-age adults aged 55 to 64 have a disability rate of 22.8%. Across Canada, an estimated 824 920 adults aged 55 to 64 have a disability. 19.6% of the population with disabilities in Canada is from this age group.
As was the case for younger working-age adults, pain (17.2%), mobility (16.7%) and agility (16.3%) are the most common type of disability among older working-age adults. Hearing and seeing disabilities also affect a larger percentage of this population (6.4% and 4.1% respectively) than they did the 25 to 54 age group.
The percentages of the women and men populations affected by each type of disability are shown in Table 6.1. Women of this age group are more likely to experience disability than men for most disability types, including the three most common types: pain, mobility and agility. Men aged 55 to 64 are more likely to have a hearing disability than women.
The majority of older working-age adults with disabilities have mild to moderate disabilities (58.4%), while 41.6% have severe or very severe disabilities. Among older working-age adults with disabilities, 83.1% reported that they have more than one type of disability.
Table 6.1: Disability type by gender for older working-age adults with disabilities aged 55 to 64, Canada, 2006
Disability type
Boys
Girls
Number
%
Number
%
Agility
256060
14.4
333820
18.1
Communication
43390
2.4
37320
2.0
Developmental
12320
0.7
6880
0.4
Emotional/Psychological
53610
3.0
67310
3.6
Hearing
140070
7.9
91050
4.9
Learning
54420
3.1
57130
3.1
Memory
38480
2.2
48210
2.6
Mobility
249420
14.0
355360
19.3
Pain
269660
15.2
354530
19.2
Seeing
65510
3.7
82020
4.4
Other
7850
0.4
9000
0.5
Percentages are over entire Canadian older working-age adult (55 to 64 years) population.
More than one disability type could be identified for each survey respondent.
Source: Statistics Canada, Participation and Activity Limitation Survey, 2006.
Labour force participation
As people approach the traditional retirement age of 65, choices regarding continued labour market participation or retirement present themselves. Some older working-age adults will gladly continue their employment to 65 and beyond, while others may choose to retire early. Others still will retire involuntarily, either due to their condition or to other factors.
Adults aged 55 to 64 with disabilities are far less likely to participate in the labour force than those without disabilities (42.5% versus 65.1%). The labour force participation rate for older working-age adults with disabilities represents a drop of more than 33% from the rate of younger working-age adults with disabilities, compared to a 26% drop for their counterparts without disabilities.
The fact that some adults with disabilities can no longer work because of their condition and are forced to retire may explain some of the difference between labour force participation rates. 36.2% of retired older working-age adults with disabilities reported they retired involuntarily from the workforce.
Income
Older working-age adults with disabilities have significantly lower average household incomes ($60,516) than do their peers without disabilities ($88,202). Older working-age adults with disabilities who are not married or in common-law relationships are especially at risk of having lower household incomes, with an average household income of $31,716, compared to an average of $51,677 for older single working-age adults without disabilities. The average household income for older single working-age adults with disabilities represents a 31% drop from the corresponding average household income for younger single working-age adults with disabilities (age 25 to 54). This drop is consistent with the drop in labour force participation for people with disabilities in this age group.
Employment income follows a similar trend; on average, older working-age adults with disabilities earn $28,103 annually compared to $43,698 for older working-age adults without disabilities. Women with disabilities fare worse than men with disabilities in this age group, with average employment income only three-fourths as high ($23,293 compared to $32,189).
Over twice as many older working-age adults with disabilities have an income below the after-tax low income cut-off (LICO) than do working-age adults without disabilities (19.6% versus 8.3%).
Caregiving
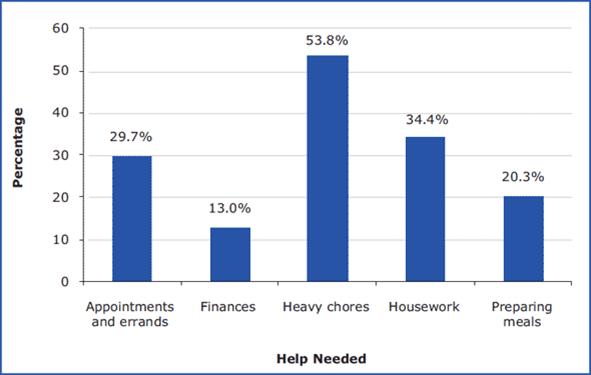
Survey respondents were asked if they required help performing everyday activities, such as preparing meals or housework. 62.9% of adults aged 55 to 64 with disabilities responded that they needed help with at least some everyday activities.
This percentage is not significantly different from the percentage of adults with disabilities aged 65 to 74 who required help with everyday activities. The most common types of help needed for older working-age adults with disabilities are displayed in Chart 6.1.
Approximately 43.3% of older working-age adults with disabilities who need help with everyday activities do not get all the help they need. The types of activities for which adults have the largest unmet need are heavy household chores and housework.
Caregivers for adults aged 55 to 64 are mostly family members; 75.2% of primary caregivers for older working-age adults with disabilities are members of the family. Other common categories of caregivers are friends, neighbours or coworkers (9.3%), government or non-profit organizations (7.2%) and paid employees (6.5%).
Chart 6.1: Percentage of older working-age adults aged 55 to 64 who needed help with different types of everyday activities, Canada, 2006
1. More than one type of everyday activity could be selected.
Source: Statistics Canada, Participation and Activity Limitation Survey, 2006.
Text description of Chart 6.1
This is a vertical bar graph that illustrates the percentage of older working-age adults aged 55 to 64 who needed help with different types of everyday activities in 2006.
The Y axis is measured by percentage and increases by increments of ten from 0 up to 60.
The X axis is comprised of five types of help needed. On the X axis from left to right, the types of help needed are:
Appointments and errands
Finances
Heavy chores
Housework
Preparing meals
The percentage of older working-age adults aged 55 to 64 who needed help with appointments and errands is 29.7% in 2006.
The percentage of older working-age adults aged 55 to 64 who needed help with their finances is 13.0% in 2006.
The percentage of older working-age adults aged 55 to 64 who needed help with heavy chores is 53.8% in 2006.
The percentage of older working-age adults aged 55 to 64 who needed help with housework is 34.4% in 2006.
The percentage of older working-age adults aged 55 to 64 who needed help with preparing meals is 20.3% in 2006.
Section 7: Seniors (aged 65 and over)
Demographic profile
Younger seniors (aged 65 to 74)
There are 739 500 seniors aged 65 to 74 living with a disability in Canada, representing 33.0% of the population for that age group.
The majority of the population of younger seniors with disabilities is affected by physical limitations. Disabilities related to mobility, agility and pain affect over 22% of the younger seniors population. Hearing disabilities affect a significantly larger percentage of the total population than for the 55 to 64 age group (11.9% versus 6.4%). Younger seniors are less likely to report emotional, psychological or learning disabilities than are older working-age adults.
The percentages of the women and men populations with different types of disability are displayed in Table 7.1. The trend of women being more likely to be affected by disabilities related to mobility, agility and pain continues for younger seniors. Women are also now more likely to experience a seeing disability. Men in this age group have almost double the chance of women of living with a hearing disability.
66.4% of younger seniors have indicated their level of disability is mild or moderate, compared to 33.6% who indicate their disability level is severe or very severe. The relative percentage of younger seniors with mild or moderate disabilities is higher than that of older working-age adults. 81.6% of younger seniors with disabilities have reported they have more than one type of disability.
Table 7.1: Disability type by gender for younger seniors with disabilities aged 65 to 74, Canada, 2006
Disability type
Boys
Girls
Number
%
Number
%
Agility
227740
21.4
294200
25.1
Communication
29520
2.8
20150
1.7
Emotional/Psychological
18900
1.8
26930
2.3
Hearing
167750
15.7
97990
8.3
Learning
21500
2.0
24040
2.0
Memory
27890
2.6
29610
2.5
Mobility
216030
20.3
316860
27.0
Pain
219270
20.6
291690
24.8
Seeing
51170
4.8
74030
6.3
Other
11300
1.1
11650
1.0
Percentages are over entire Canadian younger senior (65 to 74 years) population.
More than one disability type could be identified for each survey respondent.
Source: Statistics Canada, Participation and Activity Limitation Survey, 2006.
Older seniors (aged 75 and over)
In 2006, there were 1 018 090 seniors aged 75 and over living with a disability in Canada, which represents 56.3% of the overall older seniors population. This percentage is the highest for any age group.
Physical limitations were again the most common form of disability, with mobility (44.7%) and agility (42.0%) disabilities being the most common types. The percentage of the population affected by these two types has almost doubled from the 65 to 74 age group. Over a quarter of older seniors live with a hearing disability (25.9%), which is over double the rate for the 65 to 74 age group. Memory disabilities are also experienced by a larger percentage of the population (6.5%).
The disability rates for each type are listed in Table 7.2 for men and women. The trends set for previous age groups hold for the 75 and over age group. Women are more likely to experience mobility, agility and pain disabilities, while men are more likely to have a hearing disability.
44.4% of older seniors indicate their level of disability severity is severe or very severe, compared to 55.6% who indicate a mild or moderate disability severity level. This is the highest relative percentage of severe or very severe disabilities for any age group. Among those with disabilities, 84.5% of older seniors report they have more than one of the disability types identified in the survey.
Table 7.2: Disability type by gender for older seniors with disabilities aged 75 and over, Canada, 2006
Disability type
Boys
Girls
Number
%
Number
%
Agility
284200
38.6
475720
44.3
Communication
45490
6.2
48230
4.5
Emotional/Psychological
14830
2.0
23180
2.2
Hearing
214150
29.1
255410
23.8
Learning
23220
3.2
31900
3.0
Memory
53070
7.2
64500
6.0
Mobility
289840
39.4
519500
48.4
Pain
211690
28.8
413120
38.5
Seeing
88850
12.1
153680
14.3
Other
10850
1.5
17520
1.6
Percentages are over entire Canadian older senior (75 years and over) population.
More than one disability type could be identified for each survey respondent.
Source: Statistics Canada, Participation and Activity Limitation Survey, 2006.
Income
Younger seniors (aged 65 to 74)
For younger seniors, household incomes for people with disabilities and people without are much closer together than for the older working-age population. The average household income for younger seniors with disabilities is $56,850, 87.4% of that of younger seniors without disabilities. The average household incomes for single younger seniors with disabilities and single younger seniors without disabilities are not significantly different ($48,270 versus $49,520).
There can be several reasons for the relative increase in average household income for seniors with disabilities. For instance, retired seniors who are experiencing disability for the first time may not experience an income loss if their income is solely from pensions.
The percentage of younger seniors living under the after-tax low income cut-off (LICO) is 5.4%. This percentage has decreased significantly from that of the 55 to 64 age group (10.9%). Younger seniors with disabilities are slightly more likely to be under the LICO than younger seniors without disabilities (6.1% versus 5.0%).
Older seniors (aged 75 and over)
Average household incomes for older seniors with and without disabilities are virtually identical ($59,850 versus $60,120). Average household incomes for men and women with and without disabilities are also not significantly different from each other.
Older seniors with disabilities are slightly less likely to live under the after-tax LICO than older seniors without disabilities (5.6% versus 6.4%).
Caregiving
Younger seniors (aged 65 to 74)
The caregiving needs of younger seniors with disabilities are very similar to those of the older working-age adult age group. 63.9% of younger seniors with disabilities require at least some help with everyday activities. The one area where seniors aged 65 to 74 reported needing more help than adults aged 55 to 64 was moving about in their residence (15.0% versus 8.8%).
Younger seniors are just as likely to have unmet caregiving needs as older working-age adults. 44.9% of younger seniors with disabilities report they have at least some unmet caregiving needs. The most common areas where needs go unmet are help with moving about (39.3%), help with heavy household chores 38.4%) and help with housework (34.0%).
Younger seniors are also just as likely as older working-age adults to rely on family members for care. For younger seniors with disabilities:
74.4% of primary caregivers are family members;
8.1% of primary caregivers are neighbours, friends or co-workers;
7.8% are government or non-profit organizations;
7.2% are paid employees.
Older seniors (aged 75 and up)
Older seniors are more likely to require caregiving than any other age group. 77.1% of all older seniors with disabilities require help with at least some everyday activities. This is a significant jump from the younger seniors age group. The most common activities for which older seniors with disabilities require help are heavy household chores (61.7%), attending appointments and errands (52.9%) and housework (50.3%).
Older seniors are also the most likely to receive help. 95.7% of all older seniors who require help with everyday activities receive at least some. Still, 40.0% say they have partially or fully unmet needs for caregiving.
Older seniors are more likely to receive help from sources other than family or friends than younger age groups. Family members are still the most common source of help for older seniors with disabilities (65.6% of all primary caregivers), but older seniors receive increased levels of care from government or non-profit organizations (13.1%) and paid employees (11.0%).
Section 8: Provincial/territorial information
Table 8.1 presents disability information among different age groups for every province and territory across Canada.
Reported disability rates differ across provinces and territories. The highest rate of self-reported disability is found in Nova Scotia; it is almost double the rate reported by respondents in Quebec, which is the lowest. It is worthwhile to note that individual perception is an important aspect of self-reported disability rates, and many factors may affect the disability rates presented.
The remainder of this section provides provincial and territorial data using the same life-cycle approach used in sections 3 through 7 of the report. Key indicators of full and effective participation are presented for each of the different age groups. The provincial and territorial data provided in this section aim to further assist all people interested in disability issues across Canada.
Table 8.1: Disability rates (%) by age, Canada, provinces and territories, 2006
All ages
0 to 14
15 and over
15 to 64
65 and over
Canada
14.3
3.7
16.6
11.5
43.4
Newfoundland
14.9
3.9
17.0
12.5
40.9
Prince Edward Island
16.3
4.1
18.9
13.0
47.7
Nova Scotia
20.0
4.6
23.0
16.7
52.7
New Brunswick
17.2
4.0
19.8
14.3
46.5
Quebec
10.4
3.0
11.9
7.9
32.3
Ontario
15.5
3.8
18.1
12.6
47.2
Manitoba
15.7
4.1
18.5
12.4
47.6
Saskatchewan
16.0
3.9
18.8
12.1
48.2
Alberta
13.6
4.1
15.8
11.3
47.0
British Columbia
16.0
4.0
18.4
12.8
45.7
Yukon Territory
13.5
4.0
15.7
12.8
45.6
Northwest Territories
8.6
2.9
10.4
8.2
46.7
Nunavut
6.5
2.6
8.4
6.8
46.8
Source: Statistics Canada, Participation and Activity Limitation Survey, 2006.
Canada
Overall disability rate: 14.3%
Overview of population with disabilities
Table: Population with disabilities
Age group
Total
Mild to moderate
Severe or very severe
Children (0 to 14)
202350
118070
84280
Adults (15 to 64)
2457940
1480860
977080
Seniors (65 and over)
1757590
1057230
700360
Age group: 0 to 4
Population with disabilities who use child care services: 13860 (51.6%)
Age group: 5 to 14
Table: Type of school attended
Regular school
Special school or regular school with special classes
56.9%
43.1%
Age group: 15 to 24
Table: Percentage attending some type of school
With disability
Without disability
61.0%
67.0%
Table: Percentage without highschool degree, not attending school
With disability
Without disability
17.2%
9.8%
Age group: 25 to 54
Table: Average employment income
With disability
Without disability
Men
$39,245
$52,865
Women
$25,678
$34,305
Table: Average total income
With disability
Without disability
Men
$33,701
$52,436
Women
$23,574
$34,421
Table: Labour force participation rate
With disability
Without disability
Men
69.6%
93.4%
Women
63.0%
83.1%
Table: Unemployment rate
With disability
Without disability
Men
8.5%
4.5%
Women
8.7%
5.7%
Age group: 55 to 64
Table: Average total income
With disability
Without disability
Men
$34,920
$58,932
Women
$21,347
$29,710
Table: Labour force participation rate
With disability
Without disability
Men
46.8%
75.5%
Women
38.6%
54.8%
Table: Percentage of people with disabilities who are retired
Men
Women
37.6%
38.2%
Age group: 65 to 74
Table: Average household income
With disability
Without disability
Men
$54,774
$72,006
Women
$58,683
$58,575
Table: Percentage of the population under the low income cut-off (LICO)
With disability
Without disability
6.1%
5.0%
Population with disabilities who receive caregiving: 417700 (58.2%)
Population with disabilities who have unmet caregiving needs: 205890 (28.7%)
Age group: 75 and over
Table: Average household income
With disability
Without disability
Men
$59,159
$61,855
Women
$60,426
$58,823
Table: Percentage of the population under the low income cut-off (LICO)
With disability
Without disability
5.6%
6.4%
Population with disabilities who receive caregiving: 719540 (73.9%)
Population with disabilities who have unmet caregiving needs: 298060 (30.6%)
Newfoundland and Labrador
Overall disability rate: 14.9%
Overview of population with disabilities
Table: Average household income
Age group
Total
Mild to moderate
Severe or very severe
Children (0 to 14)
3010
2010
1000
Adults (15 to 64)
44430
25910
18520
Seniors (65 and over)
27070
15300
11770
Age group: 0 to 4
Population with disabilities who use child care services: 210 (46.6%)
Age group: 5 to 14
Table: Type of school attended
Regular school
Special school or regular school with special classes
57.4%
42.6%
Age group: 15 to 24
Table: Percentage attending some type of school
With disability
Without disability
58.7%
65.9%
Table: Percentage without highschool degree, not attending school
With disability
Without disability
21.5%
13.2%
Age group: 25 to 54
Table: Average employment income
With disability
Without disability
Men
$37,222
$40,370
Women
$21,158
$25,360
Table: Average total income
With disability
Without disability
Men
$27,783
$42,193
Women
$19,033
$26,607
Table: Labour force participation rate
With disability
Without disability
Men
53.3%
88.8%
Women
54.2%
79.4%
Table: Unemployment rate
With disability
Without disability
Men
26.8%
17.4%
Women
24.8%
15.6%
Age group: 55 to 64
Table: Average total income
With disability
Without disability
Men
$22,867
$45,439
Women
$15,634
$22,679
Table: Labour force participation rate
With disability
Without disability
Men
26.2%
61.2%
Women
26.2%
41.9%
Table: Percentage of people with disabilities who are retired
Men
Women
43.6%
39.2%
Age group: 65 to 74
Table: Average household income
With disability
Without disability
Men
$43,787
$46,790
Women
$43,996
$40,299
Table: Percentage of the population under the low income cut-off (LICO)
With disability
Without disability
x
x
Population with disabilities who receive caregiving: 7740 (65.8%)
Population with disabilities who have unmet caregiving needs: 2880 (24.5%)
"x" = suppressed due to low population counts
Age group: 75 and over
Table: Average household income
With disability
Without disability
Men
$43,568
$43,711
Women
$37,539
$38,127
Table: Percentage of the population under the low income cut-off (LICO)
With disability
Without disability
x
x
Population with disabilities who receive caregiving: 11280 (81.4%)
Population with disabilities who have unmet caregiving needs: 4450 (32.1%)
"x" = suppressed due to low population counts
Prince Edward Island
Overall disability rate: 16.3%
Overview of population with disabilities
Table: Population with disabilities
Age group
Total
Mild to moderate
Severe or very severe
Children (0 to 14)
980
620
360
Adults (15 to 64)
11800
7530
4270
Seniors (65 and over)
8980
5730
3250
Age group: 0 to 4
Population with disabilities who use child care services: 80 (42.0%)
Age group: 5 to 14
Table: Type of school attended
Regular school
Special school or regular school with special classes
78.4%
21.6%
Age group: 15 to 24
Table: Percentage attending some type of school
With disability
Without disability
73.6%
62.6%
Table: Percentage without highschool degree, not attending school
With disability
Without disability
16.4%
11.9%
Age group: 25 to 54
Table: Average employment income
With disability
Without disability
Men
$29,897
$36,290
Women
$20,068
$27,670
Table: Average total income
With disability
Without disability
Men
$27,634
$38,962
Women
$21,026
$30,725
Table: Labour force participation rate
With disability
Without disability
Men
69.3%
94.9%
Women
69.3%
89.1%
Table: Unemployment rate
With disability
Without disability
Men
14.4%
7.9%
Women
14.3%
9.9%
Age group: 55 to 64
Table: Average total income
With disability
Without disability
Men
$28,344
$42,165
Women
$23,347
$27,142
Table: Labour force participation rate
With disability
Without disability
Men
43.7%
79.2%
Women
33.7%
62.1%
Table: Percentage of people with disabilities who are retired
Men
Women
38.7%
32.9%
Age group: 65 to 74
Table: Average household income
With disability
Without disability
Men
$47,349
$54,887
Women
$40,813
$46,557
Table: Percentage of the population under the low income cut-off (LICO)
With disability
Without disability
3.6%
2.2%
Population with disabilities who receive caregiving: 2220 (60.1%)
Population with disabilities who have unmet caregiving needs: 910 (24.5%)
Age group: 75 and over
Table: Average household income
With disability
Without disability
Men
$47,619
$45,369
Women
$41,593
$42,717
Table: Percentage of the population under the low income cut-off (LICO)
With disability
Without disability
7.2%
2.5%
Population with disabilities who receive caregiving: 4160 (81.7%)
Population with disabilities who have unmet caregiving needs: 1490 (29.3%)
Nova Scotia
Overall disability rate: 20%
Overview of population with disabilities
Table: Population with disabilities
Age group
Total
Mild to moderate
Severe or very severe
Children (0 to 14)
6530
3760
2780
Adults (15 to 64)
103730
65570
38160
Seniors (65 and over)
68840
43900
24940
Age group: 0 to 4
Population with disabilities who use child care services: 380 (50.4%)
Age group: 5 to 14
Table: Type of school attended
Regular school
Special school or regular school with special classes
64.4%
35.6%
Age group: 15 to 24
Table: Percentage attending some type of school
With disability
Without disability
60.4%
68.1%
Table: Percentage without highschool degree, not attending school
With disability
Without disability
15.7%
10.0%
Age group: 25 to 54
Table: Average employment income
With disability
Without disability
Men
$31,318
$44,061
Women
$22,809
$27,501
Table: Average total income
With disability
Without disability
Men
$29,448
$44,953
Women
$22,347
$28,523
Table: Labour force participation rate
With disability
Without disability
Men
64.2%
92.8%
Women
65.0%
84.9%
Table: Unemployment rate
With disability
Without disability
Men
10.2%
5.9%
Women
9.9%
7.7%
Age group: 55 to 64
Table: Average total income
With disability
Without disability
Men
$35,470
$49,235
Women
$17,429
$24,897
Table: Labour force participation rate
With disability
Without disability
Men
40.1%
72.5%
Women
33.1%
47.9%
Table: Percentage of people with disabilities who are retired
Men
Women
49.3%
35.9%
Age group: 65 to 74
Table: Average household income
With disability
Without disability
Men
$48,933
$58,141
Women
$45,652
$53,904
Table: Percentage of the population under the low income cut-off (LICO)
With disability
Without disability
x
x
Population with disabilities who receive caregiving: 18020 (59.1%)
Population with disabilities who have unmet caregiving needs: 8400 (27.6%)
"x" = suppressed due to low population counts
Age group: 75 and over
Table: Average household income
With disability
Without disability
Men
$42,081
$50,222
Women
$41,941
$50,708
Table: Percentage of the population under the low income cut-off (LICO)
With disability
Without disability
x
x
Population with disabilities who receive caregiving: 29040 (79.2%)
Population with disabilities who have unmet caregiving needs: 10680 (29.1%)
"x" = suppressed due to low population counts
New Brunswick
Overview of population with disabilities
Overall disability rate: 17.2%
Table: Population with disabilities
Age group
Total
Mild to moderate
Severe or very severe
Children (0 to 14)
4680
2910
1770
Adults (15 to 64)
70980
41660
29320
Seniors (65 and over)
46880
29380
17500
Age group: 0 to 4
Population with disabilities who use child care services: 380 (50.4%)
Age group: 5 to 14
Table: Type of school attended
Regular school
Special school or regular school with special classes
70.3%
29.7%
Age group: 15 to 24
Table: Percentage attending some type of school
With disability
Without disability
55.9%
61.2%
Table: Percentage without highschool degree, not attending school
With disability
Without disability
15.5%
13.1%
Age group: 25 to 54
Table: Average employment income
With disability
Without disability
Men
$33,229
$41,809
Women
$21,183
$28,035
Table: Average total income
With disability
Without disability
Men
$31,311
$42,364
Women
$19,176
$28,691
Table: Labour force participation rate
With disability
Without disability
Men
66.7%
91.6%
Women
62.1%
84.3%
Table: Unemployment rate
With disability
Without disability
Men
14.0%
9.5%
Women
7.7%
7.0%
Age group: 55 to 64
Table: Average total income
With disability
Without disability
Men
$25,612
$46,246
Women
$22,416
$23,822
Table: Average total income
With disability
Without disability
Men
43.6%
72.7%
Women
38.3%
51.9%
Table: Percentage of people with disabilities who are retired
Men
Women
42.8%
37.1%
Age group: 65 to 74
Table: Average household income
With disability
Without disability
Men
$45,016
$51,490
Women
$43,192
$47,119
Table: Percentage of the population under the low income cut-off (LICO)
With disability
Without disability
x
x
Population with disabilities who receive caregiving: 11880 (58.8%)
Population with disabilities who have unmet caregiving needs: 6420 (31.8%)
"x" = suppressed due to low population counts
Age group: 75 and over
Table: Average household income
With disability
Without disability
Men
$47,509
$47,764
Women
$39,804
$43,805
Table: Percentage of the population under the low income cut-off (LICO)
With disability
Without disability
x
x
Population with disabilities who receive caregiving: 18800 (77.6%)
Population with disabilities who have unmet caregiving needs: 8250 (34.0%)
"x" = suppressed due to low population counts
Quebec
Overall disability rate: 10.4%
Overview of population with disabilities
Table: Population with disabilities
Age group
Total
Mild to moderate
Severe or very severe
Children (0 to 14)
36980
18910
18070
Adults (15 to 64)
408920
244340
164580
Seniors (65 and over)
322240
181930
140310
Age group: 0 to 4
Population with disabilities who use child care services: 3210 (69.5%)
Age group: 5 to 14
Table: Type of school attended
Regular school
Special school or regular school with special classes
60.6%
39.4%
Age group: 15 to 24
Table: Percentage attending some type of school
With disability
Without disability
59.8%
68.2%
Table: Percentage without highschool degree, not attending school
With disability
Without disability
22.8%
9.2%
Age group: 25 to 54
Table: Average employment income
With disability
Without disability
Men
$29,501
$46,371
Women
$21,741
$32,424
Table: Average total income
With disability
Without disability
Men
$24,959
$45,811
Women
$19,617
$32,753
Table: Labour force participation rate
With disability
Without disability
Men
60.1%
92.2%
Women
56.3%
83.6%
Table: Unemployment rate
With disability
Without disability
Men
9.6%
5.9%
Women
13.6%
6.0%
Age group: 55 to 64
Table: Average total income
With disability
Without disability
Men
$25,336
$47,263
Women
$16,565
$26,149
Table: Labour force participation rate
With disability
Without disability
Men
39.9%
70.9%
Women
25.2%
46.0%
Table: Percentage of people with disabilities who are retired
Men
Women
39.4%
38.8%
Age group: 65 to 74
Average household income
With disability
Without disability
Men
$49,508
$58,156
Women
$55,976
$47,970
Table: Percentage of the population under the low income cut-off (LICO)
With disability
Without disability
10.0%
6.6%
Population with disabilities who receive caregiving: 75260 (60.5%)
Population with disabilities who have unmet caregiving needs: 43580 (35.0%)
Age group: 75 and over
Table: Average household income
With disability
Without disability
Men
$67,717
$51,785
Women
$42,143
$53,749
Table: Percentage of the population under the low income cut-off (LICO)
With disability
Without disability
11.2%
9.0%
Population with disabilities who receive caregiving: 156370 (82.7%)
Population with disabilities who have unmet caregiving needs: 59950 (31.7%)
Ontario
Overall disability rate: 15.5%
Overview of population with disabilities
Table: Population with disabilities
Age group
Total
Mild to moderate
Severe or very severe
Children (0 to 14)
82820
49960
32860
Adults (15 to 64)
1038220
601500
436720
Seniors (65 and over)
732540
430060
302480
Age group: 0 to 4
Population with disabilities who use child care services: 5870 (52.1%)
Age group: 5 to 14
Table: Type of school attended
Regular school
Special school or regular school with special classes
51.6%
48.4%
Age group: 15 to 24
Table: Percentage attending some type of school
With disability
Without disability
67.1%
71.5%
Table: Percentage without highschool degree, not attending school
With disability
Without disability
13.7%
8.4%
Age group: 25 to 54
Table: Average employment income
With disability
Without disability
Men
$42,781
$56,976
Women
$29,069
$37,531
Table: Average total income
With disability
Without disability
Men
$35,671
$55,876
Women
$25,266
$36,861
Table: Labour force participation rate
With disability
Without disability
Men
67.3%
94.2%
Women
61.0%
83.2%
Table: Unemployment rate
With disability
Without disability
Men
8.4%
3.8%
Women
8.7%
6.0%
Age group: 55 to 64
Table: Average total income
With disability
Without disability
Men
$38,336
$64,756
Women
$21,896
$32,243
Table: Labour force participation rate
With disability
Without disability
Men
42.9%
77.5%
Women
39.9%
58.8%
Table: Percentage of people with disabilities who are retired
Men
Women
41.1%
38.0%
Age group: 65 to 74
Table: Average household income
With disability
Without disability
Men
$57,679
$89,660
Women
$65,337
$67,337
Table: Percentage of the population under the low income cut-off (LICO)
With disability
Without disability
5.7%
4.5%
Population with disabilities who receive caregiving: 176040 (58.5%)
Population with disabilities who have unmet caregiving needs: 86450 (28.7%)
Age group: 75 and over
Table: Average household income
With disability
Without disability
Men
$60,441
$71,399
Women
$80,101
$72,424
Table: Percentage of the population under the low income cut-off (LICO)
With disability
Without disability
3.5%
5.9%
Population with disabilities who receive caregiving: 281110 (70.7%)
Population with disabilities who have unmet caregiving needs: 128670 (32.4%)
Manitoba
Overall disability rate: 15.7%
Overview of population with disabilities
Table: Population with disabilities
Age group
Total
Mild to moderate
Severe or very severe
Children (0 to 14)
8290
4680
3610
Adults (15 to 64)
89740
59720
30020
Seniors (65 and over)
71140
43090
28050
Age group: 0 to 4
Population with disabilities who use child care services: 580 (50.9%)
Age group: 5 to 14
Table: Type of school attended
Regular school
Special school or regular school with special classes
67.8%
32.2%
Age group: 15 to 24
Table: Percentage attending some type of school
With disability
Without disability
59.0%
62.1%
Table: Percentage without highschool degree, not attending school
With disability
Without disability
20.0%
14.7%
Age group: 25 to 54
Table: Average employment income
With disability
Without disability
Men
$33,604
$46,252
Women
$25,665
$31,163
Table: Average total income
With disability
Without disability
Men
$29,853
$46,286
Women
$23,372
$31,933
Table: Labour force participation rate
With disability
Without disability
Men
76.2%
93.8%
Women
67.8%
84.1%
Table: Unemployment rate
With disability
Without disability
Men
7.9%
2.5%
Women
5.4%
3.6%
Age group: 55 to 64
Average total income
With disability
Without disability
Men
$38,933
$57,523
Women
$21,401
$27,662
Table: Labour force participation rate
With disability
Without disability
Men
51.0%
80.0%
Women
45.2%
64.3%
Table: Percentage of people with disabilities who are retired
Men
Women
39.6%
42.3%
Age group: 65 to 74
Table: Average household income
With disability
Without disability
Men
$53,592
$63,433
Women
$55,254
$55,524
Table: Percentage of the population under the low income cut-off (LICO)
With disability
Without disability
6.8%
4.8%
Population with disabilities who receive caregiving: 15070 (56.6%)
Population with disabilities who have unmet caregiving needs: 5910 (22.2%)
Age group: 75 and over
Table: Average household income
With disability
Without disability
Men
$47,335
$59,456
Women
$40,759
$42,835
Table: Percentage of the population under the low income cut-off (LICO)
With disability
Without disability
7.9%
6.1%
Population with disabilities who receive caregiving: 30290 (71.7%)
Population with disabilities who have unmet caregiving needs: 12500 (29.6%)
Saskatchewan
Overall disability rate: 16.0%
Overview of population with disabilities
Table: Population with disabilities
Age group
Total
Mild to moderate
Severe or very severe
Children (0 to 14)
6550
4050
2500
Adults (15 to 64)
72630
46270
26360
Seniors (65 and over)
66040
40950
25090
Age group: 0 to 4
Population with disabilities who use child care services: 410 (46.9%)
Age group: 5 to 14
Table: Type of school attended
Regular school
Special school or regular school with special classes
63.3%
36.7%
Age group: 15 to 24
Table: Percentage attending some type of school
With disability
Without disability
52.5%
60.1%
Table: Percentage without highschool degree, not attending school
With disability
Without disability
23.6%
15.2%
Age group: 25 to 54
Table: Average employment income
With disability
Without disability
Men
$33,933
$47,116
Women
$22,599
$30,909
Table: Average total income
With disability
Without disability
Men
$33,009
$47,888
Women
$22,334
$32,430
Table: Labour force participation rate
With disability
Without disability
Men
79.7%
95.4%
Women
66.4%
87.5%
Table: Unemployment rate
With disability
Without disability
Men
8.2%
4.3%
Women
8.4%
3.5%
Age group: 55 to 64
Table: Average total income
With disability
Without disability
Men
$32,111
$51,425
Women
$18,292
$29,718
Table: Labour force participation rate
With disability
Without disability
Men
59.7%
79.9%
Women
45.6%
69.9%
Table: Percentage of people with disabilities who are retired
Men
Women
34.1%
32.7%
Age group: 65 to 74
Table: Average household income
With disability
Without disability
Men
$52,959
$59,413
Women
$46,948
$52,400
Table: Percentage of the population under the low income cut-off (LICO)
With disability
Without disability
3.3%
3.7%
Population with disabilities who receive caregiving: 12580 (51.8%)
Population with disabilities who have unmet caregiving needs: 6180 (25.5%)
Age group: 75 and over
Table: Average household income
With disability
Without disability
Men
$46,479
$50,931
Women
$35,987
$48,554
Table: Percentage of the population under the low income cut-off (LICO)
With disability
Without disability
3.9%
1.9%
Population with disabilities who receive caregiving: 27440 (71.1%)
Population with disabilities who have unmet caregiving needs: 9990 (25.9%)
Alberta
Overall disability rate: 13.6%
Overview of population with disabilities
Table: Population with disabilities
Age group
Total
Mild to moderate
Severe or very severe
Children (0 to 14)
25220
16200
9020
Adults (15 to 64)
255620
166910
88710
Seniors (65 and over)
154980
99370
55610
Age group: 0 to 4
Population with disabilities who use child care services: 1360 (46.1%)
Age group: 5 to 14
Table: Type of school attended
Regular school
Special school or regular school with special classes
55.4%
44.6%
Age group: 15 to 24
Table: Percentage attending some type of school
With disability
Without disability
48.0%
57.4%
Table: Percentage without highschool degree, not attending school
With disability
Without disability
21.0%
13.7%
Age group: 25 to 54
Table: Average employment income
With disability
Without disability
Men
$48,429
$63,384
Women
$24,000
$37,034
Table: Average total income
With disability
Without disability
Men
$44,972
$64,406
Women
$25,064
$38,178
Table: Labour force participation rate
With disability
Without disability
Men
85.3%
94.5%
Women
71.7%
84.3%
Table: Unemployment rate
With disability
Without disability
Men
4.8%
2.5%
Women
4.2%
3.5%
Age group: 55 to 64
Table: Average total income
With disability
Without disability
Men
$41,537
$88,445
Women
$26,387
$34,795
Table: Labour force participation rate
With disability
Without disability
Men
66.6%
84.3%
Women
48.2%
65.3%
Table: Percentage of people with disabilities who are retired
Men
Women
28.8%
37.3%
Age group: 65 to 74
Table: Average household income
With disability
Without disability
Men
$60,548
$78,416
Women
$60,807
$67,299
Table: Percentage of the population under the low income cut-off (LICO)
With disability
Without disability
x
x
Population with disabilities who receive caregiving: 40630 (60.4%)
Population with disabilities who have unmet caregiving needs: 17380 (25.8%)
"x" = suppressed due to low population counts
Age group: 75 and over
Table: Average household income
With disability
Without disability
Men
$57,404
$78,864
Women
$51,313
$51,181
Table: Percentage of the population under the low income cut-off (LICO)
With disability
Without disability
x
x
Population with disabilities who receive caregiving: 59180 (70.4%)
Population with disabilities who have unmet caregiving needs: 22700 (27.0%)
"x" = suppressed due to low population counts
British Columbia
Overall disability rate: 16.0%
Overview of population with disabilities
Table: Population with disabilities
Age group
Total
Mild to moderate
Severe or very severe
Children (0 to 14)
26520
14480
12030
Adults (15 to 64)
2355420
216910
138510
Seniors (65 and over)
256690
166250
90440
Age group: 0 to 4
Population with disabilities who use child care services: 1370 (34.4%)
Age group: 5 to 14
Table: Type of school attended
Regular school
Special school or regular school with special classes
59.3%
40.7%
Age group: 15 to 24
Table: Percentage without highschool degree, not attending school
With disability
Without disability
57.9%
64.1%
Table: Percentage without highschool degree, not attending school
With disability
Without disability
17.1%
7.4%
Age group: 25 to 54
Table: Average household income
With disability
Without disability
Men
$36,520
$52,486
Women
$23,932
$31,059
Table: Average total income
With disability
Without disability
Men
$32,896
$52,414
Women
$23,560
$31,496
Table: Labour force participation rate
With disability
Without disability
Men
75.8%
92.5%
Women
67.8%
79.7%
Table: Unemployment rate
With disability
Without disability
Men
6.5%
3.8%
Women
7.6%
5.0%
Age group: 55 to 64
Table: Average total income
With disability
Without disability
Men
$36,916
$56,878
Women
$24,324
$30,596
Table: Labour force participation rate
With disability
Without disability
Men
52.9%
75.4%
Women
44.1%
55.3%
Table: Percentage of people with disabilities who are retired
Men
Women
27.4%
39.9%
Age group: 65 to 74
Table: Average household income
With disability
Without disability
Men
$54,536
$66,529
Women
$53,766
$61,515
Table: Percentage of the population under the low income cut-off (LICO)
With disability
Without disability
7.9%
4.7%
Population with disabilities who receive caregiving: 57470 (53.6%)
Population with disabilities who have unmet caregiving needs: 27410 (25.6%)
Age group: 75 and over
Table: Average household income
With disability
Without disability
Men
$62,022
$59,958
Women
$58,944
$53,091
Table: Percentage of the population under the low income cut-off (LICO)
With disability
Without disability
5.0%
6.1%
Population with disabilities who receive caregiving: 101130 (71.3%)
Population with disabilities who have unmet caregiving needs: 39050 (27.6%)
Yukon Territory
Overall disability rate: 13.5%
Overview of population with disabilities
Table: Population with disabilities
Age group
Total
Mild to moderate
Severe or very severe
Children (0 to 14)
220
140
80
Adults (15 to 64)
2820
1980
840
Seniors (65 and over)
980
570
410
Age group: 5 to 14
Table: Type of school attended
Regular school
Special school or regular school with special classes
44.4%
55.6%
Age group: 15 to 24
Table: Percentage attending some type of school
With disability
Without disability
65.8%
59.9%
Age group: 25 to 54
Table: Average employment income
With disability
Without disability
Men
$43,842
$51,685
Women
$37,001
$37,561
Table: Average total income
With disability
Without disability
Men
$44,088
$51,786
Women
$35,067
$38,858
Table: Labour force participation rate
With disability
Without disability
81.4%
91.0%
Age group: 55 to 64
Table: Average total income
With disability
Without disability
Men
$53,276
$53,558
Women
$27,445
$43,079
Table: Labour force participation rate
With disability
Without disability
Men
57.6%
86.9%
Women
53.5%
71.4%
Age group: 65 to 74
Table: Average household income
With disability
Without disability
Men
$55,216
$67,409
Women
$50,295
$54,915
Population with disabilities who receive caregiving: 320 (62.9%)
Population with disabilities who have unmet caregiving needs: 130 (26.4%)
Age group: 75 and over
Table: Average household income
With disability
Without disability
Men
$58,834
$50,056
Women
$36,824
$48,969
Population with disabilities who receive caregiving: 300 (70.1%)
Population with disabilities who have unmet caregiving needs: 140 (31.7%)
Northwest Territories
Overall disability rate: 8.6%
Overview of population with disabilities
Table: Population with disabilities
Age group
Total
Mild to moderate
Severe or very severe
Children (0 to 14)
280
160
120
Adults (15 to 64)
2380
1590
790
Seniors (65 and over)
830
500
330
Age group: 5 to 14
Table: Type of school attended
Regular school
Special school or regular school with special classes
80.0%
20.0%
Age group: 15 to 24
Table: Percentage attending some type of school
With disability
Without disability
54.6%
55.9%
Age group: 25 to 54
Table: Average employment income
With disability
Without disability
Men
$53,170
$61,915
Women
$44,759
$46,866
Table: Average total income
With disability
Without disability
Men
$45,453
$60,949
Women
$35,564
$44,829
Table: Labour force participation rate
With disability
Without disability
75.3%
89.1%
Age group: 55 to 64
Table: Average total income
With disability
Without disability
Men
$43,728
$67,854
Women
$33,945
$45,002
Table: Labour force participation rate
With disability
Without disability
Men
61.1%
83.0%
Women
43.4%
73.1%
Age group: 65 to 74
Table: Average household income
With disability
Without disability
Men
$64,819
$73,656
Women
$48,190
$74,776
Population with disabilities who receive caregiving: 260 (67.4%)
Population with disabilities who have unmet caregiving needs: 130 (33.4%)
Age group: 75 and over
Table: Average household income
With disability
Without disability
Men
$34,327
$53,232
Women
$48,189
$39,121
Population with disabilities who receive caregiving: 380 (89.8%)
Population with disabilities who have unmet caregiving needs: 150 (34.6%)
Nunavut
Overall disability rate: 6.5%
Overview of population with disabilities
Table: Population with disabilities
Age group
Total
Mild to moderate
Severe or very severe
Children (0 to 14)
260
190
70
Adults (15 to 64)
1270
990
280
Seniors (65 and over)
370
200
170
Age group: 5 to 14
Table: Type of school attended
Regular school
Special school or regular school with special classes
77.8%
22.2%
Age group: 15 to 24
Table: Percentage attending some type of school
With disability
Without disability
43.3%
47.5%
Age group: 25 to 54
Average employment income
With disability
Without disability
Men
$38,207
$46,972
Women
$34,537
$43,742
Age group: 25 to 54
Table: Average total income
With disability
Without disability
Men
$30,306
$43,805
Women
$34,332
$41,816
Table: Labour force participation rate
With disability
Without disability
59.5%
81.8%
Age group: 55 to 64
Table: Average total income
With disability
Without disability
Men
$43,690
$62,519
Women
$18,517
$41,000
Table: Labour force participation rate
With disability
Without disability
Men
62.6%
81.0%
Women
41.0%
64.8%
Age group: 65 to 74
Table: Average household income
With disability
Without disability
Men
$50,065
$67,025
Women
$49,302
$61,451
Population with disabilities who receive caregiving: 210 (81.4%)
Population with disabilities who have unmet caregiving needs: 120 (45.8%)
Age group: 75 and over
Table: Average household income
With disability
Without disability
Men
$33,090
$62,285
Women
$45,434
$64,212
Population with disabilities who receive caregiving: 70 (75.4%)
Population with disabilities who have unmet caregiving needs: 40 (38.4%)