
2009 Federal Disability Report
Official title: 2009 Federal Disability Report: Advancing the Inclusion of People with Disabilities 2009
Message from the Minister

The Government of Canada is building a stronger and more competitive Canada by providing Canadians with choices that will help them participate and succeed in their communities to improve their overall quality of life.
With that mission in mind, the Government is taking action towards creating greater opportunities for all Canadians, particularly Canadians with disabilities. We are building a country that, more than ever, is becoming accessible for everyone.
Advancing the Inclusion of People with Disabilities 2009 is the seventh annual report on disability issues in Canada. This year’s report presents a portrait of Canadians with disabilities.
This report provides invaluable information to support all levels of government, associations, researchers and non-governmental organizations in designing and planning services to enable people with disabilities to participate fully in society.
The challenges people with disabilities face in their day-to-day lives are numerous and often go unnoticed. Since 2006, the Government of Canada has introduced a number of measures that benefit people with disabilities and their families. These include:
- the new Registered Disability Savings Plan, which helps parents and others to save for the long-term financial security of Canadians with severe disabilities;
- the creation of the Enabling Accessibility Fund with $45 million over three years to help cover the cost of improving physical accessibility for people with disabilities;
- a new Working Income Tax Benefit that includes an additional supplement for low-income working Canadians with disabilities, since they face even greater barriers to workforce participation;
- the establishment of the Canadian Mental Health Commission, which will lead to the development of a national mental health strategy; and
- the exemption of training from the goods and services tax / harmonized sales tax (GST/HST) and the expansion of the list of GST/HST-free medical and assistive devices to include service dogs to help people cope with disabilities or conditions such as autism.
Through Canada’s Economic Action Plan, we are building on these significant investments for people with disabilities.
Our government will continue to work with provincial and territorial partners to ensure that all barriers are removed for everyone in Canada. Our combined efforts make it possible for everyone to participate fully in society.
The Honourable Diane Finley, P.C., M.P.
Minister of Human Resources and Skills Development
About the cover
The image featured on the cover of this report shows nine icons that will be displayed in a variety of situations when supports have been added to assist people with disabilities. You will see the following icons when:

Access is available for people with limited mobility, including wheelchair users.

A telephone device or number is equipped to support a teletypewriter for communication for people who are deaf, hard of hearing or speech-impaired.

A venue provides hearing augmentation or access, which may include induction loop, FM and infrared systems.

A telephone has a handset with amplified sound and/or adjustable volume controls.

A television program or videotape is closed captioned for people who are deaf or hard of hearing.

Sign language interpretation is provided for a lecture, tour, performance, conference or other program.

Attempts have been made to allow access for people who are blind or have low vision; this could be used for guided tours or museum exhibitions, for example.

Printed material is available in Braille.

Services are adapted to meet the needs of people with partial sight.
Foreword
Advancing the Inclusion of People with Disabilities 2009 is the Government of Canada’s seventh annual report on disability. This report looks at the experiences of Canadians with disabilities and notes changes over time.
Following the 2001 and 2006 censuses, surveys were conducted of adults and children who have difficulties with daily living activities, or who indicated that a physical or mental condition or health problem reduces the kind or amount of activities they can do. Footnote *
This report presents a statistical comparison of those surveys, building on Advancing the Inclusion of Persons with Disabilities 2004, which examined disability issues using 29 indicators of progress. This report uses many of the indicators identified in the 2004 report, as well as new indicators.
Advancing the Inclusion of People with Disabilities 2009 explores indicators of change in the following outcome areas:
- Disability supports and services: Required supports and services vary since each person with a disability has unique needs, goals and challenges. Inadequate access to needed supports and services can create unnecessary barriers to inclusion for people with disabilities.
- Education and training: Access to education is often an important measure of full participation in society. Children and adults with disabilities may experience obstacles to education and training, including physical, attitudinal and financial barriers.
- Employment and income: Employment contributes to both economic and social quality of life for working-age adults and is an important measure of inclusion. Canadians with disabilities are likely to have lower incomes than Canadians without disabilities. Access to sufficient income is essential, since higher income is associated with better quality of life and increased participation in society.
- Health and well-being: Health and well-being are fundamental to a full life and full participation in society. Physical, mental and emotional health impact virtually all aspects of people’s lives and are linked to other outcomes such as level of education, employment, income and participation in the community.
Research projects exploring further questions around the situation of Canadians with disabilities are planned, and some are currently underway. Publications examining Aboriginal, age-specific and gender-specific disability issues are also planned.
A complementary publication planned for release in early 2010, Disability in Canada: A 2006 Profile, will present national, provincial and territorial statistics for 2006.
The Government of Canada is pleased to share with you Advancing the Inclusion of People with Disabilities 2009. We look forward to your feedback and to continued collaboration in moving towards the full inclusion of people with disabilities in Canada.
About the data
This report focuses on data from the Participation and Activity Limitation Surveys conducted in 2006 and 2001. These surveys used the Census of Canada as a sampling frame to identify their populations.
The 2006 Census questionnaire included two filter questions on activity limitations. Survey respondents were selected through the responses to these two filter questions and census information on age and geography. The survey repeats the two census disability filter questions and follows them with a series of detailed screening questions on activity limitations. The responses to these questions were used to select individuals for the survey interview, which collected information on the impact of disability on respondents’ everyday activities and other aspects of their life, such as education, employment, leisure and transportation.
The survey sample was 48 000, consisting of approximately 39 000 adults and 9 000 children. The interviews were conducted by telephone, and the interviewers used a computer-assisted collection methodology. Two questionnaires were used, one for adults aged 15 and over and one for children under the age of 15. The interviews for the children’s questionnaire were conducted with the parent or guardian of the child. The overall response rate was 75%.
The population covered by the survey consisted of people residing in private households and certain types of collective households in the ten provinces and three territories. People living in institutions and on First Nations reserves were excluded from the survey.
The 2006 survey followed the groundwork laid by the 1991 Health and Activity Limitation Survey (HALS) and the 2001 survey. The HALS data cannot be compared with the 2001 and 2006 data because of significant differences in sampling plans, the operational definition of the target population and the content of the questionnaires. This report compares findings from the 2006 and 2001 surveys to identify trends in the previous five years.
Methodology for comparison of 2001 and 2006 surveys
The 2006 survey was expanded to include specific groups that were not included in the 2001 survey. Three main groups that were included in 2006 but not in 2001 are:
- People living in the territories.
- People living in off-reserve Aboriginal communities. In 2001, they were surveyed separately under the Aboriginal Peoples Survey.
- People living in non-institutional collective dwellings such as supported living apartment buildings. This does not include people who live in institutional collective dwellings such as nursing homes and palliative care homes.
To allow more accurate statistical comparisons with the 2001 data, the above groups were removed from the 2006 data for the purposes of this report. The adjusted data set will be known as “2006 comparable” data and will be used for all data comparisons throughout this report.
The impact on disability rates resulting from removing the above groups is displayed by age in Chart 0.1. For ages 0 to 64, there is no material impact on the disability rates. For seniors, the overall disability rate drops by 0.2% when the above groups are removed. As a result, the disability rates shown in this report are, on average, slightly understated.
| Age group | 2006 | 2006 Comparable | ||||
|---|---|---|---|---|---|---|
| Total Population | Population with Disabilities | Disability Rate | Total Population | Population with Disabilities | Disability Rate | |
| Total: 0 to 14 | 5 471 350 | 202 350 | 3.7% | 5 408 580 | 200 460 | 3.7% |
| 0 to 4 | 1 656 040 | 27 540 | 1.7% | 1 635 860 | 27 280 | 1.7% |
| 5 to 14 | 3 815 310 | 174 810 | 4.6% | 3 772 720 | 173 180 | 4.6% |
| Total: 15 and over | 25 422 290 | 4 215 530 | 16.6% | 25 172 660 | 4 162 690 | 16.5% |
| 15 to 64 | 21 373 150 | 2 457 940 | 11.5% | 21 175 880 | 2 437 610 | 11.5% |
| 65 and over | 4 049 140 | 1 757 590 | 43.4% | 3 996 790 | 1 725 080 | 43.2% |
| Total: All ages | 30 893 640 | 4 417 880 | 14.3% | 30 581 240 | 4 363 150 | 14.3% |
The impact on disability rates by disability type is similar, as shown below in chart 0.2. Disability types for which seniors have a relatively large incidence rate (agility, hearing, mobility, pain and seeing disabilities) experienced slight rate decreases due to the data adjustment.
| Disability type | 2006 | 2006 Comparable | ||
|---|---|---|---|---|
| Population with Disabilities | Disability Rate | Population with Disabilities | Disability Rate | |
| Agility/Dexterity | 2 856 820 | 9.2% | 2 818 860 | 9.2% |
| Communication | 557 980 | 1.8% | 547 980 | 1.8% |
| Developmental | 207 400 | 0.7% | 205 330 | 0.7% |
| Emotional | 649 780 | 2.1% | 645 760 | 2.1% |
| Hearing | 1 289 410 | 4.2% | 1 264 960 | 4.1% |
| Learning | 752 110 | 2.4% | 746 290 | 2.4% |
| Memory | 495 990 | 1.6% | 491 400 | 1.6% |
| Mobility | 2 946 160 | 9.5% | 2 908 650 | 9.5% |
| Pain | 2 965 650 | 9.6% | 2 928 290 | 9.6% |
| Seeing | 835 960 | 2.7% | 822 810 | 2.7% |
Introduction
This introduction provides highlights of the overall report as well as a brief snapshot of disability in Canada, comparing data from the 2001 and 2006 surveys.
Highlights
Some of the findings highlighted in Advancing the Inclusion of People with Disabilities 2009 include:
General observations
- The overall disability rate in Canada rose from 12.4% in 2001 to 14.3% in 2006. Approximately one in seven Canadians now has a disability. There was an increase of reported disability in all age groups, particularly among adults over 65 (up about 3% to 43.2% in 2006). This increase is largely due to the ageing population and the increase in reported learning disabilities.
- The most common types of disabilities among adults are pain-related, mobility and agility disabilities. These three disability types experienced large incidence rate increases from 2001 to 2006, which is partially attributable to the larger percentage of seniors relative to the total population.
Disability supports and services
- Adults with disabilities were more likely to have their requirements for aids and devices fully met in 2006 than in 2001.
- In 2006, 56.5% of adults with learning disabilities who required aids and devices had their needs fully met, up 17.4% from 2001. However, adults with communication disabilities experienced a drop in their level of met needs, with just over one quarter of those with requirements having their needs fully met in 2006.
Education and training
- Overall rates of inclusion and educational attainment increased between 2001 and 2006, with the majority of people with disabilities obtaining a high school diploma. Education rates also increased by 12.3% since 2001, with 74.6% of working-age adults with disabilities obtaining a high school diploma or higher educational certification.
Employment and income
- Since 2001, the employment rate for working-age Canadians with disabilities increased by 4%, reaching 53.5% in 2006.
- Labour force attachment and the employment rate for people with disabilities increased during the period of economic growth between 2001 and 2006, with growth in full-time year-round employment and in the employment of women with disabilities. However, there continues to be a sizeable gender gap in annual salaries, with women with disabilities earning approximately $11,000 less per year than men with disabilities.
- The gap in total income between adults with and without disabilities increased slightly between 2001 and 2006. However, the gap between seniors with and without disabilities that was present in 2001 decreased by over half.
A snapshot of disability in Canada
There are roughly 4.4 million children and adults with disabilities in Canada. This represents an increase in the overall population reporting a disability from 12.4% in 2001 to 14.3% in 2006. This increase is largely due to the ageing population as well as to an increase in reported learning disabilities.
Disability rates by age group
The disability rates by age group for the 2001 and 2006 comparable data sets are listed in chart 0.3. Approximately one in seven Canadians now has a disability. The disability rate among children aged 5 to 14 has experienced a notable increase (from 4.0% to 4.6%), as has the disability rate among adults of all ages. The disability rate for children aged 0 to 4 remained stable.
| Age group | 2001 | 2006 Comparable | ||||
|---|---|---|---|---|---|---|
| Total Population | Population with Disabilities | Disability Rate | Total Population | Population with Disabilities | Disability Rate | |
| Total: 0 to 14 | 5 546 010 | 180 920 | 3.3% | 5 408 580 | 200 460 | 3.7% |
| 0 to 4 | 1 641 680 | 26 210 | 1.6% | 1 635 860 | 27 280 | 1.7% |
| 5 to 14 | 3 904 330 | 154 710 | 4.0% | 3 772 720 | 173 180 | 4.6% |
| Total: 15 and over | 23 445 760 | 3 420 330 | 14.6% | 25 172 660 | 4 162 690 | 16.5% |
| 15 to 64 | 19 858 350 | 1 968 490 | 9.9% | 21 175 880 | 2 437 610 | 11.5% |
| 65 and over | 3 587 410 | 1 451 840 | 40.5% | 3 996 790 | 1 725 080 | 43.2% |
| Total: All ages | 28 991 770 | 3 601 250 | 12.4% | 30 581 240 | 4 363 150 | 14.3% |
The Canada-wide disability rate for adult women is 17.7% and the rate for adult men is 15.4%. Among children aged 14 and under, 4.6% of boys have an activity limitation, compared to 2.7% of girls.
Disability rates by disability type
The disability rates by disability type for the 2001 and 2006 comparable data sets are listed in charts 0.4 (adults) and 0.5 (children). The most common types of disabilities among adults are pain-related, mobility and agility disabilities. These three disability types experienced large incidence rate increases from 2001 to 2006, which is partially attributable to the larger percentage of seniors relative to the total population.
| Disability type | 2001 | 2006 Comparable | ||
|---|---|---|---|---|
| Population with Disabilities | Disability Rate | Population with Disabilities | Disability Rate | |
| Agility/Dexterity | 2 276 980 | 9.7% | 2 782 160 | 11.1% |
| Communication | 362 720 | 1.5% | 470 510 | 1.9% |
| Developmental | 120 140 | 0.5% | 135 230 | 0.5% |
| Emotional | 522 950 | 2.2% | 586 030 | 2.3% |
| Hearing | 1 038 140 | 4.4% | 1 241 940 | 4.9% |
| Learning | 451 420 | 1.9% | 626 090 | 2.5% |
| Memory | 420 750 | 1.8% | 491 400 | 2.0% |
| Mobility | 2 451 570 | 10.5% | 2 885 820 | 11.5% |
| Pain | 2 376 760 | 10.1% | 2 928 290 | 11.6% |
| Seeing | 594 350 | 2.6% | 803 260 | 3.3% |
The most common types of disabilities for children are learning limitations, communication limitations and developmental delays. The percentage of Canadian children with learning limitations has increased notably from 1.8% to 2.2%.
| Disability type | 2001 | 2006 Comparable | ||
|---|---|---|---|---|
| Population with Disabilities | Disability Rate | Population with Disabilities | Disability Rate | |
| Agility/Dexterity | 31 410 | 0.6% | 36 700 | 0.7% |
| Communication | 66 940 | 1.2% | 77 470 | 1.4% |
| Developmental (5 +) or Delay (0–4) | 64 000 | 1.2% | 70 100 | 1.3% |
| Emotional | 49 140 | 0.9% | 59 730 | 1.1% |
| Hearing | 23 750 | 0.4% | 23 020 | 0.4% |
| Learning | 100 360 | 1.8% | 120 200 | 2.2% |
| Mobility | 21 150 | 0.4% | 22 830 | 0.4% |
| Seeing | 16 600 | 0.3% | 19 550 | 0.4% |
The 2006 comparable data reveal that, among Canadians with disabilities, mild to moderate disabilities (2 624 390 people) are more common than severe to very severe disabilities (1 738 760 people).
Chapter 1: Disability supports and services
This chapter explores how Canadians with disabilities use disability-specific supports and services. These supports and services help people with disabilities carry out daily activities. The analyses focus on selected supports: aids and assistive devices, home modifications, caregivers and help with everyday activity, transportation and access to information.
The types of supports needed vary, as every person with a disability has unique needs, goals and challenges that may influence both requirements and ability to have a given need met. Inadequate access to needed supports can create unnecessary barriers to inclusion for people with disabilities.
The need for certain types of supports, such as home modifications and caregiving, has decreased since 2001. Local and long-distance travel have also decreased, with the aggravation of a person’s condition either causing difficulty travelling or preventing it altogether. Cost continues to be the most common barrier to meeting needs for aids and devices, home modifications, and caregiving.
Indicator areas
Aids and assistive devices
In 2006, over 2.6 million adults and over 87 000 children required a diverse range of aids and assistive devices for daily activities. Examples of aids include hearing aids, grasping tools, voice recognition software and prosthetic limbs. While nearly two thirds of Canadians with disabilities require aids and devices, the level of met needs varies by age, gender, severity of disability and type of disability.
Six out of ten adults with disabilities who require aids and devices have their needs fully met. Another three out of ten adults have partially met needs, and one in ten has no needs met at all. The overall distribution of met needs changed from 2001 to 2006. Adults with disabilities who required aids and devices were more likely to have all of their needs met in 2006.
Chart 1.1 — Level of met needs for adults aged 15 and over with requirements for aids and devices, 2001 and 2006

Chart 1.1 Text Description
This is a vertical bar graph that illustrates the level of met needs for aids and devices of people with disabilities in 2001 and 2006.
The Y axis is measured by percentages and increases by increments of ten from 0 up to 70.
The X axis is comprised of three degrees of met needs for aids and devices: from left to right, ‘All Needs Met’, ‘Some Needs Met’ and ‘No Needs Met’.
Each degree of met needs has two vertical bars, one for 2001 and one for 2006, depicting the percentage of met for aids and devices for each respective year.
The percentage of persons with a disability with All Needs Met for aids and devices is 38.3% in 2001 and 61.2% in 2006.
The percentage of persons with a disability with Some Needs Met for aids and devices is 53.1% in 2001 and 28.9% in 2006.
The percentage of persons with a disability with No Needs Met for aids and devices is 8.6% in 2001 and 9.9% in 2006.
- The table excludes the Yukon, Northwest Territories and Nunavut.
- The sum of the values for each category may differ from the total due to rounding.
- Applicable to adults 15 years of age or older only.
- Percentage is based on number of adults with disabilities.
- The chart uses 2006 data that is comparable to 2001 data.
- Not applicable to children aged 0 to 14.
Source: Participation and Activity Limitation Survey, 2001 and 2006.
| Age group | 2001 | 2006 | ||||||
|---|---|---|---|---|---|---|---|---|
| All needs met | Unmet needs | All needs met | Unmet needs | |||||
| Number | % | Number | % | Number | % | Number | % | |
| 5 to 14 | 50 950 | 58.3 | 36 430 | 41.7 | 38 270 | 43.8 | 49 140 | 56.2 |
| 15 to 64 | 127 580 | 24.3 | 397 420 | 75.7 | 821 160 | 55.8 | 650 080 | 44.2 |
| 65 and over | 270 850 | 52.6 | 244 560 | 47.4 | 782 420 | 68.2 | 365 110 | 31.8 |
- The table uses 2006 data that is comparable to 2001 data.
- Not applicable to children aged 0 to 4.
Source: Participation and Activity Limitation Survey, 2001 and 2006.
The level of met needs also varies by type of disability. Nearly three quarters of adults with mobility limitations who require aids and devices have their needs fully met. From 2001 to 2006, adults with communication disabilities experienced a drop in their level of met needs, with just over one quarter of those who have requirements having their needs fully met in 2006. In contrast, 56.5% of adults with learning disabilities who require aids and devices had their needs fully met in 2006, up from 39.1% in 2001.
Chart 1.3 — Rates of fully met needs by disability type, 2001 and 2006
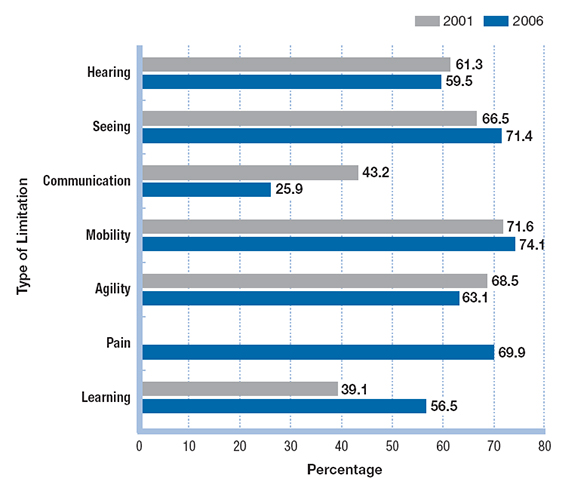
Chart 1.3 Description
This is a horizontal bar graph that illustrates the percentage of persons with disabilities who have fully met needs for aids and devices by type of limitation 2001 and 2006.
The X axis is measured by percentages and increases by increments of ten from 0 up to 80.
The Y axis is comprised of seven disability types: from left to right, Hearing, Seeing, Communication, Mobility, Agility, Pain and Learning.
For each disability type (other then Pain), there are two horizontal bars, one for 2001 and one for 2006, depicting the percentage of persons with disabilities who have fully met needs for aids and devices for each of the respective years.
The percentage of persons with a Hearing disability who have fully met needs for aids and devices is 61.3% in 2001 and 59.5% in 2006.
The percentage of persons with a Seeing disability who have fully met needs for aids and devices is 66.5% in 2001 and 71.4% in 2006.
The percentage of persons with a Communication disability who have fully met needs for aids and devices is 43.2% in 2001 and 25.9% in 2006.
The percentage of persons with a Mobility disability who have fully met needs for aids and devices is 71.6% in 2001 and 74.1% in 2006.
The percentage of persons with an Agility disability who have fully met needs for aids and devices is 68.5% in 2001 and 63.1% in 2006.
The percentage of persons with a Pain disability who have fully met needs for aids and devices is 69.9% in 2006.
The percentage of persons with a Learning disability who have fully met needs for aids and devices is 39.1% in 2001 and 56.5% in 2006.
- The table excludes the Yukon, Northwest Territories and Nunavut.
- The sum of the values for each category may differ from the total due to rounding.
- Applicable to adults 15 years of age or older only.
- Percentage is based on population total of people with disabilities and not the number of needs.
- Pain was not included in PALS 2001.
- The chart uses 2006 data that is comparable to 2001 data.
- Not applicable to children aged 0 to 14.
- Pain-related disabilities were not included in PALS 2001.
Source: Participation and Activity Limitation Survey, 2001 and 2006.
People with more severe disabilities are more likely to have unmet needs than people with less severe disabilities. In 2006, 40.7% of people aged five and over with severe to very severe disabilities had unmet needs for aids and devices. In contrast, 13.8% of those with mild to moderate disabilities had unmet needs.
The most common reason for unmet needs is the cost of many aids and devices: 58.7% of working-age adults and 44.3% of seniors who have unmet needs for aids are unable to meet their needs due to financial barriers. Other common reasons for unmet needs include lack of information on aids and devices as well as lack of availability.
| Reason | Age 15 to 64 | Age 65 and over | ||
|---|---|---|---|---|
| Number | % | Number | % | |
| Total | 650 090 | 365 110 | ||
| Cost (purchase/maintenance) | 381 810 | 58.7 | 161 620 | 44.3 |
| Not available locally | 14 880 | 2.3 | 5 850 | 3.6 |
| Condition not severe enough | 42 460 | 6.5 | 34 160 | 9.4 |
| Don't know where to obtain | 69 080 | 10.6 | 38 410 | 10.5 |
- The table uses 2006 data that is comparable to 2001 data.
- Not applicable to children aged 0 to 14.
- The reason "Not covered by insurance" was removed due to unreliability of the numbers.
Source: Participation and Activity Limitation Survey, 2001 and 2006.
Home modifications
In 2006, approximately 465 000 adults with disabilities (age 15 and over) required some type of home modification to reduce barriers and increase independence within the home environment. Such modifications included grab bars, automatic doors, and widened doorways and hallways. The percentage of adults with disabilities requiring home modifications decreased from 14.1% in 2001 to 11.2% in 2006.
Six out of ten adults with disabilities who have home modification requirements have their needs fully met. Seniors with disabilities are more likely than working-age adults to have all of their home modification needs met; seven out of ten seniors with requirements have their needs fully met, compared to five out of ten working-age adults.
| Needs met | 2001 | 2006 | ||
|---|---|---|---|---|
| Number | % | Number | % | |
| Age 15 to 64 | ||||
| Total | 209 590 | 100.0 | 201 960 | 100.0 |
| All needs met | 102 770 | 49.0 | 99 510 | 49.3 |
| Some needs met | 29 660 | 14.2 | 21 500 | 10.6 |
| No needs met | 77 160 | 36.8 | 80 950 | 40.1 |
| Age 65 and over | ||||
| Total | 273 440 | 100.0 | 262 550 | 100.0 |
| All needs met | 200 680 | 73.4 | 181 530 | 69.1 |
| Some needs met | 24 130 | 8.8 | 16 120 | 6.1 |
| No needs met | 48 630 | 17.8 | 64 900 | 24.7 |
- The table uses 2006 data that is comparable to 2001 data.
- The sum of the values for each category may differ from the total due to rounding.
- Not applicable to children aged 0 to 14.
Source: Participation and Activity Limitation Survey, 2001 and 2006.
Of adults with disabilities aged 15 and over, women are more likely than men to require home modifications (13.3% versus 8.5%). Comparison by age and gender shows that 17.9% of senior women with disabilities require home modifications, compared to only 9.9% of working-age women with disabilities.
Although the overall requirement for home modifications decreased between 2001 and 2006, the number of adults with an unmet need for elevators or lift devices within the home increased from 39 620 to 59 020. The most common unmet home modification need in 2001 was grab bars or bath lifts; the number of adults with this unmet need dropped from 87 480 in 2001 to 49 150 in 2006.
| Unmet need | 2001 | 2006 | ||
|---|---|---|---|---|
| Number | % | Number | % | |
| Total | 179 590 | 183 470 | ||
| Automatic or easy–to–open doors | 27 960 | 15.60 | 15 050 | 8.2 |
| Elevator or lift device | 39 620 | 22.1 | 59 020 | 32.2 |
| Grab bars or a bath lift | 87 480 | 48.7 | 49 150 | 26.8 |
| Lowered counters in the kitchen | 17 890 | 10.0 | 6 050 | 3.3 |
| Ramps or street–level entrances | 52 540 | 29.3 | 42 960 | 23.4 |
| Visual alarms or audio warning | 13 770 | 7.7 | 3 120 | 1.7 |
| Widened doorways or hallways | 20 780 | 11.6 | 7 120 | 3.9 |
| Other special features | 57 710 | 32.1 | 54 480 | 29.7 |
- The table uses 2006 data that is comparable to 2001 data.
- Respondents could choose more than one option.
- Not applicable to children aged 0 to 14.
Source: Participation and Activity Limitation Survey, 2001 and 2006.
Cost is the main reason home modification needs are not met. In 2006, two out of ten adults with disabilities who had a requirement (20.1%) were not able to obtain home modifications due to cost. A larger percentage of working-age adults with disabilities have difficulty affording required home modifications than seniors with disabilities (25.8% versus 15.7%). Other reasons for unmet home modification needs include being on a waitlist for modifications or not having the features recommended or approved by a health professional.
Caregivers and help with everyday activities
In 2006, over 2.65 million adults with disabilities (age 15 and over) required help with at least one everyday activity, such as getting dressed, cleaning or cooking. The percentage of adults with disabilities who required assistance remained stable: this figure was 63.4% in 2001 and 63.7% in 2006.
The 2001 and 2006 surveys were restricted to people living in non‑institutional housing; adults who live in nursing homes and palliative care homes were not included. In addition, while the 2006 survey included people living in non-institutional collective dwellings (such as supported living apartments), this group was not included in the 2001 survey. As a result, the caregiving data collected through these surveys are best interpreted as being representative of adults who are living in their own homes within their communities.
Both informal and formal caregivers are sources of support for help with everyday activities. Informal caregivers include family members and friends of people with disabilities. Formal caregivers typically encompass paid caregivers accessed through organizations. Family members tend to make up the greatest network of support for people with disabilities.
Many people with disabilities receive help with everyday activities from multiple sources. A total of 2 440 570 adults with disabilities (age 15 and over) receive some type of help with everyday activities. Eight out of ten adults with disabilities who receive help with at least one everyday activity rely on family members for assistance (82.4%). In addition, 13.5% receive help from friends, neighbours or co-workers; 13.1% receive help from organisations; and 10.6% receive help from paid employees or workers.
Seniors with disabilities are more likely than working-age adults to receive help with at least one everyday activity (64.8% versus 54.3%). Women with disabilities are more likely than men to receive help with a daily activity (67.4% versus 47.9%).
| Type of caregiver | 2001 | 2006 | ||||||
|---|---|---|---|---|---|---|---|---|
| Men | Women | Men | Women | |||||
| Number | % | Number | % | Number | % | Number | % | |
| Age 15 to 64 | ||||||||
| Total receiving help | 477 390 | 730 670 | 515 650 | 807 800 | ||||
| Family living in same residence | 325 040 | 68.1 | 552 360 | 75.6 | 354 890 | 68.8 | 600 400 | 74.3 |
| Family not living in same residence | 177 350 | 37.1 | 275 880 | 37.8 | 145 600 | 28.2 | 232 180 | 28.7 |
| Friends or neighbours | 150 470 | 31.5 | 178 990 | 24.5 | 86 310 | 16.7 | 116 820 | 14.5 |
| Organization or agency | 75 290 | 15.8 | 112 520 | 15.4 | 57 440 | 11.1 | 66 540 | 8.2 |
| Age 65 and over | ||||||||
| Total receiving help | 376 310 | 683 760 | 381 750 | 735 380 | ||||
| Family living in same residence | 214 770 | 57.1 | 336 520 | 49.2 | 215 280 | 56.4 | 356 880 | 48.5 |
| Family not living in same residence | 170 710 | 45.4 | 333 610 | 48.8 | 146 200 | 38.3 | 322 430 | 43.8 |
| Friends or neighbours | 82 360 | 21.9 | 137 140 | 20.1 | 45 910 | 12.0 | 79 810 | 10.9 |
| Organization or agency | 114 990 | 30.6 | 246 500 | 36.1 | 67 360 | 17.6 | 127 510 | 17.3 |
- The table uses 2006 data that is comparable to 2001 data.
- Respondents could choose more than one option.
- Not applicable to children aged 0 to 14.
Source: Participation and Activity Limitation Survey, 2001 and 2006.
Just over half of all adults with disabilities who require help with at least one everyday activity have their caregiving needs fully met. The proportion of people with all needs met declined between 2001 and 2006.
| Needs met | 2001 | 2006 | ||
|---|---|---|---|---|
| Number | % | Number | % | |
| Age 15 to 64 | ||||
| Total | 1 195 420 | 100.0 | 1 464 500 | 100.0 |
| All needs met | 744 290 | 62.3 | 777 060 | 53.1 |
| Some needs met | 360 610 | 30.2 | 546 080 | 37.3 |
| No needs met | 90 520 | 7.6 | 141 360 | 9.7 |
| Age 65 and over | ||||
| Total | 972 720 | 100.0 | 1 188 410 | 100.0 |
| All needs met | 647 240 | 66.5 | 692 020 | 58.2 |
| Some needs met | 292 050 | 30.0 | 425 110 | 35.8 |
| No needs met | 33 430 | 3.4 | 71 280 | 6.0 |
- The table uses 2006 data that is comparable to 2001 data.
- The sum of the values for each category may differ from the total due to rounding.
- Not applicable to children aged 0 to 14.
Source: Participation and Activity Limitation Survey, 2001 and 2006.
Severity of disability is a strong predictor of caregiving need: 85.6% of adults (age 15 and over) with severe to very severe disabilities require caregiving assistance, while 49.3% of adults with mild to moderate disabilities require assistance. Adults with severe to very severe disabilities are more likely to have their caregiving needs only partially met, whereas adults with mild to moderate disabilities are more likely to have their needs fully met.
Cost is the most common reason for experiencing difficulty in obtaining assistance with daily activities. Other barriers to obtaining required help include delays in obtaining assistance and difficulty finding qualified help.
Adults with severe or very severe disabilities who receive help are much more likely to have difficulty making the necessary arrangements than people with mild or moderate disabilities (19.7% versus 6.5%).
| Reason | 2001 | 2006 | ||||||
|---|---|---|---|---|---|---|---|---|
| Age 15 to 64 | Age 65 and over | Age 15 to 64 | Age 65 and over | |||||
| Number | % | Number | % | Number | % | Number | % | |
| Total | 140 700 | 73 740 | 211 800 | 122 390 | ||||
| Difficulty finding qualified help | 49 100 | 34.9 | 30 950 | 42.0 | 62 900 | 29.7 | 44 290 | 36.2 |
| Delay in obtaining assistance | 69 750 | 49.6 | 33 220 | 45.1 | 74 200 | 35.0 | 34 460 | 28.2 |
| Did not know where to look for help | 41 460 | 29.5 | 13 150 | 17.8 | 48 230 | 22.8 | 35 730 | 29.2 |
| Too expensive | 69 070 | 49.1 | 32 050 | 43.5 | 84 430 | 39.9 | 47 550 | 38.9 |
| Other | 56 760 | 40.3 | 22 370 | 30.3 | 86 300 | 40.7 | 41 550 | 33.9 |
- The table uses 2006 data that is comparable to 2001 data.
- Respondents could choose more than one option.
- Not applicable to children aged 0 to 14.
Source: Participation and Activity Limitation Survey, 2001 and 2006.
Transportation – Local and long-distance travel
Access to transportation is critical for full participation in society. Most Canadians use some form of transportation to undertake daily activities such as going to work, running errands, participating in leisure activities or being involved in their communities. For people with disabilities, comfortable travel is often influenced by the availability of accessible modes of transportation.
Local travel
In 2006, 86.3% of adults with disabilities (age 15 and over) travelled locally using various modes of transportation such as cars, buses or taxis to move around their environment for personal or business reasons. Most people with disabilities prefer to use a personal car for transportation; eight out of ten adults with disabilities (79.2%) travel in cars either as drivers or as passengers.
While most adults with disabilities do access or use transportation, in 2006, approximately 270 000 adults with disabilities experienced difficulty with riding in a car as a passenger, and nearly 190 000 had difficulty using public transportation. Many people with disabilities experience difficulty with travel because they have trouble boarding the modes of transportation available to them. Those who are able to board vehicles often experience further difficulty because the process of travelling aggravates their health condition.
Some people with disabilities are unable to use any mode of transportation. Of the total population of adults with disabilities, 4.1%—or approximately 170 000 adults—consider themselves to be housebound. Similarly to those who do travel but experience difficulties, six out of ten housebound adults with disabilities (57.6%) are housebound because travel will aggravate their condition or health problem. Other common reasons for adults being housebound include preferring to stay home, needing assistance once arriving at their destination, and not having an attendant or companion to accompany them.
| Reason | Number | % |
|---|---|---|
| Total | 170 230 | |
| Accessible transportation is not available | 20 970 | 12.3 |
| Dependent on non-portable aids | 13 660 | 8.0 |
| Do not feel safe when leaving home | 32 320 | 19.0 |
| No attendant or companion to go with | 38 040 | 22.3 |
| Need assistance once arriving at destination | 41 210 | 24.2 |
| Condition or health problem aggravated upon going out | 98 060 | 57.6 |
| Prefer not to go out | 53 520 | 31.4 |
| Other | 31 910 | 18.7 |
- The table uses 2006 data that is comparable to 2001 data.
- Respondents could choose more than one option.
- Not applicable to children aged 0 to 14.
Source: Participation and Activity Limitation Survey, 2006.
Long-distance travel
In 2006, over half (54.0%) of adults with disabilities (age 15 and over) travelled via airplanes or trains in order to take a long-distance trip for personal or business reasons. This percentage decreased slightly from 59.7% in 2001.
Eight out of ten adults with disabilities who travel long distances use personal cars (79.1%). The next most common mode of long-distance travel is by airplane: three out of ten adults who travel long distances use airplanes (33.7%).
In 2006, 9.9% of adults with disabilities had difficulty with long-distance travel and 5.0% were completely prevented from travelling long distances. Working-age adults are more likely than seniors to experience difficulty with long-distance travel (13.2% versus 5.3%). In contrast, seniors are more likely than working-age adults to be completely prevented from travelling long distances (4.3% versus 6.0%).
Adults with severe to very severe disabilities experience more difficulty travelling long distances than those with mild to moderate disabilities (15.3% versus 6.4%). In addition, adults with severe to very severe disabilities are more likely to be prevented from travelling long distances (10.0% versus 1.7%).
Similarly to local travel, the most common reason for experiencing difficulty with long-distance travel is that available modes of transportation aggravate conditions. This is also the most common reason for being completely prevented from travelling long distances.
| Reason | Number | % |
|---|---|---|
| Total | 208 540 | |
| Boarding or disembarking | 65 880 | 31.6 |
| Hearing announcements | 17 120 | 8.2 |
| Lack of appropriate transportation to and from terminal or station | 28 570 | 13.7 |
| Moving around terminal or station | 49 350 | 23.7 |
| Need an attendant to help | 38 490 | 18.5 |
| Ride aggravates condition | 134 990 | 64.7 |
| Seating on board | 42 110 | 20.2 |
| Seeing signs or notices | 29 190 | 14.0 |
| Too costly | 41 020 | 19.7 |
| Transporting wheelchair or other specialized aids | 33 300 | 16.0 |
| Unsupportive staff | 33 740 | 16.2 |
| Washroom facilities | 39 870 | 80.8 |
| Other reason | 51 700 | 24.8 |
- The table uses 2006 data that is comparable to 2001 data.
- Respondents could choose more than one option.
- Not applicable to children aged 0 to 14.
Source: Participation and Activity Limitation Survey, 2006.
Access to information
Barriers to accessing information can be overcome through the use of alternative format materials. A variety of technological aids and devices as well as other supports and services are available.
Many people with disabilities use the Internet to receive up-to-date information. In 2006, almost 1.9 million adults with disabilities (age 15 and over) used the Internet at least once in the past 12 months (44.7%). Working-age adults with disabilities are more likely to use the Internet than seniors (62.2% versus 19.8%).
People with different types of disabilities have varied requirements for accessing information. For example, large-print and Braille reading materials are two alternative formats for text that benefit many adults with sight limitations. In 2006, approximately 101 000 adults with sight limitations used large-print materials and 6 000 adults used Braille reading materials. In addition, 36 000 adults with learning disabilities make use of software organizational tools, and approximately 55 000 adults with hearing limitations use closed captioning. Closed captioning allows people with hearing disabilities to read spoken dialogue in television programs.
Chapter 2: Education and training
This chapter looks at how Canadians with disabilities access education and work-related training. Access to education is an important measure of full participation in society. Improving access to education increases access to employment and income. This chapter examines important indicators of access, including education supports, barriers to education and highest level of education reached, for three key age groups: children, youth and working-age adults.
Despite the importance of education in ensuring the inclusion of people with disabilities, both children and adults experience barriers to formal education and training. These barriers can take physical, attitudinal and financial forms among others. With sufficient supports, people with disabilities can access formal and informal education.
Although some children and adults with disabilities continue to face barriers to formal education and training, overall rates of inclusion and educational attainment have increased between 2001 and 2006. Education rates have increased since 2001, with the majority of people with disabilities obtaining a high school diploma.
Indicator areas
Children aged 5 to 14
In 2006, 165 880 children with disabilities aged 5 to 14 were attending school or being tutored at home through the school system. The percentage of children with disabilities enrolled in formal education did not change between 2001 and 2006.
Eight out of ten children with disabilities (83.9%) attend mainstream public or private schools. Of these children, 23.4% were enrolled in schools with special education classes. Another 7.4% of children with disabilities attend special education schools.
Chart 2.1 — School attendance for children aged 5 to 14, 2001 and 2006

Chart 2.1 Description
This is a vertical bar graph that illustrates the school attendance of children with disabilities, aged 5 to 14, by type of school in 2001 and 2006.
The Y axis is measured by percentages and increases by increments of ten from 0 up to 70.
The X axis is comprised of three types of school: from left to right, ‘Special Education School’, ‘Regular School’, ‘Regular School with Special Education Classes’ and ‘Other’.
Each type of school has two vertical bars, one for 2001 and one for 2006, depicting the percentage of children with disabilities attending the specific type of school for each respective year.
The percentage of children with a disability attending a Special Education School is 6.1% in 2001 and 7.4% in 2006.
The percentage of children with a disability attending a Regular School is 61.8% in 2001 and 60.5% in 2006.
The percentage of children with a disability attending a Regular School with Special Education Classes is 24.8% in 2001 and 23.4% in 2006.
The percentage of children with a disability attending Other is 2.2% in 2001 and 2.5% in 2006.
- The table excludes the Yukon, Northwest Territories and Nunavut.
- The sum of the values for each category may differ from the total due to rounding.
- Applicable to children 5 to 14 years of age only.
- The chart uses 2006 data that is comparable to 2001 data.
- Applicable to children 5 to 14 years of age only.
- Percentages exclude children who are tutored at home or are not enrolled in school.
Source: Participation and Activity Limitation Survey, 2001 and 2006.
A small group of nearly 4 000 children with disabilities neither attend school nor have school-provided tutoring support at home. Reasons young children are prevented from accessing school include a lack of local special education schools, insufficient care supports at school, and difficulty attending school due to the child’s condition or health problem.
Learning, chronic and communication disabilities are the three most commonly reported disabilities among children aged 5 to 14. Of the 121 080 children aged 5 to 14 who have learning limitations, 39.2% attend special education schools or mainstream schools with special education classes. Of the 78 240 children with communication limitations, 44.3% attend special education schools or mainstream schools with special education classes.
Boys and girls with learning limitations are equally likely to attend special education schools or schools with special education classes. However, while more boys have communication disabilities than girls, a smaller percentage of boys with communication disabilities are enrolled in special education schools or classes than girls (42.5% versus 48.4%).
Children with disabilities in special education schools or regular schools often require educational aids. In 2006, 85.4% of children in special education schools used one or more educational aids or devices, and 24.5% had unmet needs for educational aids. Unmet needs also vary by severity of disability. Children with severe to very severe disabilities in special education schools were more likely to have an unmet need than children with mild to moderate disabilities (28.7% versus 18.1%).
Some children in mainstream and special education schools (5.7%) also required various building features or equipment in order to attend school. Of children with these requirements, 29.3% had unmet needs. Since 2001, the need for building features or equipment has decreased (from 6.6%), but unmet needs have increased (from 23.7%).
Youth aged 15 to 24
In 2006, 76.8% of youth with disabilities aged 15 to 19 and 30.0% of youth with disabilities aged 20 to 24 were attending school.
Many youth with disabilities experience barriers directly related to their disability when completing their education; 19.7% of youth with disabilities have experienced long school interruptions because of their disability, and 11.3% of youth have to leave their communities in order to attend school because of their disability.
In addition, youth with disabilities adopt many coping mechanisms that may affect their educational path. A total of 58 160 youth aged 15 to 24 (30.0%) have attended a special education school or school with special education classes at some point in their childhood or youth. In addition, 29.8% of youth with disabilities have taken fewer courses in school because of their disability, and 2.7% of youth have attended school part time. Taking fewer courses at a time can lengthen the time it takes to complete educational requirements.
Of youth with disabilities, 16.1% have discontinued their education because of their condition. Withdrawing from educational studies can have a life-long impact; higher educational attainment is linked to improved employment opportunities and higher income.
Chart 2.2 — Effects of disability on education for youth aged 15 to 24, 2001 and 2006
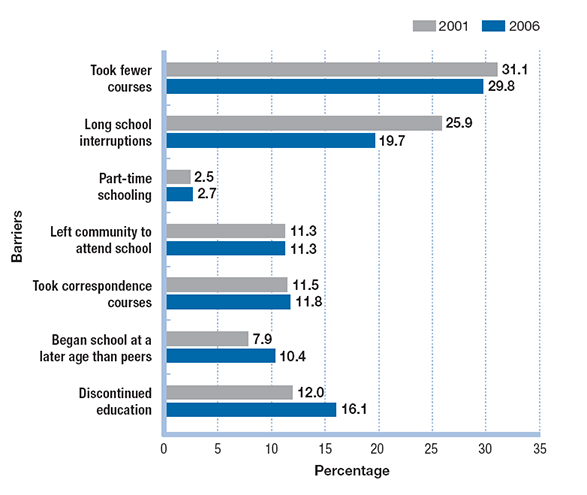
Chart 2.2 Description
This is a horizontal bar graph that illustrates the effects of disability on education for youth, aged 15 to 24 in 2001 and 2006.
The X axis is measured by percentages and increases by increments of five from 0 up to 35.
The Y axis is comprised of seven effects on education. On the Y axis from top to bottom, the types of barriers are:
- Took fewer courses
- Long school interruptions
- Part-time schooling
- Left community to attend school
- Took correspondence courses
- Began school at a later age than peers
- Discontinued education
Each barrier has two horizontal bars, one for 2001 and one for 2006, depicting the percentage of youth who have had the following effects on their education due to their disability for each respective year.
The percentage of youth with a disability who have had to take fewer courses is 31.1% in 2001 and 29.8% in 2006.
The percentage of youth with a disability who have had long school interruptions is 25.9% in 2001 and 19.7% in 2006.
The percentage of youth with a disability who have had part time schooling is 2.5% in 2001 and 2.7% in 2006.
The percentage of youth with a disability who have had to leave their community to attend school is 11.3% in 2001 and 11.3% in 2006.
The percentage of youth with a disability who have had to take correspondence courses is 11.5% in 2001 and 11.8% in 2006.
The percentage of youth with a disability who have had to begin school at a later age then peers is 7.9% in 2001 and 10.4% in 2006.
The percentage of youth with a disability who have had to discontinue their education is 12.0% in 2001 and 16.1% in 2006.
- The table excludes the Yukon, Northwest Territories and Nunavut.
- The sum of the values for each category may differ from the total due to rounding.
- Applicable to children 15 to 24 years of age only.
- The chart uses 2006 data that is comparable to 2001 data.
- The sum of the values for each category may differ from the total due to rounding.
- Applicable to youth 15 to 24 years of age only.
Source: Participation and Activity Limitation Survey, 2001 and 2006.
Working-age adults aged 25 to 64
The education chapter defines working-age adults with disabilities as those aged 25 to 64. This grouping is different from the 15 to 64 age range used for working-age adults elsewhere in this report. The education chapter uses different age ranges to better capture the rate of post-secondary education attainment.
Overall education rates have increased: in 2006, 74.6% of working-age adults with disabilities had a high school diploma or higher educational certification. However, adults with disabilities are less likely to complete high school than adults without disabilities. In 2006, 25.4% of working-age adults with disabilities (age 25 to 64) had not received any certificate for school completion, compared to 13.5% of working-age adults without disabilities. This percentage improved from 38.2% for those with disabilities and from 22.5% for those without disabilities in 2001.
Adults with disabilities are more likely than adults without disabilities to have trade diplomas and certificates (14.7% versus 12.0%), but are less likely to have bachelor’s degrees (8.3% versus 15.3%).
| Level of education | People with disabilities | People without disabilities | ||
|---|---|---|---|---|
| Number | % | Number | % | |
| Total | 2 244 010 | 100.0 | 14 830 000 | 100.0 |
| No certificate | 569 610 | 25.4 | 2 002 340 | 13.5 |
| High school diploma | 545 720 | 24.3 | 3 545 970 | 23.9 |
| Trades or registered apprenticeship certificate | 329 590 | 14.7 | 1 785 910 | 12.0 |
| College, CEGEP or university certificate below bachelor’s | 488 730 | 21.8 | 3 933 010 | 26.5 |
| Bachelor's degree | 187 300 | 8.3 | 2 274 630 | 15.3 |
| Graduate degree | 122 480 | 5.5 | 1 289 890 | 8.7 |
- The table uses 2006 data that is comparable to 2001 data.
- The sum of the values for each category may differ from the total due to rounding.
- Applicable to adults 25 to 64 years of age only.
Source: Participation and Activity Limitation Survey, 2006.
Working-age women with disabilities are more likely than men to pursue a degree or diploma rather than a trade. In 2006, 24.8% of women with disabilities had college diplomas, compared to 18.3% of men with disabilities, while 19.2% of men had trade or apprenticeship certificates, compared to 10.8% of women.
Chart 2.4 — Educational attainment by gender for adults aged 25 to 64, 2006
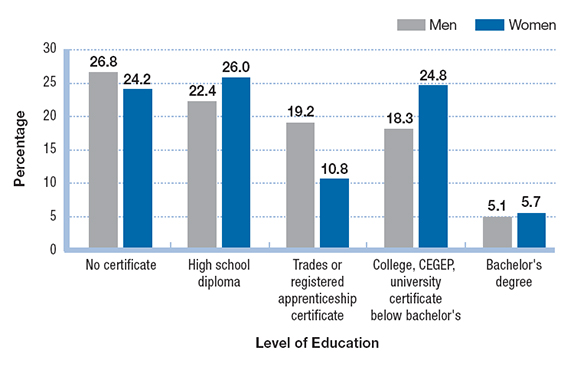
Chart 2.4 Description
This is a vertical bar graph that illustrates the level of educational attainment of adults with disabilities, aged 25 to 64, by gender in 2006.
The Y axis is measured by percentages and increases by increments of five from 0 up to 30.
The X axis is comprised of five levels of educational attainment. On the X axis from left to right, the levels of educational attainment are:
- No Certificate
- High School Diploma
- Trades or Registered Apprenticeship Certificate
- College, CEGEP, University Certificate below a Bachelor’s
- Bachelor’s Degree
Each level of educational attainment has two vertical bars, one for men and one for women, depicting the gender-specific percentage of educational attainment of adults with a disability in 2006.
The gender-specific percentage of adults with disabilities with No Certificate is 26.8% for men and 24.2% for women in 2006.
The gender-specific percentage of adults with disabilities with a High School Diploma is 22.4% for men and 26.0% for women in 2006.
The gender-specific percentage of adults with disabilities with a Trades or Registered Apprenticeship Certificate rates is 19.2% for men and 10.8% for women in 2006.
The gender-specific percentage of adults with disabilities with a College, CEGEP or a University Certificate below a Bachelor’s rates is 18.3% for men and 24.8% for women in 2006.
The gender-specific percentage of adults with disabilities with a Bachelor’s Degree rates is 5.1% for men and 5.7% for women in 2006.
- The table excludes the Yukon, Northwest Territories and Nunavut.
- The sum of the values for each category may differ from the total due to rounding.
- Applicable to adults 25 to 64 years of age only.
- The chart uses 2006 data that is comparable to 2001 data.
- The sum of the values for each category may differ from the total due to rounding.
- Applicable to adults 25 to 64 years of age only.
Source: Participation and Activity Limitation Survey, 2006.
Education is a life-long journey for many Canadians. Once formal degrees and certificates are obtained through colleges and universities, ongoing informal and formal workplace training is a common job-related requirement. Job-related training within the workplace is important for both career maintenance and career advancement.
Formal workplace training can include classroom or off-site training subsidized by the employer, while informal training can take place on the job through activities such as mentoring. Computer instruction and career guidance are examples of workplace training.
One quarter of employed adults with disabilities (26.1%) have received formal workplace training in the past five years, and one quarter (25.3%) have received informal training. Employed adults aged 25 to 54 were more likely to have received at least one type of workplace training than those aged 55 to 64 (48.7% versus 35.1%).
Of adults with disabilities who wanted to take workplace training, 10.5% have been prevented from taking work-related courses because of their condition. Cost was also a factor for 26.0% of this group.
| Reason | Number | Percent |
|---|---|---|
| Total who wanted to take workplace training | 119 260 | |
| Location was not physically accessible | 15 960 | 13.4% |
| Courses were not adapted to the needs of condition | 5 520 | 4.6% |
| Denied requested courses by employer | 7 720 | 6.5% |
| Condition | 12 540 | 10.5% |
| Inadequate transportation | 5 150 | 4.3% |
| Too costly | 30 980 | 26.0% |
| Too busy | 37 450 | 31.4% |
| Other | 21 710 | 18.2% |
- The table uses 2006 data that is comparable to 2001 data.
- Respondents could select more than one option.
- Applicable to adults 15 to 64 years of age only.
Source: Participation and Activity Limitation Survey, 2006.
Chapter 3: Employment
This chapter examines employment among working-age adults with disabilities. Since employment is linked to higher levels of income and to many measures of quality of life, it is an important indicator of inclusion. Employment also provides opportunities for interaction with others in the community: unpaid work / volunteering can serve a similar role. This chapter explores changes between 2001 and 2006 using the following indicators: employment rates, year-round employment employed all year, workplace accommodations and unpaid work / volunteering.
The employment chapter defines working-age adults with disabilities as those aged 15 to 64.
Labour force attachment and the employment rate for people with disabilities both increased during the period of economic growth between 2001 and 2006, and larger growth occurred among people with disabilities than among people without disabilities. During the same period, there was a significant increase in year-round full-time employment, particularly for women with disabilities. However, across all of these measures, people without disabilities continue to have stronger labour force attachment than people with disabilities.
Indicator areas
Employment rate
“Labour force”: Working-age adults who are participating or are available to participate in the labour market, whether or not they are employed.
“Not in the labour force”: Working-age adults who are unwilling or unable to participate in the labour market. This includes full-time students, people who are retired and stay-at-home parents.
Between 2001 and 2006, the employment rate for working-age Canadians with disabilities increased from 49.3% to 53.5%. In comparison, the employment rate for working-age Canadians without disabilities increased from 73.8% to 75.1% over the same period.
Adults with disabilities are more likely than adults without disabilities to not participate in the labour force. There are many reasons why adults with disabilities are underrepresented in the labour force. Some are physically unable to work due to their condition; others have left the labour force after facing barriers such as inaccessible workplaces or unsupportive work environments; and still others have voluntarily left the workplace to care for children or enter retirement.
The employment rate for women with disabilities is 52.1%; the employment rate for men with disabilities is 55.5%. This gap is much smaller than the gender gap seen among men and women without disabilities.
To make the statistics of one population comparable with those of another, age standardization is sometimes used. For instance, since older people are more likely to have disabilities, the collective average age of people with disabilities is higher than that of people without disabilities. In addition, older people are more likely to have developed stronger attachments to the labour force over the course of their work history. Because of these two factors, the employment situation for people with disabilities appears stronger than it really is. In order to remove the age effect on the employment rate, the population of working-age adults with disabilities is standardized to match the age structure of the population without disabilities. This allows the comparison of the two groups to reflect the actual differences between them rather than the differences in their age structures.
| Disability status | Number | Employment Rate |
|---|---|---|
| With disabilities | ||
| Both genders | 1 250 720 | 53.5 |
| Men | 617 160 | 55.5 |
| Women | 633 560 | 52.1 |
| Without disabilities | ||
| Both genders | 14 069 780 | 75.1 |
| Men | 7 440 200 | 80.2 |
| Women | 6 629 590 | 70.1 |
- The table uses 2006 data that is comparable to 2001 data.
- Applicable to adults 15 to 64 years of age only.
- Age-standardized employment rates.
Source: Participation and Activity Limitation Survey, 2006.
Employment rates also vary by types of limitations. In 2006, working-age adults with hearing disabilities had the highest employment rate (57.7%), this rate increased from 53.1% in 2001. Working-age adults with learning disabilities experienced the largest increase in employment rate between 2001 and 2006 (from 32.5% in 2001 to 41.8% in 2006).
Year-round employment
Employment stability is an important indicator of quality of life. Year-round full-time work can provide income stability for people with and without disabilities. In 2006, the majority of working-age adults with disabilities who participated in the labour force were employed full time year-round.
Among working-age adults with disabilities who are employed, just over half (54.7%) are employed full time year-round; three out of ten (28.0%) are employed full time but only part of the year; and one out of ten (10.2%) is employed part time year-round.
While men with disabilities remain more likely to have year-round full-time year-round employment than women with disabilities, women experienced more growth in this area between 2001 and 2006; the number of women with year-round full-time year-round employment increased from 200 490 to 313 510, while the number of men increased from 289 100 to 371 100.
Employed working-age adults with more severe disabilities are less likely to work full time year-round: 57.9% of those with mild to moderate disabilities were employed full time year-round, compared to 46.8% of those with severe to very severe disabilities. Since 2001, this number has increased for people with mild to moderate disabilities (from 55.2%), but has decreased for people with severe to very severe disabilities (from 49.7%).
Workplace accommodations
Workplace accessibility and accommodations are important measures of inclusion in the workforce. Inadequate supports in the workplace create barriers to employment for people with disabilities. Lack of necessary supports can cause people to completely withdraw from the labour force, struggle with unemployment, or work in jobs that do not match their interests, skill sets and abilities. To create a workplace environment that is fully inclusive and equitable, employers must provide accommodations to current and prospective employees with disabilities.
Workplace modifications usually fall into two categories: resource-specific (e.g., job redesign, a modified work schedule, computer aids) or physical/structural (e.g., handrails, modified workstations, accessible washrooms).
In 2006, 207 580 employed working-age adults with disabilities required resource-specific accommodations and 270 920 required physical/structural changes to their workplace environments. The number of people who required resource-specific accommodations decreased between 2001 and 2006. However, the number of people who required structural modifications increased by more than 160 000.
In 2006, 70.2% of employed working-age adults with disabilities with requirements had all of their resource-specific workplace modification needs met, compared to 79.9% in 2001. In contrast, 49.1% of those with physical/structural modification requirements indicated that all of their needs were met in 2006, a decrease from 76.1% in 2001.
People with severe to very severe disabilities are more likely to require physical/structural changes to the workplace (40.3%) than resource-specific modifications (24.5%). People with severe to very severe disabilities with requirements are more likely to have no physical/structural workplace modification needs met (48.3%) than those with mild to moderate disabilities (31.0%). This represents a shift from 2001, when 73.2% of people with severe to very severe disabilities with requirements had their physical/structural needs fully met and only 17.2% had unmet needs.
| Needs met | 2001 | 2006 | ||||||
|---|---|---|---|---|---|---|---|---|
| Mild to Moderate | Severe to Very Severe | Mild to Moderate | Severe to Very Severe | |||||
| Number | % | Number | % | Number | % | Number | % | |
| Total with needs | 56 080 | 100.0 | 53 600 | 100.0 | 127 820 | 100.0 | 143 100 | 100.0 |
| All needs met | 44 240 | 78.9 | 39 210 | 73.2 | 83 000 | 64.9 | 49 980 | 34.9 |
| Some needs met | 3 840 | 6.8 | 5 190 | 9.7 | 5 200 | 4.1 | 23 950 | 16.7 |
| No needs met | 8 000 | 14.3 | 9 200 | 17.2 | 39 620 | 31.0 | 69 170 | 48.3 |
- The table uses 2006 data that is comparable to 2001 data.
- The sum of values for each category may differ from the total due to rounding.
- Applicable to adults 15 to 64 years of age only.
Source: Participation and Activity Limitation Survey, 2001 and 2006.
Women with disabilities were more likely than men to have their workplace accommodations needs met, whether these needs were resource-specific or physical/structural. In 2006, 20.4% of men with disabilities did not have any of their resource-specific needs met and 43.8% did not have any of their physical/structural modification needs met. This gap has increased significantly since 2001, when 17.9% of men indicated that they had no structural needs met. Of women with disabilities, 27.9% indicated that they had no structural needs met in 2006, compared to 14.4% in 2001.
Unpaid employment / volunteering (working-age adults and seniors)
Volunteering is not only a means by which people can participate in their communities; it also provides opportunities for developing employment-related skills. Over one quarter (25.7%) of adults with disabilities (age 15 and over) devote time to volunteering. However, this is a decrease from 2001, when almost a third (32.7%) of adults with disabilities volunteered. Although there was a drop across all age groups, the largest drop was among youth (age 15 to 24).
Working-age adults are more likely to volunteer than seniors: 30.3% of working-age adults with disabilities volunteer, compared to only 19.2% of seniors. Working-age women are more likely to volunteer than working-age men, but among seniors, men and women volunteer at the same rate.
Chart 3.3 — Rates of volunteering or unpaid work by age, 2001 and 2006
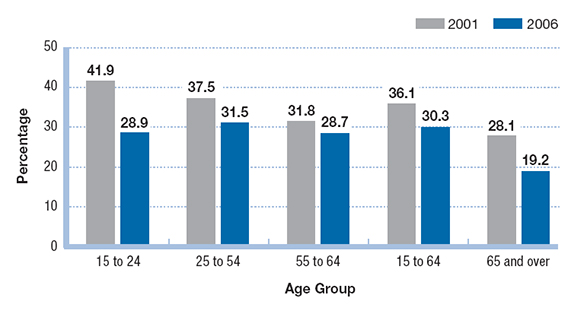
Chart 3.3 Description
This is a vertical bar graph that illustrates the rates of volunteering or unpaid work, by age, among persons with disabilities in 2001 and 2006.
The Y axis is measured by percentages and increases by increments of five from 0 up to 45.
The X axis is comprised of five age groups. From left to right, the age groups are:
- 15 to 24
- 25 to 54
- 55 to 64
- 15 to 64
- 65 and over
For each age group, there are two vertical bars, one for 2001 and one for 2006, depicting the rate of persons with disabilities who volunteer or participate in unpaid work.
The percentage of persons with a disability 15 to 24 years of age who volunteer or participate in unpaid work is 41.9% in 2001 and 28.9% in 2006.
The percentage of persons with a disability 25 to 54 years of age who volunteer or participate in unpaid work is 37.5% in 2001 and 31.5% in 2006.
The percentage of persons with a disability 55 to 64 years of age who volunteer or participate in unpaid work is 31.8% in 2001 and 28.7% in 2006.
The percentage of persons with a disability 15 to 64 years of age who volunteer or participate in unpaid work is 36.1% in 2001 and 30.3% in 2006.
The percentage of persons with a disability 65 and over who volunteer or participate in unpaid work is 28.1% in 2001 and 19.2% in 2006.
- The table excludes the Yukon, Northwest Territories and Nunavut.
- The sum of the values for each category may differ from the total due to rounding.
- Applicable to adults 15 years of age or older only.
- The chart uses 2006 data that is comparable to 2001 data.
- The sum of the values for each category may differ from the total due to rounding.
- Applicable to adults 15 years of age and over.
Source: Participation and Activity Limitation Survey, 2001 and 2006.
Adults with less severe disabilities are more likely to volunteer than adults with more severe disabilities (30.8% versus 17.9%), but rates of volunteering for both groups have decreased since 2001 (from 37.8% and 25.3% respectively). This decrease was most apparent among youth with severe disabilities, where the drop (from 38.6% to 20.9%) was larger than that for youth with mild or moderate disabilities (from 43.4% to 32.2%).
Chapter 4: Income
This chapter reviews income characteristics for Canadians with disabilities. Access to sufficient income is essential for quality of life and full participation in society. This chapter examines annual salary, total income and main sources of personal income.
Income is based on the 2000 and 2005 taxation years (for the 2001 and 2006 surveys respectively). To allow comparison between 2001 and 2006, income data for the year 2000 were converted to 2005 dollars based on annual consumer price indexes.
Canadians with disabilities are likely to have lower incomes than those without disabilities. Insufficient income can increase a family’s risk of being unable to obtain basic necessities such as food and housing. Lower income can cause difficulties in many areas of life and can create barriers to obtaining sufficient education and employment.
While average salary has remained the same for people with disabilities since 2001, those covered by collective agreements saw an increase in their salaries. Total household income has also increased, with the majority of people with disabilities claiming employment income as their greatest source of personal income. Gaps continue to exist between men and women both with and without disabilities.
Indicator areas
Annual salary
On average, adults with disabilities earn a lower annual salary than adults without disabilities. The average salary for employed working-age adults with disabilities has not increased since 2001: the average salary was $30,380 in 2006, compared to $30,490 in 2001. In contrast, the average salary for employed working-age adults without disabilities was $38,150 in 2006, an increase from $35,670 in 2001.
In addition to the gap in annual salary between people with disabilities and people without disabilities, people with disabilities continue to experience a sizeable gender gap. While women with disabilities saw a slight increase in their average annual salary (from $23,710 in 2001 to $24,720 in 2006) and men with disabilities experienced a slight decrease (from $37,130 in 2001 to $36,240 in 2006), women continue to earn approximately $11,000 less per year than men.
Collective agreements and union contracts are linked to better wages. The average salary for people with disabilities who have a collective agreement or union contract is $42,191, compared to $29,235 for people with disabilities who do not have union support.
Although women under collective agreements or with union contracts still report lower average salaries than men ($35,677 versus $49,152), their average salary is much higher than that of women who do not have these agreements ($21,983).
Total income
Whereas salary is reported solely for the approximately 1.4 million working-age adults with disabilities who are earning a wage or salary, total income—the total combined income for a person—is reported for all 4.2 million adults with disabilities, whether or not they are employed. Total income encompasses all sources of income, including employment income and government transfers.
In 2006, the average total income was $25,840 for working-age adults with disabilities and $30,460 for seniors with disabilities. Overall, adults with disabilities have lower total incomes than adults without disabilities; average total income was $35,800 for working-age adults without disabilities and $31,940 for seniors. The income gap between working-age adults with and without disabilities increased slightly between 2001 and 2006; however, the gap between seniors with and without disabilities decreased by over half since 2001, falling from approximately $3,700 to $1,500.
Chart 4.1 — Average total income by age and disability status, 2001 and 2006
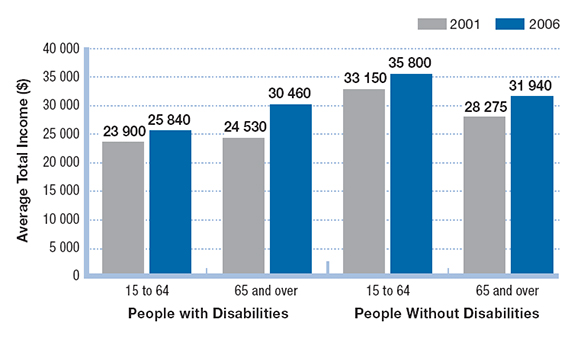
Chart 4.1 Description
This is a vertical bar graph that illustrates the average total income of adults with disabilities by age and disability status in 2001 and 2006.
The Y axis is measured in dollar amounts and increases by increments of five thousand dollars from 0 up to 40,000$.
The X axis is comprised by disability status: from left to right, people with disabilities and people without disabilities. In addition, each disability status is divided by two age groups: from left to right, 15 to 64 and 65 and over.
For each age group, there are two vertical bars, one for 2001 and one for 2006, depicting the average household income of the adults by disability status and age.
The average household income of adults with a disability 15 to 64 years of age is $23,900 in 2001 and $25,840 in 2006.
The average household income of adults with a disability 65 and over is $24,530 in 2001 and $30,460 in 2006.
The average household income of adults without a disability 15 to 64 years of age is $33,150 in 2001 and $35,800 in 2006.
The average household income of adults without a disability 65 and over is $28,275 in 2001 and $31,940 in 2006.
- The table excludes the Yukon, Northwest Territories and Nunavut.
- The sum of the values for each category may differ from the total due to rounding.
- Applicable to adults 15 years of age or older only.
- The chart uses 2006 data that is comparable to 2001 data.
- The sum of the values for each category may differ from the total due to rounding.
- Applicable to adults 15 years of age and over.
Source: Participation and Activity Limitation Survey, 2001 and 2006.
There is also an income gap between men and women in terms of total income. In 2006, the annual total income of working-age women with disabilities was two thirds of the average annual total income for men with disabilities ($20,760 versus $31,610).
| Disability status | 2001 | 2006 | ||
|---|---|---|---|---|
| Men | Women | Men | Women | |
| People with disabilities | $30,250 | $18,320 | $31,610 | $20,760 |
| People without disabilities | $41,276 | $25,103 | $44,060 | $27,660 |
- The table uses 2006 data that is comparable to 2001 data.
- Not applicable to adults 15 years of age and over.
Source: Participation and Activity Limitation Survey, 2001 and 2006.
Total income also varies by severity of disability. Working-age adults with severe to very severe disabilities have two thirds the average total income of those with mild to moderate disabilities. In 2006, the average annual total income of working-age adults with severe to very severe disabilities was $19,880, while that of working-age adults with mild to moderate disabilities was $29,770.
| Age Group | 2001 | 2006 | ||
|---|---|---|---|---|
| Mild to moderate | Severe to very severe | Mild to moderate | Severe to very severe | |
| 15 to 64 | $27,600 | $18,780 | $29,770 | $19,880 |
| 65 and over | $25,440 | $23,130 | $29,610 | $31,760 |
- The table uses 2006 data that is comparable to 2001 data.
- Not applicable to adults 15 years of age and over.
Source: Participation and Activity Limitation Survey, 2001 and 2006.
In 2006, seniors with mild to moderate disabilities had an average annual income of $29,610, compared to $31,760 for seniors with severe to very severe disabilities. From 2001 to 2006, seniors with mild to moderate disabilities saw an increase of $4,170 in their average total income, whereas seniors with severe to very severe disabilities saw an increase of $8,630.
Main sources of personal income
Sources of income for Canadians with disabilities include employment income, investments, government transfers, pensions and private insurance.
The most common source of personal income for working-age adults with disabilities (age 15 to 64) is employment earnings. However, only five in ten working-age adults with disabilities claim employment earnings as their largest source of income, compared to eight in ten working-age adults without disabilities (52.1% versus 81.2%).
Self-employment income is another source of personal income for people with disabilities. In 2006, the average self-employment income for working-age adults with disabilities (age 15 to 64) was $12,183. This amount has decreased from $15,950 in 2001. People without disabilities report higher earnings from self-employment (an average of $17,924); nonetheless, people without disabilities saw a greater decrease in self-employment earnings between 2001 and 2006 than people with disabilities.
Regardless of age, men with disabilities receive more income from self-employment than women with disabilities ($14,970 versus $8,582). Among people with disabilities, younger working-age adults (age 25 to 54) earn more from self-employment than other age groups; in contrast older working-age adults with disabilities (age 55 to 64) earned the most from self-employment. This has changed since 2001, when people aged 25 to 54 earned more from self-employment than any other age group, regardless of disability status.
Many working-age adults with disabilities rely on government transfers to support their personal income. In 2006, working-age adults with disabilities were over three times more likely to receive government transfers as a source of personal income than adults without disabilities.
Primary sources of income differ between men and women with disabilities. Women are more likely to receive government transfer payments. In 2006, government transfers were a source of personal income for 55.7% of women with disabilities aged 15 and over, compared to 46.8% of men with disabilities.
Having government transfers be a primary source of income is strongly related to age. Seniors with disabilities are most likely to receive government transfer payments, which include payments under the Canadian Pension Plan or Quebec Pension Plan, Old Age Security and the Guaranteed Income Supplement. The proportion of seniors who receive such payments has decreased only slightly from 2001 (from 60.8% to 59.5%). In 2006, 20.8% of seniors with disabilities also claimed retirement pensions as a source of income, compared to 14.0% in 2001.
| Source of income | People with disabilities | People without disabilities | ||
|---|---|---|---|---|
| Number | % | Number | % | |
| 2001 | ||||
| Total | 1 785 380 | 100.0 | 16 756 480 | 100.0 |
| Employment income | 858 810 | 48.1 | 13 664 460 | 81.5 |
| Government transfers | 716 380 | 40.1 | 2 109 460 | 12.6 |
| Investment income | 67 170 | 3.8 | 373 670 | 2.2 |
| Retirement pensions, superannuation and annuities, including income from RRSPs and RRIFs | 106 000 | 5.9 | 412 840 | 2.5 |
| Other money income | 34 100 | 1.9 | 177 120 | 1.1 |
| 2006 | ||||
| Total | 2 226 610 | 100.0 | 17 617 500 | 100.0 |
| Employment income | 1 160 240 | 52.1 | 14 311 770 | 81.2 |
| Government transfers | 826 270 | 37.1 | 2 102 220 | 11.9 |
| Investment income | 69 220 | 3.1 | 441 830 | 2.5 |
| Retirement pensions, superannuation and annuities, including income from RRSPs and RRIFs | 117 250 | 5.3 | 393 590 | 2.2 |
| Other money income | 51 020 | 2.3 | 363 950 | 2.1 |
- The table uses 2006 data that is comparable to 2001 data.
- The sum of the values for each category may differ from the total due to rounding.
- Applicable to adults 15 years of age and over.
Source: Participation and Activity Limitation Survey, 2001 and 2006.
Chapter 5: Health and well-being
This chapter explores health and well-being among Canadians with disabilities. Because disability is often interrelated with health and well-being difficulties, health and access to well-being supports are important elements to consider in ensuring that people with disabilities have the opportunity to participate as fully as possible in society. This chapter focuses on the self-rated health status of people with disabilities and the interrelation of health and factors such as stress, employment and income.
Health and well-being are fundamental to a full life and full participation in society. Physical, mental and emotional health affects virtually all aspects of people’s lives. Health and well-being are linked to outcomes such as level of education, employment and income, and participation in the community.
Health is often described as the presence or absence of physical limitations. However, the World Health Organization (WHO) provides a broad definition of health that takes physical and mental well-being, lifestyle, and social interactions into account. According to WHO, health is a “state of complete physical, mental and social well-being and not merely the absence of disease or infirmity.”
While seniors with disabilities report poorer health than in 2001, more working-age adults with disabilities are reporting that they have good to excellent health. Physical activity, social relationships, good income, education and employment are some of the factors that influenced a stronger health rating. Access to health care remains an issue for people with disabilities.
Indicator areas
Self-rated health status
In 2006, just over half (54.0%) of adults with disabilities rated their health as good, very good or excellent, and one quarter (24.8%) rated their health as fair. Another 12.9% rated their health as poor.
Chart 5.1 — Self-rated health status for adults aged 15 and over, 2001 and 2006
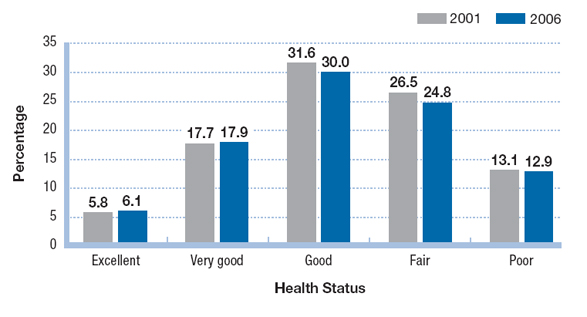
Chart 5.1 Description
This is a vertical bar graph that illustrates the self rated health status of adults with disabilities, aged 15 and over, in 2001 and 2006.
The Y axis is measured in percentage and increases by increments of five from 0 up to 40.
The X axis is comprised by health status: from left to right, ‘Excellent’, ‘Very Good’, ‘Good’, ‘Fair’ and ‘Poor’.
For each health status, there are two vertical bars, one for 2001 and one for 2006, depicting how adults with disabilities rated their health status in both respective years.
The percentage of adults with a disability who rated their health status as Excellent is 5.8% in 2001 and 6.1% in 2006.
The percentage of adults with a disability who rated their health status as Very Good is 17.7% in 2001 and 17.9% in 2006.
The percentage of adults with a disability who rated their health status as Good is 31.6% in 2001 and 30.0% in 2006.
The percentage of adults with a disability who rated their health status as Fair is 26.5% in 2001 and 24.8% in 2006.
The percentage of adults with a disability who rated their health status as Poor is 13.1% in 2001 and 12.9% in 2006.
- The table excludes the Yukon, Northwest Territories and Nunavut.
- The sum of the values for each category may differ from the total due to rounding.
- Applicable to adults 15 years of age or older only.
- The chart uses 2006 data that is comparable to 2001 data.
- The sum of the values for each category may differ from the total due to rounding.
- Applicable to adults 15 years of age and over.
Source: Participation and Activity Limitation Survey, 2001 and 2006.
In general, men with disabilities are more likely than women to rate their health as very good or excellent (26.5% versus 22.0%). This trend is similar across age groups. When asked to rate their satisfaction with their health out of ten, women reported slightly lower ratings than men (6.0 versus 6.3).
The overall percentage of seniors with disabilities who rated their health as excellent, very good or good decreased slightly, from 56.4% in 2001 to 53.0% in 2006. A small gender gap in self-rated health is seen among seniors with disabilities: from 2001 to 2006, the percentage of senior women who rated their health as excellent, very good or good decreased slightly, from 55.7% to 53.3%, while the percentage of senior men reporting one of those ratings decreased from 57.5% to 52.6%.
| Health status | 2001 | 2006 | ||||||
|---|---|---|---|---|---|---|---|---|
| Age 15 to 64 | Age 65 and over | Age 15 to 64 | Age 65 and over | |||||
| Number | % | Number | % | Number | % | Number | % | |
| Total | 1 968 490 | 100.0 | 1 451 850 | 100.0 | 2 437 610 | 100.0 | 1 725 090 | 100.0 |
| Excellent | 127 640 | 6.5 | 69 490 | 4.8 | 167 110 | 6.9 | 87 720 | 5.1 |
| Very good | 354 910 | 18.0 | 251 620 | 17.3 | 451 550 | 18.5 | 294 360 | 17.1 |
| Good | 583 270 | 29.6 | 498 310 | 34.3 | 715 120 | 29.3 | 532 750 | 30.9 |
| Fair | 492 980 | 25.0 | 413 870 | 28.5 | 576 230 | 23.6 | 456 150 | 26.4 |
| Poor | 296 990 | 15.1 | 152 230 | 10.5 | 309 630 | 12.7 | 226 390 | 13.1 |
- The table uses 2006 data that is comparable to 2001 data.
- The sum of values for each category may differ from the total due to rounding.
- Applicable to adults 15 years of age and over.
Source: Participation and Activity Limitation Survey, 2001 and 2006.
There is a relationship between severity of disability and self-rated health. Seven out of ten adults with mild to moderate disabilities rate their health as good, very good or excellent, whereas only three out of ten adults with severe to very severe disabilities report one of those ratings. In addition, 26.2% of adults with severe or very severe disabilities rate their health as poor, in comparison to 4.1% of adults with mild to moderate disabilities.
When asked to rate their satisfaction with various life factors such as health and work out of 10, adults with disabilities rate their satisfaction with relationships as 8.3 but their satisfaction with health as 6.2. Furthermore, severity of disability affected the response regarding satisfaction with health: people with mild to moderate disabilities reported an average rating of 6.9, whereas people with severe to very severe disabilities reported an average rating of 4.7.
Impact of stress
Stress has negative effects on health and can have even more harmful effects on the health of people with disabilities. As people age, their main sources of stress change.
Work is the most common source of stress for working-age adults with disabilities aged 15 to 64 (main source for 24.5%), whereas health is the most common source of stress for seniors (main source for 37.4%). When looking at gender, health is the most common source of stress for working-age women (24.6%) whereas work is the most common source of stress for working-age men (28.9%).
People with severe to very severe disabilities are most likely to identify health as their main source of stress (43.0%). In contrast, people with mild to moderate disabilities identify a larger variety of main causes of stress, with the most common cause of stress being work (26.0%).
Chart 5.3 — Main source of stress for adults aged 15 and over by severity of disability, 2006
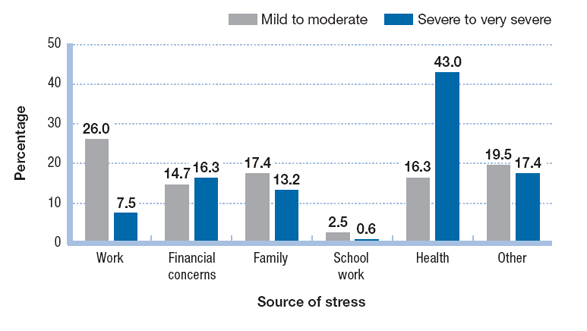
Chart 5.3 Description
This is a vertical bar graph that illustrates the main source of stress by level of severity of adults with disabilities, aged 15 and over, in 2006.
The Y axis is measured in percentage and increases by increments of five from 0 up to 50.
The X axis is comprised by six sources of stress. On the X axis from left to right, the sources of stress are:
- Work
- Financial concerns
- Family
- School work
- Health
- Other
For each source of stress, there are two vertical bars, one for mild to moderate and one for severe to very severe levels of severity, depicting by percentage what are the main sources of stress of adults with disabilities for both levels of severity in 2006.
The percentage of adults who rated Work as their main source of stress is 26.0% for those with mild to moderate levels of disabilities and 7.5% for those with severe to very severe levels of disabilities in 2006.
The percentage of adults who rated Financial Concerns as their main source of stress is 14.7% for those with mild to moderate levels of disabilities and 16.3% for those with severe to very severe levels of disabilities in 2006.
The percentage of adults who rated Family as their main source of stress is 17.4% for those with mild to moderate levels of disabilities and 13.2% for those with severe to very severe levels of disabilities in 2006.
The percentage of adults who rated School Work as their main source of stress is 2.5% for those with mild to moderate levels of disabilities and 0.6% for those with severe to very severe levels of disabilities in 2006.
The percentage of adults who rated Health as their main source of stress is 16.3% for those with mild to moderate levels of disabilities and 43.0% for those with severe to very severe levels of disabilities in 2006.
The percentage of adults who rated Other as their main source of stress is 19.5% for those with mild to moderate levels of disabilities and 17.4% for those with severe to very severe levels of disabilities in 2006.
- The table excludes the Yukon, Northwest Territories and Nunavut.
- The sum of the values for each category may differ from the total due to rounding.
- Applicable to adults 15 years of age or older only.
- The chart uses 2006 data that is comparable to 2001 data.
- The sum of the values for each category may differ from the total due to rounding.
- Applicable to adults 15 years of age and over.
Source: Participation and Activity Limitation Survey, 2006.
Physical activity
Regular physical activity is an important component of good health. It can prevent or delay the onset of certain disease such as diabetes. The majority of adults with disabilities who engaged in physical activity in their homes over the past 12 months rated their health as either good or fair. In addition, the percentage of people who exercised in their homes who rated their health as very good or excellent rose from 27.4% in 2001 to 30.6% in 2006.
In 2006, 33.5% of men with disabilities who exercised at home in the past year rated their health as excellent or very good, compared to 28.3% of women. This percentage has increased significantly since 2001 for men (from 27.7%), but only slightly for women (from 27.2%).
The gap by severity of disability was much larger: 39.3% of people with mild to moderate disabilities who exercised rated their health as excellent or very good, compared to only 13.7% of people with severe to very severe disabilities. Since 2001, these figures increased only slightly for people with mild to moderate disabilities (from 36.3%) and did not change much for people with severe to very severe disabilities (was 13.2%).
In 2006, 31.5% of working-age adults with disabilities who exercised at home rated their health as very good or excellent, up from 27.9% in 2001. In addition, 29.2% of seniors with disabilities who exercised at home rated their health as very good or excellent, up from 25.9%.
Income, employment and education
Income levels, employment and education are associated with health status. These three factors play an important role in determining a person’s quality of life and ability to contribute to his or her family and community.
The percentage of adults with disabilities living in low-income families who rated their health as poor decreased slightly between 2001 and 2006 (from 22.7% to 21.4%). Adults with disabilities who do not live in low-income families remain less likely to rate their health as poor: 12.8% did so in 2006.
| Health rating | 2001 | 2006 | ||
|---|---|---|---|---|
| Number | % | Number | % | |
| Member of low income economic family | ||||
| Total | 498 890 | 100.0 | 540 350 | 100.0 |
| Excellent or Very Good | 86 200 | 17.3 | 98 800 | 81.3 |
| Good or Fair | 299 450 | 60.0 | 326 150 | 60.4 |
| Poor | 113 250 | 22.7 | 115 420 | 21.4 |
| Member of non-low income economic family | ||||
| Total | 1 348 540 | 100.0 | 3 265 030 | 100.0 |
| Excellent or Very Good | 393 950 | 29.2 | 899 550 | 27.6 |
| Good or Fair | 772 260 | 57.3 | 1 945 930 | 59.6 |
| Poor | 182 330 | 13.5 | 419 540 | 12.8 |
- The table uses 2006 data that is comparable to 2001 data.
- The sum of the values for each category may differ from the total due to rounding.
- Applicable to adults 15 years of age and over.
Source: Participation and Activity Limitation Survey, 2001 and 2006.
In terms of employment and self-rated health, 37.2% of employed working-age adults rate their health as very good or excellent, in comparison to 25.1% of unemployed working-age adults.
Education, which is closely related to employment opportunities and income levels, is also associated with perception of health. Of people with disabilities who reported having fair to good health, 57.9% had a post-secondary education. This number has increased slightly from 2001 (56.1%).
Access to health care
Having access to health care is an important component of a person’s health care status. Of adults with disabilities who need health care or social services, 13.9% feel they do not receive them. Women are more likely than men to report an unmet need for health care or social services (15.8% versus 11.7%). Similar results were reported in 2001.
There are various reasons why health care needs are not met. These include expense, not having insurance coverage, or lack of availability. Cost is the most common reason. In 2006, 47.1% of those who felt they did not receive needed health care claimed expense as the most common reason their needs were unmet, whereas 21.5% did not know where or how to obtain the health care they required.
Chart 5.5 — Reasons for not receiving needed health care, adults aged 15 and over, 2001 and 2006
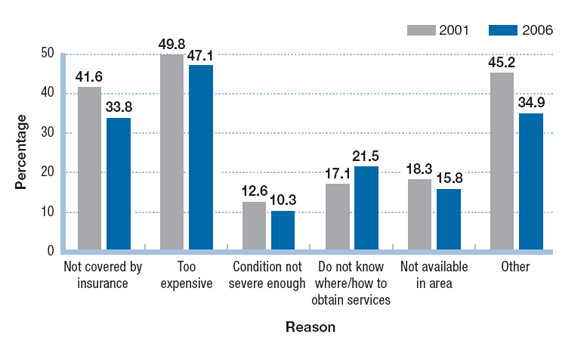
Chart 5.5 Description
This is a vertical bar graph that illustrates the reasons for not receiving needed health care for adults with disabilities, aged 15 and over, in 2001 and 2006.
The Y axis is measured in percentage and increases by increments of ten from 0 up to 60.
The X axis is comprised by six reasons for not receiving needed health care. On the X axis from left to right, the reasons are:
- Not covered by insurance
- Too expensive
- Condition not severe enough
- Do not know where/how to obtain services
- Not available in area
- Other
For each reason, there are two vertical bars, one for 2001 and one for 2006, depicting by percentage the reasons why adults with disabilities are not receiving needed health care for each respective year.
The percentage of adults with disabilities who are not receiving needed health care because it is not covered by their insurance is 41.6% in 2001 and 33.8% in 2006.
The percentage of adults with disabilities who are not receiving needed health care because it is too expensive is 49.8% in 2001 and 47.1% in 2006.
The percentage of adults with disabilities who are not receiving needed health care because their condition is not severe enough is 12.6% in 2001 and 10.3% in 2006.
The percentage of adults with disabilities who are not receiving needed health care because they do not know where or how to obtain the services is 17.1% in 2001 and 21.5% in 2006.
The percentage of adults with disabilities who are not receiving needed health care because it is not available in their area is 18.3% in 2001 and 15.8% in 2006.
The percentage of adults with disabilities who are not receiving needed health care due to other reasons is 45.2% in 2001 and 34.9% in 2006.
- The table excludes the Yukon, Northwest Territories and Nunavut.
- The sum of the values for each category may differ from the total due to rounding.
- Applicable to adults 15 years of age or older only.
- The chart uses 2006 data that is comparable to 2001 data.
- The sum of the values for each category may differ from the total due to rounding.
- Applicable to adults 15 years of age and over.
Source: Participation and Activity Limitation Survey, 2001 and 2006.
Social contacts
In 2006, 25.9% of adults with disabilities had at least three close social contacts they were comfortable talking to and relying on for help. However, 281 930 adults with disabilities (6.8%) said they had no close friends they could confide in or depend on for help.
Women with disabilities were more likely than men to report having close friendships. However, men were more likely to have larger social networks (11 or more close friends).
| Number of close friendships | Men | Women | ||
|---|---|---|---|---|
| Number | % | Number | % | |
| Total | 1 872 290 | 100.0 | 2 290 410 | 100.0 |
| None | 144 760 | 7.7 | 137 170 | 6.0 |
| 1 to 2 | 290 310 | 15.5 | 417 470 | 18.2 |
| 3 to 5 | 433 400 | 23.1 | 642 830 | 28.1 |
| 6 to 10 | 287 520 | 15.4 | 365 380 | 16.0 |
| 11 to 20 | 141 870 | 7.6 | 130 030 | 5.7 |
| More than 20 | 128 960 | 6.9 | 95 980 | 4.2 |
- The table uses 2006 data that is comparable to 2001 data.
- The sum of the values for each category may differ from the total due to rounding.
- Applicable to adults 15 years of age and over.
Source: Participation and Activity Limitation Survey, 2006.
A total of 28.4% of adults with mild to moderate disabilities had three to five close friendships, compared to 22.0% of adults with severe to very severe disabilities.
| PROGRAM/INITIATIVE | AMOUNT ($ Millions/year) |
|
|---|---|---|
| 2007–08 | 2008–09 | |
| Inclusion and supports | ||
| Canada Mortgage and Housing Corporation programs (RRAP-D, HASI, RRAP-Secondary/Garden Suite, SEP) Footnote 1 | 29.4 | 34.0 |
| Canadian Transportation Agency programs—disability component | 2.4 | 2.8 |
| Special Olympics sports funding and Canadian Deaf Sports Association (Canadian Heritage) | 1.6 Footnote 2 | 1.5 Footnote 2 |
| Paralympics sports funding, Athlete Assistance Program for athletes with disabilities and Long-Term Athlete Development Model for sports programs for athletes with disabilities (Canadian Heritage) | 9.6 Footnote 3 | 10.9 Footnote 3 |
| 2010 Paralympics spending (Canadian Heritage) Footnote 4 | 0.5 | 5.0 |
| Sport participation funding—disability component (Canadian Heritage), base funding for national sport organizations’ sports programs for athletes with disabilities | 5.7 Footnote 5 Footnote 6 | 4.6 Footnote 5 |
| Funding for national sport organizations’ Long-Term Athlete Development Model for sports programs for athletes with disabilities | 0.1 Footnote 6 | |
| Hosting program funding (major international games for people with disabilities, international single-sport events) | 0.3 | 0.4 |
| Federal/provincial/territorial projects related to sports programs for people with disabilities | 0.4 | 0.3 |
| Sport Canada’s total contributions for sport for people with disabilities | 15.9 | 17.8 Footnote 6 |
| Sport Canada’s total grants and contributions (Canadian Heritage) | 138.0 | 151.4 |
| Initiative for Equitable Library Access (Library and Archives Canada) | 0.3 | 0.9 |
| Social Development Partnerships Program grants and contributions (HRSDC) | 11.0 | 11.0 |
| Canadian Radio-television and Telecommunications Commission accessibility hearings | Footnote ** | 0.1 Footnote 7 |
| Justice Canada programs—disability component | Footnote ** | 0.1 |
| Canadian International Development Agency Programs—disability component | 17.5 Footnote 8 | 24.0 Footnote 9 |
| Canadian Institutes of Health Research funding of research related to disability | Footnote ** | 4.0 |
| Income supports | ||
| Canada Pension Plan Disability Program (HRSDC) | 3,474.1 | 3,581.1 |
| Canada Pension Plan Disability Vocational Rehabilitation Program (HRSDC) | 3.0 | 1.7 |
| Child Disability Benefit (Finance Canada and CRA) Footnote 10 | 143.5 | 160.9 |
| Earnings Loss and Supplementary Retirement Benefit (VAC) | 11.7 | 19.1 |
| Employment Insurance sickness benefits (HRSDC) | 954.9 | Footnote ** |
| Federal Workers’ Compensation benefits (HRSDC) | 159.2 | 177.6 Footnote 11 |
| Penitentiary inmates accident compensation (CSC) | 0.1 | 0.1 |
| Veterans Disability Pension and Disability Awards Program (VAC) | 1,895.4 | 1,973.9 |
| Learning, skills and employment | ||
| Canada Access Grant for Students with Permanent Disabilities (HRSDC) | 26.7 | Footnote ** |
| Canada Study Grant for the Accommodation of Students with Permanent Disabilities (HRSDC) | 20.2 | Footnote ** |
| Entrepreneurs with Disabilities Program (WD) | 1.4 | 1.4 |
| Labour Market Agreements for Persons with Disabilities (HRSDC) | 218.3 | 222 |
| National Council of Federal Employees with Disabilities | 0.3 | 0.3 |
| Opportunities Fund (HRSDC) | 26.8 | 26.8 |
| Permanent Disability Benefit (HRSDC) | 5.1 | Footnote ** |
| Vocational services (VAC) | 1.1 | 1.8 |
| Health and well-being | ||
| Aboriginal Diabetes Initiative | 40.0 | Footnote ** |
| Active Living Alliance for Canadians with a Disability (PHAC) | 0.2 | 0,0 |
| Canadian Diabetes Strategy (Health Canada) | Footnote ** | 18.0 |
| Fetal Alcohol Spectrum Disorder Program (PHAC) | 3.3 | Footnote ** |
| Fetal Alcohol Spectrum Disorder Program: First Nations and Inuit Component (Health Canada) | 16.7 | Footnote ** |
| First Nations and Inuit Home and Community Care Program | 105.7 | Footnote ** |
| National Native Alcohol and Drug Abuse Program and the National Youth Solvent Abuse Program | 70.0 | Footnote ** |
| Non-Insured Health Benefits | 898.2 | 934.6 |
| Veterans Independence Program (VAC) | 303.2 | 320.0 |
| Treatment Benefits Program (VAC) | 285.7 | 293.0 |
| Tax measures (Finance Canada and Canada Revenue Agency) | Footnote 12 | Footnote 13 |
| Caregiver credit | 80.0 | 85.0 |
| Disability supports deduction | Footnote 14 | (14) |
| Disability tax credit (including supplement for children) | 375.0 | 395.0 |
| Infirm dependant credit | 5.0 | 5.0 |
| Medical expense tax credit | 895.0 Footnote 15 | 970.0 |
| Refundable medical expense supplement | 110.0(15) | 120.0 |
| Aboriginal people | ||
| Aboriginal Human Resources Development Strategy—disability component (HRSDC) | 3.0 | 3.0 |
| Assisted Living Program (INAC) Footnote 16 | 88.7 | 92.3 |
| Special Education Program (INAC) Footnote 16 | 128.8 | 130.1 |
Note: The figures in this table are based on departmental estimates. Numbers have been rounded.