
2010 FDR - Chapter 3: Learning
Lifelong learning is important for lifelong well-being and satisfaction. In childhood, access to education helps children develop both intellectually and socially. In adolescence and young adulthood, equitable access to education and experiences with barriers impact not only educational paths and choices but also career aspirations. Among working-age adults, access to retraining is an essential part of keeping people with disabilities integrated in the workforce, while access to training within the workplace contributes to lifelong career development.
Featured topics
Childhood education and supports
Childhood learning experiences have a lifelong impact. Footnote 17 Encouragement and support from parents and teachers at an early age have lasting effects on educational attainment, career aspirations and overall life satisfaction. Many children with disabilities and their families experience barriers that disrupt the learning process. These barriers include increased costs for families raising children with disabilities, perceptions that children with disabilities are not career-oriented and the notion that it is difficult to educate children with disabilities in a mainstream education system.
An estimated 60 220 girls and 104 170 boys with disabilities ages 5 to 14 attend schools and/or kindergarten programs. In addition, 3 010 children with disabilities are tutored at home, and 3 910 neither go to school nor are tutored at home. Most children with disabilities are enrolled in mainstream schools: 64.7% of children with disabilities attend regular school, and an additional 24.9% attend regular school with special education classes. Only 7.9% of children with disabilities attend special education schools, and 77.6% of those who do have severe to very severe disabilities.
Many older children with disabilities (68.5%) often or almost always look forward to attending school. Of the 16.4% who rarely or almost never look forward to attending school, 56.2% have severe to very severe disabilities.
Support from parents and teachers helps children with disabilities enjoy school, participate in meaningful classroom discussion and excel academically and socially. Whether it is through encouragement or involvement with teachers, parents play an important role in their children’s early learning experiences.
The vast majority (97.0%) of parents of children with disabilities speak to or visit their children’s teachers. In addition, 78.4% of parents attend school events that their children participate in, such as plays, sports competitions and science fairs, and 40.0% of parents participate in parent advisory committees or parent council meetings. Many parents (90.4%) believe that their children’s schools provide them with opportunities to be involved in their children’s school activities, and 86.6% of parents indicate that their children’s schools accommodate their children’s conditions.
Checking homework and encouraging academic success promotes children’s achievements in school, recreation and all areas of life. Only 3.7% of children with disabilities rarely or never have their homework checked; 67.0% of parents of children with disabilities check their children’s homework on a daily basis. Parents of children who have severe and very severe disabilities are more likely to check their children’s homework (73.4% and 75.6% respectively).
Report card performance is a good indicator of whether children are grasping information taught to them and applying new knowledge to assigned work. Overall, many children with disabilities (43.4%) have good to very good report card performance. Children with different levels of disability severity have different experiences. As seen in Chart 3.1, 38.1% of children with mild disabilities have very good report card performance, compared to 13.6% of children with very severe disabilities. In addition, 31.3%, 28.9% and 37.9% of children with moderate, severe and very severe disabilities respectively have poor or very poor report card performance.
Chart 3.1: Report card performance by severity of disability for older children, 2006
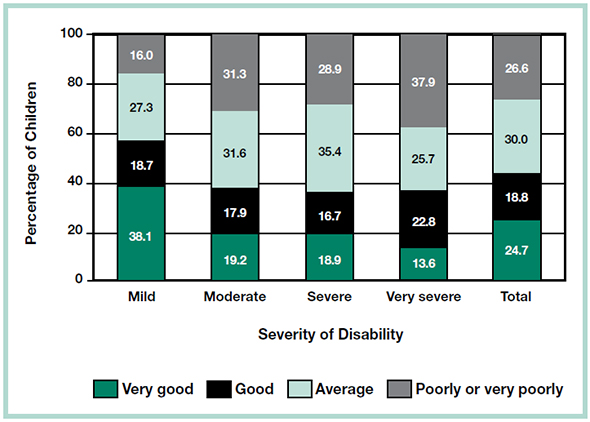
Chart 3.1 Text Description
This vertical bar graph illustrates report card performance by severity of disability for older children, 2006.
This chart is divided into five sections from left to right along the horizontal axis:
- Mild
- Moderate
- Severe
- Very severe
- Total
In each section there are four categories:
- Very good
- Good
- Average
- Poorly or very poorly
The vertical axis represents the percentage of older children and increases in increments of 20 percent from 0 percent to 100 percent.
For older children with mild disabilities, report card performance is described as very good for 38.1 percent, good for 18.7 percent, average for 27.3 percent and poorly or very poorly for 16.0 percent.
For older children with moderate disabilities, report card performance is described as very good for 19.2 percent, good for 17.9 percent, average for 31.6 percent and poorly or very poorly for 31.3 percent.
For older children with severe disabilities, report card performance is described as very good for 18.9 percent, good for 16.7 percent, average for 27.3 percent and poorly or very poorly for 28.9 percent.
For older children with very severe disabilities, report card performance is described as very good for 13.6 percent, good for 22.8 percent, average for 25.7 percent and poorly or very poorly for 37.9 percent.
The overall report card performance totals for children with disabilities regardless of severity level are as follows: 24.7 percent in the very good category, 18.8 percent in the good category, 30.0 percent in the average category and 26.6 percent in the poorly or very poorly category.
Source: Statistics Canada, 2006 Participation and Activity Limitation Survey
In addition to parental participation, children with disabilities have their own experiences in school settings. Children with more severe disabilities experience increased barriers to classroom participation. Only 13.8% of children with mild disabilities have limited classroom participation; however, 64.6% of children with severe disabilities have limited classroom participation due to their condition. Among children with very severe disabilities, 71.1% of boys have limited classroom participation, compared to 52.3% of girls.
For older children with disabilities, support for education can come in different forms. Counselling and therapy supports are excellent resources that can help children with disabilities increase school performance and social skills; 91.0% of children with disabilities receive some form of special education support in studying academic subjects (e.g. math, science and English). Furthermore, 55.1% receive life skills training, and 27.0% receive speech and language therapy. In addition, regardless of disability type, 23.4% of children with severe to very severe disabilities receive mental health supports.
Support through aids, devices and services is necessary to foster developmental growth and enable children with disabilities to participate to their fullest capacity in the school system. Among children with disabilities, physical or human supports are the most common types of aids reported: 67.5% of older children use aids or assistive devices, with tutors or teacher’s aides being the most commonly used, followed by note takers or readers. Chart 3.2 breaks down the usage of aids and assistive devices by severity of disability. Children with all levels of disability severity use aids and assistive devices.
| Assistive device or service used at school | Mild Disability | Moderate Disability | Severe Disability | Very Severe Disability | Total |
|---|---|---|---|---|---|
| Tutors or teacher’s aides | 36.8 | 53.8 | 76.6 | 81.2 | 58.4 |
| Note takers or readers | 7.9 | 20.8 | 22.4 | 25.7 | 17.7 |
| Attendant care services | X | X | 9.0 | 26.5 | 7.9 |
| Talking books | 3.3 | 2.6 | 10.2 | 19.7 | 7.7 |
| Recording equipment | 1.4 | 2.6 | 6.3 | 17.9 | 5.8 |
| Amplifiers, such as FM or infrared | 4.1 | 5.1 | 7.4 | 5.1 | 5.3 |
| A computer with Braille or speech access | 0.9 | 5.0 | 5.6 | 12.3 | 5.1 |
| Touch screen | X | X | 6.5 | 13.4 | 4.3 |
| Magnifiers | 2.0 | 1.1 | 2.9 | 2.5 | 2.1 |
| Sign language interpreters | X | X | 2.6 | 5.1 | 1.8 |
| Other aid or service | 7.8 | 11.3 | 11.9 | 22.1 | 12.2 |
Chart 3.2 Text Description
This table has six columns:
- Type of assistive device or service used at school and
- Percentage of older children using school supports with mild disabilities
- Percentage of older children using school supports with moderate disabilities
- Percentage of older children using school supports with severe disabilities
- Percentage of older children using school supports with very severe disabilities
- Percentage of older children using school supports in total
For those using tutors or teacher’s aides, the percentage of those with mild disabilities using this type of support is 36.8 percent.
For those using tutors or teacher’s aides, the percentage of those with moderate disabilities using this type of support is 53.8 percent.
For those using tutors or teacher’s aides, the percentage of those with severe disabilities using this type of support is 76.6 percent.
For those using tutors or teacher’s aides, the percentage of those with very severe disabilities using this type of support is 81.2 percent.
The total percentage of those using tutors or teacher’s aides is 58.4 percent.
For those using note takers or readers, the percentage of those with mild disabilities using this type of support is 7.9 percent.
For those using note takers or readers, the percentage of those with moderate disabilities using this type of support is 20.8 percent.
For those using note takers or readers, the percentage of those with severe disabilities using this type of support is 22.4 percent.
For those using note takers or readers, the percentage of those with very severe disabilities using this type of support is 25.7 percent.
The total percentage of those using note takers or readers is 17.7 percent.
For those using attendant care services, the percentage of those with mild disabilities using this type of support is x percent. (An “x” indicates that the number was suppressed due to low response counts in the survey used to collect this information.)
For those using attendant care services, the percentage of those with moderate disabilities using this type of support is x percent.
For those using attendant care services, the percentage of those with severe disabilities using this type of support is 9.0 percent.
For those using attendant care services, the percentage of those with very severe disabilities using this type of support is 26.5 percent.
The total percentage of those using attendant care services is 7.9 percent.
For those using talking books, the percentage of those with mild disabilities using this type of support is 3.3 percent.
For those using talking books, the percentage of those with moderate disabilities using this type of support is 2.6 percent.
For those using talking books, the percentage of those with severe disabilities using this type of support is 10.2 percent.
For those using talking books, the percentage of those with very severe disabilities using this type of support is 19.7 percent.
The total percentage of those using talking books is 7.7 percent.
For those using recording equipment, the percentage of those with mild disabilities using this type of support is 1.4 percent.
For those using recording equipment, the percentage of those with moderate disabilities using this type of support is 2.6 percent.
For those using recording equipment, the percentage of those with severe disabilities using this type of support is 6.3 percent.
For those using recording equipment, the percentage of those with very severe disabilities using this type of support is 17.9 percent.
The total percentage of those using recording equipment is 5.8 percent.
For those using amplifiers, such as FM or infrared, the percentage of those with mild disabilities using this type of support is 4.1 percent.
For those using amplifiers, such as FM or infrared, the percentage of those with moderate disabilities using this type of support is 5.1 percent.
For those using amplifiers, such as FM or infrared, the percentage of those with severe disabilities using this type of support is 7.4 percent.
For those using amplifiers, such as FM or infrared, the percentage of those with very severe disabilities using this type of support is 5.1 percent.
The total percentage of those using amplifiers, such as FM or infrared, is 5.3 percent.
For those using a computer with Braille or speech access, the percentage of those with mild disabilities using this type of support is 0.9 percent.
For those using a computer with Braille or speech access, the percentage of those with moderate disabilities using this type of support is 5.0 percent.
For those using a computer with Braille or speech access, the percentage of those with severe disabilities using this type of support is 5.6 percent.
For those using a computer with Braille or speech access, the percentage of those with very severe disabilities using this type of support is 12.3 percent.
The total percentage of those using a computer with Braille or speech access is 5.1 percent.
For those using a touch screen, the percentage of those with mild disabilities using this type of support is x percent.
For those using a touch screen, the percentage of those with moderate disabilities using this type of support is x percent.
For those using a touch screen, the percentage of those with severe disabilities using this type of support is 6.5 percent.
For those using a touch screen, the percentage of those with very severe disabilities using this type of support is 13.4 percent.
The total percentage of those using a touch screen is 4.3 percent.
For those using magnifiers, the percentage of those with mild disabilities using this type of support is 2.0 percent.
For those using magnifiers, the percentage of those with moderate disabilities using this type of support is 1.1 percent.
For those using magnifiers, the percentage of those with severe disabilities using this type of support is 2.9 percent.
For those using magnifiers, the percentage of those with very severe disabilities using this type of support is 2.5 percent.
The total percentage of those using magnifiers is 2.1 percent.
For those using sign language interpreters, the percentage of those with mild disabilities using this type of support is x percent.
For those using sign language interpreters, the percentage of those with moderate disabilities using this type of support is x percent.
For those using sign language interpreters, the percentage of those with severe disabilities using this type of support is 2.6 percent.
For those using sign language interpreters, the percentage of those with very severe disabilities using this type of support is 5.1 percent.
The total percentage of those using sign language interpreters is 1.8 percent.
For those using other aids or services, the percentage of those with mild disabilities using this type of support is 7.8 percent.
For those using other aids or services, the percentage of those with moderate disabilities using this type of support is 11.3 percent.
For those using other aids or services, the percentage of those with severe disabilities using this type of support is 11.9 percent.
For those using other aids or services, the percentage of those with very severe disabilities using this type of support is 22.1 percent.
The total percentage of those using other aids or services is 12.2 percent.
- An “ X ” indicates that the number was suppressed due to low response counts.
Source: Statistics Canada, 2006 Participation and Activity Limitation Survey
Many children with disabilities (17.9% or 27 970 children) need aids and devices at school but do not receive them. Among children with very severe disabilities, 36.9% need aids and devices but do not receive them. Boys are more likely than girls to have unmet needs for aids and devices at school (19.7% versus 14.6%).
Children with disabilities with unmet needs do not receive needed aids and devices for numerous reasons. In 78.9% of cases, parents cite school funding cutbacks or lack of funding in the school system as the main reason. More than a quarter of parents (26.1%) indicate that their children’s schools do not feel it is necessary for their children to have assistive devices or services for school.
Disability and youth learning aspirations
Expectations and goals that youth with disabilities have for their education and occupational achievement influence positive outcomes in the future. Footnote 18 Motivation and self-confidence enable youth to overcome barriers and challenges that are frequently experienced by people with disabilities and improve the likelihood of higher educational attainment. In particular, career aspirations can help provide a positive transition to adulthood for youth with disabilities.
An estimated 103 370 youth with disabilities (56.3%) attend school, college or university. Most (89.8%) of them are enrolled as full-time students. Of the remaining 10.2% enrolled as part-time students, 50.9% are studying part time because of their disabilities.
Among youth with disabilities who are attending some type of school, 60 630 or 58.7% are enrolled in mainstream primary or secondary school. As shown in Chart 3.3, rates of post-secondary enrolment in college and university are similar (15.5% and 15.1% respectively).
| Type of school | Mild to Moderate Disability | Severe to Very Severe Disability | Total |
|---|---|---|---|
| University | 18.0 | 7.6 | 15.1 |
| Community college, CEGEP,technical institute or private training institute (e.g. business school,trade/vocational school) | 15.9 | 14.6 | 15.5 |
| Special education school | 2.5 | 16.3 | 6.3 |
| Regular primary or secondary school | 59.8 | 55.7 | 58.7 |
| Other | 3.8 | 5.7 | 4.4 |
Chart 3.3 Text Description
This table has four main columns:
- Type of school
- Enrolment rate (in percentage) for mild to moderate disabilities in youth
- Enrolment rate (in percentage) for severe to very severe disabilities in youth
- Enrolment rate (in percentage) in total
The percentage of disabled youth enrolled in university with mild to moderate disabilities is 18.0 percent; with severe to very severe disabilities is 7.6 percent; and in total 15.1 percent.
The percentage of youth with disabilities enrolled in community college, CEGEP, technical institute or private training institution (e.g. business school, trade/vocational school) with mild to moderate disabilities is 15.9 percent; with severe to very severe disabilities is 14.6 percent; and in total 15.5 percent.
The percentage of youth with disabilities enrolled in special education school with mild to moderate disabilities is 2.5 percent; with severe to very severe disabilities is 16.3 percent; and in total 6.3 percent.
The percentage of youth with disabilities enrolled in regular primary or secondary school with mild to moderate disabilities is 59.8 percent; with severe to very severe disabilities is 55.7 percent and in total 58.7 percent.
The percentage of youth with disabilities enrolled in some other type of school with mild to moderate disabilities is 3.8 percent; with severe to very severe disabilities is 5.7 percent; and in total 4.4 percent.
Source: Statistics Canada, 2006 Participation and Activity Limitation Survey
Youth with disabilities sometimes need assistive devices or services to follow their courses and complete their school work. Overall, 22.4% of youth with disabilities need some type of assistive device or service to follow their courses. Youth with severe to very severe disabilities are more likely to need assistive devices or services than youth with mild to moderate disabilities (42.4% versus 14.4%).
Age of disability onset also plays a role: 35.7% of youth who acquired their disabilities at birth or before age 6 require assistive devices or services, compared to 10.2% of youth who acquired their disabilities between ages 11 and 24.
Many youth (66.7%) acquire their disabilities before completing all of their formal education and training. Attending school with disabilities creates barriers to having strong academic performance and completing education on time. Chart 3.4 lists barriers experienced by youth with disabilities.
| Effect | Mild to Moderate Disability | Severe to Very Severe Disability | Total |
|---|---|---|---|
| Began school later | 8.8 | 19.6 | 12.0 |
| Experienced school interruptions | 16.9 | 36.3 | 22.7 |
| Changed schools | 13.6 | 38.9 | 21.2 |
| Discontinued formal education or training | 13.3 | 30.7 | 18.5 |
| Had choice of career influenced | 32.3 | 66.2 | 42.3 |
| Changed course of studies | 16.8 | 41.4 | 24.1 |
| Took fewer classes | 23.9 | 58.8 | 34.2 |
| Had additional expenses | 8.8 | 16.2 | 11.0 |
| Attended special education classes | 23.9 | 55.2 | 33.3 |
| Undertook home study | 12.0 | 16.0 | 13.2 |
| Left community | 8.6 | 22.8 | 12.8 |
| Took longer to achieve present level of education | 24.9 | 57.8 | 34.5 |
Chart 3.4 Text Description
This table has four columns:
- Effect
- Youth affected (percentage) with mild to moderate disabilities
- Youth affected (percentage) with severe to very severe disabilities
- Youth affected (percentage) in total
8.8 percent of youth with mild to moderate disabilities began school later.
19.6 percent of youth with severe to very severe disabilities began school later.
In total, 12.0 percent of youth with disabilities began school later.
16.9 percent of youth with mild to moderate disabilities experienced school interruptions.
36.3 percent of youth with severe to very severe disabilities experienced school interruptions.
In total, 22.7 percent of youth with disabilities experienced school interruptions.
13.6 percent of youth with mild to moderate disabilities changed schools.
38.9 percent of youth with severe to very severe disabilities changed schools.
In total, 21.2 percent of youth having disabilities changed schools.
13.3 percent of youth with mild to moderate disabilities discontinued formal education or training.
30.7 percent of youth with severe to very severe disabilities discontinued formal education or training.
In total, 18.5 percent of youth with disabilities discontinued formal education or training.
32.3 percent of youth with mild to moderate disabilities had choice of career influenced.
66.2 percent of youth with severe to very severe disabilities had choice of career influenced.
In total, 42.3 percent of youth with disabilities had choice of career influenced.
16.8 percent of youth with mild to moderate disabilities changed course of studies.
41.4 percent of youth with severe to very severe disabilities changed course of studies.
In total, 24.1 percent of youth with disabilities changed course of studies.
23.9 percent of youth with mild to moderate disabilities took fewer classes.
58.8 percent of youth with severe to very severe disabilities took fewer classes.
In total, 34.2 percent of youth with disabilities took fewer classes.
8.8 percent of youth with mild to moderate disabilities had additional expenses.
16.2 percent of youth with severe to very severe disabilities had additional expenses.
In total, 11.0 percent of youth with disabilities had additional expenses.
23.9 percent of youth with mild to moderate disabilities attended special education classes.
55.2 percent of youth with severe to very severe disabilities attended special education classes.
In total, 33.3 percent of youth with disabilities attended special education classes.
12.0 percent of youth with mild to moderate disabilities undertook home study.
16.0 percent of youth with severe to very severe disabilities undertook home study.
In total, 13.2 percent of youth with disabilities undertook home study.
8.6 percent of youth with mild to moderate disabilities left community.
22.8 percent of youth with severe to very severe disabilities left community.
In total, 12.8 percent of youth with disabilities left community.
24.9 percent of youth with mild to moderate disabilities took longer to achieve present level of education.
57.8 percent of youth with severe to very severe disabilities took longer to achieve present level of education.
In total, 34.5 percent of youth with disabilities took longer to achieve present level of education.
Source: Statistics Canada, 2006 Participation and Activity Limitation Survey
Over one quarter (27.9%) of youth with severe to very severe disabilities who have had their disabilities since birth began school later than their peers. Youth who developed their disabilities after age 16 are roughly twice as likely as youth who have had their disabilities since birth to experience school interruptions for long periods of time (31.6% versus 16.6%). Youth with severe to very severe disabilities are more than twice as likely as youth with mild to moderate disabilities to have school interruptions (36.3% versus 16.9%).
The paths youth with disabilities take to enter the labour force or further their education are different from the paths taken by youth without disabilities. Although youth with disabilities have the same types of aspirations as youth without disabilities—that is, to complete their education and find successful employment—they often encounter barriers and challenges in pursuing their goals.
Many youth with disabilities report that their career aspirations have been influenced by their conditions. Youth who have had their disabilities since an early age (birth to age 5) are more likely than youth who acquired their disabilities later in their lives (between ages 16 and 24) to report that their disabilities influenced their career goals (55.8% versus 34.8%). Youth with severe to very severe disabilities are twice as likely as youth with mild to moderate disabilities to report that their conditions influenced their choice of career (66.2% versus 32.3%).
Similarly, youth with disabilities with an early age of onset (birth to age 5) are more likely to report having changed their course of studies (30.3%), taken fewer classes (46.5%) and taken longer to achieve their present education (43.9%). Conversely, 28.1% of youth who acquired their disabilities between ages 16 and 24 discontinued their education due to their disabilities, compared to 12.6% of youth who had their disabilities since birth. This suggests that later onset of disabilities can result in sudden effects on education and career goals.
The type of education pursued can be one indicator of career aspirations for youth with disabilities. Chart 3.5 lists the breakdowns of type of education pursued by gender and severity of disability.
| Trades Certificate | College | University | Post-Graduate | Other | |
|---|---|---|---|---|---|
| Girls and women | |||||
| Mild to moderate | 11.7 | 28.2 | 51.3 | X | 4.8 |
| Severe to very severe | 15.8 | 35.4 | 33.9 | X | 13.5 |
| Total | 12.6 | 29.8 | 47.5 | X | 6.8 |
| Boys and men | |||||
| Mild to moderate | 19.9 | 25.0 | 42.1 | X | 10.1 |
| Severe to very severe | 21.8 | 32.8 | 17.0 | X | 18.6 |
| Total | 20.4 | 26.8 | 36.5 | X | 12.0 |
| Both genders | |||||
| Mild to moderate | 15.2 | 26.9 | 47.3 | X | 7.1 |
| Severe to very severe | 18.4 | 34.3 | 26.6 | X | 15.7 |
| Total | 15.9 | 28.5 | 42.7 | 2.6 | 9.0 |
Chart 3.5 Text Description
This chart describes the type of education pursued by youth, sorted by gender and severity of disability, 2006. The columns describe (in percentages) which type of education is pursued:
- Trades Certificate
- College
- University
- Post Graduate
- Other
For girls and women with mild to moderate level of disabilities:
- 11.7 percent pursued a Trades Certificate program
- 28.2 percent pursued a College program
- 51.3 percent pursued a University program
- “x” percent pursued a Post Graduate program (where “x” indicates that the number was suppressed due to low response counts)
- 4.8 percent pursued Other
For girls and women with severe to very severe level of disabilities:
- 15.8 percent pursued a Trades Certificate program
- 35.4 percent pursued a College program
- 33.9 percent pursued a University program
- “x” percent pursued a Post Graduate program (where x indicates that the number was suppressed due to low response counts)
- 13.5 percent pursued Other
For the total number in percentages of girls and women with disabilities in post secondary education:
- 12.6 percent pursued a Trades Certificate program
- 29.8 percent pursued a College program
- 47.5 percent pursued a University program
- “x” percent pursued a Post Graduate program (where x indicates that the number was suppressed due to low response counts)
- 6.8 percent pursued Other
For boys and men with mild to moderate level of disabilities:
- 19.9 percent pursued a Trades Certificate program
- 25.0 percent pursued a College program
- 42.1 percent pursued a University program
- “x” percent pursued a Post Graduate program (where x indicates that the number was suppressed due to low response counts)
- 10.1 percent pursued Other
For boys and men with severe to very severe level of disabilities:
- 21.8 percent pursued a Trades Certificate program
- 32.8 percent pursued a College program
- 17.0 percent pursued a University program
- “x” percent pursued a Post Graduate program (where x indicates that the number was suppressed due to low response counts)
- 18.6 percent pursued Other
For the total number in percentages of boys and men with disabilities in post secondary education:
- 20.4 percent pursued a Trades Certificate program
- 26.8 percent pursued a College program
- 36.5 percent pursued a University program
- “x” percent pursued a Post Graduate program (where x indicates that the number was suppressed due to low response counts)
- 12.0 percent pursued Other
For both genders with mild to moderate level of disabilities:
- 15.2 percent pursued a Trades Certificate program
- 26.9 percent pursued a College program
- 47.3 percent pursued a University program
- “x” percent pursued a Post Graduate program (where x indicates that the number was suppressed due to low response counts)
- 7.1 percent pursued Other
For both genders with severe to very severe level of disabilities:
- 18.4 percent pursued a Trades Certificate program
- 34.3 percent pursued a College program
- 26.6 percent pursued a University program
- “x” percent pursued a Post Graduate program (where x indicates that the number was suppressed due to low response counts)
- 15.7 percent pursued Other
For the total number in percentages of both genders with disabilities in post secondary education:
- 15.9 percent pursued a Trades Certificate program
- 28.5 percent pursued a College program
- 42.7 percent pursued a University program
- 2.6 percent pursued a Post Graduate program
- 9.0 percent pursued Other
- An “ X ” indicates that the number was suppressed due to low response counts.
- Population consists of youth who are enrolled in post-secondary education.
- “Other” consists of youth who are enrolled in post-secondary education but are not pursuing a trades certificate, diploma or degree (e.g. youth enrolled in single classes).
Source: Statistics Canada, 2006 Participation and Activity Limitation Survey
Adult learning
Adult learning Footnote 19 is an important aspect of lifelong learning and plays a role in the productivity, innovation and employability of individuals. Participation in adult learning is connected to a number of factors related to workforce participation. This section discusses adult learning in the workplace and training for adults with disabilities.
Over a quarter (28.2%) of younger and older working-age adults with disabilities have gone back to school for retraining because of their disabilities. Footnote 20 Adults who first experienced their disabilities between ages 25 and 34 are most likely to have gone back to school for retraining (38.5%). Adults who acquired a disability near the end of their working years (ages 45 to 64) are least likely to have returned to school for retraining (21.9%). Increased severity of disability increases the likelihood that a worker will return to school: 36.5% of adults with severe to very severe disabilities have returned to school because of their disabilities, compared to 22.4% of adults with mild to moderate disabilities.
Positive job outcomes can be associated with workplace training. In 2005–2006, 32.9% of adults with disabilities received formal classroom training related to their job. In addition, 31.9% of adults with disabilities received informal training (i.e. on-the-job training) related to their job, and 12.8% took other work-related training to improve their skills or acquire new ones.
Adults with more severe disabilities are more likely than adults with mild disabilities to report that classroom and informal training benefit them in their work: 85.5% of adults with very severe disabilities apply the knowledge and skills learned in classroom training to their work, compared to 62.3% of adults with mild disabilities. As well, 77.2% of adults with very severe disabilities find they use the skills and knowledge learned through informal training to a great extent in their work. This indicates that access to workplace training may have greater benefits for those with more severe disabilities.
Educational attainment reflects the skills and knowledge a person acquires through schooling and can be an indicator of likelihood of success in the workforce. However, gender and severity of disability can affect educational attainment. Chart 3.6 lists the highest level of educational attainment by gender and severity of disability for working-age adults.
| No High School Diploma | High School Diploma | Trades Certificate | College Diploma | University Degree | Post-Graduate | |
|---|---|---|---|---|---|---|
| Women | ||||||
| Mild | 20.7 | 27.7 | 10.1 | 27.0 | 9.2 | 5.4 |
| Moderate | 20.9 | 24.5 | 11.5 | 27.0 | 10.8 | 5.3 |
| Severe | 28.8 | 24.4 | 12.2 | 22.3 | 5.8 | 6.4 |
| Very severe | 28.8 | 28.1 | 8.0 | 21.2 | 10.8 | 3.1 |
| Total | 24.2 | 26.0 | 10.7 | 24.8 | 8.9 | 5.3 |
| Men | ||||||
| Mild | 18.7 | 25.1 | 18.4 | 18.8 | 11.1 | 7.9 |
| Moderate | 23.5 | 21.8 | 23.3 | 18.7 | 7.1 | 5.6 |
| Severe | 37.4 | 20.6 | 17.9 | 15.5 | 6.4 | 2.2 |
| Very severe | 35.3 | 19.9 | 15.5 | 22.3 | 1.8 | 5.2 |
| Total | 26.8 | 22.4 | 19.2 | 18.4 | 7.7 | 5.5 |
| Both genders | ||||||
| Mild | 19.7 | 26.4 | 14.3 | 22.8 | 10.1 | 6.7 |
| Moderate | 22.1 | 23.3 | 16.9 | 23.2 | 9.1 | 5.4 |
| Severe | 32.5 | 22.7 | 14.7 | 19.4 | 6.1 | 4.6 |
| Very severe | 31.6 | 24.5 | 11.3 | 21.7 | 6.9 | 4.0 |
| Total | 25.4 | 24.3 | 14.7 | 21.8 | 8.3 | 5.5 |
Chart 3.6 Text Description
The chart looks at the highest level of education attained for women, men and both genders, depending on the severity of their disability (mild, moderate, severe, very severe, and total).
The rate of attainment, in percentages, describe six education levels:
- No high school
- High school diploma
- Trades certificate
- College diploma
- University degree
- Post graduate
For each rate of attainment, the chart describes what the level of disability is (mild, moderate, severe, very severe and total) and what gender (women, men, and both genders).
For women with mild disabilities the rate of attainment is as follows:
- No high school 20.7 percent
- High school 27.7 percent
- Trades certificate 10.1 percent
- College diploma 27.0 percent
- University degree 9.2 percent
- Post-graduate 5.4 percent
For women with moderate disabilities the rate of attainment is as follows:
- No high school 20.9 percent
- High school 24.5 percent
- Trades certificate 11.5 percent
- College diploma 27.0 percent
- University degree 10.8 percent
- Post-graduate 5.3 percent
For women with severe disabilities the rate of attainment is as follows:
- No high school 28.8 percent
- High school 24.4 percent
- Trades certificate 12.2 percent
- College diploma 22.3 percent
- University degree 5.8 percent
- Post-graduate 6.4 percent
For women with very severe disabilities the rate of attainment is as follows:
- No high school 28.8 percent
- High school 28.1 percent
- Trades certificate 8.0 percent
- College diploma 21.2 percent
- University degree 10.8 percent
- Post-graduate 3.1 percent
The total numbers for women with disabilities and rate of attainment is as follows:
- No high school 24.2 percent
- High school 26.0 percent
- Trades certificate 10.7 percent
- College diploma 24.8 percent
- University degree 8.9 percent
- Post-graduate 5.3 percent
For men with mild disabilities the rate of attainment is as follows:
- No high school 18.7 percent
- High school 25.1 percent
- Trades certificate 18.4 percent
- College diploma 18.8 percent
- University degree 11.1 percent
- Post-graduate 7.9 percent
For men with moderate disabilities the rate of attainment is as follows:
- No high school 23.5 percent
- High school 21.8 percent
- Trades certificate 23.3 percent
- College diploma 18.7 percent
- University degree 7.1 percent
- Post-graduate 5.6 percent
For men with severe disabilities the rate of attainment is as follows:
- No high school 37.4 percent
- High school 20.6 percent
- Trades certificate 17.9 percent
- College diploma 15.5 percent
- University degree 6.4 percent
- Post-graduate 2.2 percent
For men with very severe disabilities the rate of attainment is as follows:
- No high school 35.3 percent
- High school 19.9 percent
- Trades certificate 15.5 percent
- College diploma 22.3 percent
- University degree 1.8 percent
- Post-graduate 5.2 percent
The total numbers for men with disabilities and rate of attainment is as follows:
- No high school 26.8 percent
- High school 22.4 percent
- Trades certificate 19.2 percent
- College diploma 18.4 percent
- University degree 7.7 percent
- Post-graduate 5.5 percent
For both genders with mild disabilities the rate of attainment is as follows:
- No high school 19.7 percent
- High school 26.4 percent
- Trades certificate 14.3 percent
- College diploma 22.8 percent
- University degree 10.1 percent
- Post-graduate 6.7 percent
For both genders with moderate disabilities the rate of attainment is as follows:
- No high school 22.1 percent
- High school 23.3 percent
- Trades certificate 16.9 percent
- College diploma 23.2 percent
- University degree 9.1 percent
- Post-graduate 5.4 percent
For both genders with severe disabilities the rate of attainment is as follows:
- No high school 32.5 percent
- High school 22.7 percent
- Trades certificate 14.7 percent
- College diploma 19.4 percent
- University degree 6.1 percent
- Post-graduate 4.6 percent
For both genders with very severe disabilities the rate of attainment is as follows:
- No high school 31.6 percent
- High school 24.5 percent
- Trades certificate 11.3 percent
- College diploma 21.7 percent
- University degree 6.9 percent
- Post-graduate 4.0 percent
The total numbers for both genders with disabilities and rate of attainment is as follows:
- No high school 25.4 percent
- High school 24.3 percent
- Trades certificate 14.7 percent
- College diploma 21.8 percent
- University degree 8.3 percent
- Post-graduate 5.5 percent
Source: Statistics Canada, 2006 Participation and Activity Limitation Survey
Although the gap between men and women has decreased with respect to educational attainment, there are still large gender differences in certain areas, such as trades and, to a lesser degree, college. Only 1.8% of men with very severe disabilities have a university degree as their highest level of educational attainment, compared to 10.8% of women with very severe disabilities. Compared to men, women more often have only a high school education (22.4% of men versus 26.0% of women).
People with severe or very severe disabilities (32.5% and 31.6% respectively) are more likely not to have a high school diploma than those with mild or moderate disabilities (19.7% and 22.1% respectively). Overall, people with mild disabilities are more likely to have a university or post-graduate degree than those with more severe disabilities; however, the difference between the university and post-graduate degree attainment rates for those with moderate, severe and very severe disabilities is minimal.
Conclusion
Many people with disabilities face disability-related challenges throughout their lifelong learning journeys. In childhood, support from educators and parents is an invaluable resource that enables children with disabilities to succeed. In adolescence and young adulthood, access to technical supports (e.g. aids and devices) and human supports (e.g. tutors and note takers) opens doors to post-secondary education for many students with disabilities. In adulthood, access to retraining has a considerable impact on the ability of adults with late-acquired disabilities to remain gainfully employed. With the right kinds of supports, people with disabilities can benefit tremendously from lifelong learning. However, the statistics presented in this chapter reveal that for many people with disabilities, especially those with more severe disabilities, there is still some room for improvement in ensuring that all potential learners have equitable access to education.
Spotlight on programs: Enabling Accessibility Fund
The spotlight in Chapter Two described a health-related Enabling Accessibility Fund (EAF) initiative that improved the accessibility of the Alzheimer Society of Canada’s website.
This chapter presents a second EAF project, related to learning. As part of the EAF’s commitment to remove barriers for Canadians with disabilities and fund projects across Canada, this funded project is designed to support child development, an essential part of early education and life skills development.
To find out how to apply for financial assistance or for more information about this program, please call the EAF toll free at 1-866-268-2502.
Spotlight on the Fort St. John Child Development Centre
The EAF contribution of $47,200 is helping to build the Life Skills Centre at the Fort St. John Child Development Centre in the city of Fort St. John, British Columbia. The Life Skills Centre will provide after-school programming, a "Saturday Club" and peer mentoring opportunities for many local children and youth ages 6 to 19, including children and youth with disabilities.
“
The Life Skills Centre project is a much-needed enhancement to the current services and programs offered by the Child Development Centre. It will provide an opportunity to increase service access for youth with special needs through mentoring and life skills programs
," said Ms. Penny Gagnon, Executive Director of the Child Development Centre. "
Once completed, the Life Skills Centre will allow youth to develop daily living activity skills and will host peer mentoring programs.
”
For more information on the Fort St. John Child Development Centre, visit www.cdcfsj.ca/project-build-a-fort.html.