
2011 FDR - Section 5: Financial well-being
People with disabilities generally have lower incomes than people without disabilities. As a group however, seniors with disabilities actually do well in terms of income. Income levels for seniors with and without disabilities are closer than for any other age group in Canada. Footnote 3
This is a result of government transfers—direct payments to seniors that come primarily from the federal government, but also from the provincial and municipal governments. Yet, while overall income levels may be adequate, they do not reflect the fact that having a disability is expensive. Despite Canada’s comprehensive medical supports and social programs, people with disabilities often have to pay out-of-pocket to meet their disability-related needs. These out-of-pocket, disability-related costs can add up and sometimes push seniors with disabilities with otherwise adequate incomes into the low-income population.
Data in this section come from the 2008 Survey of Labour and Income Dynamics (SLID) and the 2006 Participation and Activity Limitation Survey (PALS).
Income sources
Government transfers are the main source of income for 70 percent of seniors with disabilities.
The vast majority of Canadian seniors (with and without disabilities) receive most of their income through the Canada Pension Plan (CPP) or Quebec Pension Plan (QPP), the Old Age Security (OAS) program and the Guaranteed Income Supplement (GIS). Since the Government of Canada introduced these programs, low income rates among seniors have steadily declined. These programs are delivered to seniors regardless of disability status.
Government transfers
Government transfers are the main source of income for over 60 percent of Canadian seniors, both with and without disabilities. For 70 percent of seniors with disabilities, government transfers are their main source of income, compared to 59 percent of seniors without disabilities.
Among younger seniors aged 65 to 74, those with disabilities are much more reliant on government transfers as their main source of income than those without disabilities (68 percent versus 55 percent). While older seniors with disabilities aged 75 and over are also more reliant on government transfers than those without disabilities, the gap is smaller (71 percent versus 67 percent).
When people become seniors, they are very likely to start relying on government transfers for income stability. Figure 5.1 shows that, for older Canadians (aged 55 to 64), jobs are the main source of income for 30 percent of those who have a disability. After the age of 65, there is a big drop in the number of people depending on job income—for younger seniors, only 3 percent of those with disabilities still have job income as their main source of income. The main source of income after government transfers is private retirement pensions. Just over two in ten seniors with disabilities depend primarily on private retirement pensions.
Figure 5.1 Main source of income for older Canadians and seniors with disabilities, by age group (%), 2008
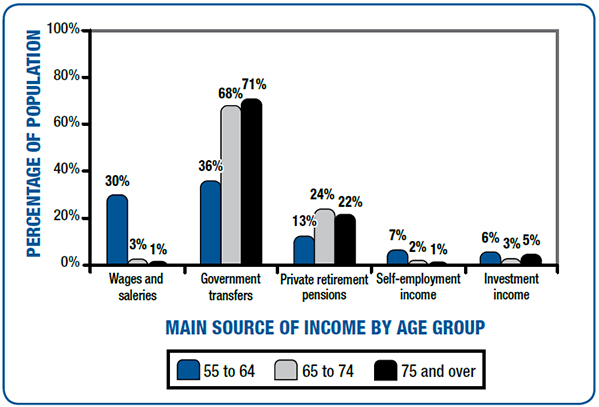
Figure 5.1 Text Description
This vertical bar graph presents data from the 2008 Survey of Labour and Income Dynamics. It illustrates the main source of income for older Canadians and seniors with disabilities by age group by percentage.
This vertical bar graph is divided into five sections, each section representing a main source of income. The horizontal axis lists the main sources of income. On the axis from left to right are the following categories:
- Wages and salaries
- Government transfers
- Private retirement pensions
- Self-employment income
- Investment income
The vertical axis is measured by percentages and increases in increments of 20 from 0 to 100.
For the 55 to 64 age group
- 30 percent with disabilities receive wages and salaries as their main source of income.
- 36 percent with disabilities receive government transfers as their main source of income.
- 13 percent with disabilities receive private retirement pensions as their main source of income.
- 7 percent with disabilities receive self employment income as their main source of income.
- 6 percent with disabilities receive investment income as their main source of income.
For the 65 to 74 age group
- 3 percent with disabilities receive wages and salaries as their main source of income.
- 68 percent with disabilities receive government transfers as their main source of income.
- 24 percent with disabilities receive private retirement pensions as their main source of income.
- 2 percent with disabilities receive self employment income as their main source of income.
- 3 percent with disabilities receive investment income as their main source of income.
For the 75 and over age group
- 1 percent with disabilities receive wages and salaries as their main source of income.
- 71 percent with disabilities receive government transfers as their main source of income.
- 22 percent with disabilities receive private retirement pensions as their main source of income.
- 1 percent with disabilities receive self employment income as their main source of income.
- 5 percent with disabilities receive investment income as their main source of income.
Source: 2008 Survey of Labour and Income Dynamics
Older Canadians and seniors without disabilities, as shown in Figure 5.2, rely less on government transfers than those with disabilities. In the 55 to 64 age group, for example, only 11 percent of older Canadians without disabilities have government transfers as their main source of income, compared to 36 percent of older Canadians with disabilities.
Figure 5.2 Main source of income for older Canadians and seniors without disabilities, by age group (%), 2008

Figure 5.2 Text Description
This vertical bar graph presents data from the 2008 Survey of Labour and Income Dynamics. It illustrates the main source of income for older Canadians and seniors without disabilities by age group by percentage.
This vertical bar graph is divided into five sections, each section representing a main source of income. The horizontal axis lists the main sources of income. On the axis from left to right are the following categories:
- Wages and salaries
- Government transfers
- Private retirement pensions
- Self-employment income
- Investment income
The vertical axis is measured by percentages and increases in increments of 20 from 0 to 100.
For the 55 to 64 age group
- 52 percent without disabilities receive wages and salaries as their main source of income.
- 11 percent without disabilities receive government transfers as their main source of income.
- 15 percent without disabilities receive private retirement pensions as their main source of income.
- 10 percent without disabilities receive self employment income as their main source of income.
- 6 percent without disabilities receive investment income as their main source of income.
For the 65 to 74 age group
- 8 percent without disabilities receive wages and salaries as their main source of income.
- 55 percent without disabilities receive government transfers as their main source of income.
- 29 percent without disabilities receive private retirement pensions as their main source of income.
- 3 percent without disabilities receive self employment income as their main source of income.
- 3 percent without disabilities receive investment income as their main source of income.
For the 75 and over age group
- 1 percent without disabilities receive wages and salaries as their main source of income.
- 67 percent without disabilities receive government transfers as their main source of income.
- 23 percent without disabilities receive private retirement pensions as their main source of income.
- 1 percent without disabilities receive self employment income as their main source of income
- 7 percent without disabilities receive investment income as their main source of income.
Source: 2008 Survey of Labour and Income Dynamics
As shown in Figure 5.3, a little more than half of seniors with disabilities aged 65 to 74 receive OAS and GIS as their main government transfer—slightly higher than seniors without disabilities (48 percent) in the same age group. Seniors, regardless of disability status, either receive OAS and GIS or CPP/QPP as their main government transfer. Most older Canadians aged 55 to 64 receive CPP/QPP as their main government transfer but also receive other forms of government transfers, such as social assistance. Among older Canadians, 17 percent of those with disabilities receive social assistance as their main government transfer, compared to 4 percent of those without disabilities. Since most seniors stop working at age 65 and obtain the majority of their income through programs like OAS, GIS and CPP/QPP, they tend not to receive other government transfers in large amounts, such as Workers’ Compensation or social assistance (shown in Figure 5.3 by the letter x).
| Main government transfer received | ||||||
|---|---|---|---|---|---|---|
| 55 to 64 | 65 to 74 | 75 and over | ||||
| With disabilities | Without disabilities | With disabilities | Without disabilities | With disabilities | Without disabilities | |
| OAS & GIS | 4 | 3 | 52 | 48 | 51 | 53 |
| CPP/QPP | 40 | 37 | 44 | 49 | 47 | 46 |
| Social Assistance | 17 | 4 | x | x | x | x |
| Employment Insurance benefits | 9 | 13 | x | x | x | x |
| Workers' compensation benefits | 8 | 3 | x | x | x | x |
| GST/HST Credit | 12 | 17 | x | x | x | x |
| Provincial/ territorial tax credits | 9 | 19 | x | x | x | x |
x = suppressed due to low counts
Figure 5.3 Text Description
This table presents data from the 2008 Survey of Labour and Income Dynamics. The table presents the main government transfers received (in rows) by age group and disability status (in columns) by percentage.
The columns are divided into the following age group sections from left to right:
- 55 to 64
- 65 to 74
- 75 and over
The rows describe the main government transfers received.
For the 55 to 64 age group
- 4 percent with disabilities receive OAS and GIS as their main government transfer.
- 3 percent without disabilities receive OAS and GIS as their main government transfer.
- 40 percent with disabilities receive CPP/QPP as their main government transfer.
- 37 percent without disabilities receive CPP/QPP as their main government transfer.
- 17 percent with disabilities receive Social Assistance as their main government transfer.
- 4 percent without disabilities receive Social Assistance as their main government transfer.
- 9 percent with disabilities receive Employment Insurance benefits as their main government transfer.
- 13 percent without disabilities receive Employment Insurance benefits as their main government transfer.
- 8 percent with disabilities receive Workers Compensation benefits as their main government transfer.
- 3 percent without disabilities receive Workers Compensation benefits as their main government transfer.
- 12 percent with disabilities receive GST/HST Credit as their main government transfer.
- 17 percent without disabilities receive GST/HST Credit as their main government transfer.
- 9 percent with disabilities receive Provincial/Territorial tax credits as their main government transfer.
- 19 percent without disabilities receive Provincial/Territorial tax credits as their main government transfer.
For the 65 to 74 age group
- 52 percent with disabilities receive OAS and GIS as their main source of government transfer.
- 48 percent without disabilities receive OAS and GIS as their main source of government transfer.
- 44 percent with disabilities receive CPP/QPP as their main government transfer.
- 49 percent without disabilities receive CPP/QPP as their main government transfer.
- The counts were too low to give data on what percentage with disabilities receive Social Assistance, Employment Insurance benefits, Workers Compensation benefits, GST/HST Credit and Provincial/Territorial tax credits as their main government transfer.
- The counts were too low to give data on what percentage without disabilities receive Social Assistance, Employment Insurance benefits, Workers Compensation benefits, GST/HST Credit and Provincial/Territorial tax credits as their main government transfer.
For the 75 and over age group
- 51 percent with disabilities receive OAS and GIS as their main source of government transfer.
- 53 percent without disabilities receive OAS and GIS as their main source of government transfer.
- 47 percent with disabilities receive CPP/QPP as their main government transfer.
- 46 percent without disabilities receive CPP/QPP as their main government transfer.
- The counts were too low to give data on what percentage with disabilities receive Social Assistance, Employment Insurance benefits, Workers Compensation benefits, GST/HST Credit and Provincial/Territorial tax credits as their main government transfer.
- The counts were too low to give data on what percentage without disabilities receive Social Assistance, Employment Insurance benefits, Workers Compensation benefits, GST/HST Credit and Provincial/Territorial tax credits as their main government transfer.
Source: 2008 Survey of Labour and Income Dynamics
Income levels
Seniors with disabilities have slightly lower income levels than seniors without disabilities.
In general, seniors with disabilities are at lower income levels compared to seniors without disabilities, from both personal and household perspectives. The median Footnote 4 annual personal income for seniors with disabilities is $20,827, compared to $22,821 for seniors without disabilities. Similarly, the adjusted median household income Footnote 5 is $29,703 for seniors with disabilities, which is about 8 percent less than the income for seniors without disabilities ($32,125).
Marital status
Marital status has an impact on household income level for seniors with and without disabilities. Seniors with disabilities who are separated or single (never married) have 40 percent and 16 percent lower median household income respectively than seniors without disabilities. The two lowest median household incomes, $21,521 and $24,272, are observed for separated and divorced seniors with disabilities. However, the median household income for widows with disabilities is 7 percent higher than widows without disabilities, which is partly because many widows continue receiving government disability compensation or benefits after their partners are deceased.
Household income gap
Analysis has shown that the household income gap between seniors with and without disabilities widens as income level increases. As shown in Figure 5.4, there is a difference of $141 in the median household income between those with and without disabilities in the bottom 5 percent household income bracket, compared to a difference of $7,137 between those in the top 5 percent bracket.
| Income percentile level | Age group: 65 and over | ||
|---|---|---|---|
| With disabilities | Without disabilities | Difference | |
| 5% | 15,975 | 16,117 | 141 |
| 10% | 17,523 | 18,127 | 604 |
| 25% | 21,397 | 22,559 | 1,162 |
| 50% | 29,703 | 32,125 | 2,422 |
| 75% | 42,106 | 46,026 | 3,920 |
| 90% | 57,440 | 61,611 | 4,170 |
| 95% | 69,416 | 76,553 | 7,137 |
Figure 5.4 Text Description
This table presents data from the 2008 Survey of Labour and Income Dynamics. It lists the adjusted median household income by income percentile level, for seniors, by disability status.
From left to right, there are four columns.
The first column lists income percentile levels. The income percentile levels are 5%, 10%, 25%, 50%, 75%, 90% and 95%. The second column lists median household income for seniors with disabilities. The third column lists median income for seniors without disabilities. The fourth column presents the difference in median income between seniors with and without disabilities.
For the 5% income percentile, the median household income for seniors with disabilities is $15,975 and for seniors without disabilities is $16,117, with a difference of $141.
For income percentile 10%, the median household income for seniors with disabilities is $17,523 and for seniors without disabilities is $18,127, with a difference of $604.
For the 25% income percentile, the median household income for seniors with disabilities is $21,397 and for seniors without disabilities is $22,559, with a difference of $1,162.
For income percentile 50%, the median household income for seniors with disabilities is $29,703 and for seniors without disabilities is $32,125, with a difference of $2,422.
For the 75% income percentile, the median household income for seniors with disabilities is $42,106 and for seniors without disabilities is $46,026, with a difference of $3,920.
For the 90% income percentile, the median household income for seniors with disabilities is $57,440 and for seniors without disabilities is $61,611, with a difference of $4,170.
For the 95% income percentile, the median household income for seniors with disabilities is $69,416 and for seniors without disabilities is $76,553, with a difference of $7,137.
Source: 2008 Survey of Labour and Income Dynamics
Low income
Seniors are the least likely age group to live on a low income, compared to all other age groups in Canada. Overall, 6 percent of seniors (with and without disabilities) live in low income households.
Some interesting observations exist among different age groups. For seniors aged 65 to 74, 6 percent of those with disabilities live in low income, compared to 5 percent of those without disabilities. In contrast, for seniors aged 75 and over, seniors with disabilities are slightly less likely to live in low income than those without disabilities (6 percent compared to 7 percent, respectively).
Seniors with disabilities who live alone are more likely to fall into the low income level than those who live with one or more other people. Seniors with disabilities living with other people have a median household income of $32,991, which is significantly higher than the median $21,653 for those living alone.
Disability-related costs
Disability-related costs are an additional financial concern for many seniors with disabilities.
While financial support is available for some disability-related costs, many seniors with disabilities must cover the cost of their disability-related expenses. Out-of-pocket costs can be related to extra health care or social services associated with disability, or to home modifications or aids and devices that allow people with disabilities to live independently. In all cases, out-of-pocket costs can be very high.
These costs include amounts that are not covered by insurance, such as deductibles, co-payments and expenses over coverage limits. They do not include any costs that are reimbursed by insurance or a government program.
Data about out-of-pocket costs come from the 2006 Participation and Activity Limitation Survey.
Disability aids and devices
Seniors with more severe disabilities pay more than twice as much in out-of-pocket costs for aids and devices than seniors with less severe disabilities.
About 67 percent of seniors with disabilities require disability-related aids or devices. Of those, 28 percent have out-of-pocket costs associated with obtaining needed aids and devices and 19 percent spend more than $500 per year on their aids and devices.
About 32 percent of seniors with more severe disabilities who have disability-related aids and devices have out-of-pocket expenses, compared to 22 percent of seniors with mild or moderate disabilities.
Figure 5.5 shows that older Canadians and seniors with more severe disabilities have higher out-of-pocket costs for aids and devices. Seniors with more severe disabilities are more likely to need more complex equipment and multiple pieces of equipment, which partially explains why average out-of-pocket expenses for seniors with more severe disabilities are higher.
Figure 5.5 Annual out-of-pocket costs for aids and devices, by disability severity and age group ($), 2006

Figure 5.5 Text Description
This vertical bar graph presents data from the 2006 Participation and Activity Limitation Survey. It illustrates the annual out-of-pocket costs for aids and devices by disability severity and age group.
This graph is divided into three age categories. The horizontal axis lists the age groups. On the axis from left to right are the following categories:
- 55 to 64
- 65 to 74
- 75 and over
The vertical axis is measured in dollars and increases in increments of 50 from 0 to 250.
In the 55 to 64 age group, the annual out-of-pocket costs for aids and devices is 90 dollars for people with mild or moderate disabilities and 123 dollars for people with severe or very severe disabilities.
In the 65 to 74 age group, the annual out-of-pocket costs for aids and devices is 61 dollars for people with mild or moderate disabilities and 130 dollars for people with severe or very severe disabilities.
In the 75 and over age group, the annual out-of-pocket costs for aids and devices is 52 dollars for people with mild or moderate disabilities and 123 dollars for people with severe or very severe disabilities.
Source: 2006 Participation and Activity Limitation Survey
Home modifications
The average out-of-pocket cost for home modifications among seniors aged 75 and over is $4,814.
Seniors with disabilities often require modifications inside their homes so that they can feel safer and live more independently. Lowered shelving, ramps, support bars and wider hallways are all examples of home modifications that prevent injuries and help seniors with disabilities move freely within their homes.
Overall, 6 percent of seniors with disabilities have out-of-pocket costs for modifications to their residence because of their condition. This number is slightly higher for seniors aged 75 and over (7 percent). Among seniors aged 75 and over who have out-of-pocket costs, the average out-of-pocket cost for home modifications is $4,814.
Health care and social services costs
Of the 1.5 million seniors with disabilities who make use of either health care or social services, 20 percent have out-of-pocket costs.
In 2006, 1.5 million seniors with disabilities made use of either health care or social services. Of these, 20 percent reported that they had direct out-of-pocket costs for those services and 34 percent spent more than $500. The overall average cost for older Canadians and seniors with disabilities that used health care and social services, including those that did so without personal costs, was $138.
Figure 5.6 presents the average annual out-of-pocket costs for health care and social services by age and severity of disability. Those with severe or very severe disabilities experience nearly double the costs on average compared to those with mild or moderate disabilities.
Figure 5.6 Average annual out-of-pocket costs for health care and social services, by disability severity and age group ($), 2006
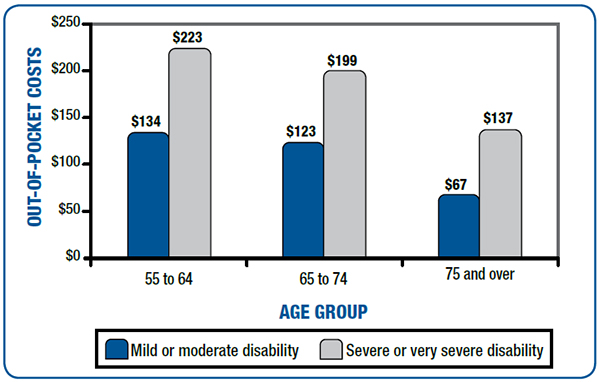
Figure 5.6 Text Description
This vertical bar graph presents data from the 2006 Participation and Activity Limitation Survey. It illustrates the annual out-of-pocket costs for health care and social services by disability severity and age group.
This graph is divided into three age categories. The horizontal axis lists the age groups. On the axis from left to right are the following categories:
- 55 to 64
- 65 to 74
- 75 and over
The vertical axis is measured by dollars and increases in increments of 50 from 0 to 250.
In the 55 to 64 age group, the annual out-of-pocket costs for health care and social services is 134 dollars for people with mild or moderate disabilities and 223 dollars for people with severe or very severe disabilities.
In the 65 to 74 age group, the annual out-of-pocket costs for health care and social services is 123 dollars for people with mild or moderate disabilities and 199 dollars for people with severe or very severe disabilities.
In the 75 and over age group, the annual out-of-pocket costs for health care and social services is 67 dollars for people with mild or moderate disabilities and 137 dollars for people with severe or very severe disabilities.
Source: 2006 Participation and Activity Limitation Survey
Caregiving costs
The cost of informal care provided by family members is often not considered.
Family members make up the large majority of caregivers for seniors with disabilities. For this reason, there is often not a financial cost to the care recipient or to the immediate family.
These costs are often not documented. For example, a senior who needs help with housework may not perceive that there is a cost, but a family member may have incurred expenses for gas to drive to and from the senior’s home or for laundry detergent or laundromat fees, etc. These undocumented out-of-pocket costs can quickly add up. Figure 5.7 shows how seniors think their help is paid for.
| Type of help | No one pays | Care recipient or live-in family member | Public source (e.g. government) |
|---|---|---|---|
| Heavy household chores | 62 | 28 | 4 |
| Housework | 51 | 34 | 7 |
| Appointments and errands | 79 | 15 | 2 |
| Preparing meals | 72 | 19 | 5 |
| Personal care | 62 | 13 | 13 |
| Finances | 88 | 5 | 1 |
| Moving about | 73 | 12 | 5 |
| Medical treatment or nursing | 32 | 14 | 27 |
Figure 5.7 Text Description
This table presents data from the 2006 Participation and Activity Limitation Survey. It presents the distribution of the main spenders for specific types of caregiving help.
From left to right, there are four columns.
The first column lists eight types of help: 1) heavy household chores, 2) housework, 3) appointments and errands, 4) preparing meals, 5) finances, 6) personal care, 7) medical treatment or nursing, and 8) moving about. The second column lists the percentage for whom “no one pays”. The third column lists the percentage for whom the main spender is the care recipient or live-in family member. The fourth column lists the percentage for whom the main spender is a public source, such as government.
For heavy household chores
- 62 percent receive the care for free.
- For 28 percent, the main spender is the care recipient or a live-in family member.
- For 4 percent, the main spender is a public source such as government.
For housework
- 51 percent receive the care for free.
- For 34 percent, the main spender is the care recipient or a live-in family member.
- For 7 percent, the main spender is a public source such as government.
For appointments and errands
- 79 percent receive the care for free.
- For 15 percent, the main spender is the care recipient or a live-in family member.
- For 2 percent, the main spender is a public source such as government.
For preparing meals
- 72 percent receive the care for free.
- For 19 percent, the main spender is the care recipient or a live-in family member.
- For 5 percent, the main spender is a public source such as government.
For finances
- 88 percent receive the care for free.
- For 5 percent, the main spender is the care recipient or a live-in family member.
- For 1 percent, the main spender is a public source such as government.
For personal care
- 62 percent receive the care for free.
- For 13 percent, the main spender is the care recipient or a live-in family member.
- For 13 percent, the main spender is a public source such as government.
For medical treatment or nursing
- 32 percent receive the care for free.
- For 14 percent, the main spender is the care recipient or a live-in family member.
- For 27 percent, the main spender is a public source such as government.
For moving about
- 73 percent receive the care for free.
- For 12 percent, the main spender is the care recipient or a live-in family member.
- For 5 percent, the main spender is a public source such as government.
Source: 2006 Participation and Activity Limitation Survey
The two types of help for which people most often pay for themselves are housework and heavy household chores. For help with medical treatment or nursing, public sources, such as government health insurance plans, are much more likely to pay the bill.
When there is a financial cost to the care recipient, the total cost over a one-year period can become quite significant. Figure 5.8 shows the average annual caregiving expense to seniors with disabilities who have costs, by type of help. Preparing meals, personal care and housework are the top three caregiving activities that have costs $500 and over.
| Type of help | $0–$499 | $500 and over | ||
|---|---|---|---|---|
| Number of seniors | % | Number of seniors | % | |
| Heavy household chores | 105 610 | 54 | 88 400 | 46 |
| Housework | 52 230 | 32 | 111 490 | 68 |
| Appointments and errands | 48 660 | 66 | 25 330 | 34 |
| Preparing meals | 10 880 | 21 | 41 940 | 79 |
| Finances | 8 200 | 62 | 5 120 | 38 |
| Personal care | 6 980 | 32 | 14 580 | 68 |
| Medical treatment or nursing | 5 100 | 44 | 6 400 | 56 |
| Moving about | 2 830 | 35 | 5 230 | 65 |
Figure 5.8 Text Description
This table presents data from the 2006 Participation and Activity Limitation Survey. It presents the number and percentage of seniors with disabilities who spend less than 500 dollars or more than 500 dollars on each of eight types of caregiving help.
From left to right, there are five columns.
The first column lists eight types of help: 1) heavy household chores, 2) housework, 3) appointments and errands, 4) preparing meals, 5) finances, 6) personal care, 7) medical treatment or nursing, and 8) moving about. The second and third columns lists the number and percentage of seniors who pay 0 to 499 dollars on each type of help. The fourth and fifth columns lists the number and percentage of seniors who pay 500 dollars or more on each type of help.
For heavy household chores
- 105,610 or 54 percent of seniors with disabilities have expenses of 0 to 499 dollars
- 88,400 or 46 percent have expenses of 500 dollars or more.
For housework
- 52,230 or 32 percent of seniors with disabilities have expenses of 0 to 499 dollars
- 111,490 or 68 percent have expenses of 500 dollars or more
For appointments and errands
- 48,660 or 66 percent of seniors with disabilities have expenses of 0 to 499 dollars
- 25,330 or 34 percent have expenses of 500 dollars or more
For preparing meals
- 10,880 or 21 percent of seniors with disabilities have expenses of 0 to 499 dollars
- 41,940 or 79 percent have expenses of 500 dollars or more
For finances
- 8,200 or 62 percent of seniors with disabilities have expenses of 0 to 499 dollars
- 5,120 or 38 percent have expenses of 500 dollars or more
For Personal Care
- 6,980 or 32 percent of seniors with disabilities have expenses of 0 to 499 dollars
- 14,580 or 68 percent have expenses of 500 dollars or more
For medical treatment or nursing
- 5,100 or 44 percent of seniors with disabilities have expenses of 0 to 499 dollars
- 6,400 or 56 percent have expenses of 500 dollars or more
For moving about
- 2,830 or 35 percent of seniors with disabilities have expenses of 0 to 499 dollars
- 5,230 or 65 percent have expenses of 500 dollars or more.
Source: 2006 Participation and Activity Limitation Survey
Spotlight on Government of Canada Programs:
Old Age Security and Guaranteed Income Supplement
The Old Age Security program, also called OAS, provides Canadians who have lived in Canada for at least 10 years with a modest pension at age 65. Low-income seniors may be eligible for other benefits as early as age 60.
For more information, visit www.servicecanada.gc.ca/eng/isp/oas/oastoc.shtml.
The Guaranteed Income Supplement (GIS) provides additional money, on top of the Old Age Security pension, to low-income seniors living in Canada. To be eligible for the GIS benefit, individuals must be receiving an OAS pension.
For more information, visit www.servicecanada.gc.ca/eng/isp/pub/oas/gismain.shtml.
Spotlight on connecting with the Elders of St. Mary’s First Nation
Fredericton, New Brunswick—During a visit from the Service Canada outreach team, the Elders of St. Mary’s First Nation received vital information about their pension benefits.
"I consider it a great success that we were invited to speak there for the first time,
" said Sue Olsen-Doyle, an outreach officer with Service Canada in Saint John.
"We are making inroads here like never before,
" she added.
In January 2007, Service Canada began providing outreach service two days a month to St. Mary’s First Nation. That spring, a Band Councillor for St. Mary’s First Nation called to request that Service Canada outreach officers deliver information on pension benefits to a group of Elders in the community.
An initial meeting was held with a Band Councillor to discuss an approach for the meeting. That month, Sue delivered a successful seminar on OAS and Canada Pension Plan (CPP) benefits to 16 Elders of the St. Mary’s First Nation.
“While this seems like a small feat, for the New Brunswick Outreach team, this is viewed as a huge accomplishment,
” said Sue.
St. Mary’s First Nation is one of six Maliseet Nations along the St. John River and is part of New Brunswick’s capital, Fredericton.The band has a membership of 1,394 people, with 696 living on reserve.
While the presentation focused on OAS, it prompted many questions about income tax legislation, the North American Indian Status and residency requirements and the CPP disability benefit.
Sue did her best to answer the group’s questions and followed up the seminar by sharing resources, such as the websites of Service Canada, the provincial prescription drug program, and the low income seniors’ benefit for seniors receiving the GIS.
“This highlighted some areas where the outreach team could partner with other federal government departments to provide a more comprehensive package for Aboriginal communities in New Brunswick,
” she said.
As a result of the seminar, an intra-departmental group met to discuss working together on outreach activities for the province’s Aboriginal communities.
For more information, visit www.hrsdc.gc.ca/eng/seniors/stories/index.shtml.