
Progress and impact of Canada-wide Early Learning and Child Care
On this page
Introduction
The Government of Canada is working with provincial, territorial and Indigenous partners to build an affordable, flexible, inclusive and high-quality early learning and child care (ELCC) system for families in Canada.
The federal government transfers funding to provinces and territories through bilateral agreements guided by the Multilateral Early Learning and Child Care Framework, the Indigenous Early Learning and Child Care Framework and the Canada Early Learning and Child Care Act.
Employment and Social Development Canada (ESDC) also funds data and research projects through both grants and contributions funding, as well as partnerships with Statistics Canada and funds ELCC-related projects under the Action Plan for Official Languages 2023-2028.
Some outcomes of the Canada-wide ELCC system are outlined below, including society-level outcomes and program administrative data on space creation and affordability.
Economic impact
Research shows that access to child care allows more parents, particularly mothers, to participate in the workforce and achieve greater economic security. The introduction of affordable child care in Quebec almost 30 years ago led to a considerable increase in the labour force participation of mothers with young children. We expect to see similar outcomes across Canada as a result of investments in building a Canada-wide ELCC system.
Figure 1 shows the labour force participation rate—that is, the share of the population either working or trying to find work—for Canadian mothers with young children (0 to 5) in their prime working years (25 to 54).
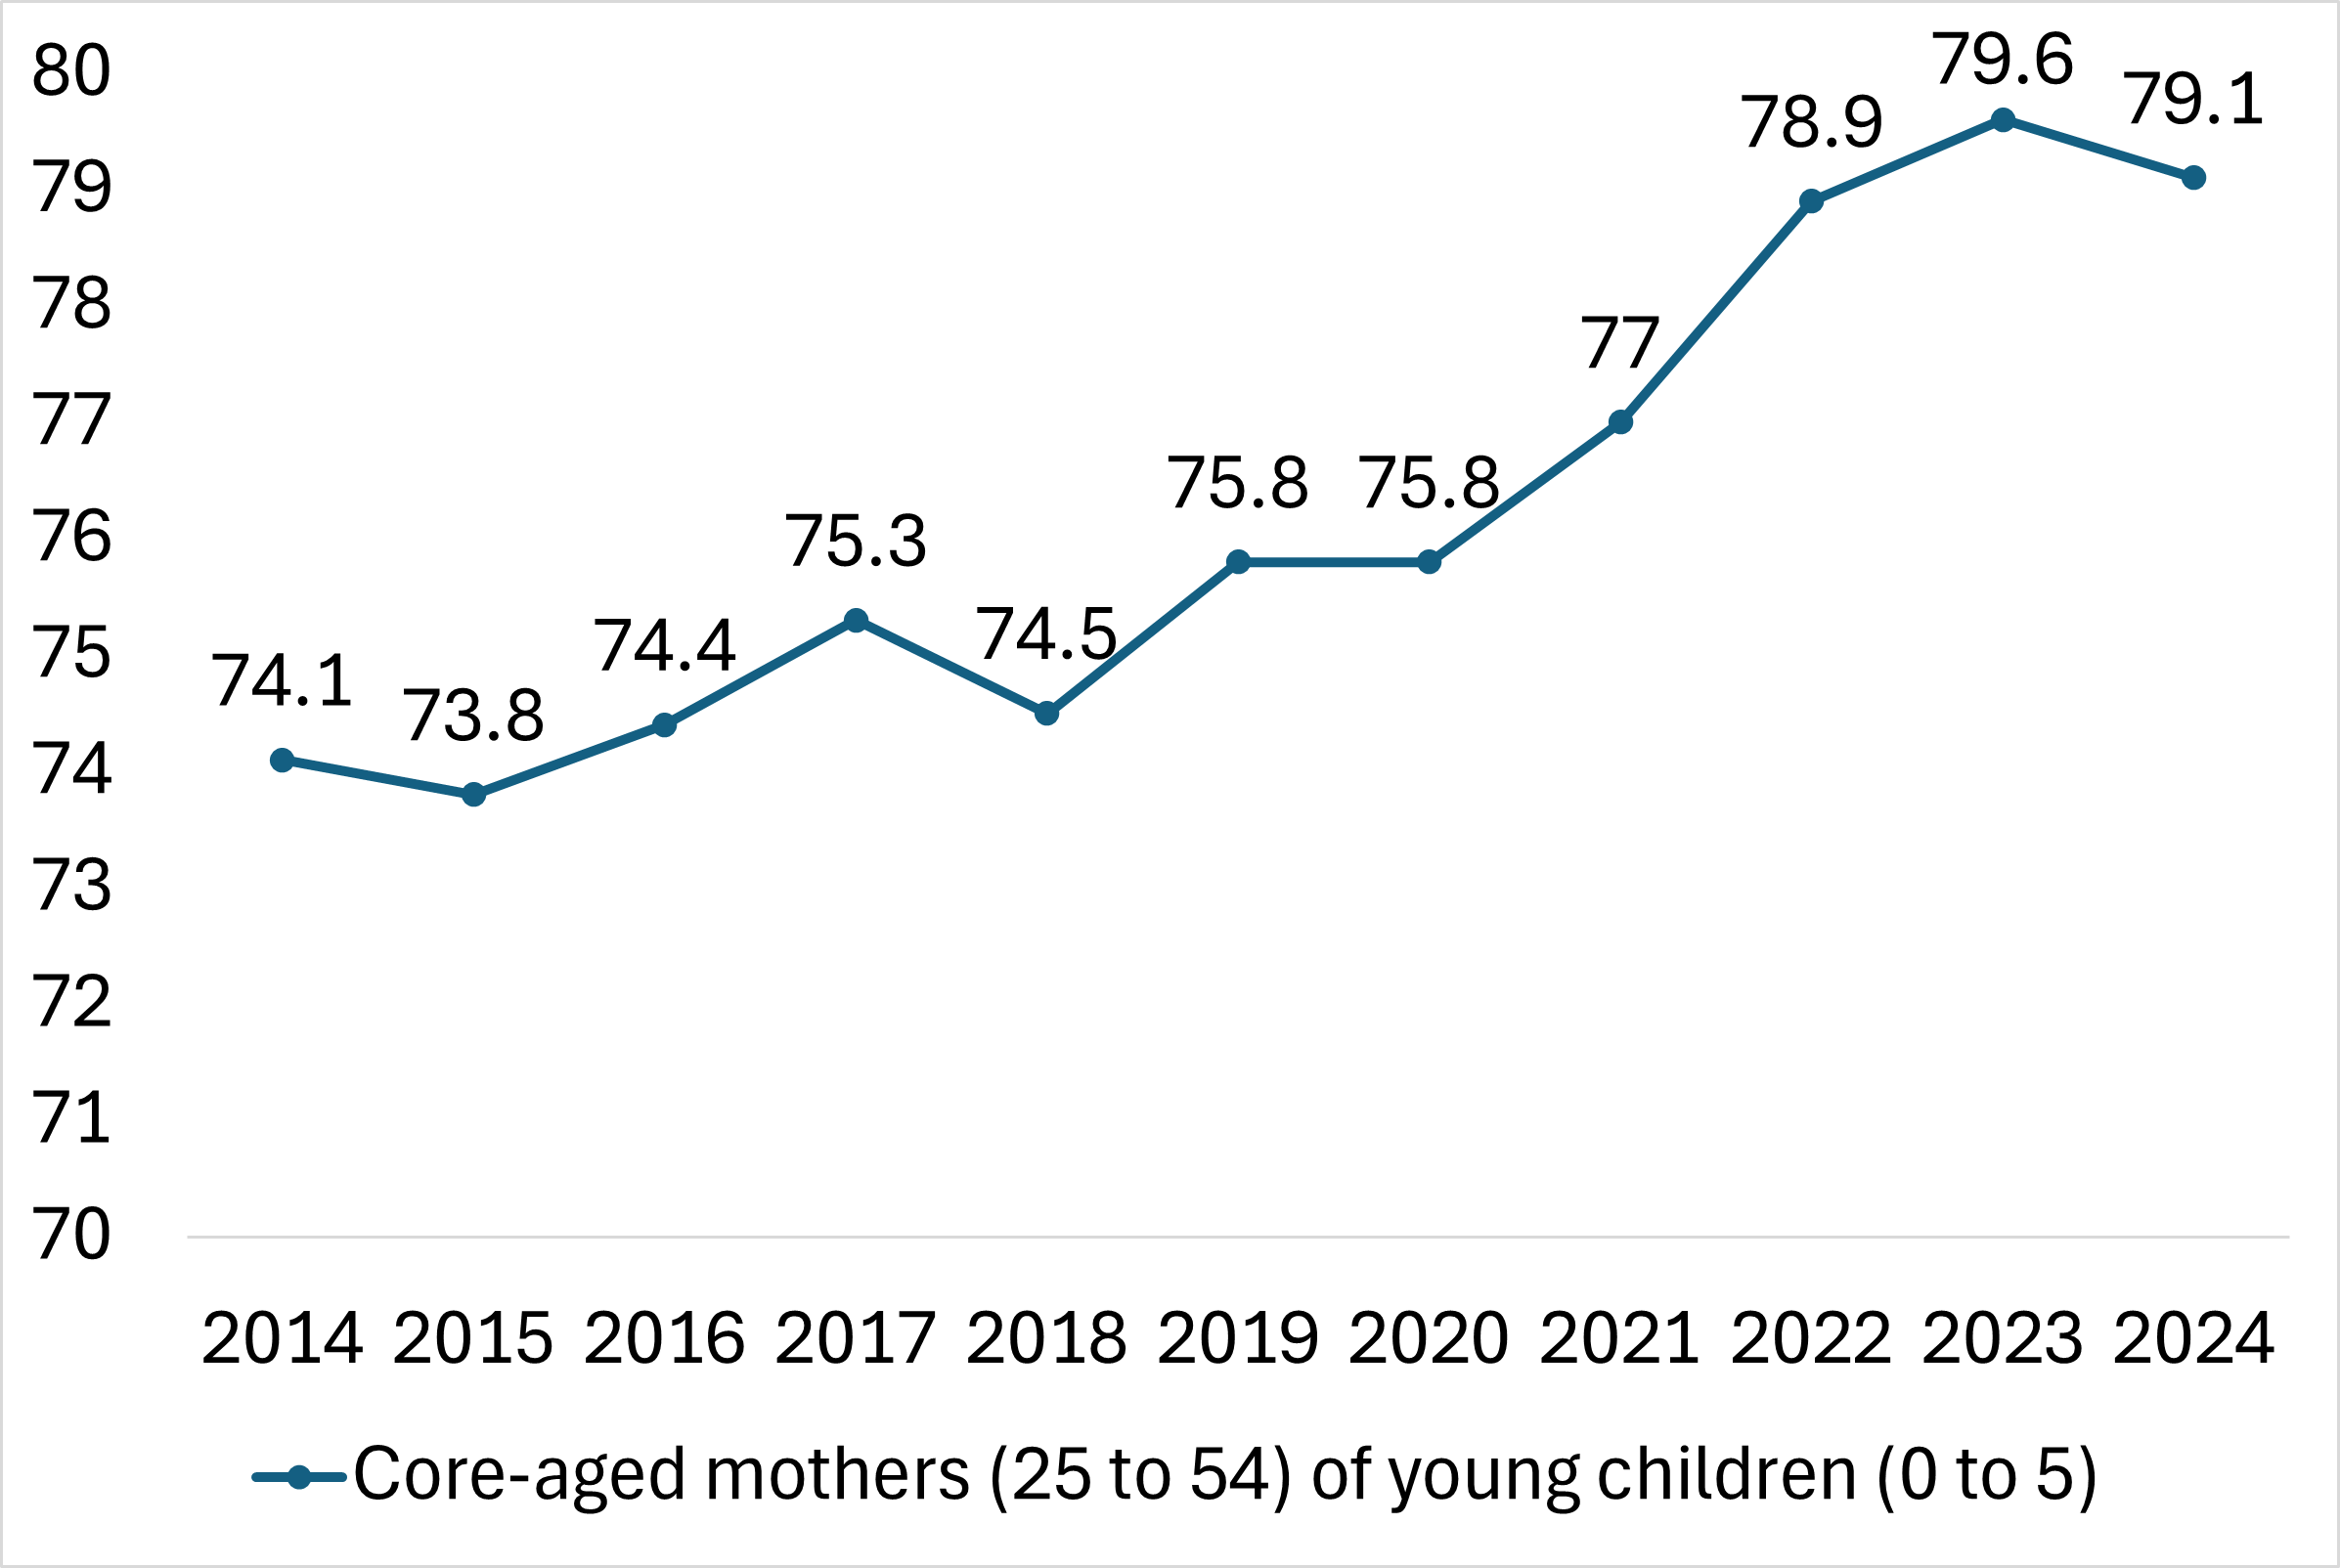
Figure 1: text description
Line chart showing the labour force participation rate of core-aged mothers of young children (0 to 5) in Canada from 2015 to 2025.
| Year | Women aged 25 to 54 with a child under the age of 6 (percentage) |
|---|---|
| 2015 | 73.8 |
| 2016 | 74.4 |
| 2017 | 75.3 |
| 2018 | 74.5 |
| 2019 | 75.8 |
| 2020 | 75.8 |
| 2021 | 77.0 |
| 2022 | 78.9 |
| 2023 | 79.6 |
| 2024 | 79.1 |
| 2025 | 79.5 |
Source: Statistics Canada, Labour Force Survey, Table 14-10-0396-01 (not seasonally adjusted).
Affordability
Canada's vision for affordable ELCC means that all families, regardless of their socio-economic status, can access child care that meets their needs. Access to affordable child care is often a key factor in a caregiver's ability to go back to work and means families have more income for other necessities such as food and housing and the system is saving families thousands per child, per year, varying per jurisdiction.
The Consumer Price Index (CPI) represents the change in prices of goods and services in Canada. In Figure 2, the CPI levels are represented as the change in the prices of goods and services since 2002. The child care services sub-item represents the price paid for child care by consumers in Canada, rolled up to the national level. Child care fee reductions implemented by provinces and territories have led to significant decreases in the child care services sub-item of the CPI, as shown in Figure 2.
We expect further changes in the CPI for the child care services sub-item in the coming years, following any further fee changes. As of the end of 2025, there has been over 31% decline in the CPI for child care services since 2021, while the CPI for all items has increased by nearly 16% over the same period. More information about the CPI can be found on Statistics Canada's Consumer Price Index portal.
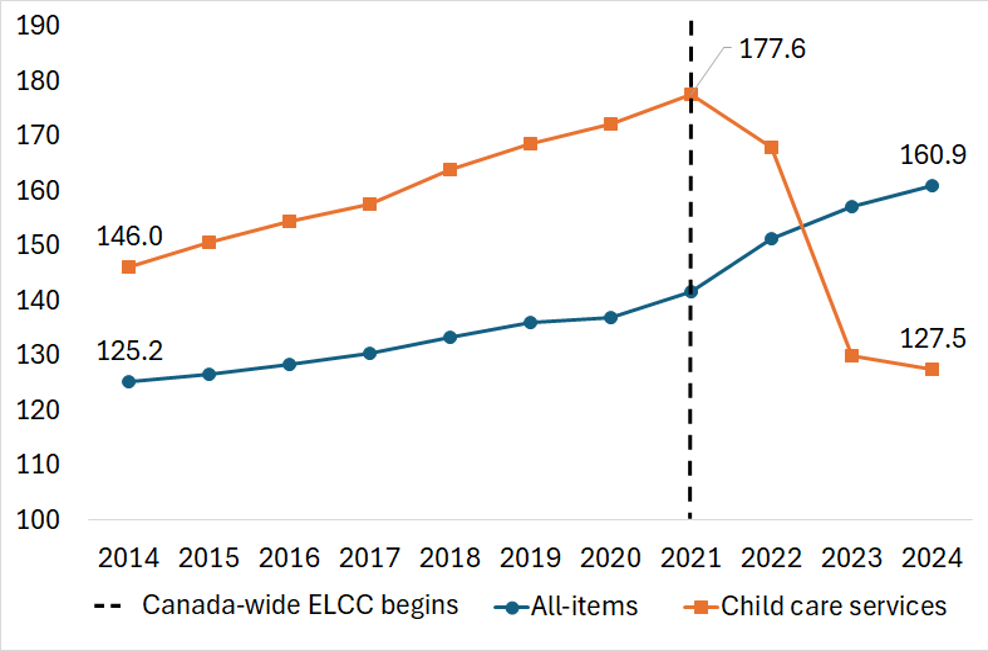
Figure 2: text description
Line chart showing Consumer Price Index (Annual) for the child care services sub-item, 2015 to 2025. A vertical line in 2021 indicates the year that Canada-wide ELCC began.
| Year | All-items | Child care services |
|---|---|---|
| 2015 | 126.6 | 150.6 |
| 2016 | 128.4 | 154.4 |
| 2017 | 130.4 | 157.6 |
| 2018 | 133.4 | 163.9 |
| 2019 | 136.0 | 168.6 |
| 2020 | 137.0 | 172.1 |
| 2021 | 141.6 | 177.6 |
| 2022 | 151.2 | 168.0 |
| 2023 | 157.1 | 130.0 |
| 2024 | 160.9 | 127.5 |
| 2025 | 164.2 | 121.6 |
Source: Statistics Canada Table 18-10-0005-01 (Consumer Price Index, annual, not seasonally adjusted). Note: 2002=100. Data on the child care services sub-item is not available at the provincial or territorial level.
Space creation
To support the goal of increased access to child care spaces, provinces and territories committed to creating over 250,000 new regulated ELCC spaces through their Canada-wide agreements. Each jurisdiction has the responsibility to develop child care systems that best respond to the needs and priorities of their communities. Prior to the Canada-wide Agreements, child care systems across the country varied significantly, and as a result approaches and pace of space creation are also unique to each jurisdiction. Table 1 presents the progress made by provinces and territories to creating new spaces. Information in the table below reflects available data from provincial and territorial annual reports as of March 31, 2025. Table last modified April 8, 2026.
| Province/Territory | Number of spaces created in fiscal year 2021 to 2022 | Number of spaces created in fiscal year 2022 to 2023 | Number of spaces created in fiscal year 2023 to 2024 | Number of spaces created in fiscal year 2024 to 2025 | Total number of spaces created |
|---|---|---|---|---|---|
| Newfoundland and Labrador | 109 | 273 | 565 | TBC | 947 |
| Prince Edward Island | N/A | 4591 | 231 | TBC | 690 |
| Nova Scotia | 0 | 1,691 | 2,832 | TBC | 4,523 |
| New Brunswick | 301 | 490 | 229 | 777 | 1,797 |
| Quebec | N/A | N/A | N/A | N/A | 34,7402 |
| Ontario3 | N/A | 25,571 | 10,716 | 3,2124 | 39,499 |
| Manitoba | N/A5 | 1,302 | 1,636 | TBC | 2,938 |
| Saskatchewan | 613 | 2,029 | 9,169 | 4,052 | 15,863 |
| Alberta | 3,729 | 9,890 | 11,671 | 14,348 | 39,638 |
| British Columbia | 4,650 | 5,417 | 6,973 | 9,806 | 26,846 |
| Yukon | 129 | 165 | 94 | 88 | 476 |
| Northwest Territories | 89 | -17* | 4 | TBC | 76 |
| Nunavut | -38 | 52 | 43 | 47 | 104 |
| Total | 9,582 | 47,322 | 44,163 | 32,330 | 168,226 |
- 1 The spaces figure reported for Prince Edward Island for fiscal year 2022 to 2023 represents cumulative spaces created over 2021 to 2022 and 2022 to 2023.
- 2 Due to Quebec's asymmetrical agreement, the province is not required to report to Canada on space creation. Quebec publishes statistics on the development of its child care services network on its website [only available in French]. The number in this table reflects the number of subsidized spaces created as of February 28, 2026, as per Quebec's Tableau de bord [only available in French].
- 3 Ontario signed the Canada-Ontario Canada-wide ELCC Agreement in March 2022, so did not report on space creation for 2021 to 2022. Ontario provides space creation figures by calendar year rather than fiscal year, using 2019 as a baseline. ESDC estimates space creation figures for fiscal years 2022 to 2023, 2023 to 2024 and 2024 to 2025.
- 4 For fiscal year 2023 to 2024, this figure represents the number of spaces created in Ontario between December 31, 2023, and March 31, 2024.
- 5 Manitoba revised its calculation method for spaces in future annual reports. Spaces created for 2021 to 2022 are captured in the total for 2022 to 2023.
- N/A: not available
- TBC: to be confirmed. We have either not yet received or not yet validated the annual report for this province or territory.
- *A negative number in the table indicates spaces lost in that fiscal year. Spaces can close for a multitude of reasons, including staffing and rental challenges, loss of operating space in schools, operator mismanagement, non-profit governance challenges, fires, etc. Spaces reopening are captured in future years’ reporting.
Quality
High-quality ELCC has an overall positive effect on child development and outcomes, especially for disadvantaged children. Quality programming is largely dependant on the skills and qualifications of the ELCC workforce, who are critical to the success of the Canada-wide system. To prioritize quality education, early childhood educators (ECEs) need access to training, education, and opportunities to continue their own learning to leverage the latest research, tools, and curriculum. These measures help ensure that the ELCC workforce attracts and retains well-educated and well-supported ECEs who can deliver the best quality care and education to children and families.
By improving working conditions (including wage grids, pension and benefit plans, and professional development and training), we can increase retention. Higher retention can help us to maintain the system and support new spaces becoming operational.
In the coming years, we need continued growth in the ELCC workforce to support the operation of ELCC spaces and to meet the commitments that provinces and territories made under the bilateral agreements.
Provinces and territories have introduced workforce measures to promote increased compensation and favourable working conditions for the ELCC workforce. In Canada, employment among early childhood educators and assistants has grown in recent years, particularly in the second half of 2024. The pandemic employment losses have been recovered, and employment now surpasses the 2019 (pre-COVID) level, as shown in Figure 3. In 2025 alone, employment among early childhood educators and assistants grew by 2.6%, outpacing overall employment growth in Canada (1.4%).
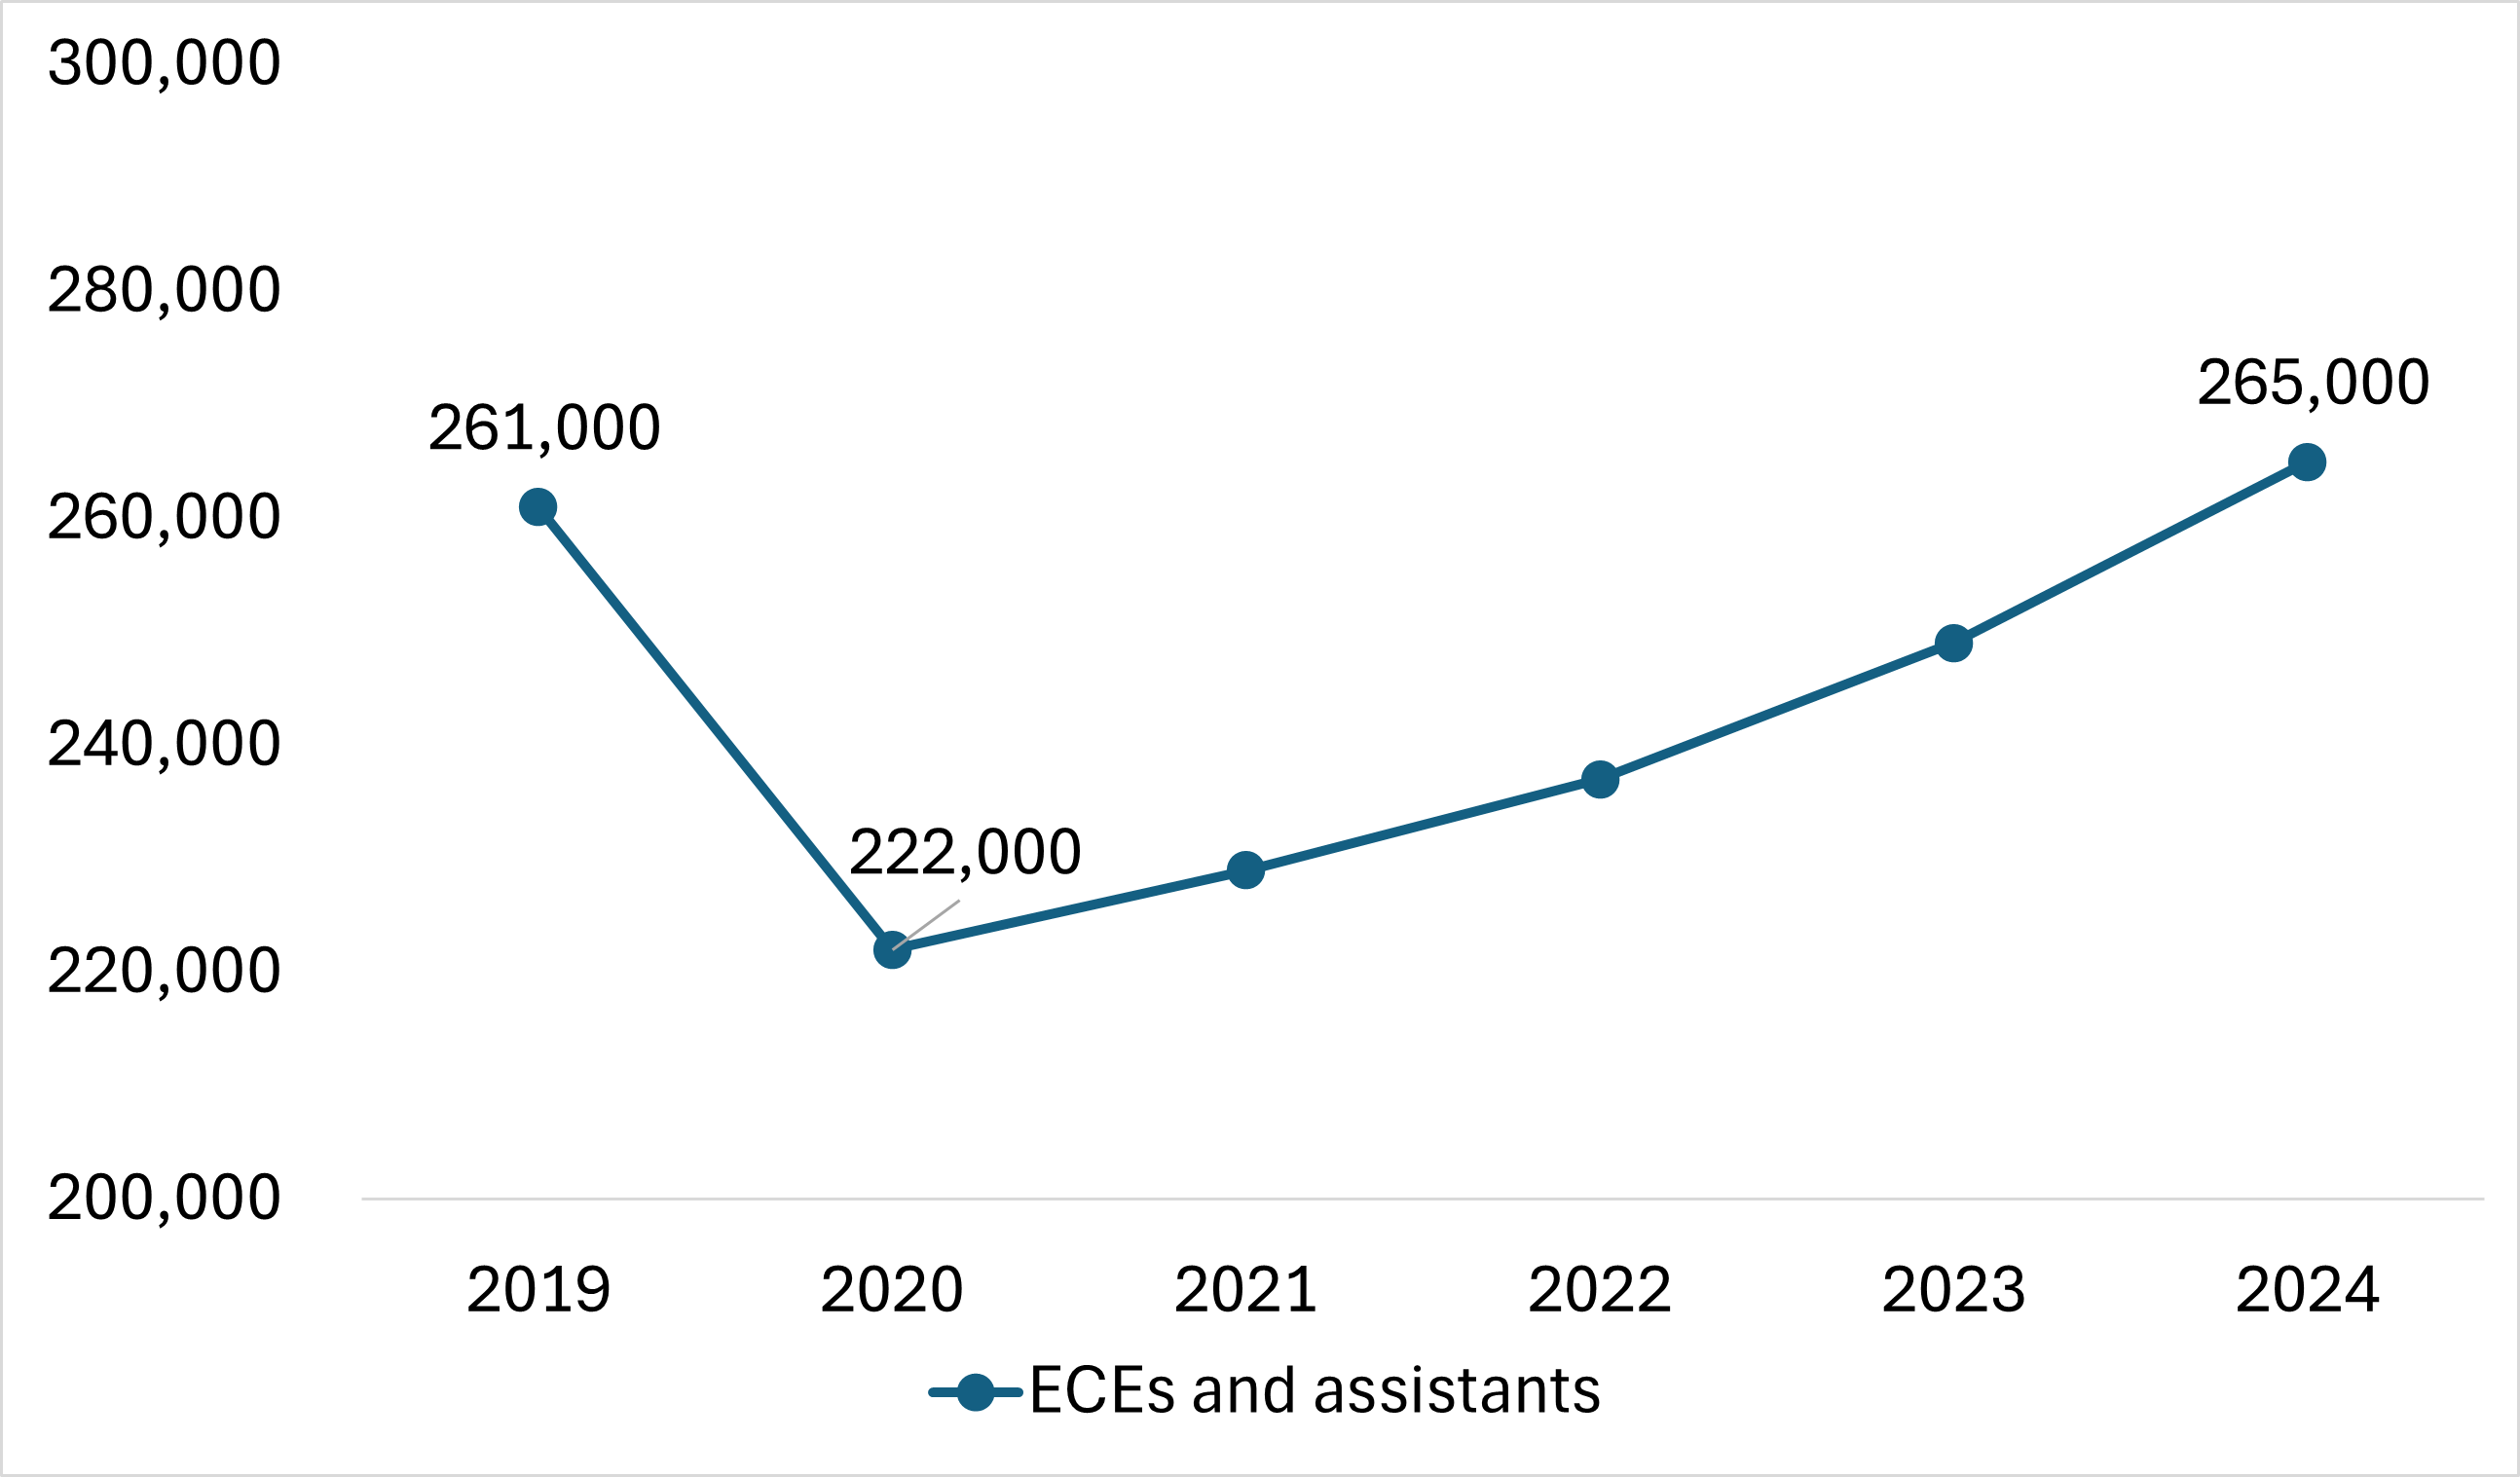
Figure 3: text description
Line chart showing estimated employment for early childhood educators and assistants, 2019 to 2025.
| Year | Early childhood educators and assistants |
|---|---|
| 2019 | 261,000 |
| 2020 | 222,000 |
| 2021 | 229,000 |
| 2022 | 237,000 |
| 2023 | 249,000 |
| 2024 | 265,000 |
| 2025 | 272,000 |
Source: Statistics Canada, custom Labour Force Survey statistics. Note: Does not include the territories.
Reports
National progress reports
- National Progress Report on Early Learning and Child Care 2021 to 2022
- National Progress Report on Early Learning and Child Care 2020 to 2021
- National Progress Report on Early Learning and Child Care 2019 to 2020
- National Progress Report on Early Learning and Child Care 2018 to 2019
- National Progress Report on Early Learning and Child Care (2017 to 2018)
Other reports
- Children with disabilities and childcare (2025)
- Reducing Inequalities in Early Childhood Education and Care (2025)
- Organisation for Economic Co-operation and Development (OECD) - Reports on Early Childhood Education and Care in the Digital Age (2023)
- Statistics Canada - Early Learning and Child Care Information Hub
- All related publications