
EI Monitoring and Assessment Report 2012/13 Chapter 1: Labour Market Context
Notice: Refer to the Table of contents to navigate through the EI Monitoring and Assessment Report 2012/13.
This chapter outlines key labour market developments and the economic context that prevailed in the 2012/13 fiscal year, the period for which this report assesses the Employment Insurance (EI) program. Footnote 1 More detailed information on various elements discussed in this chapter is available in Annex 1.
I. ECONOMIC OVERVIEW
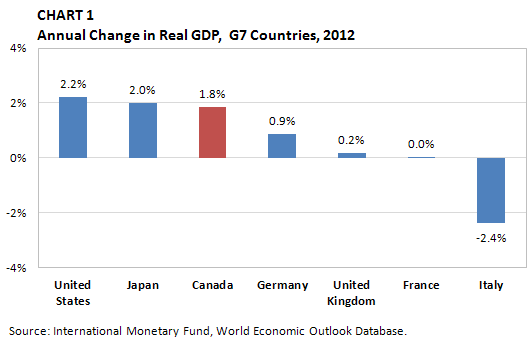
The Canadian economy has remained resilient in the face of a challenging external environment. The economy grew moderately from 2011 to 2012 with real GDP growth of 1.8%, which represents a relatively strong economic performance among the Group of Seven (G7) countries, despite ongoing challenges (see Chart 1). Footnote 2 Moderate growth is also taking hold in the American economy, while economic performance in the Euro area remains weak. Real GDP growth in China and other emerging countries, although stronger than in the advanced economies, has slowed, resulting in downward pressure on global commodity prices.
-
Show Data Table
CHART 1 - Annual Change in Real GDP, G7 Countries, 2012 Country 2011-2012 growth rates United States 2.2% Japan 2.0% Canada 1.8% Germany 0.9% United Kingdom 0.2% France 0.0% Italy -2.4%
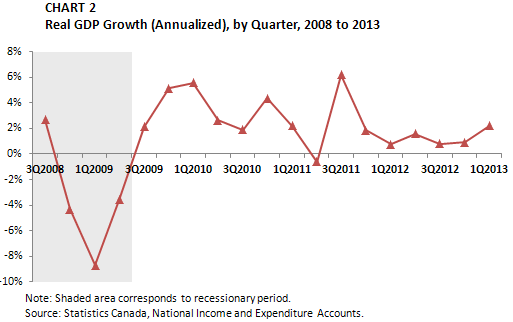
More recently, however, the pace of economic growth in Canada has slowed, compared with that in the previous year. Real GDP Footnote 3 growth of 1.5% from 2011/ 12 to 2012/ 13 was weaker than GDP growth in 2011/ 12 (+2.3%) and 2010/ 11 (+3.5%). As indicated in Chart 2, after experiencing negative growth rates during the late- 2000 s recession, the Canadian economy started to recover in the third quarter of 2009 and maintained positive GDP growth rates in subsequent quarters, with the exception of the second quarter of 2011 . Growth in 2012/ 13 was largely driven by relatively sustained strength in demand from Canadian households and businesses, with the strongest GDP growth during the year coming in the first quarter of 2013 . Despite earlier weaknesses, the export sector was the largest contributor to growth in the first quarter of 2013 , as export volumes increased by 1.5%. Footnote 4
-
Show Data Table
CHART 2 - Real GDP Growth (Annualized), by Quarter, 2008 to 2013 3Q2008 2.7% 4Q2008 -4.3% 1Q2009 -8.7% 2Q2009 -3.6% 3Q2009 2.1% 4Q2009 5.1% 1Q2010 5.6% 2Q2010 2.6% 3Q2010 1.9% 4Q2010 4.3% 1Q2011 2.2% 2Q2011 -0.6% 3Q2011 6.2% 4Q2011 1.9% 1Q2012 0.8% 2Q2012 1.6% 3Q2012 0.8% 4Q2012 0.9% 1Q2013 2.2% Note: Shaded area corresponds to recessionary period.
Source: Statistics Canada, National Income and Expenditure Accounts.
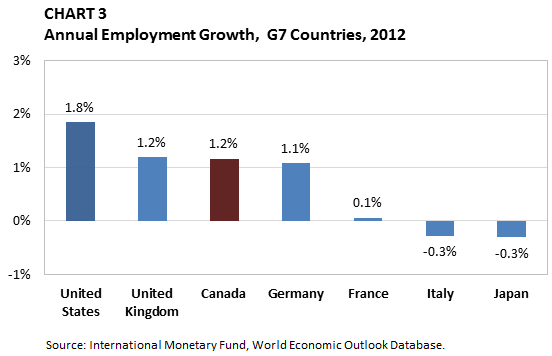
Canada’s labour market growth continues to outpace growth in many other Organisation for Economic Co-operation and Development (OECD) countries. Canada had one of the strongest rates of employment growth records in the G7 between 2011 and 2012 (+1.2%), ranking second (tied with the United Kingdom) among G7 countries (see Chart 3).
-
Show Data Table
CHART 3 - Annual Employment Growth, G7 Countries, 2012 Country 2011-2012 United States 1.8% United Kingdom 1.2% Canada 1.2% Germany 1.1% France 0.1% Italy -0.3% Japan -0.3%
Canadian employment has recorded solid gains since the recession, and the unemployment rate declined for the third consecutive year in 2012/ 13 , falling from 7.4% in 2011/ 12 to 7.2%. Employment rose by 1.4% (+234,800) from 2011/ 12 to 2012/ 13 , while unemployment declined by 1.4% (-19,500).
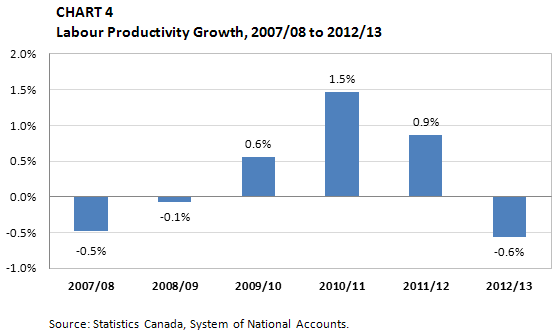
The labour productivity of Canadian businesses fell by 0.6% in 2012/ 13 , after growth of 0.9% in 2011/ 12 and 1.5% in 2010/ 11 (see Chart 4). Footnote 5 Prior to the late-2000s recession, labour productivity had been rising, but growth has levelled off in recent years.
-
Show Data Table
CHART 4 - Labour Productivity Growth, 2007/08 to 2012/13 Labour productivity 2007/08 -0.5% 2008/09 -0.1% 2009/10 0.6% 2010/11 1.5% 2011/12 0.9% 2012/13 -0.6% Source: Statistics Canada, System of National Accounts.
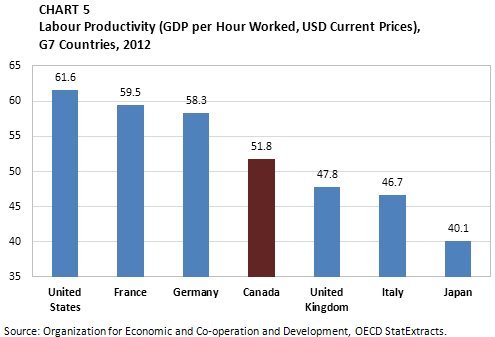
Canada’s labour productivity growth has lagged behind that of many of its peers over the last several decades, hurting Canada’s international competitiveness. Footnote 6 In 2012 , Canada’s labour productivity growth ranked fourth among G7 countries, behind the United States, France and Germany (see Chart 5). According to the Conference Board of Canada, productivity is an important determinant of a country’s per capita income over the longer term. Countries that are innovative and able to adapt to the ebb and flow of the new global economy boast high productivity and thus a superior standard of living. Potential contributing factors to productivity performance in Canada include access to international markets, business investment and a skilled workforce.
-
Show Data Table
CHART 5 - Labour Productivity (GDP per Hour Worked, USD Current Prices), G7 Countries, 2012 G7 countries GDP per hour worked United States 61.6 France 59.5 Germany 58.3 Canada 51.8 United Kingdom 47.8 Italy 46.7 Japan 40.1
According to the 2013 Survey of Adult Skills, Canada ranks at the OECD average in literacy, with a larger proportion of its population at both the highest and lowest levels. Canada ranks below the OECD average in numeracy, with a larger proportion of Canadians performing at the lowest levels. Footnote 7
II. LABOUR MARKET OVERVIEW
1. Labour Force Participation Rate
The Canadian labour force Footnote 8 grew at a pace of 1.1% (+215,300) to 18.9 million in 2012/13, growing faster than in the previous year, when it grew by 0.8%. While the labour force grew by an average of 1.7% annually between 2000/01 and 2008/09, labour force growth has slowed since the late-2000s recession. Between 2008/09 and 2012/13, annual labour force growth averaged 1.1%.
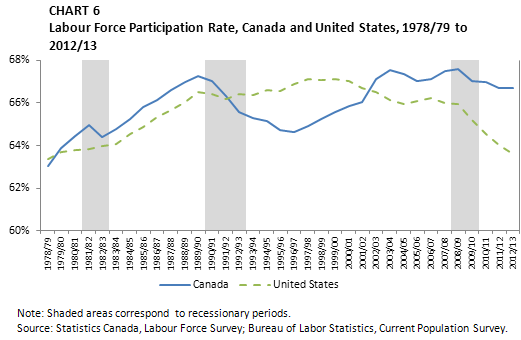
Over the last 10 years, the participation rate Footnote 9 has been relatively stable around 67% and has remained higher than rates observed in previous decades (see Chart 6). After registering a decline in 2011/12, the participation rate remained stable at 66.7% in 2012/13. In contrast, the percentage of Americans who participated in the labour force approached a 30-year low in 2012/13. The rate peaked in the late-1990s at 67.1% and has continued to decline since the start of the recession. A major implication of the recession in the United States has been a significant withdrawal of participants from the labour force.
-
Show Data Table
CHART 6 - Labour Force Participation Rate, Canada and United States, 1978/79 to 2012/13 United States Canada 1978/79 63.4% 63.0% 1979/80 63.7% 63.9% 1980/81 63.8% 64.4% 1981/82 63.8% 65.0% 1982/83 64.0% 64.4% 1983/84 64.1% 64.8% 1984/85 64.6% 65.2% 1985/86 64.9% 65.8% 1986/87 65.4% 66.1% 1987/88 65.7% 66.6% 1988/89 66.1% 67.0% 1989/90 66.5% 67.2% 1990/91 66.4% 67.0% 1991/92 66.2% 66.3% 1992/93 66.4% 65.6% 1993/94 66.4% 65.3% 1994/95 66.6% 65.2% 1995/96 66.6% 64.7% 1996/97 66.9% 64.6% 1997/98 67.1% 64.9% 1998/99 67.1% 65.2% 1999/00 67.1% 65.6% 2000/01 67.0% 65.8% 2001/02 66.7% 66.0% 2002/03 66.5% 67.1% 2003/04 66.2% 67.5% 2004/05 65.9% 67.4% 2005/06 66.1% 67.0% 2006/07 66.2% 67.1% 2007/08 66.0% 67.5% 2008/09 65.9% 67.6% 2009/10 65.2% 67.0% 2010/11 64.5% 67.0% 2011/12 64.0% 66.7% 2012/13 63.6% 66.7%
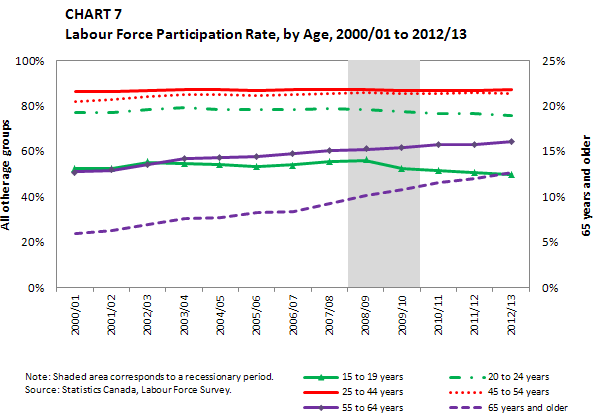
The participation rate for core-aged people (25 to 54 years) has remained stable over the last decade (see Chart 7). In 2012/13, those aged 25 to 44 years had a participation rate of 87.2%, while the 45 to 54 age group had a participation rate of 85.7%. Since 2000/01, the participation rate of the 55 to 64 age group rose faster than that of any other age group, increasing by 13.1 percentage points, from 51.0% to 64.1%. The participation rate of the 65 and older age group increased by 6.8 percentage points to 12.7% during the same period (the right axis on Chart 7 indicates the labour force participation rate of this group). The increase in labour force participation of older workers has implications for skills shortages and pension plan viability. The participation rate for the 15 to 24 age group has declined by 1.1 percentage points during the past decade, from 64.7% in 2000/01 to 63.6% in 2012/13.
In 2012/13, the number of young people (aged 15 to 24) participating in the labour force fell for a fourth consecutive year to 2.8 million individuals (-1.0% in 2012/13). On the other hand, the 55 and older age group grew consistently over the past 10 years, to 3.5 million individuals. As in the early-1990s recession, high unemployment led to a significant decline in labour force participation, particularly among younger Canadians who decided to stay in school and delay their entry into the job market. At the same time, over the last few years, older Canadians have been encouraged to continue working, and delay retirement, particularly given the effect of the global recession on both their financial assets and the employment prospects of their offspring.
-
Show Data Table
CHART 7 - Labour Force Participation Rate, by Age, 2000/01 to 2012/13 15 to 19 years 20 to 24 years 25 to 44 years 45 to 54 years 55 to 64 years 65 years and older 2000/01 52.4% 77.1% 86.2% 82.1% 51.0% 5.9% 2001/02 52.5% 77.3% 86.2% 83.0% 51.6% 6.3% 2002/03 55.1% 78.6% 87.0% 84.2% 54.3% 6.9% 2003/04 54.8% 79.2% 87.3% 84.9% 56.8% 7.6% 2004/05 54.4% 78.6% 87.3% 85.0% 57.4% 7.7% 2005/06 53.2% 78.4% 86.9% 84.6% 57.9% 8.3% 2006/07 54.0% 78.3% 87.1% 85.0% 59.0% 8.3% 2007/08 55.4% 78.7% 87.3% 85.4% 60.4% 9.2% 2008/09 56.0% 78.3% 87.2% 85.8% 61.0% 10.2% 2009/10 52.3% 77.5% 86.8% 85.7% 61.8% 10.8% 2010/11 51.3% 76.7% 86.8% 85.7% 62.9% 11.6% 2011/12 50.6% 76.8% 86.7% 85.8% 62.9% 12.0% 2012/13 49.7% 75.9% 87.2% 85.7% 64.1% 12.7%
2. Employment
Canada experienced an increase in employment in 2012/13, with a net gain of 234,800 jobs (+1.4%) from 2011/12 to reach an annual average of 17.6 million employed individuals. Canada has seen three consecutive years of increases in employment since a significant fall in employment in 2009/10 (-1.2%).
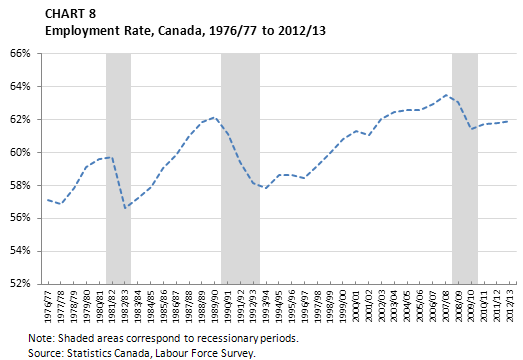
Over the last four decades, the national employment rate has trended upward, increasing from 57.1% in 1976/77 to 61.9% in 2012/13, an increase of 0.1 percentage points from 2011/12 (see Chart 8). A number of factors have contributed to this rise, including increased participation of women in the workforce, and increased educational attainment.
-
Show Data Table
CHART 8 - Employment Rate, Canada, 1976/77 to 2012/13 Employment Rate 1976/77 57.1% 1977/78 56.9% 1978/79 57.8% 1979/80 59.1% 1980/81 59.6% 1981/82 59.7% 1982/83 56.7% 1983/84 57.2% 1984/85 57.9% 1985/86 59.1% 1986/87 59.8% 1987/88 61.0% 1988/89 61.8% 1989/90 62.2% 1990/91 61.1% 1991/92 59.4% 1992/93 58.2% 1993/94 57.9% 1994/95 58.6% 1995/96 58.6% 1996/97 58.4% 1997/98 59.2% 1998/99 60.0% 1999/00 60.8% 2000/01 61.3% 2001/02 61.1% 2002/03 62.0% 2003/04 62.4% 2004/05 62.6% 2005/06 62.6% 2006/07 62.9% 2007/08 63.5% 2008/09 63.1% 2009/10 61.4% 2010/11 61.7% 2011/12 61.8% 2012/13 61.9%
2.1 Employment, by Province
Provincial employment levels have trended upward over the past few years, with employment levels increasing in all provinces in 2012/13.
Saskatchewan witnessed the highest employment growth among provinces in 2012/13, with 3.1% growth since 2011/12. Newfoundland and Labrador averaged nearly 3% employment growth per year between 2009/10 and 2012/13, the highest among provinces, and witnessed a 3.0% increase from 2011/12 to 2012/13. Alberta has also experienced strong growth over the past few years, with 3.9% growth in employment between 2010/11 and 2011/12, and 2.4% growth between 2011/12 and 2012/13.
2.2 Employment, by Industry
Employment in the service sector has increased consistently over the past decade, even throughout the late-2000s recession. In 2012/13, employment in the service sector increased by 1.2%, slightly lower than increases in 2011/12 (+1.4%) and 2010/11 (+1.7%). Industries that witnessed strong employment increases in 2012/13 included educational services (+5.7%), business, building and other support services (+2.6%) and finance, insurance, real estate and leasing (+2.5%).
Employment growth in the educational services industry was strong in both full-time employment (+5.9%) and part-time employment (+5.3%). Additionally, growth in educational services was particularly strong among those aged 55 and older (+10.2%) and in Saskatchewan (+9.5%).
The goods sector, on the other hand, experienced a significant decline in employment during the late-2000s recession from which it has yet to fully recover. The decrease was mainly due to employment losses in manufacturing industries. However, employment has increased in the past three years in the goods sector, with increases of 1.8% in 2012/13 and 0.9% in 2011/12.
In 2012/13, there were strong increases in employment in the forestry, fishing, mining, quarrying, oil and gas industry (+6.0%), which has had the strongest increases within the goods sector in the past three years. Employment in manufacturing increased by 1.6% in 2012/13, its first increase since 2004/05, while employment in construction increased by 0.8% in 2012/13, lower than its increases in 2011/12 (+2.9%) and 2010/11 (+5.8%).
2.3 Employment, by Sector, Age and Job Permanency
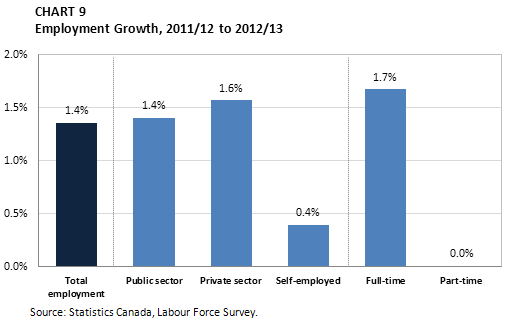
Employment in the private sector grew by 1.6% in 2012/13, compared with 1.4% in the public sector (see Chart 9). The number of self-employed people increased by 0.4% in 2012/13. The private sector accounted for 64.2% of overall employment, followed by the public sector at 20.6% and the self-employed at 15.2%. Employment growth in the private sector was weaker than employment growth in the public sector between 2007/08 and 2010/11, but growth in the private sector has been stronger in the past two years.
Full-time employment grew by 1.7% (+234,900) in 2012/13, while part-time employment experienced no growth.
-
Show Data Table
CHART 9 - Employment Growth, 2011/12 to 2012/13 2012/13 2011/12 Changes Employment Growth (%) Total employment 17,579.1 17,344.3 234.8 1.4 Public sector 3,613.9 3,563.9 50.0 1.4 Private sector 11,287.5 11,113.1 174.4 1.6 Self-employed 2,677.7 2,667.3 10.4 0.4 Full-time 14,276.2 14,041.3 234.9 1.7 Part-time 3,303 3,302.9 0.1 0.0
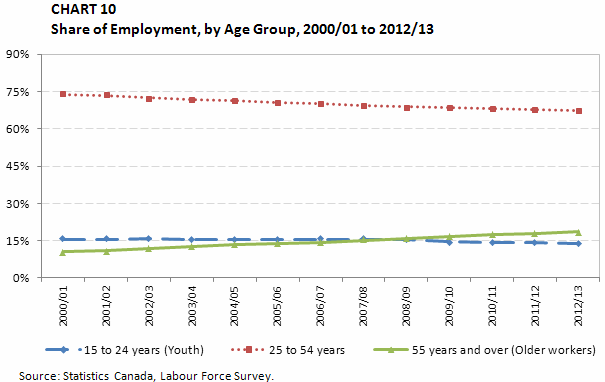
Canada’s aging demographics have affected the workforce over the past decade, with the number of older workers more than doubling from 1.5 million in 2000/01 to 3.3 million in 2012/13. Meanwhile, the share of core-aged workers (25 to 54 years) and younger workers (15 to 24 years) declined from 74.0% and 15.6%, respectively, in 2000/01 to 67.6% and 13.9% in 2012/13 (see Chart 10). The share of older workers (55 years and older) increased from 10.4% to 18.6% over this period.
-
Show Data Table
CHART 10 - Share of Employment, by Age Group, 2000/01 to 2012/13 15 to 24 years (Youth) 25 to 54 years 55 years and over (Older workers) 2000/01 15.6% 74.0% 10.4% 2001/02 15.5% 73.6% 10.9% 2002/03 15.7% 72.6% 11.8% 2003/04 15.5% 71.8% 12.7% 2004/05 15.4% 71.3% 13.3% 2005/06 15.4% 70.7% 13.9% 2006/07 15.5% 70.1% 14.4% 2007/08 15.6% 69.3% 15.1% 2008/09 15.4% 68.9% 15.7% 2009/10 14.6% 68.8% 16.6% 2010/11 14.3% 68.3% 17.4% 2011/12 14.2% 67.9% 17.9% 2012/13 13.9% 67.6% 18.6%
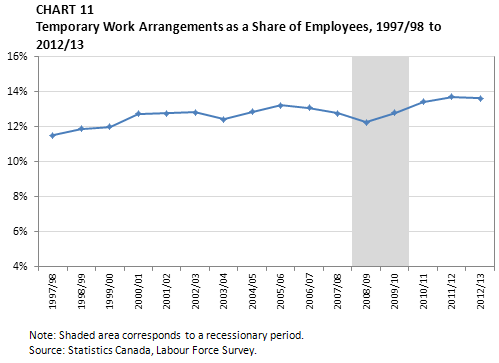
In 2012/13, temporary work arrangements—consisting of seasonal jobs (22.5% of temporary employees), term or contract jobs (53.1%), and casual jobs (23.8%)—represented 13.6% of all employees in Canada (see Chart 11). Among the 14.9 million Canadian employees, Footnote 10 those with temporary work arrangements rose by 19,000, or 0.9%, from the year before.
-
Show Data Table
CHART 11 - Temporary Work Arrangements as a Share of Employees, 1997/98 to 2012/13 Employment Share 1997/98 11.5% 1998/99 11.9% 1999/00 12.0% 2000/01 12.7% 2001/02 12.8% 2002/03 12.8% 2003/04 12.4% 2004/05 12.9% 2005/06 13.2% 2006/07 13.1% 2007/08 12.8% 2008/09 12.2% 2009/10 12.8% 2010/11 13.4% 2011/12 13.7% 2012/13 13.6%
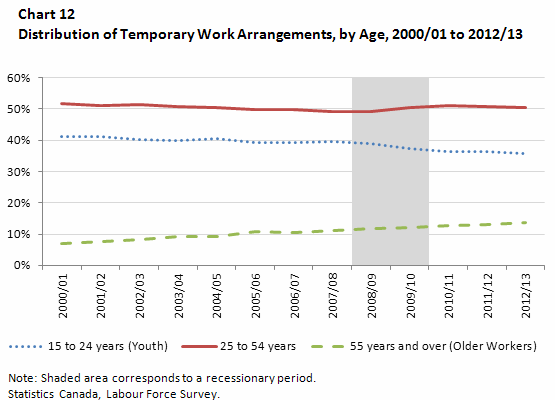
Older workers aged 55 years and older witnessed a significant increase in their share of temporary employees, from 7.1% in 2000/01 to 13.8% in 2012/13 (see Chart 12). The share of temporary employees aged 15 to 24 was relatively flat prior to the late-2000s recession; however, since then, it has experienced a significant drop (from 39.6% in 2007/08 to 35.8% in 2012/13). The 24 to 54 age group have generally accounted for about 50% of temporary employees in Canada and comprised 50.4% of temporary employees in 2012/13.
-
Show Data Table
Chart 12 - Distribution of Temporary Work Arrangements, by Age, 2000/01 to 2012/13 15 to 24 years (Youth) 25 to 54 years 55 years and over (Older Workers) 2000/01 41.0% 51.9% 7.1% 2001/02 41.3% 51.2% 7.5% 2002/03 40.2% 51.4% 8.4% 2003/04 40.0% 50.9% 9.1% 2004/05 40.4% 50.4% 9.2% 2005/06 39.4% 49.9% 10.7% 2006/07 39.4% 50.0% 10.6% 2007/08 39.6% 49.1% 11.2% 2008/09 38.9% 49.3% 11.9% 2009/10 37.4% 50.5% 12.1% 2010/11 36.4% 51.0% 12.6% 2011/12 36.3% 50.8% 12.9% 2012/13 35.8% 50.4% 13.8%
2.4 Employment, by Size of Firm
Small and medium-sized enterprises (SMEs), which are firms with fewer than 500 employees, play an important role in the economy. According to a recent Statistics Canada study, SMEs account for 54.2% of GDP in Canada in 2005, compared with 50.7% of GDP in the United States. Footnote 11
The majority of Canadian workers (8.0 million out of 14.9 million employees) worked for SMEs in 2012/13, according to Statistics Canada’s Survey of Employment, Payrolls and Hours (SEPH). However, the share of employees working for SMEs has been falling since 2000 ; the share was 55.2% in 2000/01, compared with 53.9% in 2012/13.
Among SMEs, enterprises with fewer than 20 employees accounted for 19.6% of the workforce, while those with 20 to 99 employees accounted for another 19.2%. Enterprises with 100 to 499 employees made up 15.1% of the workforce and the remaining 46.1% of the workforce worked in large firms (500 employees or more).
2.5 Wages
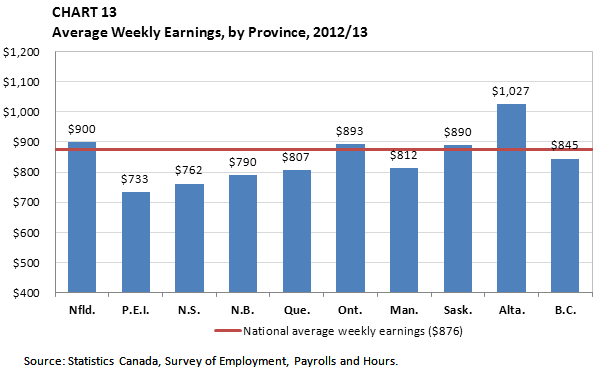
Average weekly wages Footnote 12 grew by 2.5% in 2012/13, to $876 (see Chart 13). Wage payments determine the EI premiums paid by employers and employees, as well as the level of benefits that claimants can receive, calculated as a proportion of a claimant’s wage payments up to the maximum insurable earnings (MIE) amount. The MIE for 2013 was $47,400, up 3.3% from $45,900 in 2012.
Provincially, Alberta had the highest average weekly earnings at $1,027, followed by Newfoundland and Labrador at $900, Ontario at $893, and Saskatchewan at $890 (see Chart 13).
-
Show Data Table
CHART 13 - Average Weekly Earnings, by Province, 2012/13 2012/13 Canada $876 Nfld. $900 P.E.I. $733 N.S. $762 N.B. $790 Que. $807 Ont. $893 Man. $812 Sask. $890 Alta. $1,027 B.C. $845 National average weekly earnings ($876)
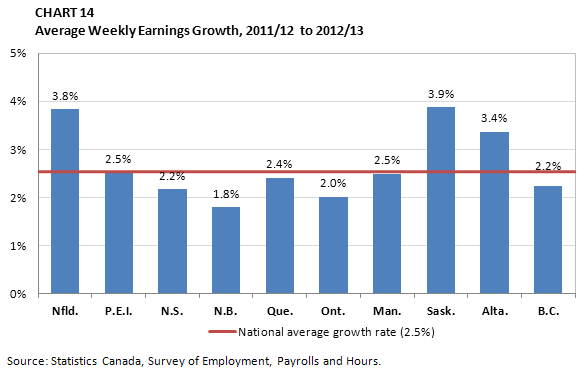
Average weekly earnings rose in every province in 2012/13 (see Chart 14), with the highest growth occurring in Saskatchewan (+3.9%), followed by Newfoundland and Labrador (+3.8%). New Brunswick experienced the lowest wage growth (+1.8%), followed by Ontario (+2.0%).
-
Show Data Table
CHART 14 - Average Weekly Earnings Growth, 2011/12 to 2012/13 2011/2012 to 2012/2013 Nfld. 3.8% P.E.I. 2.5% N.S. 2.2% N.B. 1.8% Que. 2.4% Ont. 2.0% Man. 2.5% Sask. 3.9% Alta. 3.4% B.C. 2.2% National average growth rate (2.5%)
Employees in the goods sector had higher average weekly earnings ($1,073) than employees in the service sector ($830). Employees in the goods sector have consistently had higher average weekly earnings than employees in the service sector over the past decade.
Employees in the mining, quarrying, and oil and gas extraction industry had the highest average weekly earnings ($1,655) in 2012/13, followed by workers in the utilities industry ($1,509). The accommodation and food services industry, meanwhile, had the lowest average weekly earnings ($362). This is due partly to the high proportion of part-time workers in the industry and correspondingly lower average hours worked per week, as described below.
2.6 Hours Worked
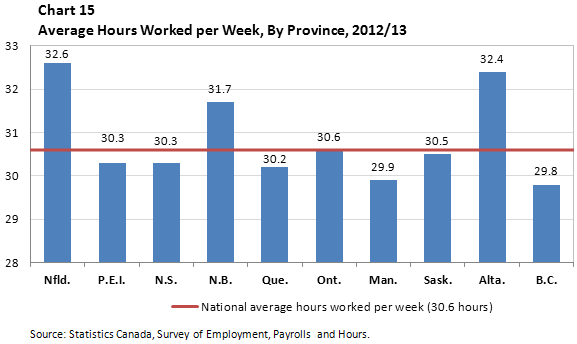
The average hours worked per week increased for a third consecutive year in 2012/13 to 30.6 hours, an increase of 0.1 hour from 2011/12. EI benefit eligibility requirements and benefit entitlements are based, in part, on the number of insurable hours worked in the previous year.
Employees in Newfoundland and Labrador, Alberta and New Brunswick worked the most hours per week on average, with 32.6, 32.4 and 31.7 hours, respectively. Employees in Newfoundland and Labrador worked two hours more a week than the national average. Employees in British Columbia and Manitoba worked the fewest number of hours in 2012/13, with an average of 29.8 and 29.9 hours, respectively (see Chart 15).
-
Show Data Table
Chart 15 - Average Hours Worked per Week, By Province, 2012/13 2012/13 Canada 30.6 Nfld. 32.6 P.E.I. 30.3 N.S. 30.3 N.B. 31.7 Que. 30.2 Ont. 30.6 Man. 29.9 Sask 30.5 Alta. 32.4 B.C. 29.8 National average hours worked per week (30.6 hours)
Employees in the goods sector worked 37.6 hours per week on average in 2012/13, similar to the number in the previous year (37.5 hours). Employees in the service sector, meanwhile, worked 28.6 hours per week on average in 2012/13, also similar to results in the previous year (28.5 hours).
In 2012/13, employees in the mining, quarrying, oil and gas extraction industry worked the most hours per week (40.6 hours), while those in the utilities industry also worked a significant number of hours per week (40.4 hours). The educational services industry had the lowest number of hours worked per week (17.8 hours), followed by the accommodation and food services industry (23.0 hours).
3. Unemployment
In 2012/13, there were 1.36 million unemployed individuals on average in a given month, which represented a 1.4% decrease from 2011/12.
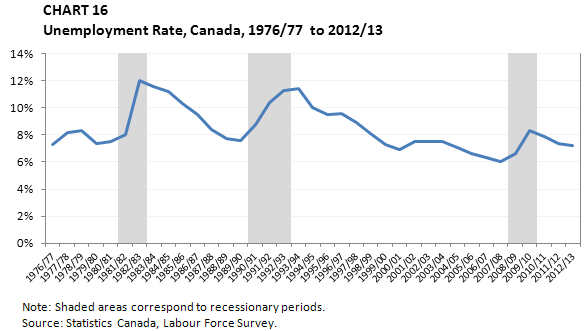
For the third year in a row, Canada’s annual unemployment rate declined, reaching 7.2% in 2012/13, compared with 7.4% in 2011/12 and 7.9% in 2010/11. The unemployment rate in 2012/13 was still 1.2 percentage points higher than the 6.0% observed in 2007/08, one year prior to the onset of the late-2000s recession (see Chart 16). The OECD recently projected Canada’s unemployment rate would drop further by the end of 2014 to 6.7% and that its labour market advantage over the United States would lessen, with both countries projected to post similar unemployment rates over the coming years. Footnote 13
-
Show Data Table
CHART 16 - Unemployment Rate, Canada, 1976/77 to 2012/13 Unemployment rate 1976/77 7.3% 1977/78 8.2% 1978/79 8.3% 1979/80 7.4% 1980/81 7.5% 1981/82 8.0% 1982/83 12.0% 1983/84 11.6% 1984/85 11.2% 1985/86 10.3% 1986/87 9.5% 1987/88 8.4% 1988/89 7.7% 1989/90 7.6% 1990/91 8.8% 1991/92 10.4% 1992/93 11.3% 1993/94 11.4% 1994/95 10.0% 1995/96 9.5% 1996/97 9.6% 1997/98 8.9% 1998/99 8.1% 1999/00 7.3% 2000/01 6.9% 2001/02 7.5% 2002/03 7.5% 2003/04 7.5% 2004/05 7.1% 2005/06 6.6% 2006/07 6.3% 2007/08 6.0% 2008/09 6.6% 2009/10 8.3% 2010/11 7.9% 2011/12 7.4% 2012/13 7.2%
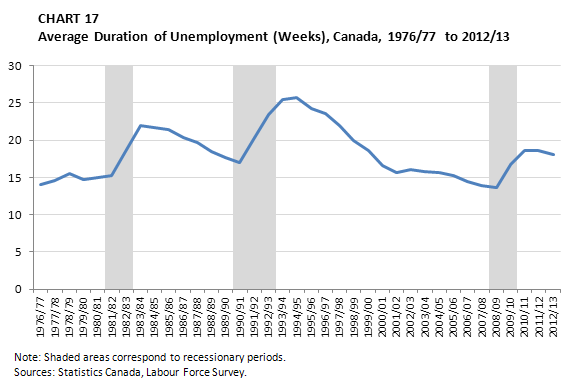
The duration of unemployment fluctuates due to a number of factors, including the economic business cycle and the skills requirements of the labour market relative to the skills of the unemployed. The average duration of unemployment dropped to 18.1 weeks in 2012/13 from 18.6 weeks the year before (see Chart 17). Footnote 14 Nevertheless, it represents an increase of 4.2 weeks from 2007/08, the year before the late-2000s recession.
-
Show Data Table
CHART 17 - Average Duration of Unemployment (Weeks), Canada, 1976/77 to 2012/13 Year Average Duration of Unemployment 1976/77 14.0 1977/78 14.6 1978/79 15.5 1979/80 14.7 1980/81 15.0 1981/82 15.2 1982/83 18.7 1983/84 22.0 1984/85 21.7 1985/86 21.4 1986/87 20.4 1987/88 19.7 1988/89 18.5 1989/90 17.7 1990/91 17.0 1991/92 20.3 1992/93 23.4 1993/94 25.4 1994/95 25.7 1995/96 24.2 1996/97 23.6 1997/98 21.9 1998/99 19.9 1999/00 18.6 2000/01 16.6 2001/02 15.6 2002/03 16.0 2003/04 15.8 2004/05 15.6 2005/06 15.2 2006/07 14.4 2007/08 13.9 2008/09 13.6 2009/10 16.7 2010/11 18.6 2011/12 18.6 2012/13 18.1
3.1 Unemployment Rate and Duration, by Province
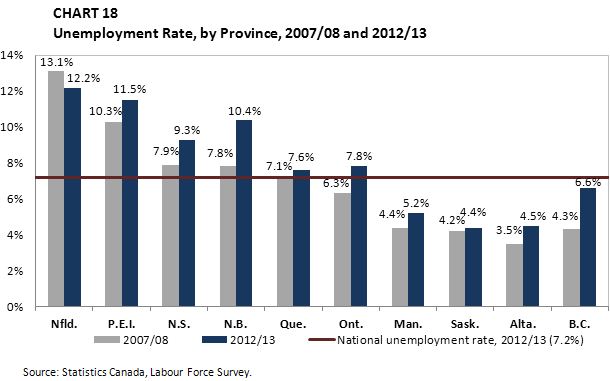
Unemployment rates in Western Canada remained considerably lower than the national average due to the region’s strong economic performance in recent years. Saskatchewan registered the lowest unemployment rate (4.4%) in 2012/13, fuelled in large part by demand in global energy markets, followed by Alberta at 4.5%, Manitoba at 5.2% and British Columbia at 6.6%. As in most other provinces, unemployment rates in the West remained higher than rates observed before the late-2000s recession in 2007/08 (see Chart 18).
Alberta and Newfoundland and Labrador witnessed the largest drop in their unemployment rates in 2012/13, as both provinces experienced a decrease of 0.7 percentage points in their unemployment rates since 2011/12. In Newfoundland and Labrador, the unemployment rate dropped from 12.9% in 2011/12 to 12.2% in 2012/13.
For the seventh consecutive year, the unemployment rate in Ontario was higher than the national average. This was in contrast to the three decades prior to 2005, when Ontario’s unemployment rate was consistently below the national average. Since the depths of the global recession, Ontario has begun to show signs of strengthening, with the service sector and construction industry leading employment growth.
Quebec’s unemployment rate decreased to 7.6% in 2012/13 from 7.9% in 2011/12. Nevertheless, the unemployment rate in 2012/13 was higher than it was in 2007/08, when it was 7.1%. The unemployment rate in the province has fluctuated around the 8% mark since the early 2000s—considerably lower than the 11% average registered in the 24 years prior, between 1976/77 and 1999/2000. With the exception of 2010/11, Quebec’s unemployment rate has been consistently higher than the national average for the past 30 years.
The Atlantic provinces continued to have the highest unemployment rates in the country in 2012/13. Despite the downward trend in Newfoundland and Labrador’s unemployment rate over the last four years, it remained 5.0 percentage points above the national average. Prince Edward Island’s unemployment rate has fluctuated around 11% for the past decade, while Nova Scotia and New Brunswick experienced slightly lower rates over this period, around 8% and 9%, respectively.
-
Show Data Table
CHART 18 - Unemployment Rate, by Province, 2007/08 and 2012/13 2007/08 2008/09 2009/10 2010/11 2011/12 2012/13 Canada 6.0% 6.6% 8.3% 7.9% 7.4% 7.2% Nfld. 13.1% 14.0% 15.6% 13.6% 12.9% 12.2% P.E.I. 10.3% 11.4% 11.4% 11.5% 11.4% 11.5% N.S. 7.9% 8.0% 9.2% 9.3% 8.6% 9.3% N.B. 7.8% 8.8% 8.8% 9.4% 9.7% 10.4% Que. 7.1% 7.6% 8.4% 7.9% 7.9% 7.6% Ont. 6.3% 7.1% 9.1% 8.4% 7.7% 7.8% Man. 4.4% 4.4% 5.3% 5.3% 5.4% 5.2% Sask 4.2% 4.2% 4.8% 5.3% 4.8% 4.4% Alta. 3.5% 4.2% 6.9% 6.2% 5.2% 4.5% B.C. 4.3% 5.3% 7.9% 7.7% 7.1% 6.6% National unemployment rate, 2012/13 (7.2%)
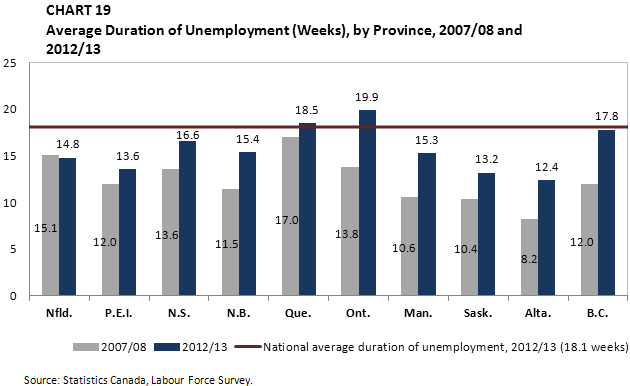
The provinces with the longest duration of unemployment do not necessarily correspond with the provinces with the highest unemployment rate. This is likely due to the nature of unemployment across the country; for instance, in the Atlantic provinces, unemployment levels rise and fall with the seasons to a larger extent, Footnote 15 while in Ontario and Quebec, the decline in manufacturing has resulted in more dislocated workers and more long-term unemployment. Footnote 16 Ontarians experienced the longest average duration of unemployment (19.9 weeks) in 2012/13, followed by Quebec residents at 18.5 weeks (see Chart 19). The duration of unemployment was below the national average of 18.1 weeks in the remaining provinces. When compared with the pre-recession level of 2007/08, Ontario also registered the largest increase in the average duration of unemployment (+6.1 weeks), followed by British Columbia and Manitoba at 5.8 and 4.7 weeks, respectively. Newfoundland and Labrador was the only province where the average duration of unemployment was lower in 2012/13 than in 2007/08 (-0.3 weeks).
-
Show Data Table
CHART 19 - Average Duration of Unemployment (Weeks), by Province, 2007/08 and 2012/13 2007/08 2008/09 2009/10 2010/11 2011/12 2012/13 Canada 13.9 13.6 16.7 18.6 18.6 18.1 Nfld. 15.1 14.5 15.2 15.6 15.7 14.8 P.E.I. 12.0 13.1 13.5 13.1 12.3 13.6 N.S. 13.6 13.0 14.9 17.7 15.6 16.6 N.B. 11.5 13.5 13.9 15.3 15.9 15.4 Que. 17.0 16.2 17.1 17.5 18.8 18.5 Ont. 13.8 14.0 18.5 21.0 20.4 19.9 Man. 10.6 10.2 11.8 13.9 13.6 15.3 Sask 10.4 9.6 11.4 14.0 13.6 13.2 Alta. 8.2 7.9 13.9 16.5 14.8 12.4 B.C. 12.0 11.0 14.7 18.0 18.8 17.8 National average duration of unemployment, 2012/13 (18.1 weeks)
3.2 Unemployment Rate and Duration, by Gender
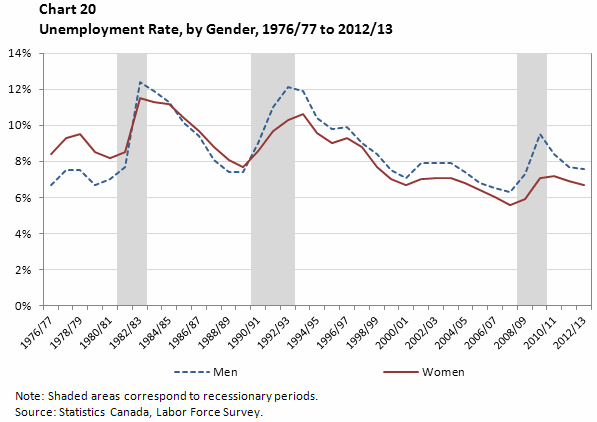
Men reported a higher unemployment rate than that for women in 2012/13 (see Chart 20). The unemployment rate for men decreased by 0.1 percentage points to 7.6%, and declined for the third consecutive year. For women, the unemployment rate declined for a second year in 2012/13, falling by 0.2 percentage points to 6.7%. For men and women, the unemployment rates were 1.3 and 1.1 percentage points higher, respectively, than those in 2007/08, when unemployment rates were at their lowest since comparable data have been collected.
As shown in Chart 20, the gender unemployment rate gap reversed itself in the early-1990s. Since that time, unemployment rates for women have remained consistently lower than unemployment rates for men by 0.9 percentage points, on average. In 2012/13, the gender gap was 0.9 percentage points—an improvement from 2.4 percentage points in 2009/10, the year with the largest gap since Statistics Canada started recording comparable data in 1976/77. The gender unemployment rate gap tends to be at its highest during recessions and subsequently falls during recoveries.
-
Show Data Table
Chart 20 - Unemployment Rate, by Gender, 1976/77 to 2012/13 Year Men Women 1976/77 6.7% 8.4% 1977/78 7.5% 9.3% 1978/79 7.5% 9.5% 1979/80 6.7% 8.5% 1980/81 7.0% 8.2% 1981/82 7.7% 8.5% 1982/83 12.4% 11.5% 1983/84 11.9% 11.3% 1984/85 11.3% 11.2% 1985/86 10.1% 10.4% 1986/87 9.4% 9.7% 1987/88 8.1% 8.8% 1988/89 7.4% 8.1% 1989/90 7.4% 7.7% 1990/91 9.0% 8.6% 1991/92 11.0% 9.7% 1992/93 12.1% 10.3% 1993/94 11.9% 10.6% 1994/95 10.4% 9.6% 1995/96 9.8% 9.0% 1996/97 9.9% 9.3% 1997/98 9.0% 8.8% 1998/99 8.4% 7.7% 1999/00 7.5% 7.0% 2000/01 7.1% 6.7% 2001/02 7.9% 7.0% 2002/03 7.9% 7.1% 2003/04 7.9% 7.1% 2004/05 7.4% 6.8% 2005/06 6.8% 6.4% 2006/07 6.5% 6.0% 2007/08 6.3% 5.6% 2008/09 7.3% 5.9% 2009/10 9.5% 7.1% 2010/11 8.4% 7.2% 2011/12 7.7% 6.9% 2012/13 7.6% 6.7%
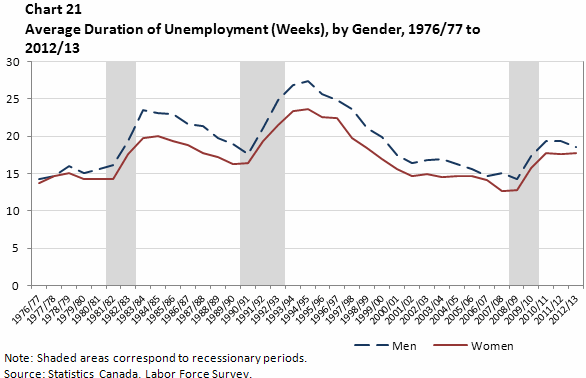
As indicated in Chart 21, over the last 30 years, men have nearly always experienced a longer average duration of unemployment than women have. In 2012/13, the average duration of unemployment was 18.5 weeks for men and 17.7 weeks for women.
-
Show Data Table
Chart 21 - Average Duration of Unemployment (Weeks), by Gender, 1976/77 to 2012/13 Men Women 1976/77 14.3 13.7 1977/78 14.6 14.7 1978/79 16.0 15.0 1979/80 15.1 14.3 1980/81 15.6 14.3 1981/82 16.1 14.2 1982/83 19.4 17.6 1983/84 23.5 19.8 1984/85 23.1 20.0 1985/86 23.0 19.4 1986/87 21.6 18.8 1987/88 21.4 17.8 1988/89 19.8 17.2 1989/90 18.9 16.3 1990/91 17.6 16.4 1991/92 21.1 19.3 1992/93 24.8 21.5 1993/94 26.9 23.4 1994/95 27.4 23.6 1995/96 25.6 22.5 1996/97 24.8 22.4 1997/98 23.6 19.8 1998/99 21.1 18.4 1999/00 19.9 17.0 2000/01 17.5 15.6 2001/02 16.4 14.6 2002/03 16.8 14.9 2003/04 16.9 14.5 2004/05 16.3 14.7 2005/06 15.6 14.7 2006/07 14.6 14.1 2007/08 15.0 12.6 2008/09 14.3 12.8 2009/10 17.4 15.7 2010/11 19.3 17.8 2011/12 19.4 17.6 2012/13 18.5 17.7
3.3 Unemployment Rate and Duration, by Age
In 2012/13, the unemployment rates across all major age groups remained relatively unchanged. For individuals between the ages of 25 to 54, the unemployment rate decreased from 6.1% in 2011/12 to 5.9% in 2012/13. For youths aged 15 to 24, the unemployment rate remained stable at 14.1%, while for older workers (aged 55 years and older), it decreased from 6.2% to 6.0%.
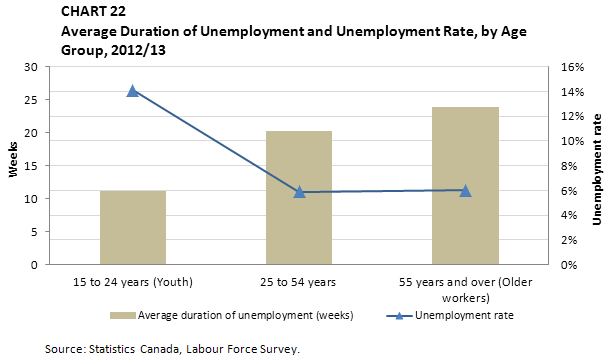
Although younger Canadians continued to face higher unemployment rates than other cohorts in 2012/13, their average duration of unemployment was significantly lower, at 11.1 weeks, than those for core-aged and older workers, which were 20.3 and 23.9 weeks, respectively (see Chart 22). In other words, unemployment spells generally last longer for people in older cohorts, although they are less likely to be unemployed than their younger counterparts.
-
Show Data Table
CHART 22 - Average Duration of Unemployment and Unemployment Rate, by Age Group, 2012/13 Age Unemployment rate Average duration of unemployment (weeks) 15 to 24 years (Youth) 14.1% 11.1 25 to 54 years 5.9% 20.3 55 years and over (Older workers) 6.0% 23.9
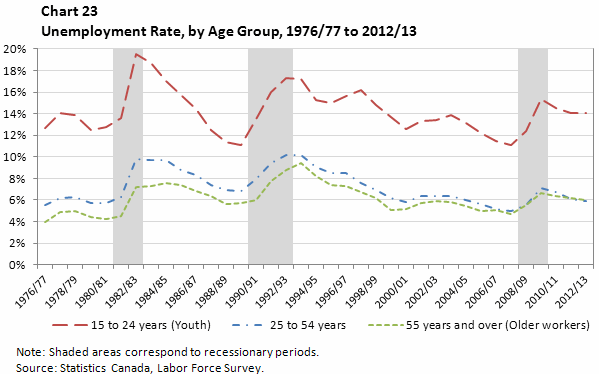
In 2012/13, the unemployment rate of youth was 2.4 times higher than that of core-aged workers (25 to 54 years). The rates were 14.1% and 6.0%, respectively, which represented the largest unemployment rate gap between the two groups since comparable data were first published in 1976/77 (see Chart 23).
-
Show Data Table
Chart 23 - Unemployment Rate, by Age Group, 1976/77 to 2012/13 Unemployment Rate 15 to 24 years (Youth) 25 to 54 years 55 years and over (Older workers) 1976/77 12.7% 5.5% 4.0% 1977/78 14.1% 6.2% 4.9% 1978/79 13.9% 6.3% 5.0% 1979/80 12.5% 5.7% 4.4% 1980/81 12.8% 5.7% 4.2% 1981/82 13.6% 6.3% 4.5% 1982/83 19.5% 9.8% 7.2% 1983/84 18.7% 9.7% 7.3% 1984/85 17.0% 9.7% 7.6% 1985/86 15.7% 8.8% 7.4% 1986/87 14.4% 8.3% 6.8% 1987/88 12.5% 7.4% 6.4% 1988/89 11.4% 6.9% 5.6% 1989/90 11.1% 6.8% 5.7% 1990/91 13.5% 7.9% 6.0% 1991/92 16.0% 9.4% 7.8% 1992/93 17.3% 10.2% 8.8% 1993/94 17.2% 10.2% 9.4% 1994/95 15.3% 9.1% 8.2% 1995/96 15.0% 8.5% 7.4% 1996/97 15.6% 8.5% 7.3% 1997/98 16.2% 7.6% 6.7% 1998/99 14.8% 6.9% 6.2% 1999/00 13.7% 6.2% 5.1% 2000/01 12.6% 5.8% 5.2% 2001/02 13.3% 6.4% 5.7% 2002/03 13.4% 6.4% 5.9% 2003/04 13.9% 6.4% 5.8% 2004/05 13.1% 6.0% 5.4% 2005/06 12.2% 5.6% 5.0% 2006/07 11.5% 5.2% 5.1% 2007/08 11.1% 5.0% 4.7% 2008/09 12.4% 5.5% 5.5% 2009/10 15.4% 7.1% 6.6% 2010/11 14.5% 6.7% 6.4% 2011/12 14.1% 6.1% 6.2% 2012/13 14.1% 5.9% 6.0%
3.4 Unemployment Rate, by Educational Attainment
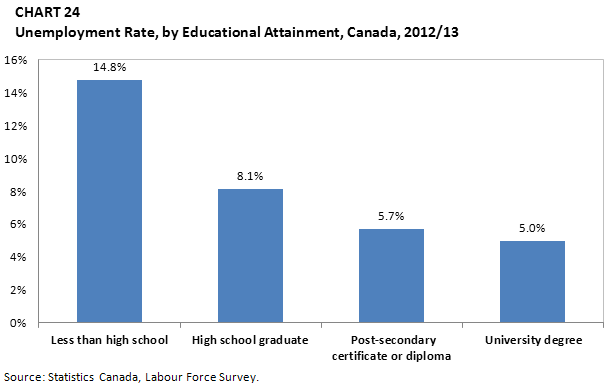
Canadians with higher educational levels have generally found greater success in the labour market, with unemployment rates inversely related to educational attainment. In 2012/13, the unemployment rate among individuals with a university degree Footnote 17 was 5.0%, compared with 5.7% for those with a post-secondary certificate or diploma Footnote 18 and 8.1% for those who graduated high school Footnote 19 (see Chart 24). The unemployment rate was 14.8% among those who did not complete high school. Footnote 20
-
Show Data Table
CHART 24 - Unemployment Rate, by Educational Attainment, Canada, 2012/13 Unemployment Rate 2012/13 Less than high school 14.8% High school graduate 8.1% Post-secondary certificate or diploma 5.7% University degree 5.0%
3.5 Unemployment, by Reason for Unemployment
Unemployment spells can result from a number of factors. The grounds for a given unemployment spell are a key factor in determining eligibility for EI regular benefits. Generally, benefits are only available to individuals who have lost their job through no fault of their own or left their job with just cause. Footnote 21
In 2012/13, individuals who became unemployed because they lost their jobs (job losers) Footnote 22 accounted for the largest share of unemployment in Canada (43.4%). On the other hand, individuals who were unemployed because they left their jobs (job leavers) Footnote 23 accounted for the smallest share (18.7%) of unemployment. Individuals who have not worked in the last year or never worked accounted for 37.9% of the unemployed. As shown in Table 1, these figures remained similar to those reported in 2011/12.
However, these figures differ significantly from the pre-recession figures in 2007/08. For example, the share of the unemployed who left their jobs fell during the recession, decreased by 5.6 percentage points, from 24.3% in 2007/08 to 18.7% in 2012/13.
| 2007/08 | 2008/09 | 2009/10 | 2010/11 | 2011/12 | 2012/13 | |
|---|---|---|---|---|---|---|
| Job leavers | 24.3% | 22.0% | 18.0% | 17.7% | 18.5% | 18.7% |
| Job losers | 45.7% | 49.4% | 51.8% | 45.8% | 42.7% | 43.4% |
| Those who have not worked in the last year or never worked | 29.9% | 28.5% | 30.1% | 36.5% | 38.8% | 37.9% |
3.6 Unemployment, by Duration
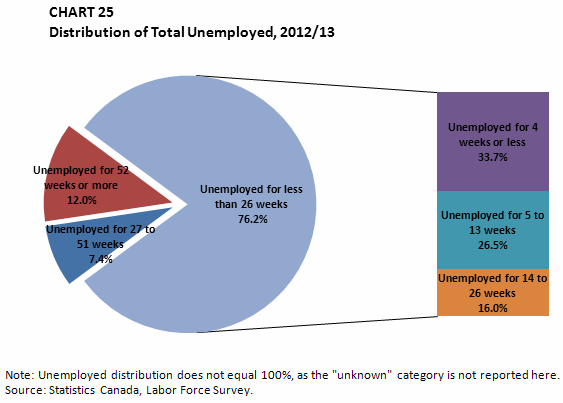
In 2012/13, most unemployed people (76.2%) were unemployed for 26 weeks or less, with 33.7% of the unemployed population unemployed for 4 weeks or less (see Chart 25). Those unemployed for 27 weeks or more represented 19.4% of the total unemployed, or 263,800 unemployed individuals.
-
Show Data Table
CHART 25 - Distribution of Total Unemployed, 2012/13 Unemployed for 27 to 51 weeks 101.2 7.4% Unemployed for 52 weeks or more 162.6 12.0% Unemployed for less than 26 weeks Unemployed for 1 to 4 weeks 457.8 33.7% Unemployed for 5 to 13 weeks 361.1 26.5% Unemployed for 14 to 26 weeks 217.9 16.0% Duration unknown 59.6 4.2% Total 1,360.2 100%
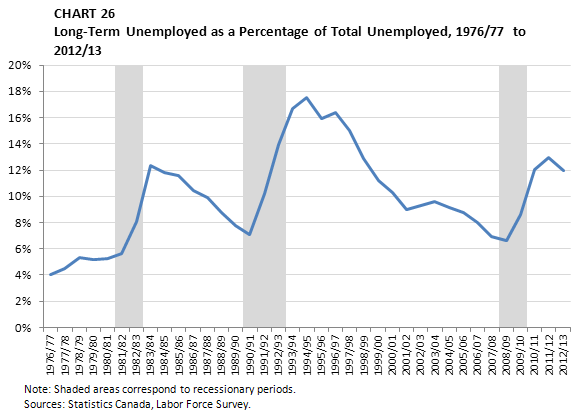
However, the share of the long-term unemployed—those who have been jobless for a year or longer—has nearly doubled since the beginning of the late-2000s recession. In 2012/13, 162,600 people, representing 12.0% of the unemployed population, had been unemployed for at least a year. While this percentage dropped by 0.9 percentage points compared with the previous year, it was still higher than it was in 2007/08, when it was 6.9% (see Chart 26).
-
Show Data Table
CHART 26 - Long-Term Unemployed as a Percentage of Total Unemployed, 1976/77 to 2012/13 Year unemployed, top-code is 99 weeks long-term unemployed % of long-term to total unemployed 1976/77 31.2 4.0% 1977/78 40.0 4.5% 1978/79 49.4 5.3% 1979/80 44.6 5.2% 1980/81 47.2 5.3% 1981/82 55.1 5.6% 1982/83 120.1 8.1% 1983/84 180.9 12.4% 1984/85 169.9 11.8% 1985/86 155.2 11.6% 1986/87 131.9 10.4% 1987/88 113.0 9.9% 1988/89 93.5 8.8% 1989/90 83.0 7.8% 1990/91 88.8 7.1% 1991/92 152.6 10.2% 1992/93 226.7 14.0% 1993/94 273.7 16.7% 1994/95 257.1 17.5% 1995/96 221.2 15.9% 1996/97 233.5 16.3% 1997/98 201.5 15.0% 1998/99 160.1 12.9% 1999/00 128.0 11.2% 2000/01 113.0 10.3% 2001/02 108.6 9.0% 2002/03 116.5 9.3% 2003/04 122.9 9.6% 2004/05 111.6 9.2% 2005/06 100.8 8.8% 2006/07 88.1 8.0% 2007/08 74.2 6.9% 2008/09 80.6 6.7% 2009/10 131.8 8.6% 2010/11 175.9 12.0% 2011/12 178.3 12.9% 2012/13 162.6 12.0%
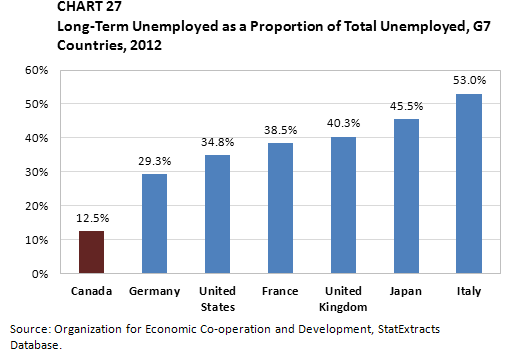
According to the OECD, Canada’s long-term unemployed accounted for 12.5% of the total unemployed in 2012 (see Chart 27), which was well below the proportions in other G7 countries, such as Italy (53.0%) and Japan (45.5%).
-
Show Data Table
CHART 27 - Long-Term Unemployed as a Proportion of Total Unemployed, G7 Countries, 2012 Country Canada 12.5% Germany 29.3% United States 34.8% France 38.5% United Kingdom 40.3% Japan 45.5% Italy 53.0%
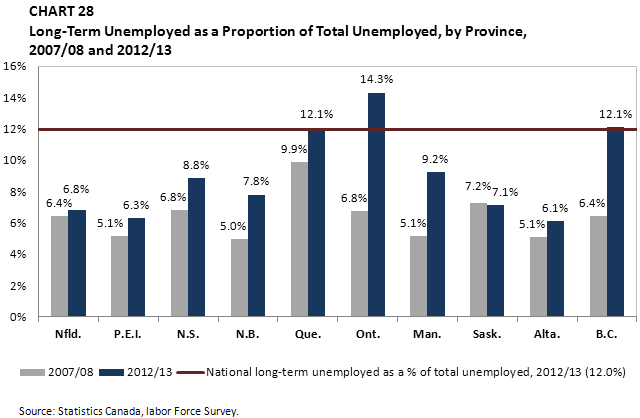
In 2012/13, Ontario, British Columbia and Quebec registered the highest shares of long-term unemployment, with 14.3%, 12.1% and 12.1%, respectively (see Chart 28). The proportions in the four Atlantic provinces were lower, ranging from 6.3% to 8.8%. An OECD report recently suggested that, despite an improving labour market, the problem of long-term unemployment remains in Canada, with key determinants being barriers to geographical and occupational mobility, a skills mismatch, and employers’ preference for hiring new labour-market entrants and the short-term unemployed. Footnote 24
Ontario experienced the most significant increase in the share of long-term unemployment since 2007/08 (+7.5 percentage points), followed by British Columbia (+5.7 percentage points). In 2012/13, the share of long-term unemployment for older workers (55 years and older) was the highest in Ontario and British Columbia at 23.7% and 24.7%, respectively. Since 2007/08, the share of long-term unemployment for older workers, as a percentage of their total unemployment, increased by 10.5 and 6.5 percentage points in Ontario and British Columbia, respectively.
-
Show Data Table
CHART 28 - Long-Term Unemployed as a Proportion of Total Unemployed, by Province, 2007/08 and 2012/13 2007/08 2008/09 2009/10 2010/11 2011/12 2012/13 Canada 6.9% 6.7% 8.6% 12.0% 12.9% 12.0% Nfld. 6.4% 6.6% 5.9% 6.9% 8.1% 6.8% P.E.I. 5.1% 5.7% 6.7% 5.5% 6.5% 6.3% N.S. 6.8% 6.6% 6.8% 11.0% 8.7% 8.8% N.B. 5.0% 6.4% 5.8% 7.3% 8.5% 7.8% Que. 9.9% 9.4% 10.0% 10.0% 13.3% 12.1% Ont. 6.8% 6.8% 10.2% 15.1% 15.2% 14.3% Man. 5.1% 5.4% 5.0% 6.3% 6.7% 9.2% Sask 7.2% 5.7% 5.3% 7.8% 8.2% 7.1% Alta. 5.1% 4.6% 5.5% 9.4% 8.9% 6.1% B.C. 6.4% 4.7% 6.4% 11.7% 13.2% 12.1% National long-term unemployed as a % of total unemployed, 2012/13 (12.0%)
3.7 Job Vacancies and Unemployment-to-Job-Vacancy Ratio
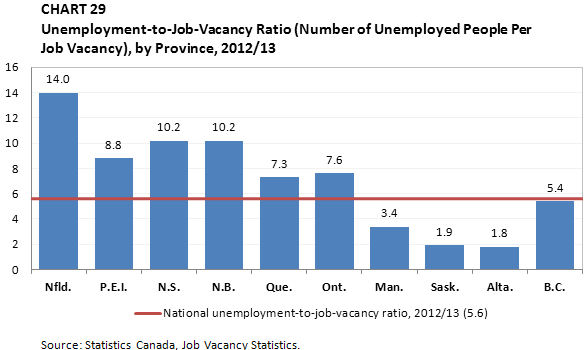
In 2012/13, there were 243,800 vacant jobs in Canada on average in a given month, compared with 238,700 in 2011/12. For every job vacancy, there was an average of 5.6 unemployed people in 2012/13, a slight decrease from 5.8 unemployed people in 2011/12. The Western provinces registered the lowest unemployment-to-job-vacancy ratios, while the Atlantic provinces registered the highest (see Chart 29). Footnote 25
-
Show Data Table
CHART 29 - Unemployment-to-Job-Vacancy Ratio (Number of Unemployed People Per Job Vacancy), by Province, 2012/13 2011/12 2012/13 Canada 5.8 5.6 Nfld. 13.0 14.0 P.E.I. 10.9 8.8 N.S. 8.8 10.2 N.B. 10.5 10.2 Que. 6.0 7.3 Ont. 7.4 7.6 Man. 4.0 3.4 Sask 2.6 1.9 Alta. 2.4 1.8 B.C. 7.0 5.4 National unemployment-to-job-vacancy ratio, 2012/13 (5.6)
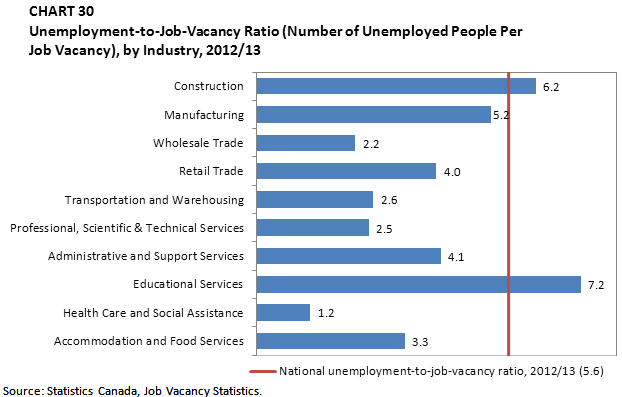
There were 1.2 unemployed people per job vacancy in the health care and social assistance industry, the lowest ratio among the 10 largest industries in Canada, while the educational services industry experienced the highest ratio among these industries, with 7.2 unemployed for every vacant job (see Chart 30). Footnote 26
-
Show Data Table
CHART 30 - Unemployment-to-Job-Vacancy Ratio (Number of Unemployed People Per Job Vacancy), by Industry, 2012/13 All unemployed 5.8 5.6 Construction 8.2 6.2 Manufacturing 4.8 5.2 Wholesale Trade 1.8 2.2 Retail Trade 4.4 4.0 Transportation and Warehousing 3.3 2.6 Professional, Scientific & Technical Services 2.4 2.5 Administrative and Support Services 3.4 4.1 Educational Services F 7.2 Health Care and Social Assistance 1.2 1.2 Accommodation and Food Services 4.0 3.3 National unemployment-to-job-vacancy ratio, 2012/13 (5.6)
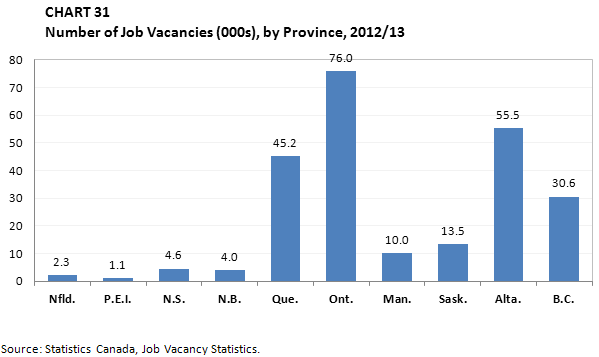
The number of job vacancies varies significantly across provinces (see Chart 31). Ontario had the highest number of vacancies (76,000) in 2012/13, followed by Alberta (55,500) and Quebec (45,200). The four Atlantic provinces accounted for a total of 12,000 job vacancies in 2012/13.
-
Show Data Table
CHART 31 - Number of Job Vacancies (000s), by Province, 2012/13 Province Job vacancy (000s) Nfld. 2.3 P.E.I. 1.1 N.S. 4.6 N.B. 4.0 Que. 45.2 Ont. 76.0 Man. 10.0 Sask 13.5 Alta. 55.5 B.C. 30.6 Canada 243.8
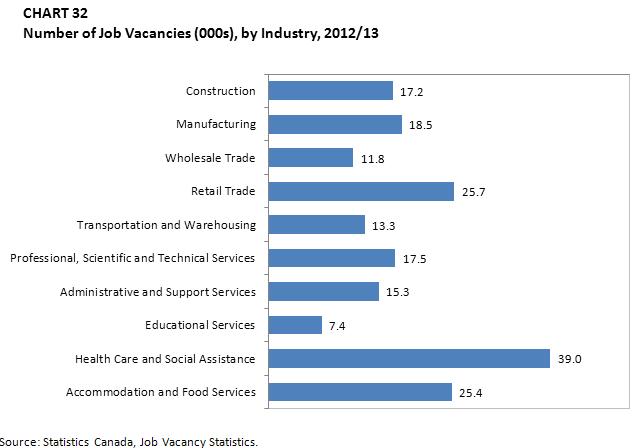
As shown in Chart 32, the number of job vacancies was highest in the health care and social assistance industry (39,000), followed by the retail trade industry (25,700), and the accommodation and food services industry (25,400). The educational services industry had the fewest job vacancies at 7,400.
-
Show Data Table
CHART 32 - Number of Job Vacancies (000s), by Industry, 2012/13 By Industry Job vacancy (000s) Construction 17.2 Manufacturing 18.5 Wholesale Trade 11.8 Retail Trade 25.7 Transportation and Warehousing 13.3 Professional, Scientific and Technical Services 17.5 Administrative and Support Services 15.3 Educational Services 7.4 Health Care and Social Assistance 39.0 Accommodation and Food Services 25.4