EI Monitoring and Assessment Report 2012/13 I. Total Income Benefits
Notice: Refer to the Table of contents to navigate through the EI Monitoring and Assessment Report 2012/13.
I. TOTAL INCOME BENEFITS
1. Total Income Benefits, Claims and Benefits
In 2012/13, the total number of new EI claims and benefits decreased relative to 2011/12.
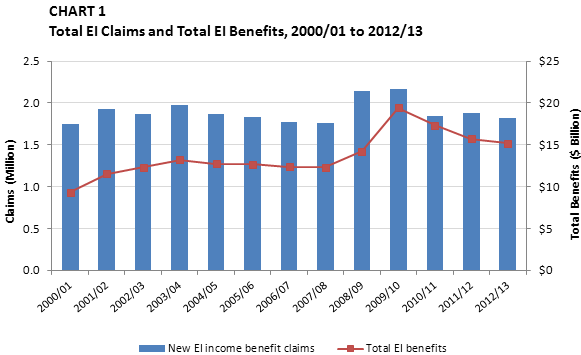
The total number of new EI income benefit claims decreased by 3.4% (-63,680), from 1.88 million in 2011/12 to 1.82 million in 2012/13. As illustrated in Chart 1, the total number of new EI claims rose to 2.14 million in 2008/09 and further increased to 2.17 million in 2009/10. These increases were direct results of the late-2000s recession. Since 2010/11, EI claim volumes have decreased slightly, as the economy has been growing at a moderate pace.
-
Show data table of Chart 1
Chart 1 - Total EI Claims and Total EI Benefits, 2000/01 to 2012/13 New EI income benefit claims
(Million)Total EI benefits
($ Billion)2000/01 1.75 $9.31 2001/02 1.93 $11.5 2002/03 1.87 $12.3 2003/04 1.97 $13.2 2004/05 1.86 $12.7 2005/06 1.83 $12.7 2006/07 1.78 $12.4 2007/08 1.76 $12.3 2008/09 2.14 $14.2 2009/10 2.17 $19.4 2010/11 1.85 $17.3 2011/12 1.88 $15.7 2012/13 1.82 $15.2
The decrease in the number of total EI claims in 2012/13 was primarily driven by a 4.6% (-65,460) decrease in EI regular benefits claims, and a 41.5% (-9,865) decrease in EI Work-Sharing benefits claims. A distribution of all EI Part I claims in 2012/13 is provided in Table 1.
Along with the decrease in the number of total EI claims, total EI benefits also declined by 3.1% (-$0.5 billion), from $15.7 billion in 2011/12 to $15.2 billion in 2012/13, after a decrease of 9.4% (-$1.6 billion) in 2011/12. As of 2012/13, total EI benefits had decreased for three consecutive years, although they were still significantly higher than amounts prior to the late-2000s recession. Specifically, total income benefits were 23.4% higher in 2012/13 than in 2007/08 ($12.3 billion). Multiple factors help explain why benefits were higher in 2012/13 than in 2007/08. First, between 2001/02 and 2006/07, average weekly benefits increased by 9.2%.
Comparatively, from 2007/08 to 2012/13, average weekly benefits increased by 14.5%. The higher rate of growth in average weekly benefits since 2007/08 contributed to the larger figure for total income benefits in 2012/13. Second, among regular claimants, the average duration of benefits used was longer in the fiscal years from 2007/08 onward. The 2013/14 Monitoring and Assessment Report will provide an update on the average duration of regular benefits used for 2012/13. Third, the Canadian unemployment rate increased from 6.0% in 2007/08 to 7.2% in 2012/13, suggesting that there were fewer employment opportunities in 2012/13, which may have led some EI claimants to stay on EI benefits longer.
| Type of EI Benefit | EI Claims |
|---|---|
| EI Regular Benefits | 1,356,810 |
| EI Special Benefits | 510,040 |
| EI Parental Benefits Footnote 5 | 192,470 |
| EI Sickness Benefits | 329,750 |
| EI Maternity Benefits | 170,680 |
| EI Compassionate Care Benefits | 6,102 |
| EI Fishing Benefits | 28,290 |
| EI Work-Sharing Benefits | 13,890 |
| Total Footnote 6 | 1,819,940 |
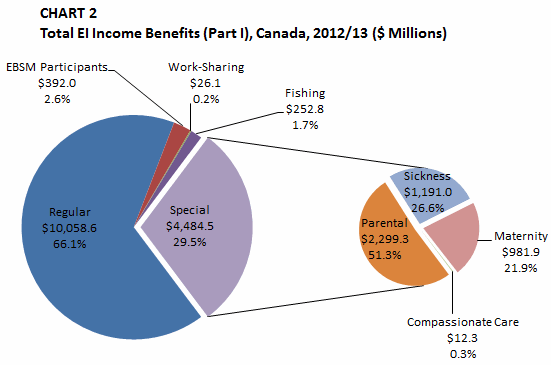
The decline in total EI benefits between 2011/12 and 2012/13 was largely driven by a 6.1% decline (from $10.7 billion in 2011/12 to $10.1 billion in 2012/13) in regular benefits as the result of on-going economic growth and the conclusion of the temporary EI measures introduced in response to the late-2000s recession. As shown in Chart 2, regular benefits accounted for 66.1% of total income benefits in 2012/13, decreasing from 68.2% in the previous year (-2.1 percentage points). Special benefits accounted for 29.5% of total benefits, increasing from 27.3% the previous year (+2.2 percentage points). All other types of benefits, including EI fishing benefits, EI Work-Sharing benefits, and EI Part I benefits paid to Employment Benefits and Support Measures (EBSMs) participants, comprised 4.5% of total EI income benefits. More detailed information on EBSMs can be found in Chapter 3, and more detailed information on total income benefits can be found in Annex 2.1.
-
Show data table of Chart 2
Chart 2 - Total EI Income Benefits (Part I), 2012/13 ($ Millions) $ million % share Regular $10,058.6 66.1% EBSM Participants $392.0 2.6% Work-Sharing $26.1 0.2% Fishing $252.8 1.7% Special Parental $2,299.3 51.3% Sickness $1,191.0 26.6% Maternity $981.9 21.9% Compassionate Care $12.3 0.3%
The number of regular claims and the total amount of regular benefits tend to be sensitive to economic cycles and labour market conditions, while the number of special claims and the total amount of special benefits tend to be sensitive to demographic shifts and to changes in labour force characteristics. For example, in 2012/13, the unemployment rate decreased by 0.2 percentage points, from 7.4% in 2011/12 to 7.2%. This was aligned with declines of 4.6% (-65,460) in the number of regular EI claims and 6.1% (-$649.2 million) in EI regular benefits. However, there were increases of 0.3% (+1,540) in the number of EI special claims and 4.7% (+$200.9 million) in the total amount of EI special benefits.
1.1 Total Income Benefits, by Province and Territory
Provincial and territorial labour markets vary in their demographic and sectoral composition. As shown in Table 2, the provincial/territorial distribution of EI claims does not necessarily align with the distribution of employment in each jurisdiction. For example, the Atlantic provinces had a disproportionate number of claims relative to their employment Footnote 7 share. The Atlantic provinces accounted for 15.1% of total EI claims in 2012/13 but accounted for 6.3% of all employment. In contrast, Ontario accounted for 31.7% of total EI claims in 2012/13, and 38.7% of employment. Combined, Ontario and Quebec accounted for the majority of all EI claims (59.4%) and employment (61.5%).
| Province or Territory | % of Total EI Claims | % of Employment | % of Total Benefits | Average Weekly Benefit |
|---|---|---|---|---|
| Newfoundland and Labrador | 4.5 | 1.3 | 5.5 | $407 |
| Prince Edward Island | 1.2 | 0.4 | 1.4 | $398 |
| Nova Scotia | 4.5 | 2.6 | 5.1 | $389 |
| New Brunswick | 4.9 | 2.0 | 5.5 | $385 |
| Quebec1 | 27.7 | 22.8 | 22.7 | $390 |
| Ontario | 31.7 | 38.7 | 33.3 | $393 |
| Manitoba | 3.2 | 3.6 | 3.0 | $381 |
| Saskatchewan | 2.4 | 3.1 | 2.5 | $408 |
| Alberta | 8.0 | 12.3 | 8.6 | $423 |
| British Columbia | 11.6 | 13.2 | 11.9 | $389 |
| Nunavut | 0.1 | N/A2 | 0.1 | $466 |
| Northwest Territories | 0.1 | N/A2 | 0.2 | $460 |
| Yukon | 0.1 | N/A2 | 0.2 | $452 |
| Canada | 100 | 100 | 100 | $395 |
- Sources: ESDC, EI administrative data; Statistics Canada, Labour Force Survey
- 1 Quebec claims do not include claims for maternity and parental benefits, as the province has its own program—the Quebec Parental Insurance Plan (QPIP)—to provide such benefits.
- 2 The Labour Force Survey does not capture employment data for the Territories.
In terms of benefits, similar to the analysis of claims, in 2012/13, the Atlantic provinces received a disproportionate amount of benefits relative to their employment share. The Atlantic provinces accounted for 17.5% of total benefits, compared with 6.9% of employment. Conversely, Ontario accounted for 33.3% of total benefits, compared with 39.1% of employment. These proportions are consistent with averages for the previous five fiscal years combined.
In 2012/13, total benefits declined in nine provinces and territories, with the sharpest declines occurring in Newfoundland and Labrador (-5.5%, -$48.4 million) and British Columbia (-5.0%, -$95.9 million). Of the four provinces and territories with increases in total benefits, the sharpest increases occurred in Yukon (+8.6%, +$2.5 million) and Manitoba (+2.3%, +$10.6 million).
In 2012/13, average weekly benefit rates increased in every province and territory. The most notable increases took place in Nunavut (+$27, +6.1%), Saskatchewan (+$16, +4.2%) and Prince Edward Island (+$16, +4.3%). The increases observed in the provincial and territorial average weekly benefit rates were relatively in line with the increases in average weekly earnings, as discussed in Chapter 1. In addition, the maximum weekly benefit in Canada increased from $485 in 2012 to $501 in 2013 (+$16, +3.3%), which contributed to the higher average weekly benefits in the provinces and territories. Provincial and territorial average weekly benefits ranged from $381 in Manitoba to $466 in Nunavut. The three territories had the highest average weekly benefit nationally (Table 2).
1.2 Total Income Benefits, by Gender and Age
The number of claims established by women decreased by 21,080 (-2.5%) in 2012/13, following an increase of 22,220 (+2.7%) in 2011/12. The number of claims established by men declined by 42,600 (-4.2%) in 2012/13, after a slight increase of 14,610 (+1.4%) in 2011/12.
The decrease in EI claims for men was mostly attributed to the 7.2% decrease in the number of claims established in the goods sector, where men tend to be over-represented. According to the Labour Force Survey (LFS), men represented 78.2% of workers in the goods sector in 2012/13. Footnote 8
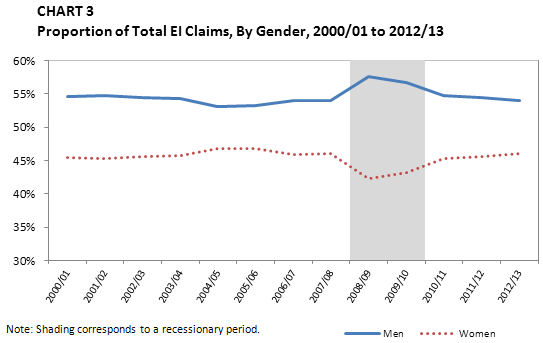
As shown in Chart 3, the proportion of total EI claims established by men increased to a high of 57.6% in 2008/09, while the proportion of total EI claims established by women fell to a low of 42.4%. This is attributable to the fact that the late-2000s recession had a relatively greater impact on industries in the goods sector, such as manufacturing and construction, where men are over-represented (for example, in 2012/13, men accounted for 71.9% and 88.0% of employment in those industries, respectively). However, since 2008/09, the proportion of total EI claims established by men has declined every year, reaching 54.0% in 2012/13. In contrast, since 2008/09, the proportion of total EI claims established by women has increased every year, rising to 46.0% in 2012/13. The proportion of claims established in 2012/13 by men and women were similar to the levels observed in the early 2000s.
-
Show data table of Chart 3
Chart 3 - Proportion of Total EI Claims, By Gender, 2000/01 to 2012/13 Men Women 2000/01 54.6% 45.4% 2001/02 54.7% 45.3% 2002/03 54.5% 45.5% 2003/04 54.2% 45.8% 2004/05 53.2% 46.8% 2005/06 53.2% 46.8% 2006/07 54.1% 45.9% 2007/08 53.9% 46.1% 2008/09 57.6% 42.4% 2009/10 56.7% 43.3% 2010/11 54.7% 45.3% 2011/12 54.4% 45.6% 2012/13 54.0% 46.0% Note: Shading corresponds to a recessionary period.
Total benefits paid to men decreased by 4.6% in 2012/13, after a decrease of 12.1% in the previous year, while total benefits paid to women fell by 1.5% in 2012/13, after a decrease of 6.2% in the previous year. Despite an overall decline in 2012/13, total benefits remained significantly higher than pre-recession levels (23.0% higher for men and 23.7% higher for women in comparison to figures in 2007/08).
The total number of EI claims established by younger workers (aged 15 to 24 years) and core-aged workers (aged 25 to 54 years) decreased by 5.5% (-11,140) and 4.0% (-53,530), respectively, while older workers (55 and older) experienced a slight increase of 0.3% (+990). In comparison to pre-recession levels in 2007/08, the claim volume remained higher for older workers (+32.5%), but lower for younger workers (-5.0%) and core-aged workers (-0.9%). The larger increase in claim volume among older workers could be attributable to the lingering effects of the late-2000s recession, as the precarious financial climate may have caused some older workers to either re-enter the labour market to earn additional income or postpone retirement until the economy strengthens significantly. In addition, the aging of the Canadian demographic has significantly increased the size of the older worker cohort, which may have increased the number of EI claims in this age cohort. Since 2007/08, there has been a 28.0% (+714,900) increase in the number of older workers. During the same period, there has only been a 1.4% (+161,700) increase in core-aged workers, while there has been a 7.4% (-193,700) decrease in younger workers.
2. Income Redistribution from Income Benefits
To measure the extent of redistribution for total EI income benefits, the amount of EI benefits paid to each province/territory, industry or demographic group is divided by the total amount of EI premiums collected. This is the benefits-to-contributions (B/C) ratio. These ratios are then normalized, with the ratio for Canada set at 1.0. Footnote 9 The resulting ratio for each group indicates whether the province/territory, industry or demographic group receives more in EI benefits than it contributes to the program, relative to Canada as a whole. For this report, the amount of EI premiums collected was based on the latest Canada Revenue Agency (CRA) tax data available, which were for 2011. EI benefit data used for this analysis of B/C ratios were therefore for 2011 as well.
A province/territory, industry or demographic group with an adjusted ratio higher than 1.0 is a net beneficiary of the EI program, while those with an adjusted ratio lower than 1.0 are net contributors to the program within a nationwide context. Annex 2.19 provides a detailed account of EI premiums collected and regular benefits paid across different provinces and territories, industries, and demographic groups.
2.1 Benefits-to-Contributions Ratios, by Province and Territory Footnote 10
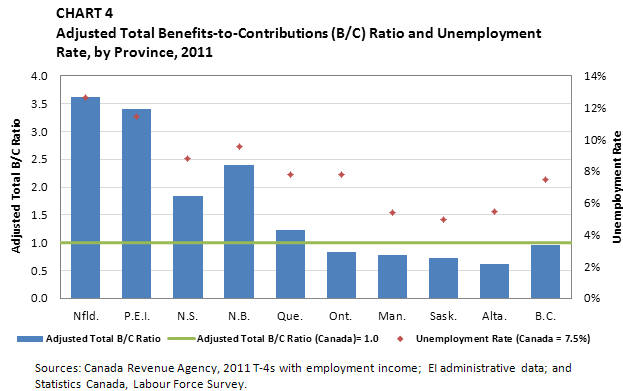
The Atlantic provinces and Quebec continued to be net beneficiaries of EI total income benefits in 2011, as they were in previous years, with adjusted ratios greater than 1.0, while Ontario and the Prairie provinces Footnote 11 remained net contributors, with adjusted ratios below 1.0.
Generally, provinces with higher benefits-to-contributions ratios also have higher unemployment rates. In 2011, the four Atlantic provinces were the four largest net beneficiaries of EI total income benefits, and they also had the highest unemployment rates of all provinces (see Chart 4).
-
Show data table of Chart 4
Chart 4 - Adjusted Total Benefits-to-Contributions (B/C) Ratio and Unemployment Rate, by Province, 2011 Adjusted Total B/C Ratio Adjusted Total B/C Ratio (Canada)= 1.0 Unemployment Rate
Canada = 7.5%)Nfld. 3.6 1.0 12.7% P.E.I. 3.4 1.0 11.4% N.S. 1.8 1.0 8.8% N.B. 2.4 1.0 9.5% Que. 1.2 1.0 7.8% Ont. 0.8 1.0 7.8% Man. 0.8 1.0 5.4% Sask. 0.7 1.0 5.0% Alta. 0.6 1.0 5.4% B.C. 1.0 1.0 7.5%
2.2 Benefits-to-Contributions Ratios, by Sector
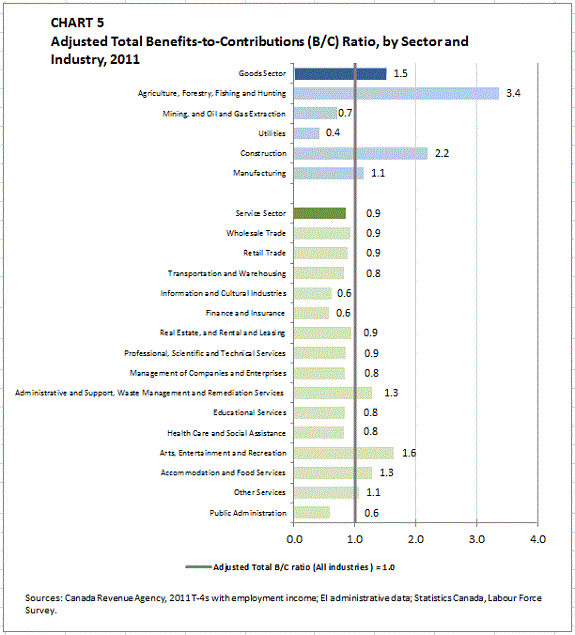
In 2011, the goods sector was a net beneficiary of EI benefits, with an adjusted regular benefits-to-contributions ratio of 1.5, while the service sector was a net contributor of EI benefits, with an adjusted ratio of 0.9 (see Chart 5). Within the goods sector, the agriculture, forestry, fishing and hunting industry and the construction industry had the highest benefits-to-contributions ratios (3.4 and 2.2, respectively).
-
Show data table of Chart 5
Chart 5 - Adjusted Total Benefits-to-Contributions (B/C) Ratio, by Sector and Industry, 2011 Sector and Industry Adjusted Total B/C Ratio Goods Sector 1.5 Agriculture, Forestry, Fishing and Hunting 3.4 Mining, and Oil and Gas Extraction 0.7 Utilities 0.4 Construction 2.2 Manufacturing 1.1 Service Sector 0.9 Wholesale Trade 0.9 Retail Trade 0.9 Transportation and Warehousing 0.8 Information and Cultural Industries 0.6 Finance and Insurance 0.6 Real Estate, and Rental and Leasing 0.9 Professional, Scientific and Technical Services 0.9 Management of Companies and Enterprises 0.8 Administrative and Support, Waste Management and Remediation Services 1.3 Educational Services 0.8 Health Care and Social Assistance 0.8 Arts, Entertainment and Recreation 1.6 Accommodation and Food Services 1.3 Other Services 1.1 Public Administration 0.6 Adjusted Total B/C ratio (All industries ) = 1.0 1.0 - Sources: Canada Revenue Agency, 2011 T-4s with employment income; EI administrative data; Statistics Canada, Labour Force Survey.
2.3 Benefits-to-Contributions Ratios, by Gender, Age and Income
In 2011, women were net beneficiaries, with an adjusted benefits-to-contributions ratio of 1.1, while men were net contributors with an adjusted ratio of 0.9. The reason for this difference can be primarily attributed to the fact that women have historically received higher proportions of special benefits (maternity, parental, sickness and compassionate care benefits) than men have. For example, in 2011/12, women received $3.7 billion in special benefits compared with $0.8 billion for men, representing close to a 5:1 ratio, which is consistent with previous years.
In 2009 and 2010, the benefits-to-contributions ratio for men was equivalent to or higher than that for women, which was not consistent with statistics from other recent years. This anomaly can be attributed to the late-2000s recession, which had a relatively greater impact on men than on women. During this recessionary period, total annual EI benefits paid to men were significantly higher in comparison to figures in pre-recession years.
Among different age groups, both claimants aged 15 to 24 (youth) and claimants aged 25 to 44 had an adjusted benefits-to-contributions ratio of 1.1, as they made up the majority of maternity and parental benefit recipients. Claimants aged 55 and older had an adjusted ratio of 1.0, even though their 2012/13 claim volume was 32.4% higher than their pre-recession volume of 2007/08. Claimants aged 45 to 54 years were the only net contributors, with an adjusted ratio of 0.8.
A study on the financial impact of receiving EI Footnote 12 concluded that the EI program has a considerable positive income redistribution effect, with lower income families having a higher benefits-to-contributions ratio than higher income families do. In fact, families with after-tax incomes below the median received 34% of total benefits and paid 18% of all premiums, representing a nearly 2:1 ratio of benefits to contributions.
Moreover, an evaluation study Footnote 13 using the Longitudinal Administrative Database found that the distributional impact of EI increased substantially during the late-2000s recession. The study concluded that the benefit and contribution side of the program is redistributive, and that EI substantially reduces the percentage of the population in poverty, as benefits are concentrated in the hands of individuals who would otherwise fall just below the poverty line.
3. Family Supplement Provision
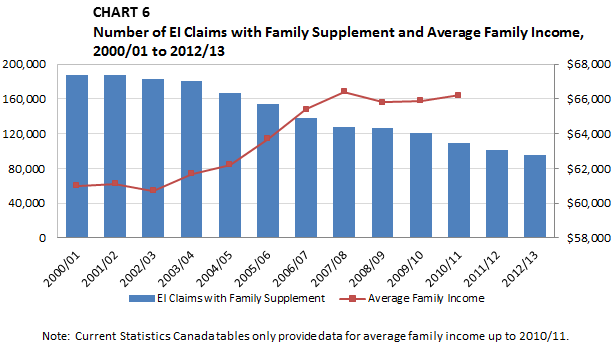
The Family Supplement provides additional benefits to low-income families with children who receive the Canadian Child Tax Benefit (CCTB), Footnote 14 and who have an annual family net income of up to $25,921. Footnote 15 It gives eligible claimants a benefit rate of up to 80% of their average weekly insurable earnings and is available for all benefit types. In 2012/13, the average weekly top-up for the Family Supplement was $43, similar to that in the previous year. A total of 94,860 claims qualified for the Family Supplement in 2012/13, a decrease of 6.2% from the previous year. As Chart 6 indicates, the number of EI claimants receiving the Family Supplement has now decreased for 10 consecutive years, falling from 182,890 in 2001/02 to 94,860 in 2012/13, representing a 48.1% decrease. The overall decline in these claims can be partially attributed to the fact that the Family Supplement threshold has been held constant at $25,921 since 1997, while family incomes have continued to rise. From 2000/01 to 2010/11, average family incomes increased by 8.5%, from $61,000 to $66,200. Footnote 16 In 2012/13, the proportion of all EI claims receiving the Family Supplement top-up fell to 5.2%, a decrease of 0.2 percentage points from the previous year. Over the past several years, the proportion of all EI claims receiving the Family Supplement top-up has declined significantly, falling from 10.7% in 2000/01 to 5.2% in 2012/13, representing a 51.4% decline.
A recent study Footnote 17 based on Statistics Canada’s Longitudinal Administrative Databank (LAD) examined the effect of inflation and fixed dollar thresholds, and their impact on the EI Family Supplement. The study concluded that between 2001 and 2010, the number of households in Canada eligible to receive the Family Supplement fell by nearly 20%. The decline could have been due to many factors, such as changing family composition, real wage growth and inflation. Inflation caused the value of the supplement, in constant dollars, to decline by approximately 14% over the same 10-year period.
-
Show data table of Chart 6
Chart 6 - Number of EI Claims with Family Supplement and Average Family Income, Between 2000/01 and 2012/13 EI Claims with Family Supplement Average Family Income 2000/01 187,250 $61,000 2001/02 187,320 $61,100 2002/03 182,890 $60,700 2003/04 181,080 $61,700 2004/05 167,370 $62,200 2005/06 154,730 $63,700 2006/07 137,630 $65,400 2007/08 127,340 $66,400 2008/09 126,310 $65,800 2009/10 120,290 $65,900 2010/11 109,590 $66,200 2011/12 101,130 2012/13 94,860 - Note: Current Statistics Canada tables only provide data for average family income up to 2010/11.
Women are more likely than men to receive the Family Supplement top-up. Women accounted for 73,980 (78.0%) of the 94,860 new claims receiving the family supplement top-up in 2012/13, similar to the proportion in 2011/12 (77.7%). In 2012/13, claimants aged 25 to 44 accounted for the majority of claims (71.0%). The largest decline in Family Supplement benefits occurred among those aged 15 to 24 years (-12.5%), while claimants aged 55 and older saw an increase (+6.6%).
In 2012/13, low-income families received $106.6 million in additional benefits through the Family Supplement, a decrease of 5.4% from the previous year. Women accounted for $86.5 million (81.1%) of Family Supplement benefits. Family Supplement benefits decreased for both genders in 2012/13, with men (-7.4%) experiencing the largest decline.
In general, recipients of the Family Supplement top-up are entitled to fewer weeks of benefits than non-recipients are but collect more weeks of benefits and use a higher percentage of their entitlement. Among regular claims established in 2011/12, Footnote 18 Family Supplement recipients were entitled to an average of 30.4 weeks of EI benefits, while non-recipients were entitled to 33.4 weeks.
However, among regular claims in 2011/12, Family Supplement recipients used 3.3 more weeks of EI benefits, on average, than non-recipients did (23.0 weeks and 19.7 weeks, respectively). While the number of claimants receiving the Family Supplement top-up has been on the decline, this analysis suggests that recipients of the supplement rely on EI benefits more than non-recipients do and that the top-up continues to provide important additional temporary income support for low-income families. Footnote 19
4. Premium Refund Provision
The EI program has specific provisions for contributors who are unlikely to qualify for benefits. Employees with insured earnings of $2,000 or less are entitled to a full refund of their EI premiums when they file an income tax return Footnote 20 .
According to Canada Revenue Agency (CRA) T-4 data from employers, 0.9 million Footnote 21 individuals had insured earnings of $2,000 or less and were eligible for the full EI premium refund in 2011, representing 5.6% of those in paid employment.
While CRA T-4 data are based on the population of individuals receiving a T-4 tax slip, CRA T1 data include individual taxpayers who received a T-4 tax slip and who filed an income tax return. An evaluation study Footnote 22 using CRA T1 individual tax-filer data found that 622,000 Footnote 23 individual tax-filers who earned $2,000 or less in 2011, received a full EI premium refund Footnote 24 . In total, $10.4 million in full EI premiums were refunded in 2011, a 38.8% decline over 2001. For 2011, the average payout for the full EI premium refund was $17, which represents a 25.1% decrease from 2001.
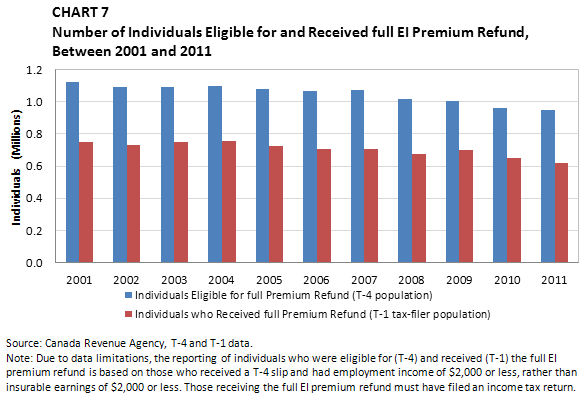
Chart 7 provides an historical breakdown of individuals who were eligible for and received the full EI premium refund. In 2011, 0.9 million individuals were eligible for the full EI premium refund, a decrease of 15.7% (-176,070) since 2001. Similarly, 0.6 million individuals received the premium refund in 2011, representing a decline of 17.2% (-129,000) since 2001. These declines can be attributed to two factors. First, the premium refund threshold has been fixed at $2,000 since 1997. Second, the nationwide average hourly wage rate increased by 33.6% (+$5.78) between 2001 and 2011, while the minimum wage rate increased by 63.7% (+$3.50). Over time, the combination of a fixed premium refund threshold and perpetual increases in wages have led to gradual declines in the number of people who are eligible for and receive the full EI premium refund.
-
Show data table of Chart 7
Chart 7 - Number of Individuals Eligible for and Received full EI Premium Refund, Between 2001 and 2011 Year Individuals Eligible for full Premium Refund (T-4 population) Individuals who Received full Premium Refund (T1 taxfiler population) 2001 1.1 0.8 2002 1.1 0.7 2003 1.1 0.8 2004 1.1 0.8 2005 1.1 0.7 2006 1.1 0.7 2007 1.1 0.7 2008 1.0 0.7 2009 1.0 0.7 2010 1.0 0.7 2011 0.9 0.6 - Source: Canada Revenue Agency, T-4 and T-1 data.
Note: Due to data limitations, the reporting of individuals who were eligible for (T-4) and received (T-1) the full EI premium refund is based on those who received a T-4 slip and had employment income of $2,000 or less, rather than insurable earnings of $2,000 or less. Those receiving the full EI premium refund must have filed an income tax return.
In 2011, 55.5% Footnote 25 (622,000) of all individuals eligible for the full EI premium refund filed an income tax return and received benefits. This implies that a substantial proportion (44.5%) of those eligible for the full EI premium refund, did not file an income tax return.
From 2001 to 2011, between 55.3% and 60.5% of all individuals eligible for the full EI premium refund filed an income tax return and received benefits.
4.1 Temporary Hiring Credit for Small Business
In recognition of the challenges small businesses were facing across the country, Economic Action Plan (EAP) 2011 announced a temporary Hiring Credit for Small Business. Employers whose EI premiums were $10,000 or less in 2010 received a refund for any increase in their 2011 EI premiums over those paid in 2010, to a maximum of $1,000.
EAP 2012 extended the temporary credit for one year under the same parameters. EAP 2013 extended the temporary credit for one more year and expanded it to employers whose EI premiums were $15,000 or less in 2012, with a maximum credit of $1,000.
In 2012, approximately 547,000 businesses received the temporary Hiring Credit for Small Business at a total cost of about $217 million.
According to an evaluation study, Footnote 26 approximately 538,750 businesses, representing 61.0% of all businesses, received the HCSB in 2011. The average refund in 2011 was $386 per recipient business, at a total cost of $208 million.
5. EI Support for Apprentices
Apprenticeship is a key means by which individuals gain the skills and experience they need to be certified in the skilled trades. It is a structured system that combines on-the-job training (during which the apprentice is employed and earns a wage) and technical training, which is typically provided in class at a college or other training institution. The design of apprenticeship programs in Canada, including the duration and delivery method of technical training, varies across trades and across provinces and territories (P/Ts). In Quebec, for example, apprentices complete all of their technical training before beginning an apprenticeship program. In the other P/Ts, apprentices complete their technical training during the apprenticeship program, using a variety of approaches. In some cases, they take technical training via self-learning, distance learning, night classes or day release programs. Many apprentices, however, complete their technical training using a traditional block release approach that requires them to leave work to attend a college or other training institution full-time for typically, six to eight weeks. These blocks of in-class technical training normally alternate with periods of on-the-job training that involve 1,200 to 1,800 hours of work. Some apprentices completing their technical training through blocks of full-time in-class training may not take this training in a given year for a variety of reasons, including insufficient hours of work, scheduling conflicts, and limited training spaces.
| 2012/13 | 2011/12 | 2010/11 | 2009/10 | |
|---|---|---|---|---|
| Number of New Apprentice Claims | 51,540 | 51,040 | 49,860 | 57,170 |
| Newfoundland and Labrador | 1,810 | 1,840 | 1,610 | 1,930 |
| Prince Edward Island | 360 | 340 | 460 | 370 |
| Nova Scotia | 1,450 | 1,150 | 1,190 | 1,350 |
| New Brunswick | 1,680 | 2,240 | 2,140 | 2,130 |
| Ontario | 13,340 | 13,390 | 12,780 | 14,180 |
| Manitoba | 3,080 | 3,030 | 2,650 | 2,920 |
| Saskatchewan | 4,180 | 3,650 | 3,200 | 3,060 |
| Alberta | 17,620 | 16,530 | 16,640 | 20,190 |
| British Columbia | 7,720 | 8,540 | 8,820 | 10,790 |
| Territories | 300 | 330 | 370 | 250 |
| EI Benefits Paid While Attending Full-time Technical Training | $185.6 | $188.8 | $177.2 | $205.0 |
| Newfoundland and Labrador | $6.7 | $6.6 | $5.7 | $6.7 |
| Prince Edward Island | $1.1 | $1.0 | $1.2 | $1.1 |
| Nova Scotia | $4.1 | $3.1 | $3.3 | $3.8 |
| New Brunswick | $5.0 | $6.6 | $6.4 | $6.5 |
| Ontario | $46.2 | $48.5 | $43.7 | $48.6 |
| Manitoba | $11.3 | $12.2 | $9.7 | $10.2 |
| Saskatchewan | $15.0 | $13.5 | $11.4 | $10.4 |
| Alberta | $68.7 | $65.2 | $63.3 | $78.9 |
| British Columbia | $26.4 | $30.6 | $30.8 | $37.9 |
| Territories | $1.2 | $1.4 | $1.7 | $1.0 |
| EI Benefits Paid Outside of Full-Time Technical Training2 | $71.4 | $81.6 | $94.4 | $131.3 |
| Newfoundland and Labrador | $5.2 | $6.6 | $8.4 | $8.5 |
| Prince Edward Island | $0.9 | $0.8 | $1.1 | $0.9 |
| Nova Scotia | $3.3 | $3.4 | $4.8 | $5.0 |
| New Brunswick | $4.9 | $7.4 | $7.2 | $7.7 |
| Ontario | $22.2 | $23.9 | $24.4 | $31.6 |
| Manitoba | $2.7 | $2.8 | $3.1 | $3.7 |
| Saskatchewan | $3.3 | $2.9 | $3.0 | $3.9 |
| Alberta | $16.1 | $16.5 | $22.7 | $35.8 |
| British Columbia | $12.3 | $16.8 | $19.4 | $33.7 |
| Territories | $0.6 | $0.5 | $0.4 | $0.6 |
| Total EI Benefits Paid To Apprentices Who Attended Full-Time Technical Training in the Year | $257.1 | $270.4 | $271.6 | $336.3 |
- 1 No values are included for Quebec, which reflects its unique program design in which apprentices complete all of the in-class technical training prior to beginning an apprenticeship program.
- 2 Benefits (regular and special) paid outside of full time in-class technical training to apprentices who also received benefits while attending full time in-class technical training.
The EI program has special rules and administrative procedures to support apprentices who are unemployed as a result of full-time in-class technical training for which they have been referred by the P/T under section 25 of the Employment Insurance Act (EI Act). This legislative provision allows an apprentice to receive benefits while attending full-time in-class training without having to be available for work or having to look for work. Apprentices also benefit from having to serve only one two-week waiting period for the full duration of their apprenticeship even if it involves multiple blocks of full-time in-class technical training. They can apply for EI up to seven days before the end of work and can elect to be exempt from bi-weekly reporting requirements. Apprentices attending full-time, in-class technical training also receive a special reference code that facilitates faster processing and payment of their EI claims. To qualify for EI while attending school, an apprentice must have a valid job separation and sufficient insurable hours of work over the qualifying period.
Outside of these periods of full-time, in-class technical training, an apprentice who loses his or her job due to reasons such as lack of work may also be eligible for EI. For example, many apprentices work in EI regions and industries that experience periods of seasonal unemployment. Eligibility for EI in these cases would still require a valid job separation and sufficient insurable hours of work over the qualifying period.
Historically, the EI Monitoring and Assessment Report has not distinguished between EI benefits received during periods of full-time, in-class technical training and benefits received as a result of unemployment incurred during periods of on-the-job training. In this report, we distinguish between the two. Apprentices who complete their technical training through distance learning, nighttime classes, day release or methods other than full-time in-class training and who received EI benefits in the year for reasons such as job-loss or a lack or work (including seasonal unemployment) are not included in this section. Footnote 27
Furthermore, this report also uses a new methodology that more accurately identifies apprentices who received EI benefits while attending full-time in-class technical training and who also received EI benefits at other times of the year.
In 2012/13, apprentices established 51,540 new EI claims, resulting in $257.1 million in benefits. Of this total, $185.8 million was paid while the apprentices were unemployed and attending full-time in-class technical training, while $66.3 million was paid in regular benefits and $5.4 million was paid in special benefits to these same apprentices for unemployment occurring at times of the year other than during their block of full-time, in-class technical training. Of the 51,540 new apprentice claims, 19,510 involved benefits paid during both the period of on-the-job training and the period of full-time in-class technical training. Table 3 summarizes the results for 2012/13 by province and restates the numbers for prior years using the new methodology. The impact of the economic downturn in 2009 and the associated rise in unemployment rates is reflected in the increase in EI benefits paid outside of full-time in-class technical training.
The average weekly benefit apprentices received while attending full-time, in-class training is higher than that for the program overall ($439 vs. $395). In 2012/13, apprentices in Canada received an average of $3,600 in EI regular benefits while attending full- time, in-class technical training. Apprentices who also received benefits outside of their period of full-time, in-class technical training received an average of $3,400 in additional regular benefits during the year.
-
Show data table of Chart 8
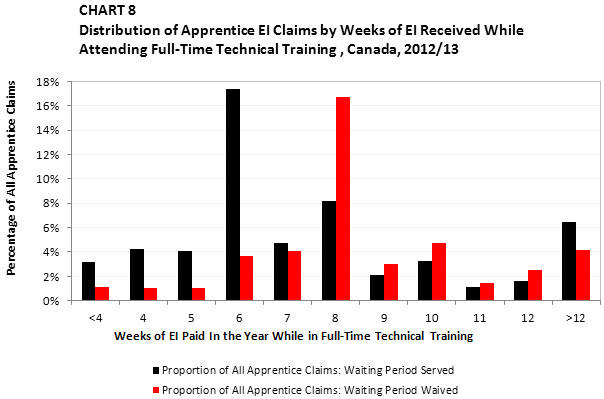
Chart 8 - Distribution of Apprentice EI Claims by Weeks of EI Received While Attending Full-Time Technical Training , Canada, 2012/13 Weeks of EI Paid In the Year While in Full-Time Technical Training Proportion of All Apprentice Claims: Waiting Period Served Proportion of All Apprentice Claims: Waiting Period Waived <4 3.2% 1.1% 4 4.2% 1.0% 5 4.1% 1.1% 6 17.4% 3.7% 7 4.8% 4.0% 8 8.2% 16.8% 9 2.1% 3.0% 10 3.3% 4.7% 11 1.1% 1.4% 12 1.6% 2.6% >12 6.5% 4.2%
Chart 8 shows the distribution of the 51,540 new apprentice claims in 2012/13 by the total number of weeks for which EI benefits were paid during the year while apprentices were attending full-time in-class technical training. For example, when first-year apprentices attended an 8-week block of training and received 6 weeks of EI benefits (the waiting period accounting for the other 2 weeks) they would be included in the 6 weeks bar. If they had previously served a waiting period and received EI for the full duration of their full-time, in-class training block, they would be included in the 8 weeks bar. Any additional weeks of EI received outside of the block of in-class technical training would not influence the distribution in Chart 8. When apprentices attended, and received EI benefits for two separate full-time, in-class technical training blocks as part of the same claim, the combined total weeks of the two training blocks were used. This explains the rise in the number of claims with more than 12 weeks of full-time training (e.g., two 8-week training blocks in the year for a total of 16 weeks of EI while attending full-time, in-class training). The chart also distinguishes between claims for which the waiting period was waived and claims for which the waiting period was served (in 2012/13, roughly 45% of apprentice claimants benefited from the waiver of the waiting period).
Apprentices who only received EI while attending full-time, in-class technical training received an average of 8.0 weeks of benefits in 2012/13. Apprentices who also received benefits outside of their block of full-time, in-class training received an average of 17.3 weeks of EI benefits during the year.