
EI Monitoring and Assessment Report 2012/13 II. Assisting Canadians During Unemployment: EI Regular Benefits
Notice: Refer to the Table of contents to navigate through the EI Monitoring and Assessment Report 2012/13.
EI regular benefits provide temporary financial assistance to workers who have lost their job through no fault of their own, while they look for work or upgrade their skills Footnote 28 , provided that they have contributed to the program and accumulated the required number of insurable hours. In most cases, individuals require between 420 and 700 insured hours to qualify, based on the unemployment rate in the economic region where they reside, to access regular benefits. This feature of the EI program is referred to as the Variable Entrance Requirement (VER).
However, workers who have recently entered the labour market for the first time (new entrants) and those who have limited or no work experience in the last two years (re-entrants) require 910 insured hours, regardless of where they reside. These two groups are collectively known as new-entrants/re-entrants (NEREs).
1. EI Regular Claims and Regular Benefits
In 2012/13, there were 1.36 million new EI regular claims established. That number represented a decrease of 4.6% (-65,460) from 1.42 million in 2011/12. Despite the decline in 2012/13, the number of new EI regular claims remained 4.8% higher than the level (1.29 million) observed in 2007/08, prior to the onset of the late-2000s recession.
Generally, the number of EI regular claims tends to be sensitive to economic cycles and labour market conditions. For example, the unemployment rate, decreased by 0.2 percentage points to 7.2% in 2012/13, but remained 1.2 percentage points higher than the 6.0% observed in 2007/08, mirroring the changes in the number of regular claims discussed above.
Along with the decrease in the number of EI regular claims, EI regular benefits declined by 6.1% (-$0.6 billion), from $10.7 billion in 2011/12 to $10.1 billion in 2012/13, after a decrease of 12.9% (-$1.6 billion) in 2011/12. Although regular benefits paid have decreased for three consecutive years, they remained 26.4% (+$2.1 billion) higher than what was paid in 2007/08, prior to the late-2000s recession.
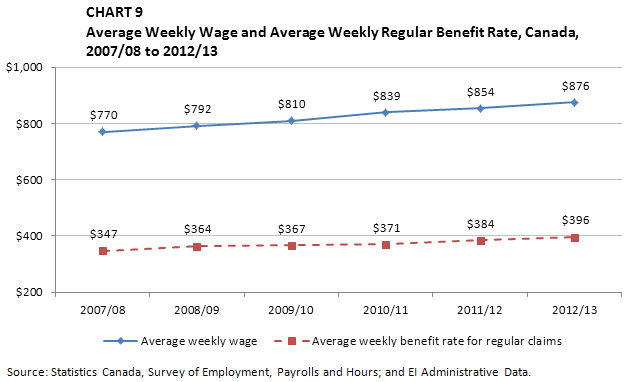
As shown in Chart 9, in 2012/13, the average weekly benefit for regular claims rose by 3.1% (+$12), from $384 in 2011/12 to $396 in 2012/13. This rise was a result of the combined effect of the 3.0% increase in average weekly wages over the period, as explained in Chapter 1, and the increase in the maximum weekly benefit rate, which rose from $485 in 2012 to $501 in 2013.
-
Show data table
Chart 9: Average Weekly Wage and Average Weekly Regular Benefit Rate, Canada, 2007/08 to 2012/13 Average weekly wage Average weekly benefit rate for regular claims 2007/08 $ 770 $ 347 2008/09 $ 792 $ 364 2009/10 $ 810 $ 367 2010/11 $ 839 $ 371 2011/12 $ 854 $ 384 2012/13 $ 876 $ 396
1.1 EI Regular Benefits, by Province
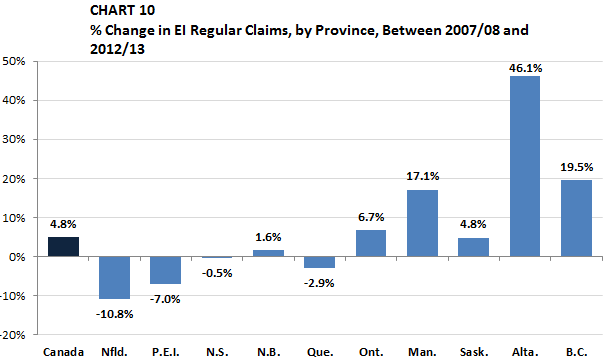
In 2012/13, the number of new regular claims declined in every province. Among provinces, the notable decreases occurred in Nova Scotia (-9.0%, -6,180), Prince Edward Island (-8.3%, -1,480), Newfoundland and Labrador (-6.7%, -4,540) and British Columbia (-6.2%, -9,730).
Despite the overall decline in 2012/13, the number of new regular claims remained higher than the number observed in 2007/08 in most provinces. As shown in Chart 10, in 2012/13, the volumes in the Western provinces, Footnote 29 Ontario (+6.7%) and New Brunswick (+1.6%) remained higher than the levels observed in 2007/08. In contrast, the number of regular claims in three Atlantic provinces Footnote 30 and Quebec were lower than the levels in 2007/08.
-
Show data table
Chart 10: % Change in Regular Claims, by Province, Between 2007/08 and 2012/13 Compared to 2007/08 Canada 4.8% Nfld. -10.8% P.E.I. -7.0% N.S. -0.5% N.B. 1.6% Que. -2.9% Ont. 6.7% Man. 17.1% Sask. 4.8% Alta. 46.1% B.C. 19.5%
When comparing the provincial distribution of EI regular claims to the provincial distribution of employment in 2012/13, it was found that the Atlantic provinces and Quebec were over-represented among EI regular claims, while Ontario and the Western provinces were under-represented (Table 4).
The Atlantic provinces accounted for 15.8% of total regular EI claims in 2012/13, with 6.3% of all employment. Ontario and Quebec had the largest share of employment, with Ontario accounting for 38.7% of national employment and Quebec accounting for 22.8%. These two provinces also had the largest share of total EI claims, with 29.8% and 32.2%, respectively.
The Western provinces accounted for 21.8% of total EI regular claims, with 32.2% of all employment, representing the largest combined percentage-point difference between the share of EI claims and the share of employment.
| Province or Territory | % of Regular EI Claims | % of Employment | % of Regular Benefits Paid |
|---|---|---|---|
| Canada | 100% | 100% | 100% |
| Newfoundland and Labrador | 4.6% | 1.3% | 6.3% |
| Prince Edward Island | 1.2% | 0.4% | 1.5% |
| Nova Scotia | 4.6% | 2.6% | 5.5% |
| New Brunswick | 5.4% | 2.0% | 6.2% |
| Quebec | 32.2% | 22.8% | 29.8% |
| Ontario | 29.8% | 38.7% | 29.4% |
| Manitoba | 2.8% | 3.6% | 2.5% |
| Saskatchewan | 2.0% | 3.1% | 2.0% |
| Alberta | 6.2% | 12.3% | 5.7% |
| British Columbia | 10.8% | 13.2% | 10.6% |
| Territories | 0.3% | NA 2 | 0.5% |
- 1 Statistics Canada, Labour Force Survey.
- 2 The Labour Force Survey does not capture employment data for the Territories.
1.2 EI Regular Benefits, by EI Region
The Canadian economy comprises urban regions that are significant economic hubs, as well as rural regions that preserve more traditional industries that are essential to the functioning of the economy. The six largest census metropolitan areas in terms of population—Vancouver, Calgary, Edmonton, Toronto, Ottawa and Montreal—are used to characterize the profiles of EI regular benefits in urban regions.
Urban and rural labour markets differ in their demographic and sectoral composition. As shown in Table 5, the urban and rural distribution of regular claims does not necessarily align with their distribution of employment. For example, in 2012/13, rural regions accounted for 48.2% of regular claims, but 30.4% of employment. Conversely, the major urban centres accounted for 32.3% of regular claims, and 47.1% of employment. This contrast can be explained by two factors. First, rural regions had a higher unemployment rate (9.1%) than that of the major urban centres (7.5%) in 2012/13. With fewer employment opportunities available, individuals in rural regions may have had higher likelihoods to establish EI claims than individuals in urban centres. Second, in rural regions, the incidence of seasonality was higher. In rural regions in 2012/13, 40.1% of regular claims were considered seasonal, compared to 19.8% of regular claims in major urban centres. Seasonality reflects work patterns, regional availability of work, and industry or personal circumstances.
| % of Regular Claims1 | % of Employment2 | % of Regular Benefits | Average Regular Weekly Benefit | |
|---|---|---|---|---|
| Montréal | 11.5% | 11.3% | 10.3% | $382 |
| Ottawa | 1.5% | 3.1% | 1.4% | $399 |
| Toronto | 10.9% | 17.2% | 11.4% | $392 |
| Calgary | 2.0% | 4.3% | 1.8% | $431 |
| Edmonton | 2.0% | 4.0% | 1.7% | $437 |
| Vancouver | 4.5% | 7.2% | 4.3% | $384 |
| Major Urban Centres | 32.3% | 47.1% | 31.0% | $393 |
| Rural Regions | 48.2% | 30.4% | 52.0% | $401 |
| Canada | 100.0% | 100.0% | 100.0% | $396 |
- 1, 2 Shares of total regular claims and regular benefits for major urban centres and rural regions do not add up to 100%, some regions are classified as urban, but are not considered major urban centres.
Regular benefits followed a pattern similar to that of claims. Rural regions had a higher proportion of regular benefits (52.0%) relative to their employment share (30.4%), while major urban centres accounted for a lower proportion of regular benefits (31.0%) relative to their employment share (47.1%). These proportions were influenced by differences in unemployment levels and the seasonality of claims.
Average weekly benefits were higher in rural regions $401, than in major urban centres ($393). However, among the major urban centres, Edmonton ($437), Calgary ($431) and Ottawa ($399) had higher average weekly benefits than Canadian average ($396).
1.3 EI Regular Benefits, by Sector and Industry
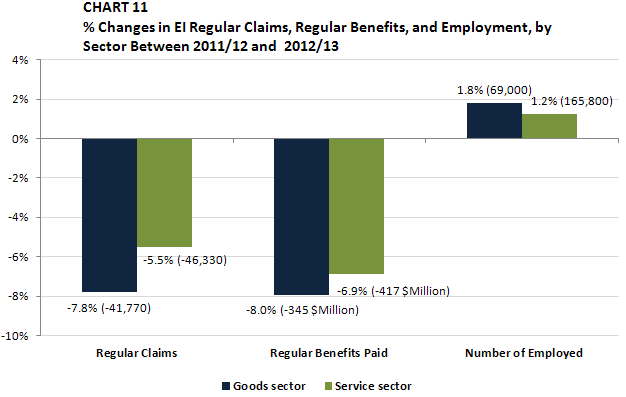
In 2012/13, the number of new EI regular claims in the goods sector decreased by 7.8% (-41,770). The decrease was driven by the employment gain observed in the sector (+1.8%, +69,000) (see Chart 11). Along with a decrease in the number of regular claims, EI regular benefits paid in the goods sector fell by 8.0% (-$344.5 million) in 2012/13. The two largest industries in the sector—manufacturing and construction—experienced declines in regular benefits paid of 14.6% (-$207.1 million) and 5.2% (-$111.4 million), respectively.
In 2012/13, the service sector also witnessed a decline in the number of new regular claims (-5.5%, -46,330). Similar to the goods sector, the decline was attributable to the employment gain observed in the sector (+1.2%, +165,000) (see Chart 11). Education services, which has the largest proportion of claims in the service sector, experienced a slight decrease in the number of regular claims (-0.8%, -1,240).
In line with the decrease in the number of regular claims, regular benefits paid to claimants in the service sector fell by 6.9% (-416,800) in 2012/13, after a decrease of 13.2% in the previous year. The largest decline in benefits paid in the service sector occurred in the retail trade industry (-12.2%), followed by the wholesale trade industry (-10.1%), and accommodation and food services industries (-9.3%).
-
Show data table
Chart 11 % Changes in EI Regular Claims, Regular Benefits, and Employment, by Sector Between 2011/12 and 2012/13 Regular Claims Regular Benefits Paid Number of Employed Goods sector -7.8% (-41,770) -8.0% (-345 $Million) 1.8% (69,000) Service sector -5.5% (-46,330) -6.9% (-417 $Million) 1.2% (165,800)
1.4 EI Regular Benefits, by Gender and Age
In 2012/13, the number of new EI regular claims decreased for both men (-4.9%) and women (-4.2%). Despite the decreases, the number of new regular claims remained 5.0% and 4.6% higher for men and women, respectively, than the levels in 2007/08. In line with the decreases in the number of regular claims, EI regular benefits paid to men and women decreased by 5.7% and 6.7%, respectively, in 2012/13. Despite the decline in 2012/13, EI regular benefits paid remained higher than the levels observed in 2007/08 (25.0% higher for men and 29.1% higher for women).
Women accounted for 40.0% of total regular claims in 2012/13, and they received 35.2% of regular benefits. Men accounted for 60.0% of total regular claims in 2012/13, and 64.8% of the EI regular benefits. The gender distribution of regular benefits paid is not in line with the gender distribution of EI regular claims because men, on average, received higher weekly benefits than women did. For example, in 2012/13, the average weekly benefit for regular claims was $422 for men, $64 higher than that for women ($358).
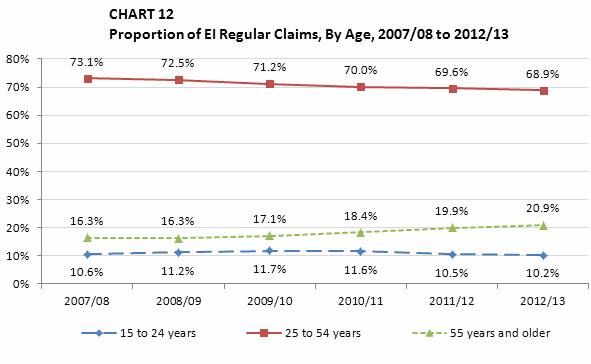
In 2012/13, the number of regular claims established by core-aged workers (aged 25 to 54) and young workers (aged 15 to 24) decreased by 5.6% (-55,160) and 7.0% (-10,460), respectively, while older workers (55 and older) experienced a slight increase of 0.1% (+160).
As illustrated in Chart 12, the proportion of regular claims established by core-aged workers has declined steadily, from 73.1% in 2007/08 to 68.9% in 2012/13, while that of older workers has increased, from 16.3% in 2007/08 to 20.9% in 2012/13. The increase among older workers is attributable to the increase in their share of the Canadian labour force. They accounted for 18.3% of the labour force in 2012/13, a significant increase from 14.9% in 2007/08. The proportion of regular claims established by youth was high (11.7% in 2009/10) during the late-2000s recession, due to a significant loss in youth employment. As the recovery took hold, the proportion of EI claims by those aged 15 to 24 years slowly returned to its pre-recession level (10.6% in 2007/08), as youth accounted for 10.2% of EI regular claims in 2012/13.
-
Show data table
Chart 12 Proportion of EI Regular Claims, By Age, 2007/08 to 2012/13 2007/08 2008/09 2009/10 2010/11 2011/12 2012/13 15 to 24 years 10.6% 11.2% 11.7% 11.6% 10.5% 10.2% 25 to 54 years 73.1% 72.5% 71.2% 70.0% 69.6% 68.9% 55 years and older 16.3% 16.3% 17.1% 18.4% 19.9% 20.9%
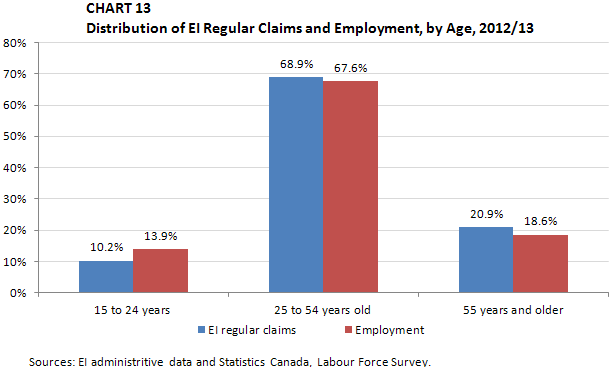
When comparing the age distribution of EI regular claims to the age distribution of employment in 2012/13, it was observed that young workers were under-represented among EI regular claims, while core-aged workers and older workers were slightly over-represented (Chart 13). For example, older workers accounted for 20.9% of EI regular claims in 2012/13, while their share of employment was 18.6%.
-
Show data table
Chart 13 Distribution of EI Regular Claims and Employment, by Age, 2012/13 EI regular claims Employment 15 to 24 years 10.2% 13.9% 25 to 54 years old 68.9% 67.6% 55 years and older 20.9% 18.6%
Regular benefits paid fell across all three major age groups in 2012/13. Core-aged workers registered a 6.7% decrease in regular benefits, while youth witnessed a similar decrease of 6.8%. Older workers witnessed a more moderate decrease of 3.7% in 2012/13.
1.5 EI Regular Benefits, by Claimant Category
Historically, the EI Monitoring and Assessment Report has included analysis of regular claims based on the claimant’s prior use of the EI program. Regular claims were grouped into one of three claimant categories—first-time, occasional, or frequent—based on the number of EI claims in the past five years. These claimant categories were used solely for the purpose of examining the impact and effectiveness of the EI program within the report.
Effective January 6, 2013, the E mployment I nsurance Regulations were modified to establish three EI claimant categories used to determine claimant responsibilities, in terms of undertaking a reasonable job search for suitable employment. The three new EI claimant categories are long-tenured workers, Footnote 31 frequent claimants Footnote 32 and occasional claimants. Footnote 33 Footnote 34 The following analysis of new EI regular claims is based on the new EI claimant categories. For information regarding the national distribution and provincial breakdown of EI regular claims based on the old EI claimant categories, please refer to the 2012 EI Monitoring and Assessment Report.
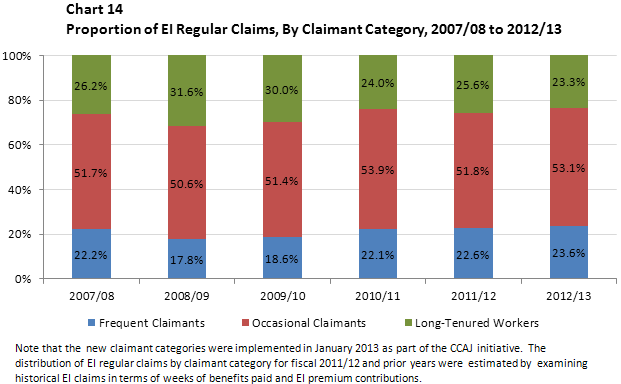
In 2012/13, occasional claimants accounted for the largest share (53.1%) of all EI regular claims, followed by frequent claimants (23.6%) and long-tenured workers (23.3%). As shown in Chart 14, the share of EI regular claims for long-tenured workers decreased by 2.3 percentage points in 2012/13, while the shares for occasional claimants and frequent claimants increased by 1.3 percentage points and 1.0 percentage points, respectively.
-
Show data table
Chart 14 Proportion of EI Regular Claims, By Claimant Category, 2007/08 to 2012/13 2007/08 2008/09 2009/10 2010/11 2011/12 2012/13 Frequent Claimants 22.2% 17.8% 18.6% 22.1% 22.6% 23.6% Occasional Claimants 51.7% 50.6% 51.4% 53.9% 51.8% 53.1% Long-Tenured Workers 26.2% 31.6% 30.0% 24.0% 25.6% 23.3% - Note that the new claimant categories were implemented in January 2013 as part of the CCAJ initiative. The distribution of EI regular claims by claimant category for fiscal 2011/12 and prior years were estimated by examining historical EI claims in terms of weeks of benefits paid and EI premium contributions.
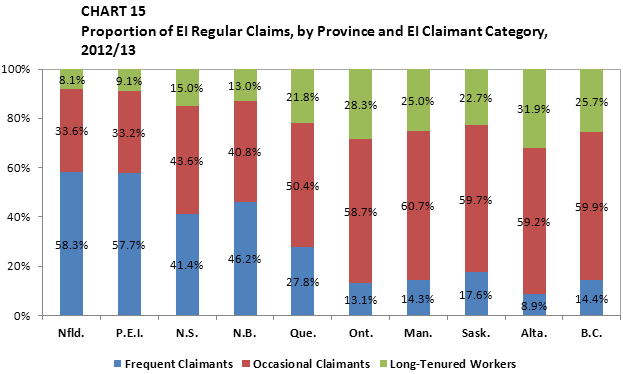
The composition of EI regular claims varied from province to province. As illustrated in Chart 15, the Atlantic provinces had a higher proportion of frequent claimants and a lower proportion of long-tenured workers than other provinces did. For example, in 2012/13, frequent claimants represented 49.2% of the total regular claims in the Atlantic provinces, while in Quebec, Ontario and the Western provinces, the proportions were 27.8%, 13.1% and 13.1%, respectively. The higher proportion of frequent claimants in the Atlantic provinces is associated with a higher proportion of employment in seasonal industries, such as fishing, forestry agriculture, and tourism.
-
Show data table
Chart 15 Proportion of EI Regular Claims, by Province and EI Claimant Category, 2012/13 Frequent Claimants Occasional Claimants Long-Tenured Workers Nfld. 58.3% 33.6% 8.1% P.E.I. 57.7% 33.2% 9.1% N.S. 41.4% 43.6% 15.0% N.B. 46.2% 40.8% 13.0% Que. 27.8% 50.4% 21.8% Ont. 13.1% 58.7% 28.3% Man. 14.3% 60.7% 25.0% Sask. 17.6% 59.7% 22.7% Alta. 8.9% 59.2% 31.9% B.C. 14.4% 59.9% 25.7%
1.6 EI Regular Benefits, by Education Level
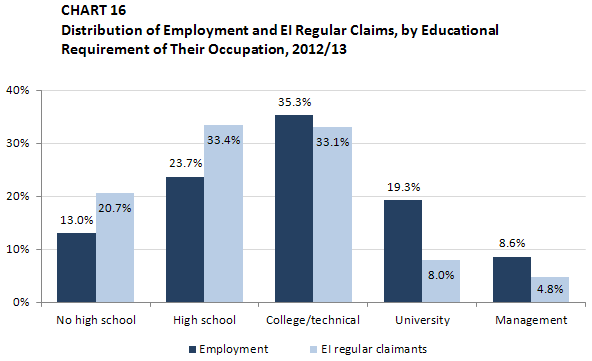
As discussed in Chapter 1, individuals with higher educational attainment tend to experience more successful labour market outcomes than those with less education. Chart 16 compares the distribution of employment by the educational level required for an occupation with the distribution of EI regular claimants by educational attainment in 2012/13.
Individuals employed in occupations that did not require a high school diploma accounted for 13.0% of employment but represented 20.7% of all EI regular claimants. However, individuals employed in occupations that required a university degree accounted for 19.3% of employment but represented only 8.0% of EI regular claimants. As discussed in previous reports, the inverse relationship between educational attainment and use of EI regular benefits has continued over time.
-
Show data table
Chart 16 Distribution of Employment and EI Regular Claims, by Educational Requirement of Their Occupation, 2012/13 No high school High school College/technical University Management Employment 13.0% 23.7% 35.3% 19.3% 8.6% EI regular claimants 20.7% 33.4% 33.1% 8.0% 4.8%
2. Coverage of EI Regular Benefits
The EI program’s definition of coverage is similar to that of other insurance programs. As such, individuals are considered covered by the EI program if they have paid EI premiums in the previous 12 months.
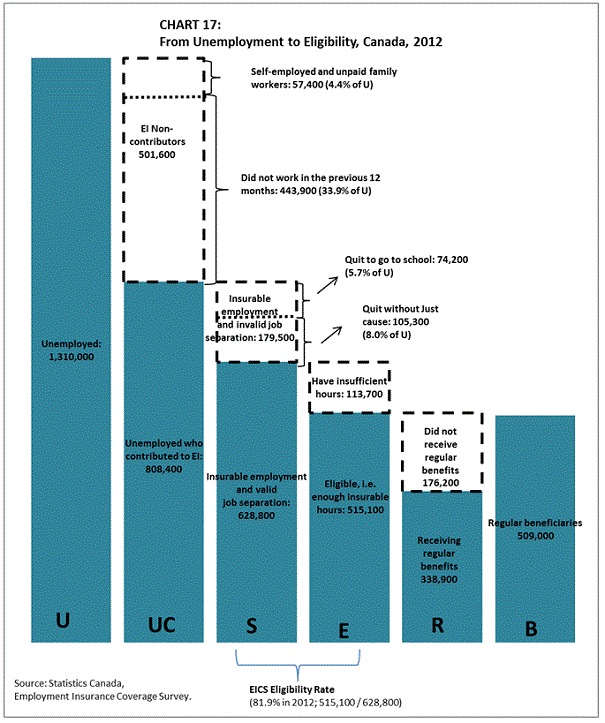
According to the Employment Insurance Coverage Survey (EICS), Footnote 35 there were 1,310,000 unemployed individuals in Canada (shown as U in Chart 17) in 2012. Footnote 36 This represents a drop of 2.6% from the 1,345,000 unemployed individuals reported in 2011, largely due to improving economic conditions in 2012, as discussed in Chapter 1.
-
Show data table
Chart 17 - From Unemployment to Eligibility, Canada, 2012 Unemployment 1,310,000 Unemployed who contributed to EI 808,400 EI non-contributors 501,600 Insurable employment and valid job seperation 628,800 Insurable employment and invalid job seperation 179,500 Eligible, i.e. enough insurable Hours 515,100 Ineligible: Insufficient Insurable Hours 113,700 Receiving regular benefits 338,900 Did not receive regular benefits 176,200 Regular beneficiaries 509,000 - Source : Statistique Canada, Enquête sur la couverture de l'assurance-emploi.
The2012 EICS estimated that, among the 1,310,000 unemployed individuals, 808,000 had contributed to EI in the previous 12 months before becoming unemployed. Combined, they represented 61.7% of all unemployed people (from Chart 17, UC/U).
Those who had not paid EI premiums (or EI non-contributors) included self-employed workers, Footnote 37 individuals who had been unemployed for more than 12 months and people who had never worked. As shown in Table 6, in 2012, self-employed workers represented 4.4% of the total unemployed population, while individuals who had been unemployed for more than 12 months or who had never worked represented 33.9% of the total unemployed population. They together represented 38.3% (501,000) of the total unemployed population.
| 2012 | 2011 | 2010 | 2009 | 2008 | 2007 | |
|---|---|---|---|---|---|---|
| EI Contributors | 61.7% | 64.5% | 64.7% | 70.3% | 70.1% | 70.0% |
| EI Non-Contributors | 38.3% | 35.5% | 35.3% | 29.7% | 29.9% | 30.0% |
| …who have not worked in the last 12 months or have never worked | 33.9% | 32.2% | 32.3% | 24.8% | 25.5% | 24.8% |
| …who have no recent insurable employment (some of the self-employed) | 4.4% | 3.4% | 3.0% | 4.9% | 4.4% | 5.2% |
The higher share of non-contributors to the EI program was due to the increase in the long-term unemployed population in the past three years, which was attributed to the difficult labour market that remained in certain industries following the late-2000s recession. For example, 33.9% of the unemployed population in 2012 had been unemployed for more than 12 months or had never worked, compared with 32.2% in 2011, 32.3 % in 2010 and 24.8% in 2009.
2.1 Coverage of EI Regular Benefits, by Province
Coverage rates measure the proportion of the unemployed who had paid EI premiums, and varied by province, from 80.0% in the Atlantic provinces Footnote 38 and 65.1% in Quebec to 62.9% in the Western provinces Footnote 39 and 55.0% in Ontario. Differences in the composition of the unemployed population help explain the variation in coverage rates among the provinces. As indicated in Table 7, in 2012, Ontario (45.0%) had the largest proportion of unemployed people who did not contribute to the EI program, while the Atlantic provinces (20.0%) had the smallest such proportion. In particular, a significant share of Ontario’s unemployed population had been unemployed for more than 12 months (28.0%); a large share of its unemployed population had never worked (11.9%); and 5.1% had not been paying EI premiums due to the nature of their job, such as self-employment.
| Atlantic | Quebec | Ontario | Western | |
|---|---|---|---|---|
| EI Contributors | 80.0% | 65.1% | 55.0% | 62.9% |
| EI Non-Contributors | 20.0% | 34.9% | 45.0% | 37.1% |
| …who have no recent insurable employment (e.g., Some of the self-employed) | 1.9% | 2.5% | 5.1% | 6.0% |
| …who have not worked for more than 12 months | 13.3% | 25.6% | 28.0% | 22.1% |
| …who have never worked | 4.8% | 6.8% | 11.9% | 9.0% |
3. EI Eligibility for EI Regular Benefits
To be eligible for EI regular benefits, individuals must first be covered by the EI program. That means they must have paid EI premiums in the previous 12 months before the unemployment spell. In addition, they must have had a recent valid job separation(s), and accumulated enough insurable hours of work before the job separation(s).
3.1 Eligibility for EI Regular Benefits, Among the Unemployed Population
The 2012 EICS estimated that among the unemployed population, 629,000 individuals, in 2012 had a valid job separation that met the EI program parameters, making them potentially eligible for EI (potentially EI-eligible population, S in Chart 17). They represented 48.0% of the unemployed population in 2012(see Chart 18).
Among the remaining 52.0% of the unemployed population, there were unemployed individuals who had not contributed premiums to the EI program in the previous 12 months (38.3% of the unemployed population), as discussed in the previous section. However, there were also 180,000 unemployed individuals, whose job separation did not meet the EI program’s parameters (13.7% of the unemployed population). These included unemployed individuals who quit their job without an acceptable cause Footnote 40 (8.0% of the unemployed population) and those who quit their job to go to school and could not qualify (5.7% of the unemployed population).

-
Show data table
Chart 18 Total Unemployed Population and Potentially EI-Eligible Population, 2012 All Unemployed 1,310,000 Insurable Employment and Invalid Job Separation 180,000 (13.7%) EI Non-Contributors 501,000 (38.3%) EI contributors whose Job separation qualified under EI 629,000 (48.0%) Eligible: Enough Insurable Hours 515,000 (81.9%) Ineligible: Insufficient Insurable Hours 114,000 (18.1%) - Source: Statistics Canada, Employment Insurance Coverage Survey.
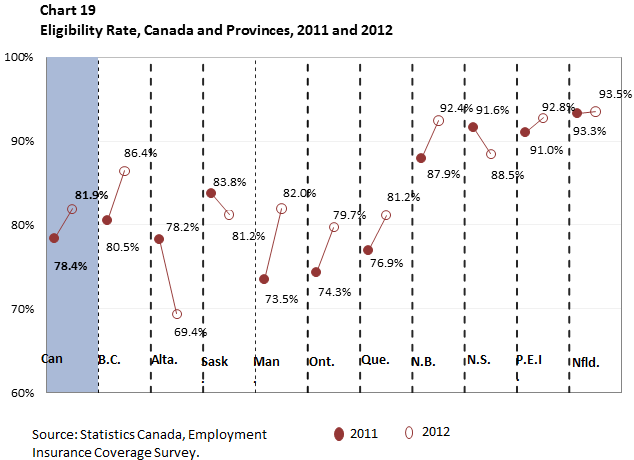
Among the 48.0% (629,000) of the unemployed population who had contributed EI premiums recently and had a recent job separation that qualified under the EI program, 81.9% were eligible to receive EI regular benefits Footnote 41 in 2012 (from Chart 17, E/S), for a total of 515,000 individuals (E in Chart 17). This EI eligibility rate increased by 3.5 percentage points from 78.4% in 2011 and it returned to pre-recession levels (i.e., 82.3% in 2007 and 82.7% in 2006).
The remaining 18.1% (114,000) of the unemployed population who had contributed and had a valid job separation (or 8.7% of the unemployed population) had not worked enough insurable hours to qualify for EI benefits. This figure decreased by 3.5 percentage points in 2012, from 21.6% (150,100) in 2011.
3.2 EI Eligibility Trends Over the Economic Cycle
In general, the eligibility rate increases at the beginning of an economic downturn as the unemployed pool is composed of a greater percentage of newly unemployed workers who had relatively long, uninterrupted periods of employment. These workers would have accumulated enough insurable hours to qualify for EI benefits. The eligibility rate also changes if there are structural changes in the labour market. When total employment is composed of a higher proportion of full-time employment (and a lower proportion of part-time employment), the incidence of being eligible for EI becomes higher. This is because full-time workers are more likely to have accumulated enough insurable hours and, as a result, are more likely to be eligible to receive regular benefits.
The national eligibility rate increased from 82.1% in 2008 to 86.2% in 2009. The increase was attributed to the change in the composition of unemployed EI contributors. A higher-than-usual proportion of unemployed EI contributors who were previously permanent workers was observed in 2009. As shown in Table 8, this figure increased sharply during the recession, from 58.0% of the potentially EI-eligible population in 2008 to 63.0% of the potentially EI-eligible population in 2009. These workers were more likely to have accumulated enough insurable hours and, as a result, were more likely to be eligible for EI regular benefits.
| 2012 | 2011 | 2010 | 2009 | 2008 | |
|---|---|---|---|---|---|
| Eligibility rate | 81.9% | 78.4% | 83.9% | 86.2% | 82.2% |
| Unemployment rate | 7.2% | 7.5% | 8.0% | 8.3% | 6.1% |
| Proportion of the Potentially EI-Eligible Population | |||||
| …who had held Permanent Employment | 338,176 | 356,700 | 424,686 | 539,941 | 332,120 |
| 53.8% | 51.3% | 57.0% | 63.0% | 58.0% | |
| ….who had held Non-permanent, Non-seasonal | 171,529 | 195,471 | 183,891 | 169,597 | 122,391 |
| 27.3% | 28.1% | 24.7% | 19.8% | 21.4% | |
During the recovery, the EI eligibility rate decreased from 83.9% in 2010 to a historical low of 78.4% 2011, and then increased to 81.9% in 2012. The change found in the eligibility rate was again attributed to the change in the composition of the labour market.
Between 2010 and 2011, there was a shift in the composition of unemployed EI contributors, with more individuals having worked in temporary non-seasonal employment, and a lower proportion having worked in permanent employment. This shift in the composition of the unemployed EI contributors resulted in a decline in the eligibility rate.
However, in 2012, the composition of the unemployed EI contributors started to reverse. The share of individuals who had worked in temporary, non-seasonal employment fell, and the proportion of those who had worked in permanent employment grew.
As shown in Table 8, the proportion of temporary non-seasonal workers decreased slightly, from 28.1% of the potentially EI-eligible population in 2011 to 27.3% in 2012. These workers were less likely to have accumulated enough insurable hours to qualify for the EI program and, as a result, were less likely to be eligible for EI regular benefits. The EI eligibility rate for this group increased to 69.8% in 2012, from 60.0% in 2011 and 64.7% in 2010.
Meanwhile, those who had worked in permanent employment accounted for 53.8% of the potentially EI-eligible population in 2012, with their share increasing from 51.3% in 2011. These workers were more likely to have accumulated enough insurable hours to be eligible for the EI program and, as a result, were more likely to be eligible for EI regular benefits, with an EI eligibility rate of 89.9% in 2012(Table 9).
Furthermore, the change in the average duration of employment also contributed to changes in the eligibility rate. In 2011, core-aged workers who held temporary non-seasonal positions saw a decline in their average number of hours worked, from 840 hours in 2010 to 640 hours in 2011. In 2012, their average number of hours worked increased to 880 hours. The number of insurable hours worked is the only measure considered when determining an unemployed individual’s eligibility for EI regular benefits. As such, their EI eligibility rate dropped from 64.7% in 2010 to 60.0% in 2011, and then increased to 69.8% in 2012.
A recent study Footnote 42 using the Canada Out-of-Employment Panel (COEP) Survey showed that individuals’ work patterns influence their likelihood of being eligible for EI regular benefits. The study found that the likelihood of being eligible for EI regular benefits is higher for full-time permanent job separators, and lower for temporary non-seasonal workers.
| 2012 (%) | 2011 (%) | 2010 (%) | 2009 (%) | 2008 (%) | 2007 (%) | |
|---|---|---|---|---|---|---|
| EI Eligibility Rate (E/S Ratio) Footnote 43 | 81.9 | 78.4 | 83.9 | 86.2 | 82.2 | 82.3 |
| …for people who had worked full time | 91.9 | 88.5 | 90.3 | 91.2 | 91.1 | 90.0 |
| …for people who had worked part time | 40.0 | 33.4 | 46.4 | 49.5 | 35.8 | 33.6 |
| …for people who had worked full and part time | 73.9 | 67.4 | 76.7 | 83.9 | 70.0 | 81.0 |
| …for people who had worked in a permanent position | 89.9 | 87.2 | 92.4 | 92.2 | 87.6 | 87.8 |
| …for people who had worked in a permanent full-time position | 94.6 | 91.2 | 94.5 | 94.3 | 92.7 | 91.1 |
| …for people who had worked in a permanent part-time position | 65.2 | 54.9 | 74.4 | 68.8 | 47.7 | 56.3 |
| …for people who had worked in a temporary position | 72.2 | 68.3 | 72.3 | 75.3 | 73.5 | 74.1 |
| …for people who had worked in a temporary seasonal position | 75.6 | 81.2 | 83.6 | 81.4 | 85.0 | 84.4 |
| …for people who had worked in a temporary non-seasonal position | 69.8 | 60.0 | 64.7 | 70.5 | 63.8 | 65.2 |
3.3 EI Eligibility Among the Unemployed Population, by Province
Eligibility rates fluctuated across the country in 2012, from lows of 69.4% in Alberta and 79.7% in Ontario to a high of 93.5% in Newfoundland and Labrador. Compared with 2011 EICS figures, the EI eligibility rate increased in 7 out of the 10 provinces, remaining relatively stable in Newfoundland and Labrador and Prince Edward Island (see Chart 19). The largest increases were observed in New Brunswick (+4.5 percentage points), Ontario (+5.4 percentage points), Quebec (+4.3 percentage points), Manitoba (+8.5 percentage points), and British Columbia (+5.9 percentage points). Although a decrease of 8.8 percentage points was observed in Alberta, the decrease is likely over-estimated for statistical reasons. Due of its very strong economic conditions, the number of workers who may need EI is relatively low in that province. Therefore, the small size of the sub-sample used to estimate the eligibility rate in Alberta resulted in a high coefficient of variation. Footnote 44 Therefore, the decline in the eligibility rate between 2011 and 2012 is likely over-estimated in Alberta.
-
Show data table
Chart 19: Eligibility Rate, Canada and Provinces, 2011 and 2012 Year Eligibility rate Canada 2011 78.4% 2012 81.9% B.C. 2011 80.5% 2012 86.4% Alta. 2011 78.2% 2012 69.4% Sask. 2011 83.8% 2012 81.2% Man. 2011 73.5% 2012 82.0% Ont. 2011 74.3% 2012 79.7% Que. 2011 76.9% 2012 81.2% N.B. 2011 87.9% 2012 92.4% N.S. 2011 91.6% 2012 88.5% P.E.I. 2011 91.0% 2012 92.8% Nfld. 2011 93.3% 2012 93.5% - Source: Statistics Canada, Employment Insurance Coverage Survey.
3.4 EI Eligibility Among the Unemployed Population, by Gender and Age
In 2012, EI eligibility rates increased for all demographic groups (see Table 10). Specifically, the EI eligibility rate for women increased from 79.0% in 2011 to 81.9% in 2012, and that for men increased from 77.0% to 81.9%. As reported in previous EI Monitoring and Assessment Reports, gender differences in eligibility rates reflect different employment characteristics among men and women. A higher proportion of men than women hold full-time and/or permanent jobs; women tend to be overrepresented among those working in part-time and/or temporary jobs. A recent study Footnote 45 showed that the gender differences in eligibility rates may also be attributable to the fact that a higher proportion of women do not have a valid job separation.
Youth (aged 15 to 24) had a lower EI eligibility rate (45.2%), while workers aged 25 years and older had a higher eligibility rate (87.9%) in 2012. The above-mentioned study found that the low eligibility rate for youth may be associated with two factors: many young people quit their job to go to school, and they do not accumulate enough insurable hours to qualify for EI regular benefits.
| 2012 (%) | 2011 (%) | 2010 (%) | 2009 (%) | 2008 (%) | 2007 (%) | |
|---|---|---|---|---|---|---|
| EI Eligibility Rate (E/S Ratio) | 81.9 | 78.4 | 83.9 | 86.2 | 82.2 | 82.3 |
| …for women | 81.9 | 79.0 | 80.7 | 84.3 | 81.6 | 87.6 |
| …for men | 81.9 | 77.0 | 84.4 | 84.3 | 77.8 | 81.0 |
| …for unemployed youth (15 to 24 years old) | 45.2 | 42.1 | 48.4 | 62.8 | 51.9 | 45.9 |
| …for unemployed adult (25 years and older) | 87.9 | 85.1 | 89.6 | 90.5 | 89.1 | 89.4 |
| …for unemployed adult women | 87.2 | 82.0 | 89.6 | 88.3 | 86.4 | 87.7 |
| …for unemployed adult men | 88.3 | 87.4 | 89.5 | 91.8 | 90.6 | 90.4 |
3.5 EI Eligibility for Regular Benefits, Among the Employed Population
An evaluation study, using the Labour Force Survey Footnote 46 , measured the proportion of employees who would have had sufficient insured hours over the qualifying period to meet regional EI entrance requirements—ranging from 420 to 700 hours for most individuals to 910 hours for new entrants and re-entrants (NEREs) Footnote 47 —if all workers had been laid off in the year studied.
The LFS-based simulations suggest that 87.2% of individuals who were working as paid employees in 2012 would have been eligible for regular benefits if they had lost their job. Footnote 48
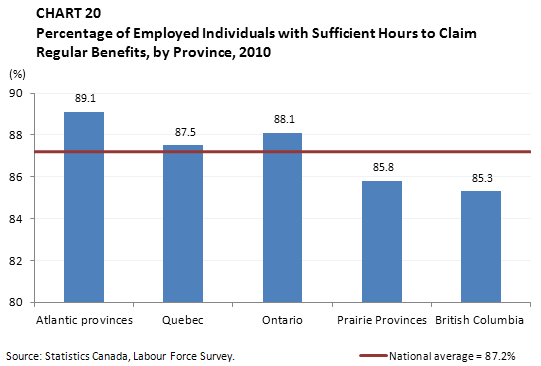
The LFS-based simulations suggest the proportion of unemployed individuals with sufficient hours to claim regular benefits varied only slightly across the country, ranging from 89.1% in the Atlantic region to 85.3% in British Columbia (see Chart 20). The eligibility rates in the Atlantic provinces (89.1%), Ontario (88.1%) and Quebec (87.5%) were higher than the national average, while rates were lower than the national average in the Prairie provinces (85.8%) and British Columbia (85.3%).
-
Show data table
Chart 20 Percentage of Employed Individuals with Sufficient Hours to CLaim Regular Benefits, by Province, 2010 Province/region Eligibility Rate Atlantic provinces 89.1 Quebec 87.5 Ontario 88.1 Prairie Provinces 85.8 British Columbia 85.3 National average = 87.2% 87.2
The regular benefit eligibility rate in 2012 was lower for women (85.8%) than for men (88.6%), primarily because women were more likely to work part-time, and more likely to be NEREs. However, women had a slightly higher eligibility rate than men (93.8% vs. 92.9%) among individuals who were employed in full-time jobs.
Male part-time workers (50.5%), female part-time workers (60.6%) and young workers aged 17 to 24 (60.8%) had the lowest regular benefit eligibility rates in 2012. The low eligibility rate for part-time workers is explained by the fact that they work fewer hours than full-time workers. In addition, youth and part-time workers are more likely to be considered as NEREs than their older, full-time worker counterparts.
4. Accessibility to EI Regular Benefits
While the above analysis focuses on EI eligibility, it is also possible to measure the level of access to EI regular benefits by unemployed people with qualifying separations. This ratio is calculated by dividing the number of unemployed individuals who received regular benefits in the EICS reference week by the number of unemployed individuals with a recent job separation that met EI program eligibility criteria (R/S in Chart 17). The R/S ratio is considered more relevant than the other accessibility measures, as it considers only the unemployed individuals who are among the intended EI client population.
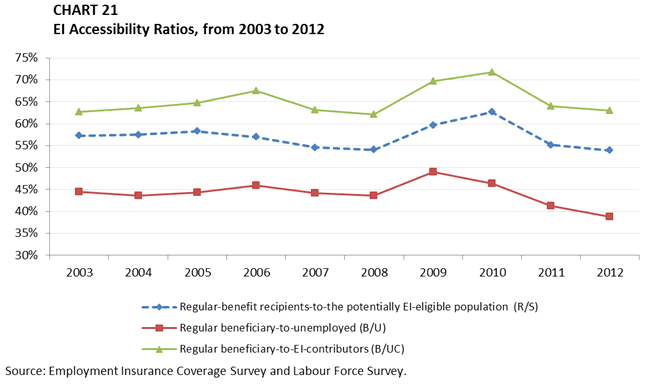
Access to regular benefits (R/S) can differ from eligibility for a number of reasons. For instance, eligible individuals may decide not to establish an EI claim, or individuals may make a claim but decide not to collect benefits. In 2012, among unemployed individuals with a recent job separation that met EI criteria, an average of 53.9% received regular benefits during the reference week compared with 55.1% in 2011 and 62.7% in 2010.
Similar to the eligibility rate, accessibility to EI regular benefits (R/S) varies by demographics, labour market characteristics and province. In 2012, the R/S ratio for women (54.1%) was slightly higher than that for men (53.7%) as women had experienced relatively strong growth in the accessibility ratio over the past two years. Youth (aged 15 to 24 years) and part-time workers had the lowest accessibility ratios in 2012, at 22.1% and 19.0%, respectively, particularly when compared with adults (25 years or older) (59.1%) and full-time workers (62.2%).
The EI access rate ranged from 30.7% in Alberta to 73.8% in the Atlantic provinces in 2012. Alberta’s ratio had the most notable change, decreasing from 52.2% in 2011 to 30.7% in 2012.
Another measure, the beneficiaries-to-unemployed ratio (B divided by U), is often used as an indicator of accessibility to the EI program. The B/U ratio has the advantage of simplicity and historical availability. However, it has a number of limitations. First, its denominator (all unemployed) includes many people who are outside the parameters of the EI program (e.g., individuals who are going back to school, who did not pay EI premiums during the last 12 months or who quit their jobs without just cause). Second, its numerator (total regular beneficiaries in the reference week) includes EI beneficiaries who are not unemployed, such as claimants who received both benefits and earnings in a given week (see section 5 of this chapter for more information on the Working While on Claim provision). Third, the numerator and the denominator of the B/U ratio are derived from two separate sources, as the numerator comes from Statistics Canada’s monthly EI Statistics release and the denominator comes from Statistics Canada’s Labour Force Survey. The accessibility ratio (R/S) remains a more appropriate measure of EI access than the B/U ratio.
-
Show data table
Chart 21 EI Accessibility Ratios, from 2033 to 2012 2003 2004 2005 2006 2007 2008 2009 2010 2011 2012 Regular-benefit recipients-to-the potentially EI-eligible population (R/S) 57.3% 57.5% 58.3% 57.0% 54.6% 54.1% 59.7% 62.7% 55.1% 53.9% Regular beneficiary-to-unemployed (B/U) 44.5% 43.6% 44.4% 45.9% 44.2% 43.6% 49.0% 46.4% 41.3% 38.8% Regular beneficiary-to-EI-contributors (B/UC) 62.7% 63.6% 64.8% 67.5% 63.2% 62.2% 69.7% 71.7% 64.1% 62.9%
In 2012, the B/U ratio was 38.8%, dropping from 41.3% in 2011. The decrease is attributable to the fact that the number of regular beneficiaries decreased to a larger extent than the decrease in the number of total unemployed population. For example, from 2011 to 2012, the number of beneficiaries decreased by 8.4%, while the number of total unemployed decreased by 2.6%. In addition, the end of the temporary EAP EI measures is another factor behind the recent decline in the B/U ratio.
A number of different factors have contributed to the 8.4% decrease in the number of beneficiaries, including the increase in the proportion of long-term unemployed to total unemployed population. These long-term unemployed individuals have not contributed to EI in the previous year; as a result, they are not covered by the EI program. According to the EICS, in 2012, of the total unemployed population, the proportion of those who have not contributed to EI in the previous year increased from 32.2% in 2011 to 33.9% in 2012.
A third measure, the B/UC ratio, is a modification of the B/U ratio in which the total number of unemployed individuals is replaced by the number of unemployed individuals who had paid EI premiums in the previous 12 months. The B/UC ratio is a slight improvement over the B/U ratio, in that its denominator includes only those individuals who paid premiums. However, the denominator still includes individuals who had invalid job separations under the EI program (e.g., those who quit their job to return to school or quit without a just cause). This ratio also suffers from the same issues with its numerator as the B/U ratio. Therefore, once again, the R/S ratio remains the more accurate measure of accessibility to EI.
In 2012, the B/UC ratio was 62.9%, compared with 64.1% in 2011. The decrease is due to the decrease in the number of beneficiaries (-8.4%), which outpaced the decrease in the number of unemployed who paid EI premiums (-6.7%) in 2012.
5. Level of EI Regular Benefits
Under the EI Act, the methodology used to determine the maximum insurable earnings threshold (MIE) Footnote 49 for EI reflects prior average weekly earnings (AWE). Footnote 50 The MIE was $44,200 in 2011, $45,900 in 2012, and $47,400 in 2013. Accordingly, the maximum weekly benefit was $468 in 2011, $485 in 2012, and $501 in 2013. The proportion of regular claimants receiving the maximum weekly benefit increased slightly from 41.3% in 2011/12 to 41.6% in 2012/13. This marked the second consecutive year that the proportion of regular claimants receiving the maximum benefit increased, reversing a two-year decline observed in 2009/10 and 2010/11, which was attributable to the effects of the late-2000s recession on work attachment and to weaker growth in average earnings.
A claimant’s history of collecting benefits has an impact on the likelihood that he or she will receive the maximum weekly benefit. In 2012/13, 55.3% of long-tenured workers and 46.3% of frequent claimants who established an EI claim were entitled to the maximum weekly benefit, in contrast to only 33.5% of occasional claimants.
EI regular claimants were entitled to an average weekly regular benefit of $396 in 2012/13, a 3.3% increase from $384 in 2011/12. Using the EI claimant categories, long-tenured workers had an average EI weekly regular benefit of $429, while frequent claimants had an average EI weekly regular benefit of $412 in 2012/13. In contrast, occasional claimants had an average EI weekly regular benefit of $375.
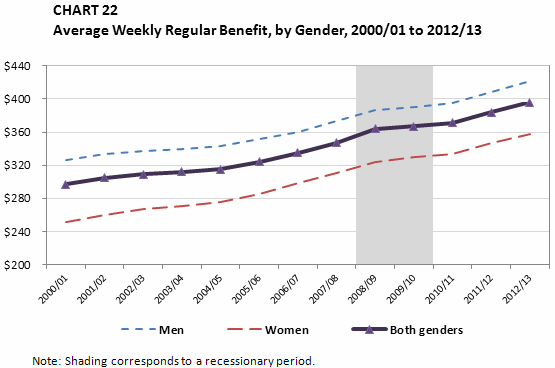
On average, men were entitled to $422 and women to $358 in weekly regular benefits for claims established in 2012/13. While the difference in average weekly regular benefit reflects the earnings gap between men and women, a general trend of strong growth in women’s average weekly regular benefits means that the gap is gradually closing. In 2012/13, the average weekly regular benefit for women was 84.8% of that for men, compared with 71.1% in 2000/01.
Historically, the average weekly benefit for EI regular benefit has increased every year. However, growth of the average weekly regular benefit has fluctuated in recent years, due in part to the effects of the late-2000s recession (see Chart 22). The average weekly regular benefit increased by 4.9% in 2008/09, but only increased by 0.8% in 2009/10 and 1.1% in 2010/11, due to the weaker growth in average earnings, and in the MIE in 2010 (+2.1%) and 2011 (+2.3%) compared to 2009 (+2.9%). The growth rate only returned to pre-recession levels in 2011/12, with a 3.5% increase in the average weekly regular benefit from the previous year. In 2012/13, the growth rate remained stable, with a 3.1% increase over the previous year.
-
Show data table
Chart 22 Average Weekly regular Benefit, by Gender, 2000/01 to 2012/13 Men Women Both genders 2000/01 $326 $251 $297 2001/02 $333 $260 $305 2002/03 $337 $267 $309 2003/04 $340 $271 $312 2004/05 $343 $276 $315 2005/06 $351 $285 $324 2006/07 $360 $298 $335 2007/08 $373 $310 $347 2008/09 $387 $324 $364 2009/10 $390 $330 $367 2010/11 $395 $333 $371 2011/12 $408 $347 $384 2012/13 $422 $358 $396
The effective replacement rate, which is the actual proportion of earnings replaced by EI regular benefits, provides further insight into the level of support provided by EI benefits. The EI program is designed to replace 55% of previous employment earnings, up to the MIE threshold.
A study Footnote 51 based on the EICS and the Survey of Labour and income Dynamics (SLID) found that, between 2001 and 2010, the average effective replacement rate was 48% and 50%, according to the EICS and the SLID, respectively. The study also found that 62% of regular beneficiaries in 2009 and 2010 received regular benefits that equated to 55% of their previously insured employment earnings.
This study also found that, over a 10-year period (2001–10), the proportion of beneficiaries receiving 55% of their prior earnings has declined consistently at an annual rate of 1.5 percentage points. This decline over time is explained by the fact that, for several years, average wage rates increased at a faster pace than the MIE. In fact, the MIE was frozen from 1996 to 2006, but it has increased every year since then.
5.1 Working While on Claim Provision
The purpose of the Working While on Claim (WWC) provision is to encourage work attachment by allowing claimants to accept all available work while receiving EI benefits. Under the EI Act, the provision applies to regular, fishing, parental and compassionate care benefits and claimants may earn the greater of 25% of their weekly benefit or $50, without a reduction in their weekly benefit. Employment earnings above this threshold are deducted dollar for dollar from the claimant’s weekly benefit. If a claimant’s weekly benefit is reduced to zero, that week of entitlement may be deferred for later use within the same benefit period, which generally is one year from the start of the claim.
5.1.1 Working While on Claim Pilot Project Footnote 52
The WWC pilot project was first introduced in 23 pilot regions, on December 11, 2005 and ran until December 6, 2008, to test whether allowing beneficiaries to earn more income while claiming EI benefits would encourage them to accept all available work while receiving EI benefits. Under this WWC pilot, the amount EI claimants could earn while on claim, without a reduction in their benefits, was increased to the greater of $75 or 40% of their weekly benefit. EI claimants in non-pilot regions continued to be subject to an allowable earnings threshold of $50 or 25% of their weekly benefit based on the WWC provision in the EI Act.
The pilot project was re-introduced on December 7, 2008 nationally in all EI economic regions and ran until August 6, 2011. A new pilot began under the same parameters on August 7, 2011, and ran until August 4, 2012, to assess the effectiveness of the pilot during a period of economic recovery and a full economic cycle.
EI administrative data indicate that among all EI claims established in 2011/12, a total of 811,200 involved work while on claim, representing 42.7% of all EI claims established that year. Almost all claimants who worked while on claim (800,990 claims or 98.7%) received regular benefits. Among regular claims established in 2011/12, 55.4% worked while on claim. This proportion has remained relatively stable at around 55% for the last few years and suggests that the likelihood of finding employment while on claim remains relatively high. In 2011/12, among regions with unemployment rates of 10% or lower, 52.8% of regular claims had work while on claim, while among regions with unemployment rates of 10.1% and higher, 65.4% of regular claims had work while on claim.
In 2011/12, in relation to regular benefits, some provinces had a higher proportion than others of EI claims with work while on claim. For instance, among regular EI claims established in the Atlantic provinces in 2011/12, 66.2% (153,210) involved work while on claim, as did 62.5% (292,240) of EI claims established in Quebec. In the rest of Canada, 47.5% (355,540) of EI claims established in 2011/12 involved work while on claim. This regional variability in the likelihood of working while on claim could be influenced by a number of factors, such as regional availability of work, seasonal work patterns, industry circumstances and familiarity with the provision.
Among the 800,990 regular benefit claims involving work while on claim in 2011/12, 6.8% received full EI benefits, Footnote 53 22.3% received partial EI benefits, 22.4% received no EI benefits and deferred their weeks of entitlement and almost half (48.5%) received a mix of EI benefit deductions during the weeks they worked while on claim indicating varied patterns of work and earnings over the course of their claims. An evaluation study Footnote 54 based on WWC pilot data from 2005 to 2008 found that for those claimants receiving full benefits, the WWC pilot project increased the likelihood of working while on claim by 96% for men and 69% for women, and increased average weeks of working on claim by 0.6 weeks for men and by 0.7 weeks for women.
For regular claims established in 2011/12 involving work while on claim, the average entitlement was 33.7 weeks of claims, and the average number of weeks worked while on claim was 12.5 weeks. Compared to 2010/11, regular claims involving work while on claim had an average entitlement of 36.4 weeks of claims and an average of 12.8 weeks worked. The above-mentioned study also indicated that the WWC pilot reduced average total weeks on claim by 1.2 weeks for men and 1.5 weeks for women.
5.1.2 New Working While on Claim Pilot Project Footnote 55
A new WWC pilot project was introduced on August 5, 2012, as announced in Economic Action Plan 2012. Under the new WWC pilot project, a claimant’s benefits are reduced by 50% of his or her earnings while on claim, starting with the first dollar earned, until the claimant's earnings reach 90% of the earnings used to establish his or her benefit rate. At that point, the claimant’s benefits are reduced dollar for dollar until they reach zero, to ensure claimants do not receive more in earnings and benefits than they would have earned working full time. After the new WWC pilot project began, some claimants indicated they could not find additional work beyond approximately one day per week and were experiencing difficulty transitioning to the new pilot rules. As a result, eligible EI claimants who had earnings between August 7, 2011, and August 4, 2012, and were covered by the provisions of the previous WWC pilot project, may be able to revert to the rules of the previous WWC pilot project (which allowed them to earn the greater of $75 or 40% of their weekly benefit without a reduction in their benefit).
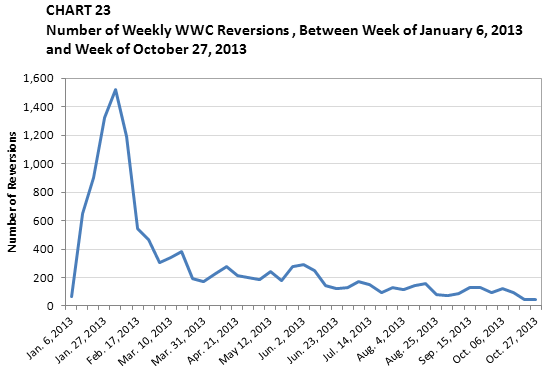
As such, the 2012/13 Monitoring and Assessment Report encompasses various periods of WWC pilots—namely, the pilot that allowed claimants to earn the greater of $75 or 40% of their weekly benefit without a reduction in their benefit; the introduction of the new pilot project that reduced claimants’ benefits by 50% of their earnings while on claim, starting with the first dollar earned, until the claimant’s earnings reach 90% of the earnings used to establish their benefit rate; and the option to revert to the rules of the previous WWC pilot. The option to revert was operational on January 6, 2013. As of August 4, 2013, approximately seven months after eligible claimants were first allowed to revert, a total of 11,375 claims had reverted to the previous WWC rules ($75 or 40%). In the period from January 6, 2013, to February 4, 2013, an average of 1,360 claims per week reverted to the previous WWC pilot rules. As shown in Chart 23, the number of claims that reverted peaked during this period. Since then, an average of 180 claims per week, have reverted to the previous WWC rules. As of August 4, 2013, 6% of those who had the opportunity to revert had chosen to do so.
-
Show data table
Chart 23 Number of Weely WWCReversions, Between Week of January 6, 2013 and Week of October 27, 2013 Date Number of Weekly WWC Reversions Jan. 6, 2013 64 Jan. 13, 2013 647 Jan. 20, 2013 899 Jan. 27, 2013 1323 Feb. 3, 2013 1520 Feb. 10, 2013 1192 Feb. 17, 2013 545 Feb. 24, 2013 467 Mar. 3, 2013 307 Mar. 10, 2013 340 Mar. 17, 2013 380 Mar. 24, 2013 196 Mar. 31, 2013 172 Apr. 7, 2013 229 Apr. 14, 2013 275 Apr. 21, 2013 213 Apr. 28, 2013 202 May 5, 2013 183 May 12, 2013 240 May 19, 2013 181 May 26, 2013 274 Jun. 2, 2013 290 Jun. 09, 2013 251 Jun. 16, 2013 145 Jun. 23, 2013 123 Jun. 30, 2013 129 Jul. 7, 2013 175 Jul. 14, 2013 149 Jul. 21, 2013 97 Jul. 28, 2013 129 Aug. 4, 2013 114 Aug. 11, 2013 142 Aug. 18, 2013 155 Aug. 25, 2013 79 Sep. 1, 2013 77 Sep. 8, 2013 89 Sep. 15, 2013 133 Sep. 22, 2013 129 Sep. 29, 2013 94 Oct. 06, 2013 123 Oct. 13, 2013 92 Oct. 20, 2013 45 Oct. 27, 2013 45
Weeks of Work While on Claim Footnote 56
Because different WWC rules were in place during 2012/13, the following analysis draws on quarterly rather than annual data to assess aspects of their impact. Table 11 presents analysis of the weeks for which a claimant reported working while on claim. The first row in the table indicates the average number of weeks worked while on claim per month for each quarter of 2011/12 and 2012/13. The second row shows the weeks worked while on claim as a percentage of all weeks; a higher number indicates that more weeks were worked relative to the number of EI benefit weeks paid. The final section of the table displays the distribution of weeks worked based on earnings relative to the benefit rate. For example, in the fourth quarter of 2011/12, in a total of 15.6% of weeks worked while on claim, claimants had earnings that were between 26% and 40% of their weekly EI benefit rate.
| Category | 2011/12 2,3 | 2012/13 1 ,2 ,3 | ||||||
|---|---|---|---|---|---|---|---|---|
| Q1 | Q2 | Q3 | Q4 | Q1 | Q2 | Q3 | Q4 | |
| Average Weeks Worked While on Claim per Month | 958,130 | 837,020 | 800,823 | 901,020 | 900,673 | 768,367 | 711,347 | 731,080 |
| Weeks Worked While on Claim as a Percentage of All Weeks | 18.2 | 16.6 | 16.4 | 16.3 | 18.3 | 15.9 | 14.9 | 13.9 |
| Distribution of WWC - earnings as a percentage of EI benefit rate | ||||||||
| Less than 25%[4] | 6.3 | 6.4 | 6.9 | 8.5 | 6.1 | 5.5 | 4.9 | 6.6 |
| 26% to 40% | 10.3 | 8.8 | 10.7 | 15.6 | 9.8 | 6.9 | 5.8 | 8.1 |
| 41% to 75% | 9.2 | 8.6 | 9.6 | 10.6 | 8.5 | 8.2 | 9.3 | 10.4 |
| 76% to 100% | 5.3 | 5.0 | 5.5 | 5.2 | 4.9 | 5.1 | 6.2 | 6.4 |
| 101% to 125% | 5.9 | 5.3 | 5.8 | 5.3 | 5.4 | 5.7 | 6.9 | 6.9 |
| 126% or more | 63.1 | 66.0 | 61.5 | 54.6 | 65.3 | 68.5 | 66.9 | 61.6 |
- Source: EI administrative data, includes weeks of EI benefits processed in the quarter.
- 1 Data are based on the weeks worked while on claim during this period, regardless of when the claim was established.
- 2 Excludes weeks worked while on claim with missing earnings data, which represent less than 1% of the weeks.
- 3 Excludes any claims that reverted to previous WWC rules ($75 or 40%).
- 4 Percentages with decimals are rounded up or down. For example, if a claimant earned 25.3% of his or her EI benefit in a given week, that week would fall under the 25% or less category.
Since the new WWC pilot has been in effect, there has been an increase in the intensity of work compared to the previous WWC pilot, implying that the average number of days worked while on claim per week has increased. As shown in Table 11, the percentage of claimants with earnings greater than 40% of their weekly benefit rate (the allowable earnings threshold under the previous pilot) increased significantly, from 75.8% to 85.3%, between the fourth quarter of 2011/12 (January to March 2012) and the fourth quarter of 2012/13 (January to March 2013). Conversely, during the same period, the percentage of claimants with earnings less than 40% of their weekly benefit rate decreased from 24.1% to 14.7%. With an increase in work intensity, there could be an associated decline in the overall number of weeks worked, as employers may be less likely to utilize multiple employees to address temporary labour requirements. More specifically, employers may be able to address their temporary labour needs with fewer employees (thus fewer weeks worked while on claim), as they are more readily available to accept all available work under the new rules.
The slight decline in the proportion of weeks worked while on claim in relation to total weeks paid, from 16.3% in the fourth quarter of 2011/12 to 13.9% in the fourth quarter of 2012/13, may also be attributable to the change in the intensity of work when claimants work while on claim.
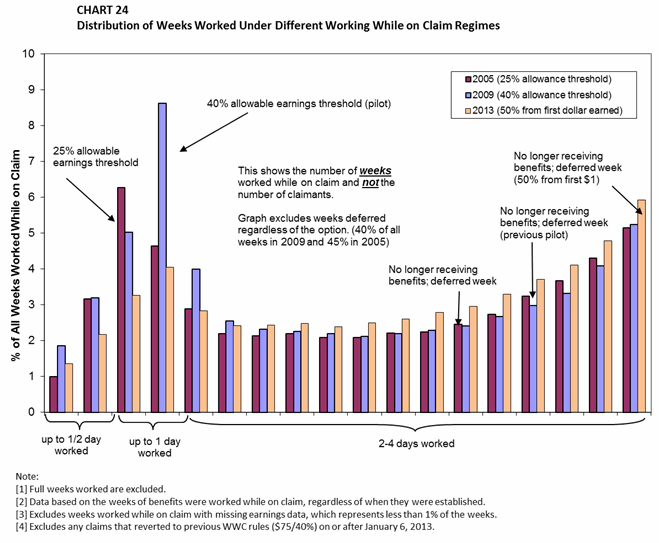
Chart 24 shows the distribution of weeks worked while on claim, in terms of earnings in relation to EI benefit rate, under the three different WWC regimes. In 2005, the legislated 25% earnings allowance was in force. In 2009, the first WWC pilot project—which increased the earnings allowance to 40%—was in force. And in 2013, the current WWC pilot project—which reduces EI benefits by 50% of earnings while the claimant is on claim—was in force.
The 25% and 40% earning allowances did not reduce EI benefits until claimants earned more than those thresholds, after which earnings were deducted from benefits dollar for dollar. This provided a strong incentive to work up to the threshold amount but no incentive to work beyond, as beyond a half-day’s to one day’s work, claimants would receive the same amount in combined EI benefits and earnings from working while on claim, no matter how many extra days they worked. Under the current pilot project, a claimant’s combined EI benefits and earnings from working while on claim rise consistently for every hour of work he or she accepts.
-
Show data table
Chart 24: Distribution of Weeks Worked Under Different Working While on Claim Regimes 2005
(25% allowance threshold)2009
(40% allowance threshold)2013
(50% allowance threshold)0-10 0.98910 1.849 1.35 11-20 3.16619 3.194 2.17 21-30 6.26539 5.013 3.26 31-40 4.63323 8.624 4.05 41-50 2.88404 3.987 2.84 51-60 2.18598 2.550 2.42 61-70 2.12579 2.321 2.43 71-80 2.19647 2.260 2.47 81-90 2.08220 2.200 2.39 91-100 2.07782 2.109 2.50 101-110 2.21123 2.189 2.61 111-120 2.23256 2.283 2.79 121-130 2.45971 2.415 2.96 131-140 2.73483 2.662 3.29 141-150 3.24057 2.978 3.71 151-160 3.66593 3.312 4.10 161-170 4.30300 4.079 4.78 171-180 5.15096 5.243 5.92
Behavioural impacts of the incentives are suggested by the two distinct peaks in the 2005 and 2009 data, where claimants reached the respective thresholds. Chart 24 also illustrates the change in claimant behaviour under the current pilot project; there is now a smoother distribution of weeks worked while on claim, which demonstrates the consistent incentive to accept available work.
Future Monitoring and Assessment Reports will continue to assess the impact of the new WWC pilot project.
5.2 Small Weeks Provision
EI benefits are calculated using earnings in the 26-week period before the establishment of a claim. During that period, weeks with relatively lower earnings could reduce the benefits claimants receive. The objective of the Small Weeks provision is to encourage individuals to accept all available work by excluding weeks of earnings below $225 from the benefit calculation, provided that the number of weeks of earnings exceeds the minimum divisor, Footnote 57 which encourages workers to accept work beyond the minimum required to qualify for EI.
As noted in the 2010 Monitoring and Assessment Report, the Small Weeks provision was tested through multiple pilot projects from 1997 to 2001. Evaluation results Footnote 58 indicated that the provision increased total duration of work in the 26 weeks prior to job separation, and increased the total average income of male and female participants. Based on these evaluation results, Small Weeks was made a permanent provision of the EI program in November 2001. In November 2005, the Best 14 Weeks pilot project replaced the Small Weeks provision in several EI economic regions of high unemployment. The Best 14 Weeks pilot project was renewed from June 26, 2011, to June 23, 2012, and was extended a second time until April 6, 2013. Consequently, the following analysis is based on the EI regions where the Best 14 Weeks pilot project was not in effect. Footnote 59
The Small Weeks provision affected 217,850 of all claims established in 2012/13, or 18.1% of claims in EI regions where the Best 14 Weeks pilot project was not in effect. The average Small Weeks claim received an average of $21 more per week than what would have been received had the provision not been in place, as the average weekly benefit for Small Weeks claims would have been $268, rather than $289.
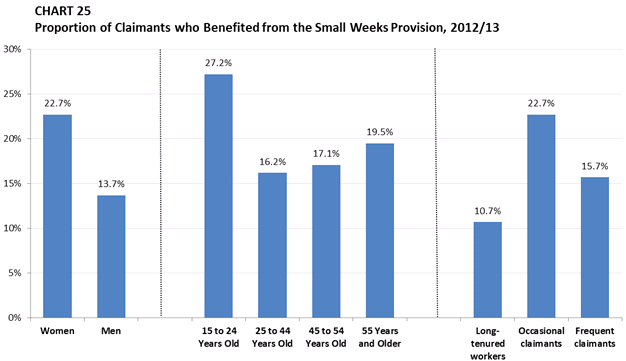
The Small Weeks provision primarily benefits youth, women and occasional claimants, who are proportionally overrepresented in non-standard employment. In 2012/13, it benefited 27.2% of claims made by those aged 15 to 24, 16.2% of claims made by those aged 25 to 44, 17.1% of claims made by those aged 45 to 54, and 19.5% of claims made by older claimants. On a per-claim basis, women were significantly more likely than men to benefit (22.7% vs. 13.7%). Based on EI claimant category, the Small Weeks provision benefited 22.7% of claims made by occasional claimants, 15.7% of claims made by frequent claimants and 10.7% of claims made by long-tenured workers (see Chart 25).
Beginning April 7, 2013, a new legislated Variable Best Weeks approach will be used to calculate weekly EI benefits nationally, as discussed in section 5.5 of this report. As a result, the Small Weeks provision will no longer exist and future reports will not report on it.
-
Show data table
Chart 25 Proportion of Claimants who Benefited from the Small Weeks Provision, 2012/13 2012/13 Women 22.7% Men 13.7% 15 to 24 Years Old 27.2% 25 to 44 Years Old 16.2% 45 to 54 Years Old 17.1% 55 Years and Older 19.5% Long-tenured workers 10.7% Occasional claimants 22.7% Frequent claimants 15.7%
5.3 Minimum Divisor Provision
The EI weekly benefit rate is determined by dividing earnings accumulated during the 26-week period before the establishment of the claim by the greater of the number of weeks the claimant worked in this period or the minimum divisor.
The minimum divisor ranges from 14 to 22 weeks Footnote 60 and is two weeks more than the minimum number of weeks a claimant is required to work Footnote 61 in order to qualify for benefits. The minimum divisor encourages workers to accept all available employment and provides claimants with a strong incentive to work beyond what is required to establish a claim, in order to avoid a reduced weekly benefit. Footnote 62
However, the Minimum Divisor provision did not apply to the 25 EI economic regions that were covered by the Best 14 Weeks pilot project in 2012/13 Footnote 63 , as this pilot project effectively sets the divisor at 14 weeks in the pilot regions by having the best 14 weeks selected from a qualifying period of 52 weeks.
In Budget 2012, the Government of Canada introduced a new method for calculating weekly EI benefits. Based on a new legislated national Variable Best Weeks approach, it became effective on April 7, 2013, as discussed in section 5.5 of this report. As a result, the Minimum Divisor provision no longer exists and future reports will not report on it; instead, the analysis will focus on the new Variable Best Weeks provision.
| Regular Claimants Affected by the Divisor |
Regular Claimants | |
|---|---|---|
| Gender | ||
| Men | $334 | $422 |
| Women | $263 | $359 |
| Age | ||
| Under 25 years | $282 | $362 |
| 25 to 44 years | $320 | $407 |
| 45 to 54 years | $305 | $401 |
| 55 Years and Older | $278 | $386 |
| EI Claimant Category | ||
| Long-Tenured Workers | $317 | $429 |
| Occasional Claimants | $286 | $376 |
| Frequent Claimants | $329 | $412 |
| Canada | $301 | $397 |
In 2012/13, the minimum divisor decreased benefits for 2.5% (21,050) of regular benefit claimants and 3.8% (14,280) of special benefit claimants in the non-pilot regions. Had the Best 14 Weeks pilot project not been in place, the divisor would have affected 4.1% of regular claims and 2.7% of special claims in the pilot project regions. Footnote 64
The minimum divisor was more likely to affect regular EI beneficiaries in the non-pilot regions who were women, older claimants (55 and older), occasional claimants or frequent claimants. Moreover, claimants affected by the divisor received lower average weekly benefits than claimants not affected by the divisor. As shown in Table 12, regular benefit claimants who were affected by the divisor received an average weekly benefit of $301, compared to the national average of $397. Women, older claimants and occasional claimants affected by the divisor received an average of $263, $278, and $286, respectively. In comparison, women, older claimants and occasional claimants who were not affected by the divisor received an average of $359, $386 and $376, respectively.
5.4 Best 14 Weeks Pilot Project
The Best 14 Weeks pilot project tests whether basing claimants’ benefits on their 14 weeks of highest earnings in the 52 weeks before they claim EI encourages claimants to accept all available work. This pilot project effectively replaces the Small Weeks provision in the EI pilot project regions. It also extends the rate calculation period, from 26 weeks preceding the claim to 52 weeks preceding the claim.
The Best 14 Weeks pilot project was introduced in 23 EI economic regions on October 30, 2005. It was re-introduced in 25 EI economic regions in 2008 and renewed several times until April 6, 2013. Administrative data indicate that 351,640 claims received higher weekly benefits due to the Best 14 Weeks pilot project in 2012/13. Over half (56.9%) of all claims in the EI pilot regions in 2012/13 benefited from the pilot project, similar to the proportion in 2011/12 (57.4%). Women were significantly more likely to benefit from the pilot project; 74.3% of claims established by women in the pilot regions benefited from the pilot project compared with 45.4% of claims established by men.
Similarly, young people in the pilot regions were more likely to benefit from the pilot project; 71.6% of claims made by claimants under 25 received a higher weekly benefit, compared with 55.4% of claims made by claimants aged 25 to 44, 55.1% of claims made by claimants aged 45 to 55, and 54.8% of claims made by older workers. Furthermore, on a per-claim basis, occasional claimants (68.0%) were more likely than long-tenured workers (49.0%) and frequent claimants (47.9%) to benefit from the pilot project. An evaluation study Footnote 65 found that women and younger claimants saw the largest increases in their weekly benefit as a result of the pilot project.
Had the pilot project not been in place, the average weekly benefit per claim in 2012/13 would have been $310 instead of $361. Footnote 66
In Budget 2012, the Government of Canada introduced a new method for calculating weekly EI benefits. Based on a new legislated national Variable Best Weeks approach, it became effective on April 7, 2013, as discussed in section 5.5 of this report. Future reports will examine the new rate calculation.
5.5 Variable Best Weeks Provision
Economic Action Plan 2012 included a number of changes to the EI program. One of these changes was a new, national, legislated approach to the way EI benefits are calculated, called the Variable Best Weeks (VBW) provision.
The new approach makes the EI program more responsive to changes in local labour markets and ensures that those living in similar labour market conditions are treated the same way. Footnote 67 It became effective on April 7, 2013. The VBW provision replaces the previous 26-week benefit calculation Footnote 68 established under former legislation in 1996 and marks an end to the Best 14 Weeks pilot project. Footnote 69 The VBW provision applies to all economic regions in Canada and to all benefit types, except self-employed people and claimants receiving fishing benefits. Under the VBW provision, EI claimants’ benefits are calculated based on their highest (best) weeks of insurable earnings during the qualifying period (generally 52 weeks preceding the claim). The number of weeks used to calculate benefit rates ranges from 14 to 22, depending on the EI monthly unemployment rate Footnote 70 in the EI economic region where the claimant lives, as illustrated in Table 13.
| Regional Rate of Unemployment | Number of weeks used for calculating benefit rate |
|---|---|
| 6% or less | 22 |
| 6.1% to 7% | 21 |
| 7.1% to 8% | 20 |
| 8.1% to 9% | 19 |
| 9.1% to 10% | 18 |
| 10.1% to 11% | 17 |
| 11.1% to 12% | 16 |
| 12.1% to 13% | 15 |
| 13.1% or more | 14 |
5.5.1 Measuring the impact of the Variable Best Weeks provision
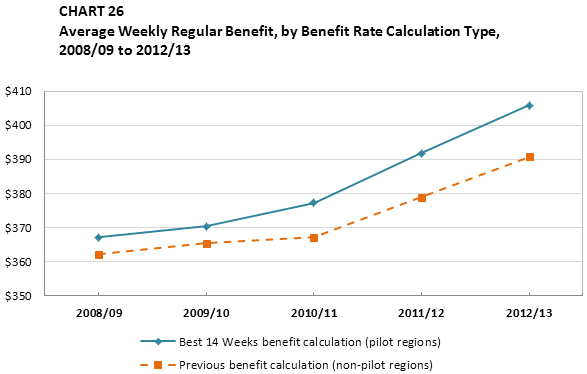
Future EI Monitoring and Assessment Reports will analyse average weekly benefit rates, before and after the implementation of VBW provision. Chart 26 serves as a reference point, comparing average weekly benefit rates between 2008/09 and 2012/13 for the two benefit rate calculation methods—that is, the Best 14 Weeks method for participating pilot regions and the previous 26-week method for non-pilot regions. Future EI Monitoring and Assessment Reports may also use additional measures and indicator to assess the impact of the new VBW provision.
-
Show data table
Chart 26 Average Weekly Regular Benefit, by Benefit Rate Calculation Type, 2008/09 to 2012/13 2007/08 2008/09 2009/10 2010/11 2011/12 2012/13 Best 14 Weeks benefit calculation (pilot regions) $350.1 $367.1 $370.4 $377.3 $391.8 $405.9 Previous benefit calculation (non-pilot regions) $346.7 $362.1 $365.4 $367.2 $378.8 $390.8
Comparing pre-VBW average weekly benefits from 2008/09 to 2012/13 and VBW average weekly benefits for 2013/14 and beyond will provide insight into the impact of the change in benefit calculation methodology. However, factors both internal and external to EI—such as the maximum insurable earnings threshold, growth in wage rates and labour market conditions—may influence EI benefit rates. For this reason, changes to average weekly benefits over the coming years cannot be solely attributed to the VBW provision.
5.6 Benefit Repayment Provision
To better reflect insurance principles, high-earning claimants of regular or fishing benefits who have received at least one week of regular or fishing benefits in the preceding 10 taxation years repay part of the benefits they receive. Footnote 71 In 2011, repeat EI beneficiaries whose net income exceeded $55,250 had to repay the lesser of 30 cents of every dollar in benefits they received or 30 cents for every dollar of net income above the threshold.
For the 2011 taxation year, Footnote 72 176,475 claimants of regular or fishing benefits repaid $212.9 million. The number of claimants who repaid benefits fell by 4.1% and the amount repaid was 1.3% higher than in 2010. On average, claimants repaid $1,206, which is 5.6% higher than the amount repaid in 2010 ($1,142). In 2011, claimants who repaid a portion of their benefits were on claim for an average of 11.8 weeks, which is the same figure as 2010. In 2011, these claimants received $5,093, on average, compared with $4,915 in 2010.
Men continued to comprise the vast majority of claimants who repaid benefits. They accounted for 88.7% of the total in 2011, a share that has remained stable for over a decade. In terms of repayment, on average, women repaid 83.9% of the amount that men repaid ($1,031 compared to $1,229). This proportion decreased compared to 2010 (89.1%), but is higher than the amount registered in 2007 (82.2%).
From 2010 to 2011, the number of men and women who repaid a portion of their benefits decreased by 4.5% and 1.4%, respectively. Between 2010 and 2011, the number of claimants aged 25 and under and aged 55 and older who repaid a portion of their benefits increased (+2.6% and 2.5% respectively), while the number of claimants aged 25-44 and aged 24-54 who repaid a portion of their benefits decreased (-5.5% and -8.4% respectively). Differences in benefit repayment between genders and among age groups reflect differences in pre-claim earnings among members of these groups and their likelihood to be repeat users of EI.
Individuals in the Atlantic provinces who had to repay benefits repaid higher amounts than claimants in the rest of Canada. For instance, claimants in Newfoundland and Labrador who repaid a portion of their benefits were on claim for an average of 17.4 weeks and repaid an average of $1,750, while their counterparts in Ontario had an average claim duration of 10.4 weeks and repaid an average of $1,051. One factor explaining these differences is that repeat users of EI are overrepresented in Atlantic Canada and underrepresented in Ontario and the Western provinces. Another factor is that even high-income EI claimants require more weeks to find a new job in regions of high unemployment, which are more prevalent in Atlantic Canada, than in regions of low unemployment, which are more prevalent in Ontario and the Western provinces.
6. Entitlement to EI Regular Benefits
In 2012/13, the average entitlement to regular benefits decreased slightly from 33.0 weeks in 2011/12 to 32.2 weeks (Table 14). Starting in 2011/12, the average regular benefit entitlement returned to pre-recession levels, i.e. 32.5 weeks in 2006/07. Average entitlement to regular EI benefits was higher from 2008/09 to 2010/11. This was attributable to two factors: automatic adjustments to the EI program, which increased entitlement to regular benefits to reflect higher unemployment rates in local labour markets; and (2) a temporary EI measure that provided 5 additional weeks of regular benefits up to a maximum of 50 weeks (the Extension of EI Regular Benefits measure). Therefore, the return of the average regular entitlement to pre-recession levels in 2012/13 was expected, considering the overall decline in regional unemployment rates and the end of the temporary EI measure.
| Year | Average Regular Entitlement (Weeks) |
Proportion of Average Regular Entitlement Used (%) |
|---|---|---|
| 2002/03 | 32.6 | 61.3 |
| 2003/04 | 32.8 | 60.9 |
| 2004/05 | 33.3 | 59.8 |
| 2005/06 | 32.9 | 59.7 |
| 2006/07 | 32.5 | 59.7 |
| 2007/08 | 31.8 | 60.6 |
| 2008/09 | 36.5 | 59.7 |
| 2009/10 | 42.8 | 58.1 |
| 2010/11 | 36.0 | 62.1 |
| 2011/12 | 33.0 | 62.2 |
| 2012/13 | 32.2 | NA |
- Source: EI administrative data.
Regular benefit claimants have, on average, consistently used between 58% and 62% of their entitlement since 2002/03. This suggests that, despite changes in Canada’s economic performance, the program has responded well to the needs of unemployed workers. After remaining almost unchanged for years, the proportion of entitlement used for claims established in 2010/11 increased by 4.1 percentage points, from 58.1% in 2009/10 to 62.2%. This recent increase is the result of sustained usage levels combined with the recent drop in entitlement levels discussed above. In 2011/12, the proportion of entitlement usage increased slightly from 62.1% to 62.2%.
As in previous periods, the average percentage of EI benefit entitlement used for regular claims established in 2011/12 was highest in the Atlantic provinces, ranging from 65.3% in New Brunswick to 69.7% in Prince Edward Island. Among provinces, claimants in Saskatchewan used the least (57.8%) of the regular benefits to which they were entitled. The entitlement usage in British Columbia (64.3%), Ontario (62.0%) and Quebec (60.6%) was close to the national average of 62.2% in 2011/12.
Historically, women and men have used a similar proportion of their EI entitlement. That was also the case for claims established in 2011/12, when men used an average of 61.7% of their entitlement and women used an average of 62.9%.
Older workers (aged 55 years and older) tend to use more of the regular benefits to which they are entitled. This is due, in part, to the fact that it takes more time for older workers to find a new job, on average, than it does for members of other age groups. In 2011/12, older workers continued to use the highest percentage of their regular benefit entitlement, at 69.2%, compared with 59.7% for youth (aged 15 to 24), 59.9% for claimants aged 25 to 44, and 61.9% for those aged 45 to 54 (see Table 15). In comparison to the previous year, usage among older workers and those aged 45 to 54 years dropped slightly by 0.5 and 0.4 percentage points, respectively, while it rose among youth and those aged 25 to 44 years (+0.8 and +0.1 percentage points, respectively).
As illustrated in Table 15, long-tenured workers tend to use less of their entitlement than occasional and, especially, frequent claimants do Footnote 73 . For claims established in 2011/12, long-tenured claimants used 52.6% of their entitlement, while occasional claimants used 62.9% and frequent claimants used 71.9%. In comparison to the previous year, usage among long-tenured workers declined by 1.2 percentage points, while it rose among occasional and frequent claimants (+0.8 and +0.5 percentage points, respectively). It suggests that these two groups are continuing to use EI for a significant period while finding suitable employment.
Compared with non-seasonal claimants, seasonal claimants tend to use less of their entitlement. As shown in Table 15, in 2011/12, seasonal workers used 59.0% of the benefits to which they were entitled, while non-seasonal claimants used 63.5% of their entitlement. An evaluation study Footnote 74 found that seasonal claimants used, on average, 55.4% of their regular entitlement for claims established in 2009/10 and 56.6% for claims established in 2008/09. In comparison, regular claimants used 58.1% of their entitlement for claims established in 2009/10 and 59.7% for claims established in 2008/09.
| Average Regular Entitlement (Weeks) | Proportion of Average Regular Entitlement Used (%) | |
|---|---|---|
| Canada | 33.0 | 62.2 |
| Gender | ||
| Male | 33.6 | 61.7 |
| Female | 32.2 | 62.9 |
| Age | ||
| Under 25 years | 32.0 | 59.7 |
| 25 - 44 years | 33.1 | 59.9 |
| 45 - 54 years | 33.5 | 61.9 |
| 55 Years and Older | 32.6 | 69.2 |
| Province | ||
| Newfoundland and Labrador | 40.8 | 66.2 |
| Prince Edward Island | 37.2 | 69.7 |
| Nova Scotia | 36.9 | 66.7 |
| New Brunswick | 37.3 | 65.3 |
| Quebec | 32.3 | 60.6 |
| Ontario | 32.4 | 62.0 |
| Manitoba | 30.1 | 60.1 |
| Saskatchewan | 33.2 | 57.8 |
| Alberta | 28.9 | 59.7 |
| British Columbia | 31.5 | 64.3 |
| Nunavut | 43.9 | 63.4 |
| Northwest Territories | 43.3 | 60.8 |
| Yukon | 43.8 | 52.5 |
| EI Claimant Category | ||
| Long-Tenured Workers | 35.4 | 52.6 |
| Occasional Claimants | 31.8 | 62.9 |
| Frequent Claimants | 33.0 | 71.9 |
| Seasonality[1] | ||
| Seasonal Claimants | 32.7 | 59.0 |
| Non-Seasonal Claimants | 33.1 | 63.5 |
- 1 Seasonal claimants are individuals who established three or more claims in the previous five years, of which at least two were established about the same time of the year as their current claim. For the purposes of this table, seasonal claimants exclude fishing claimants.
- Source: EI administrative data.
7. Duration of EI Regular Benefits
On average, regular claimants who established a claim in 2011/12 received 19.9 weeks of regular benefits, a decrease of 1.7 weeks from an average of 21.5 weeks in 2010/11 (Chart 27). This is the second consecutive year of decreases in the average duration of regular claims after two years of increases, and it reflects the reduced availability of weeks due to the automatic adjustment of the program. It also aligns with improved prospects in the labour market; Canada experienced consecutive years of employment increases, with a net gain of 223,000 employment (+1.3%) in 2011/12 and 293,700 employment (+1.7%) in 2010/11.

-
Show data table
Chart 27 Average Duration of Regular Benefits (Weeks) and Employment change (%), Canada, 2006/07 to 2011/12 2006/07 2007/08 2008/09 2009/10 2010/11 2011/12 Duration of regular benefits 18.7 18.7 21.9 23.8 21.5 19.9 Employment change 2.0% 2.3% 0.8% -1.2% 1.7% 1.3%
A recent evaluation study Footnote 75 suggested that the effect of the program’s automatic adjustments to regular entitlement, combined with the Extension of EI Regular Benefits temporary measure, led to an increase of 2.1 weeks in the duration of claims established between March 2008 and September 2010.
The average duration of EI regular benefits declined for all age groups in 2011/12 compared to the previous year. As noted earlier, older workers (aged 55 years and older) tend to collect EI regular benefits for longer periods than members of other age groups do. For claims established in 2011/12, older workers received an average of 22.0 weeks of regular benefits, a decrease of 2.3 weeks from2010/11 and 2.1 weeks more than the national average. In contrast, youth received 18.3 weeks of regular benefits on average in 2011/12, a decrease of 0.8 weeks from2010/11 and 1.6 weeks less than the national average. Those aged 25 to 44 years old received 19.2 weeks on average, while those aged 45 to 54 years old received an average of 20.1 weeks of EI regular benefits (Chart 28).
-
Show data table
Chart 28 Average Duration of EI Regular benefits, by Age and EI Claimant Category, 2011/12 Average Duration of EI Regular Benefits 15 - 24 years 18.3 25 - 44 years 19.2 45 - 54 years 20.1 55 Years and Older 22 Long-Tenured Workers 18.3 Occasional Claimants 19.4 Frequent Claimants 22.8 National duration of regular benefits, 2011/12 19.9
The average duration of EI regular benefits also declined for all EI claimant categories in 2011/12. Long-tenured workers who claimed regular benefits in 2011/12 received an average of 18.3 weeks of regular benefits, a decrease of 3.8 weeks from 2010/11, and 1.6 weeks less than the national average in 2011/12. Frequent claimants received 22.8 weeks on average, a decrease of 0.8 from 23.6 weeks in 2010/11, and 2.9 weeks more than the national average. Occasional claimants received an average of 19.4 weeks a decrease of 1.0 weeks from 2010/11 and 0.5 weeks below the national average.
7.1 Extended EI Benefits Pilot Project
The Extended EI Benefits pilot project was introduced in 2004 for two years in 24 EI economic regions of high unemployment (10% or higher), to test whether providing more weeks of benefits would reduce the number of seasonal workers facing a gap between the exhaustion of their EI benefits and the resumption of their seasonal employment income. It was also designed to determine whether there would be any associated behavioural effects. Under the Extended EI Benefits pilot project, the maximum number of regular weeks of benefits was increased by five weeks, to a maximum of 45 weeks.
The pilot project was re-introduced in 2006 for 18 months in 21 EI economic regions and was later extended until May 31, 2009. The pilot was terminated in February 2009, with the introduction of the Extension of EI Regular Benefits temporary measure, as part of the Economic Action Plan, until September 11, 2010.
The pilot project was then re-introduced, from September 12, 2010, to September 15, 2012, in the same 21 EI economic regions to allow further testing through the period of economic recovery. However the pilot project was allowed to terminate earlier if there was a sustained economic recovery. Consequently, three EI economic regions — St. John’s, Chicoutimi-Jonquiere and Sudbury, where the unemployment rates were less than 8% for 12 consecutive months — were excluded from the Extended EI Benefits pilot project on September 24, 2011, March 24, 2012, and June 23, 2012, respectively.
EI administrative data show that in 2011/12 Footnote 76 , there were 473,930 regular claims established in the 21 pilot regions. Among these regular claims, 31.3% claimants (or 148,320) benefited from the Extended EI Benefits pilot project, and they used an average of 4.2 out of five weeks available to them.
As shown in Table 16, among the 21 pilot regions, the proportion of EI regular claimants who used at least 1 extra week varied widely. For example, in 2011/12, less than 10% of regular claimants in Yukon used at least 1 extra week, while the proportion was 42.8% in St. John’s. Despite the differences in the proportion of EI regular claimants who accessed to the pilot project, the average number of extra weeks used was relatively consistent among the 21 regions, at approximately 4 weeks regardless of the regional unemployment rate.
| Former Pilot Region | Unemployment Rate2 (%) | Total EI Regular Claims in Pilot Region (#) | Claims with at Least 1 Extra Week (#) | Claims with at Least 1 Extra Week | |
|---|---|---|---|---|---|
| Proportion of Regular Claims (%) | Average Extra Weeks Used (# of weeks) | ||||
| Newfoundland and Labrador | |||||
| ST. JOHN'S3 | 6.5 | 4,700 | 2,010 | 42.8% | 4.6 |
| NFLD -- LABRADOR | 17.8 | 57,410 | 15,420 | 26.9% | 4.0 |
| Prince Edward Island | |||||
| Prince Edward Island | 11.6 | 18,590 | 7,540 | 40.6% | 4.3 |
| Nova Scotia | |||||
| Eastern Nova Scotia | 16.3 | 23,600 | 6,090 | 25.8% | 3.9 |
| Western Nova Scotia | 10.0 | 31,550 | 12,040 | 38.2% | 4.2 |
| New Brunswick | |||||
| Madawaska-Charlotte | 11.3 | 13,700 | 4,830 | 35.3% | 4.4 |
| Restigouche-Albert | 15.1 | 41,550 | 11,320 | 27.2% | 3.8 |
| Quebec | |||||
| Gaspésie--Îles-De-La-Madeleine | 13.7 | 26,690 | 10,140 | 38.0% | 4.2 |
| Trois-Rivières | 8.5 | 10,330 | 3,730 | 36.1% | 4.2 |
| Central Quebec | 8.3 | 83,220 | 27,860 | 33.5% | 4.3 |
| North Western Quebec | 9.9 | 21,700 | 7,760 | 35.8% | 4.4 |
| Bas-Saint-Laurent--Côte-Nord | 9.9 | 51,720 | 16,590 | 32.1% | 4.2 |
| Chicoutimi-Jonquière3 | 6.8 | 11,320 | 4,390 | 38.8% | 4.4 |
| Ontario | |||||
| Sudbury3 | 6.6 | 5,800 | 2,070 | 35.7% | 4.3 |
| Northern Ontario | 12.1 | 30,460 | 7,610 | 25.0% | 4.4 |
| Manitoba | |||||
| Northern Manitoba | 28.1 | 7,550 | 1,530 | 20.3% | 4.0 |
| Saskatchewan | |||||
| Northern Saskatchewan | 17.8 | 10,490 | 1,500 | 14.3% | 4.1 |
| British Columbia | |||||
| Northern British Columbia | 11.2 | 18,780 | 5,080 | 27.1% | 4.3 |
| Territories | |||||
| Yukon | 25.0 | 2,090 | 200 | 9.6% | 3.9 |
| Northwest Territories | 25.0 | 1,750 | 420 | 24.0% | 4.0 |
| Nunavut | 25.0 | 930 | 190 | 20.4% | 4.3 |
| Pilot Regions | NA | 473,930 | 148,320 | 31.3% | 4.2 |
- 1 Data and analysis on the Extended EI Benefits pilot project are undertaken by examining claims established in 2011/12 to ensure all claims were completed.
- 2 The unemployment rate is an annual average of a 3-month moving average of seasonally adjusted data.
- 3 The Extended EI Benefits pilot project ended in St. John’s, Chicoutimi-Jonquiere and Sudbury, on September 24, 2011, March 24, 2012, and June 23, 2012, respectively.
Table 17 shows the demographic distribution of total regular claims and the distribution of EI claimants who benefited from the pilot project in 2011/12. Women, workers aged 55 years and older and frequent claimants were overrepresented among pilot project beneficiaries in 2011/12, while men, core-aged workers (25 to 54 years) and long-tenured workers were underrepresented. For example, in 2011/12 women accounted for 42.5% of regular claimants who used at least one extra week provided by the pilot project, while they represented 36.8% of regular claims established in the 21 pilot regions.
| Claimants with at Least 1 Extra Week | Distribution of Claimants with at Least 1 Extra Week | Distribution of Regular Claims in Pilot Regions | |
|---|---|---|---|
| Total | 148,320 | 100.0% | 100.0% |
| Gender | |||
| Men | 85,320 | 57.5% | 63.2% |
| Women | 63,000 | 42.5% | 36.8% |
| Age | |||
| Under 25 years | 15,950 | 10.8% | 10.3% |
| 25 - 44 years | 53,610 | 36.1% | 39.5% |
| 45 - 54 years | 37,520 | 25.3% | 27.2% |
| 55 Years and Older | 41,240 | 27.8% | 23.0% |
| EI Claimant Category | |||
| Long-Tenured Workers | 11,300 | 7.6% | 15.5% |
| Occasional Claimants | 63,260 | 42.7% | 41.9% |
| Frequent Claimants | 73,760 | 49.7% | 42.6% |
| Seasonality2 | |||
| Seasonal Claimants | 63,270 | 42.7% | 44.2% |
| Non-Seasonal Claimants | 85,050 | 57.3% | 55.8% |
- Source: EI administrative data.
- 1 Data and analysis on the Extended EI Benefits pilot project are undertaken by examining claims established in 2011/12 to ensure all claims were completed.
- 2 Seasonal claimants are individuals who established three or more claims in the previous five years, of which at least two were established about the same time of the year as their current claim.
Workers aged 55 years and older represented 27.8% of claimants who benefited from the pilot project, higher than their share of regular claims (23.0%). However, core-aged workers represented 61.4% of claimants who used at least one extra week, lower than their share (66.7%) of regular claims. This indicates that older workers were overrepresented among pilot project beneficiaries and core-aged workers were underrepresented. Youth represented 10.8% of claimants who used at least one extra week, which is comparable to the percentage of regular claims filed by them (10.3%) in 2011/12.
In 2011/12, long-tenured workers accounted for 7.6% of claimants who benefited from the pilot project, 7.9 percentage points lower than their share (15.5%) of regular claims. This suggests that long-tenured workers were significantly underrepresented among pilot project beneficiaries. In contrast, frequent claimants were overrepresented, as they accounted for 49.7% of claimants who used at least one extra week, higher (+7.1 percentage points) than their share of regular claims (42.6%). Occasional claimants represented 42.7% of claimants who used at least one extra week, comparable to the percentage of regular claims they filed (41.9%).
In 2011/12, among all regular claimants (148,320) who used at least one extra week provided by the pilot project, more than half of them (57.3% or 85,050) were non-seasonal claimants, while 42.7% (or 63,270) were seasonal claimants.
As of March 31, 2013, a total of $371.8 million in additional benefits were paid as a result of the Extended EI Benefits pilot project. Only $2.6 million in additional benefits were paid in 2010/11, as the pilot project began in September 2010 and claimants needed to exhaust their regular entitlement to receive benefit payments from this pilot project. There were $170.2 million and $199.0 million in additional benefits paid in 2011/12 and 2012/13, respectively.
8. Exhaustion of EI Regular Benefits
The aim of monitoring exhaustees is to determine whether EI provides adequate temporary income support to those looking for suitable employment. Historically, analysis of exhaustion of regular benefits was based on claimants who used all the regular weeks to which they were entitled.
Analysis of regular benefits exhaustion has been expanded to also consider claims for which the benefit period ends before all potential regular benefit weeks of entitlement are paid. Footnote 77 As a result, the analysis of exhaustees comprises two groups—claims for which all eligible regular weeks are paid (entitlement exhaustees) and claims that reach the final week of the benefit period before all eligible regular benefits are paid (benefit period exhaustees).
In addition, the analysis of regular benefits exhaustion takes into consideration claimants who requalify for a new EI claim following the exhaustion of their claim. Footnote 78 This type of claimants experiences a relatively short, if any, interruption in EI benefits. Information on these claimants is presented as requalification rates.
In previous reports, analysis of exhaustees was done by examining claims established in a given fiscal year, which resulted in figures being delayed by up to two years. Analysis in this report is based on regular claims completed Footnote 79 in 2012/13, which facilitates more timely analysis and reporting of exhaustion rates. Of claims completed in 2012/13, roughly two thirds were established in 2011/12 and the remaining third were established in 2012/13. Consequently, exhaustion rates should not be compared with figures presented for claims established in a given fiscal year, as reported in previous reports. As shown in Table 18, the 2011/12 entitlement exhaustion rate is similar for both methodologies (claims established in a given year, claims completed in a given year); however, the differences are more significant in 2009/10 and 2010/11.
| 2012/13 | 2011/12 | 2010/11 | 2009/10 | |
|---|---|---|---|---|
| Established Claims | N/A1 | 30.9% | 29.4% | 24.8% |
| Completed Claims | 32.6% | 32.9% | 26.8% | 30.5% |
- 1 Data and analysis on entitlement exhaustion rate for established claims are available for 2011/12 to ensure all claims were completed
8.1 Entitlement Exhaustion of EI Regular Benefits
Of all regular claims completed in 2012/13, nearly one third (32.6%) of claimants exhausted their regular benefits. This represents a decrease of 0.3 percentage point compared to claims completed in 2011/12 (32.9%), but an increase of 5.8 percentage points compared to 2010/11 (26.8%). The lower rate of exhaustion for claims completed in 2010/11 is due to two factors: longer entitlement resulting from automatic adjustments to entitlement levels, linked to higher unemployment rates during the recession and subsequent recovery; and the EI temporary measures extending regular benefits introduced under the Economic Action Plan. Footnote 80
Of claimants exhausting their EI regular entitlement in 2012/13, those able to establish a subsequent claim accounted for 7.8%. Taking these re-qualifiers into considerations means that 30.1% of regular claimants exhausted their entitlement and were unable to establish a new claim.
-
Show data table
Chart 29 Exhaustion Rate and Exhaustees, 2009/10 to 2012/13 2009/10 2010/11 2011/12 2012/13 Entitlement Exhaustion Rate 30.5% 26.8% 32.9% 32.6% Benefit Period Exhaustion Rate 18.1% 25.3% 27.0% 24.1% Entitlement Exhaustees 498 421 463 458 Benefit Period Exhaustees 297 409 381 343
8.1.1 Entitlement Exhaustion by Demographics
While the national entitlement exhaustion rate remained relatively stable in 2012/13, rates varied within provincial and demographic groups. Entitlement exhaustion rates generally increased in the Atlantic provinces and Quebec while they decreased in Ontario and the Western provinces. British Columbia exhibited the highest entitlement exhaustion rate (37.4%) while New Brunswick exhibited the lowest rate (26.5%). The Atlantic provinces and Quebec exhibited the highest requalification rates at over 10%, while rates were below 6% in Ontario and the Western provinces. Table 19 presents entitlement exhaustion rates by various demographic groups for 2012/13 .
The Extended EI Benefits pilot project, ended in September 2012. It still affected entitlement exhaustion rates in 2012/13, as more than 90% of completed claims in the pilot regions, mainly in Atlantic Canada, were still eligible for the additional weeks. Refer to subsection 7.1 of section II of this chapter for further analysis of the Extended EI Benefit pilot project.
Men have lower entitlement exhaustion rates then women, because women, on average, accumulate fewer insurable hours and so have shorter regular benefit entitlements. Claimants aged 55 and older tend to have the highest entitlement exhaustion rate, which is likely attributable to the challenges they face in securing new employment following a job loss.
The likelihood of entitlement exhaustion varies for different categories of EI claimants. For claims completed in 2012/13, occasional claimants (35.4%) had a significantly higher exhaustion rate than frequent claimants (31.8%) and long-tenured workers (27.4%), as shown in Table 19. However, one in five frequent claimants who exhausted their entitlement were able to re-qualify for a new EI claim.
| Demographics | Entitlement Exhaustion Rate | Benefit Period Exhaustion Rate | ||||
|---|---|---|---|---|---|---|
| 2012/13 | 2011/12 | 2010/11 | 2012/13 | 2011/12 | 2010/11 | |
| Province/Territory | ||||||
| Newfoundland and Labrador | 27.0 | 26.0 | 24.1 | 43.4 | 45.9 | 41.2 |
| Prince Edward Island | 35.3 | 31.9 | 26.8 | 31.8 | 33.1 | 30.1 |
| Nova Scotia | 32.9 | 32.1 | 28.0 | 30.2 | 31.6 | 29.7 |
| New Brunswick | 26.5 | 28.5 | 25.2 | 41.0 | 40.8 | 37.3 |
| Quebec | 30.7 | 30.0 | 24.2 | 27.8 | 30.4 | 29.5 |
| Ontario | 35.3 | 36.1 | 27.3 | 17.9 | 22.6 | 20.7 |
| Manitoba | 31.8 | 32.5 | 27.0 | 17.4 | 19.1 | 19.7 |
| Saskatchewan | 26.9 | 28.6 | 25.1 | 18.7 | 20.4 | 19.4 |
| Alberta | 32.8 | 35.6 | 28.7 | 13.5 | 16.4 | 15.3 |
| British Columbia | 37.4 | 37.8 | 32.2 | 18.3 | 20.6 | 22.0 |
| Nunavut | 36.7 | 29.9 | 23.5 | 25.8 | 33.9 | 24.2 |
| Northwest Territories | 32.7 | 26.5 | 26.4 | 27.1 | 31.4 | 28.3 |
| Yukon | 15.2 | 13.7 | 12.3 | 32.0 | 27.9 | 30.3 |
| Gender | ||||||
| Men | 30.4 | 31.1 | 25.0 | 26.1 | 28.3 | 26.7 |
| Women | 35.9 | 35.6 | 29.5 | 21.1 | 24.9 | 23.0 |
| Age | ||||||
| Under 25 | 31.4 | 30.9 | 27.5 | 19.0 | 18.6 | 19.3 |
| 25 to 44 | 30.9 | 31.6 | 25.9 | 21.6 | 23.6 | 22.7 |
| 45 to 54 | 31.3 | 31.1 | 24.7 | 27.6 | 32.4 | 29.1 |
| 55 or Older | 38.7 | 39.5 | 31.5 | 28.0 | 33.2 | 30.5 |
| EI Claimant Category | ||||||
| Long-Tenured Worker | 27.4 | 29.8 | 19.0 | 19.7 | 27.9 | 24.3 |
| Occasional Claimants | 35.4 | 35.6 | 31.2 | 19.6 | 20.4 | 20.5 |
| Frequent Claimants | 31.8 | 29.4 | 25.2 | 39.5 | 40.0 | 39.7 |
| Seasonality[1} | ||||||
| Seasonal | 22.0 | 21.0 | 16.7 | 37.2 | 38.8 | 35.8 |
| Non-Seasonal | 37.1 | 37.5 | 30.3 | 18.7 | 22.5 | 21.6 |
| Canada | 32.6 | 32.9 | 26.8 | 24.1 | 27.0 | 25.3 |
- 1 Seasonal claimants are individuals who established three or more claims in the previous five years, of which at least two were established about the same time of the year as their current claim.
8.1.2 Entitlement Exhaustion by the Variable Entrance Requirement
The variation in entitlement exhaustion rates is negatively correlated with regular benefits entitlement, which is a function of both the number of insurable hours accumulated and the regional unemployment rate. Footnote 81
As illustrated in Table 20, entitlement exhaustion rates decrease significantly as the number of accumulated insurable hours increases. For instance, 58.7% of claimants with 420 to 769 hours in 2012/13 exhausted their entitlement, compared to 21.7% of claimants with 1,470 to 1,819 hours. The entitlement exhaustion rate for claimants with more than 1,820 hours was slightly higher (25.8%), likely because those with more than 1,820 hours face a more significant job loss shock. These claimants may be long-tenured workers facing more significant challenges in finding new employment.
Table 20 also shows that entitlement exhaustion rates vary significantly based on the regional unemployment rate. For instance, for regular claims completed in 2012/13 , claimants in regions with an unemployment rate of 10.0% or lower were more likely to have entitlement exhaustion rates of 30% or higher while claimants in regions with an unemployment rate of 12.1% or higher had entitlement exhaustion rates below 25%.
Analyzing cross-sectional entitlement exhaustion rates by insurable hours and unemployment rates amplifies the variance. For instance, the entitlement exhaustion rate for claimants with less than 769 insurable hours in region where the unemployment rate was 10.0% or lower was above 60% in 2012/13. In comparison, claimants in regions where the unemployment rate was between 12.1% and 16.0% and with 1,120 to 1,469 insurable hours had an entitlement exhaustion rate of 10.3%.
The rate at which claimants who exhausted their entitlement but established a subsequent claim — the requalification rate — varied significantly. For instance, 15.6% of claimants who exhausted their entitlement with less than 769 insurable hours directly established a subsequent claim. In comparison, claimants who established a claim with more than 1,470 hours of insurable employment were far less likely (less than 2%) to establish a subsequent claim soon after exhausting their entitlement. Similarly, nearly 20% of claimants who established a claim in a region with an unemployment rate of 12.1% or more established a near subsequent claim, versus around 7% of claimants who established a claim in a region with an unemployment rate of 10.0% or lower.
| Number of Hours of Insurable Employment | Regional Unemployment Rate (%) | Average | ||||
|---|---|---|---|---|---|---|
| 0.1 to 8.0 | 8.1 to 10.0 | 10.1 to 12.0 | 12.1 to 16.0 | 16.1+ | ||
| 420 to 769 | 62.0 | 68.0 | 61.2 | 52.8 | 42.2 | 58.7 |
| 770 to 1119 | 54.4 | 49.2 | 35.9 | 19.9 | 20.0 | 45.4 |
| 1120 to 1469 | 32.8 | 26.3 | 19.6 | 10.3 | 13.8 | 26.8 |
| 1470 to 1819 | 24.1 | 22.0 | 14.9 | 11.7 | 16.2 | 21.7 |
| 1820 or more | 27.5 | 27.2 | 19.4 | 13.8 | 16.8 | 25.8 |
| Average | 35.1 | 33.8 | 28.6 | 23.9 | 23.6 | 32.6 |
8.1.3 Entitlement Exhaustion of EI Regular Benefits – Seasonal Claimants and Seasonal Gappers
Historically, exhaustion rates have always been lower for seasonal claimants than for non-seasonal claimants. That held true for claims completed in 2012/13, as 22.0% of seasonal claimants used all the weeks of regular benefits to which they were entitled while the exhaustion rate was nearly double (37.1%) for non-seasonal claimants.
The variance in exhaustion rates between seasonal and non-seasonal regular claimants is due to the fact that when seasonal claimants are laid off, most have a job lined up for the next season and will return to work at approximately the same time the following year. However, most non-seasonal regular claimants have to look for work once they are laid off, thus they are more likely to rely on EI for longer periods and exhaust their benefit entitlement.
The level of entitlement and duration of regular benefits have a particular impact on seasonal claimants who have a combined work-benefit period of less than 52 weeks per year. This group of claimants is referred to as “seasonal gappers.” These workers may go through a period where neither work income nor EI is available to them, if the seasonal job to which they are returning is not yet available when they exhaust their EI benefits.
Among people who completed claims in 2012/13 , there were 13,360 seasonal gappers, representing less than 1% of all regular claimants who completed a claim in 2012/13 . The number of seasonal gappers has been moving upward since the historical low of 6,790 in 2009/10 . Seasonal gappers who completed claims in 2012/13 averaged 18.4 weeks of work and 27.1 weeks of EI benefits, including the waiting period, resulting in an average gap of 6.5 weeks, which is equivalent to the average gap experienced for claims completed in 2011/12 . Nearly half (49.3%) of seasonal gappers experienced a gap of 5 weeks or less, 30.8% a gap of 6 to 11 weeks and 19.9% a gap of 12 weeks or more.
As mentioned in previous reports, the likelihood of becoming a seasonal gapper is higher in regions of high unemployment, where claimants require fewer hours to qualify for benefits, and there can be extended periods of unemployment between seasons. Quebec (43.2%) and the Atlantic provinces (17.8%) are overrepresented in regard to seasonal gappers; they accounted for 61.0% of seasonal gappers in 2012/13 , while representing 32.4% and 16.1% of all regular claims completed in 2012/13 , respectively. In the same period, Ontario accounted for a large proportion of seasonal gappers (18.7%), but was actually underrepresented, as Ontario accounted for 29.1% of regular claims.
8.2 Benefit Period Exhaustion of EI Regular Benefits
Among all regular claims completed in 2012/13, 24.1% of claimants exhausted their benefit period before receiving their full entitlement to regular benefits. This is a decrease from the proportions in 2011/12 (27.0%) and 2010/2011 (25.3%). Benefit period exhaustion is influenced by variables affecting the duration of an EI claim, such as regular benefit entitlement, weeks worked while on claim and usage of special benefits. The relationship between these factors and the exhaustion of the benefit period is examined in further detail in sub-section 8.2.4
8.2.1 Benefit Period Exhaustion by Demographics
As stated previously, benefit period exhaustion refers to claims that reach the final week of the benefit period before all eligible regular benefits are paid. All provinces and territories (except New Brunswick and Yukon) and most demographic groups (except claimants under 25 years old) experienced a decrease in benefit period exhaustion rates for regular claims completed in 2012/13 compared with the previous year, as shown in Table 19 in subsection 8.1.1. Among provinces, Newfoundland and Labrador exhibited the highest benefit period exhaustion rate (43.4%), while Alberta exhibited the lowest rate (13.5%).
Men tend to have higher benefit period exhaustion rates than women, as they are generally entitled to more weeks of regular benefits and are more likely to work while on claim and to defer EI benefits. Claimants aged 45 and older tend to have a higher benefit period exhaustion rate than younger claimants.
The likelihood of exhausting the benefit period before full entitlement was paid varies greatly for different categories of EI claims history. For claims completed in 2012/13 , 19.6% of occasional claimants and 19.7% of long-tenured workers exhausted their benefit period, while 39.5% of frequent claimants exhausted their benefit period as shown in Table 19.
Although the average duration of regular benefits for seasonal claimants is shorter than that for non-seasonal claimants, 37.2% of seasonal claimants exhausted their benefit period in 2012/13 compared to 18.7% of non-seasonal claimants. The benefit period exhaustion rate for seasonal claimants remained stable for three years after it increased from 25.4% in 2009/10 to 35.8% the next year. The stability of variables affecting the duration of a claim over that period, such as the number of regular weeks claimed or the number of weeks worked while on claim, suggests that seasonal claimants had a higher propensity to accumulate insurable hours working while off-claim Footnote 82 and to exhaust their benefit period since 2010/11.
8.2.2 Benefit Period Exhaustion by the Variable Entrance Requirement
As illustrated in Table 21, benefit period exhaustion rates are moderately correlated with the number of insurable hours. For instance, claimants who accumulated between 420 and 769 hours in 2012/13 experienced an 18.5% benefit period exhaustion rate, compared to roughly 27% of claimants who accumulated between 1,120 and 1,819 hours, and 22.7% of claimants with more than 1,820 hours.
| Number of Hours of Insurable Employment | Regional Unemployment Rate (%) | Average | ||||
|---|---|---|---|---|---|---|
| 0.1 to 8.0 | 8.1 to 10.0 | 10.1 to 12.0 | 12.1 to 16.0 | 16.1+ | ||
| 420 to 769 | 8.1 | 11.6 | 12.9 | 29.7 | 34.8 | 18.5 |
| 770 to 1119 | 11.3 | 19.4 | 27.0 | 50.7 | 48.7 | 22.2 |
| 1120 to 1469 | 19.1 | 27.9 | 33.1 | 48.8 | 46.3 | 27.2 |
| 1470 to 1819 | 22.2 | 27.2 | 35.6 | 43.5 | 39.1 | 27.1 |
| 1820 or more | 18.9 | 21.4 | 32.6 | 38.7 | 38.2 | 22.7 |
| Average | 17.6 | 23.0 | 29.1 | 42.5 | 41.6 | 24.1 |
Benefit period exhaustion rates vary more significantly by unemployment rates than by insurable hours. For claims completed in 2012/13 , claimants from regions with an unemployment rate of 8.0% or lower experienced an average exhaustion rate of less than 20%, while claimants in regions with unemployment rates of 12.1% or higher faced average benefit period exhaustion rates twice as high at around 40%.
Higher benefit period exhaustion rates in regions with high unemployment rate reflects a greater proportion of claimants living in these regions worked while on claim. While approximately 55% of all regular claimants worked while on claim, the figure was significantly higher (65%) for claimants residing in regions with an unemployment rate over 10.1%. As outlined in subsection 4.1 of section II of this chapter, claimants who work while on claim and have sufficient earnings can defer their week of EI benefits to a future week within the same benefit period.
8.2.3 Benefit Period Exhaustion and Requalification Rates
Compared to entitlement exhaustees whose requalification rate was around 8% in 2012/13, benefit period exhaustees had an average requalification rate of 67.7%, as shown in Table 22. The requalification rate increased from 61.5% in 2011/12 and 57.6% in 2010/11. When considering these re-qualifiers, 7.8% of regular claimants who exhausted their benefit period did not establish a new claim in 2012/13. Requalification rates vary by demographic, as nearly 85% of frequent claimants and seasonal claimants who exhausted their benefit period re-qualified for a new EI claim, in comparison to 53% of long-tenured workers.
Moreover, as shown in Table 22, benefit period exhaustees who had accumulated more insurable hours and/or who lived in a region with a lower unemployment rate were less likely to requalify for a new EI claim.
| Number of Hours of Insurable Employment | Regional Unemployment Rate (%) | Average | ||||
|---|---|---|---|---|---|---|
| 0.1 to 8.0 | 8.1 to 10.0 | 10.1 to 12.0 | 12.1 to 16.0 | 16.1+ | ||
| 420 to 769 | 64.0 | 63.4 | 68.8 | 80.0 | 83.0 | 75.2 |
| 770 to 1119 | 68.3 | 77.1 | 73.7 | 82.8 | 80.6 | 76.9 |
| 1120 to 1469 | 73.8 | 76.4 | 70.7 | 80.5 | 76.8 | 75.6 |
| 1470 to 1819 | 64.2 | 64.9 | 58.0 | 73.9 | 72.7 | 65.2 |
| 1820 or more | 47.5 | 47.4 | 52.3 | 62.3 | 64.3 | 50.4 |
| Average | 62.4 | 66.4 | 64.3 | 77.7 | 76.9 | 67.7 |
8.2.4 Profile of Claimants by Exhaustion Type
As stated previously, approximately two thirds of benefit period exhaustees re-qualified for a new EI claim in 2012/13. To do so, these claimants had to accumulate sufficient insurable hours during their qualifying period, which corresponded to the benefit period that they exhausted. As reported in subsection 4.1 of section II of this chapter, approximately 54% of regular claimants worked while on claim. However, nearly three-quarters of benefit period exhaustees worked while on claim and they averaged 18.5 weeks of work. The extent to which claimants work while on claim is under-reported, as some claimants opt to suspend their EI claim rather than report their work and earnings bi-weekly. This is referred to as working off-claim.
On average in 2012/13, non-exhaustees used 13.2 weeks of regular benefits, while entitlement exhaustees used 28.9 weeks. Benefit period exhaustees used 20.1 weeks of regular benefits, a figure that was comparable to that for all regular claimants (19.9 weeks).
Of all benefit period exhaustees, 16.1% received special benefits in 2012/13, a figure that was significantly higher than that for non-exhaustees (9.0%). This variance can be explained by the fact that when special benefits are combined with regular benefits, the probability of reaching the 52 weeks benefit period threshold is increased.
Working while on claim and receiving special benefits influence the benefit period exhaustion rate, since they lengthen claim duration. Those who used special benefits were far less likely to requalify for a new EI claim. For instance, a third of benefit period exhaustees who claimed special benefits re-qualified for a new claim in 2012/13.
By definition, entitlement exhaustees use all of their regular entitlement. In 2012/13, on average, non-exhaustees used 40.1% of their regular benefits entitlement with 62.1% of claimants using less than 50% of their regular benefit entitlement. In comparison, benefit period exhaustees used 57.1% of their regular benefits entitlement, with 33.0% of claimants using at least 75% of their regular benefits entitlement.
| All Regular Claims | Non-Exhaustees | Entitlement Exhaustees | Benefit Period Exhaustees | |
|---|---|---|---|---|
| Exhaustion rate | N/A1 | N/A1 | 32.6% | 24.1% |
| Gap to next claim | ||||
| Re-qualifiers (new claim) | 18.8% | 1.1% | 7.8% | 67.7% |
| Non re-qualifiers (no new claim) | 81.2% | 98.9% | 92.2% | 32.3% |
| Adjusted exhaustion rate | N/A1 | N/A1 | 30.1% | 7.8% |
| Worked while on claim | 54.3% | 54.5% | 37.4% | 76.2% |
| Average weeks working while on claim | 12.6 | 9.2 | 12.2 | 18.5 |
| Average weeks of regular benefits paid | 19.9 | 13.2 | 28.9 | 20.1 |
| Mixed claims (use of special benefits) | 10.9% | 9.0% | 9.9% | 16.1% |
| Percentage of EI entitlement used | ||||
| <25% | 18.6% | 33.8% | 13.9% | |
| 25% to <50% | 18.5% | 28.3% | 24.1% | |
| 50% to <75% | 15.7% | 19.3% | 28.9% | |
| 75% to 100% Averaged entitlement used | 47.2% 62.3% |
18.5% 40.1% |
100.0% 100.0%2 |
33.0% 57.1% |
- 1 By definition, exhaustion rates are only applicable for exhaustees populations (entitlement and benefit period exhaustees).
- 2 By definition, entitlement exhaustees have used all their regular benefits entitlement.
8.3 Aggregated Exhaustion of EI Regular Benefits
The aggregated exhaustion of EI regular benefits reflects all claims for which the claimants ceased to receive EI regular benefits payments because all entitlement was paid up or because the benefit period exhausted. In 2012/13, the aggregated exhaustion rate was 56.7%, which compares to 59.9% in 2011/12. The requalification rate for all exhaustees combined was 33.4%. As a result, taking claimants that are able to requalify for EI into consideration, the aggregate rate of exhaustion declines to 37.9%.
9. Connecting Canadians to Available Jobs (CCAJ) Provision
As part of Canada’s Economic Action Plan 2012, the Connecting Canadians to Available Jobs (CCAJ) initiative assists EI beneficiaries in returning to work as quickly as possible. The CCAJ initiative came into force on January 6, 2013, and comprises the following four measures:
- Enhancements to Job Alerts and labour market information to support job-search activities;
- Legislative changes and new integrity measures to strengthen claimants’ obligations to undertake a “reasonable job search” for “suitable employment” Footnote 83 ;
- Improved connections between the Temporary Foreign Worker Program (TFWP) and the EI program to ensure Canadians are considered before temporary foreign workers; and
- Collaboration projects signed with British Columbia and Manitoba to make employment supports available to EI claimants earlier in their claim.
9.1 Enhanced Job Alerts (EJA)
EI claimants may, on a voluntary basis, sign up to receive daily Job Alerts, which include job postings and other labour market information. An enhanced Job Alerts system, which incorporates job postings from private sector job boards, provides a more comprehensive list of available jobs in an individual’s chosen occupation(s) and community(ies). Claimants will also receive additional information, such as other occupations for which they may be qualified, that can help them decide how and when to expand their job search. The EJA system is also available to individuals who are not EI claimants, but are interested in receiving job postings.
In addition to this Job Alerts service, there are other on-line tools such as the Working in Canada (WiC) website that provides valuable labour market information to help unemployed or underemployed individuals in making career decisions.
From January 6 to March 31, 2013, there were 2.1 million job alerts sent to 35,511 subscribers. In addition, 61,417 employers created 243,949 new job postings that were available through the WiC web site. As more data become available, future EI Monitoring and Assessment Report(s) will provide a more comprehensive analysis.
9.2 EI Claimants’ Responsibilities
New EI Regulations clarified the responsibilities of EI claimants Footnote 84 by defining reasonable job search and suitable employment. Claimants are required to undertake a reasonable job search for suitable employment in their region, and are not required to move or relocate to where jobs are available in order to remain eligible for EI benefits. The criteria used to define reasonable job search are: job search activities; intensity of job search; type of work being sought; and evidence of job search efforts. The criteria used to define suitable employment are: type of work; wages; commuting time, working conditions; and, hours of work and personal circumstances. Requirements regarding the type of work and wages vary based on the claimant’s category. Footnote 85 For more information regarding the national distribution of the regular claims by EI claimant category, please refer to section 1.5 of Chapter 2.
Claimant Information (CI) sessions
Starting in February 2013, after the new EI Regulations were in place, Claimant Information (CI) sessions became tailored to each of the three EI claimant groups: frequent claimants, occasional claimants and long-tenured workers. Moreover, claimants directed to CI sessions are identified using standardized filtering criteria and job-demand in their previous occupation.
A department assessment is currently underway to examine the impact of the revamped CI sessions in connecting EI claimants with available jobs. The evaluation will compare claimants who are directed to information sessions to a random sample of claimants with similar attributes who are not directed to information sessions (e.g., control group). Indicators such as the average duration of regular benefit will be compared. Preliminary results of the evaluation will be provided in future EI Monitoring and Assessment Reports.
9.3 Collaborations with Provinces and Territories
The Government has been collaborating with the provinces of British Columbia and Manitoba during the 2013/14 to proactively provide employment supports to EI clients earlier in their claim period. Collaboration projects have been using existing authorities and funding from the Labour Market Development Agreements (LMDAs) in these provinces to test approaches for early interventions to support faster returns to work. An assessment of the collaboration projects will be available in fall 2014.
10. Income Redistribution of EI Regular Benefits
In a similar manner to the analysis of income redistribution for total EI income benefits, this report also examines the income redistribution of EI regular benefits. The amount of total regular benefits payments that each province or territory, industry, and demographic group received was divided by the total amount of EI premiums collected. These ratios were then adjusted so that the ratio for Canada equalled 1.0. Footnote 86 The resulting ratio for each jurisdiction indicates whether it received more in benefits than it contributed to the program, relative to Canada as a whole.
10.1 EI Regular Benefits-to-Contributions (B/C) Ratios, by Province and Territory Footnote 87
The Atlantic provinces and Quebec Footnote 88 continued to be net beneficiaries of regular benefits from the EI program in 2011, as they were in previous years, with adjusted ratios greater than 1.0, while Ontario and the Western provinces remained net contributors, with adjusted ratios below 1.0 (see Chart 30). Footnote 89 Generally, provinces with higher regular benefits-to-contributions ratios also have higher unemployment rates. In 2011, the Atlantic provinces had the highest unemployment rates in the country, while rates were lower in the Western provinces due to the region’s strong economic performance.
-
Show data table
Chart 30 Adjusted Regular Benefits-to-Contributions (B/C) Ratio and Unemployment Rate, by Province, 2011 Nfld. P.E.I. N.S. N.B. Que. Ont. Man. Sask. Alta. B.C. Adjusted Regular B/C ratio 4.1 3.5 2.0 2.6 1.2 0.7 0.6 0.6 0.5 0.9 Unemployment Rate (Canada = 7.5%) 12.7% 11.4% 8.8% 9.5% 7.8% 7.8% 5.4% 5.0% 5.4% 7.5%
10.2 EI Regular Benefits-to-Contributions Ratios, by Sector and Industry
In 2011, the goods sector was a net beneficiary of regular benefits from the EI program, with an adjusted regular benefits-to-contributions (B/C) ratio of 1.8, while the service sector was a net contributor of regular benefits, with an adjusted ratio of 0.8. As described in Chapter 1, in 2012/13, the goods sector comprised 36.3% of all EI regular claims and 22.0% of employment, indicating that it was overrepresented among EI regular claims. Conversely, the service sector comprised 58.8% of all EI regular claims and 78.0% of employment, indicating that the service sector was underrepresented among EI regular claims.
The goods sector includes some industries with a large share of seasonal workers such as agriculture, forestry, fishing and hunting (regular B/C ratio of 4.2), and construction (2.8). Therefore, the goods sector continued to be a significant net beneficiary of the program, as it was in 2010.
As shown in Table 24, within the service sector, three industries were net beneficiaries of regular benefits from the EI program, with an adjusted regular (B/C) ratio larger than 1.0. These three industries were the arts, entertainment and recreation industry (B/C ratio of 2.0), the administrative support, waste management and remediation services industry (B/C ratio of 1.4), and the accommodation and food services industry (B/C ratio of 1.3).
| Goods Sector | 1.8 |
|---|---|
| Agriculture, Forestry, Fishing and Hunting | 4.2 |
| Mining, and Oil and Gas Extraction | 0.8 |
| Utilities | 0.4 |
| Construction | 2.8 |
| Manufacturing | 1.2 |
| Service Sector | 0.8 |
| Wholesale Trade | 0.9 |
| Retail Trade | 0.8 |
| Transportation and Warehousing | 0.9 |
| Information and Cultural Industries | 0.6 |
| Finance and Insurance | 0.4 |
| Real Estate, and Rental and Leasing | 1.0 |
| Professional, Scientific and Technical Services | 0.8 |
| Management of Companies and Enterprises | 0.8 |
| Administrative and Support, Waste Management and Remediation Services |
1.4 |
| Educational Services | 0.7 |
| Health Care and Social Assistance | 0.4 |
| Arts, Entertainment and Recreation | 2.0 |
| Accommodation and Food Services | 1.3 |
| Other Services | 1.0 |
| Public Administration | 0.5 |
| All Industries | 1.0 |
- 1 For ease of analysis, the benefits-to-contributions ratios have been adjusted so that the national figure equals 1.0.
10.3 EI Regular Benefits-to-Contributions Ratios, by Gender and Age
Older workers were net beneficiaries in 2011, with adjusted regular benefits-to-contributions ratios greater than 1.0. This is consistent with the findings of an evaluation study, Footnote 90 which showed that older workers (aged 55 and older) were generally more likely to be net beneficiaries of EI regular benefits.
Men (B/C ratio of 1.2) were net beneficiaries with an adjusted regular B/C ratio greater than 1.0. However, women (B/C ratio of 0.8) were net contributors to the EI program in 2011 when considering regular benefits only, in contrast to their status when considering all EI income benefits (B/C ratio of 1.1).
11. EI Regular Benefits and Seasonal Workers
11.1 Seasonal Workers
According to the Labour Force Survey (LFS), there were 456,100 seasonal workers Footnote 91 in 2012/13, a 0.1% decrease from 2011/12. Seasonal workers represented 22.5% of all temporary workers and 3.1% of all employees in 2012/13.
The number of seasonal workers has increased over the past 10 years, rising by 15.8% since 2002/03, but the proportion of seasonal workers among all temporary workers has remained stable (between 22% and 24%) throughout the period. Among all employees, the proportion of seasonal workers has also remained stable (close to 3%) over the last 10 years.
A recent study Footnote 92 of seasonal workers found that they were more likely to be male, to have less education and to have fewer dependants than workers in general. These workers were also more prominent in the Atlantic provinces and in primary industries.
These findings were supported by another recent study. Footnote 93 This study also found that the number of seasonal workers grew steadily and more rapidly than total employment between 1997 and 2011; that the seasonal worker population was aging more rapidly than the total Canadian labour force; and that seasonal workers were more frequently found in firms with fewer than 20 employees.
11.2 Seasonal Claims Made by EI Regular Benefit Claimants
The number of EI seasonal claims Footnote 94 increased by 1.5% to 448,220 claims in 2012/13. Of these claims, 419,930 were from EI regular claims and 28,290 were from EI fishing claims. Footnote 95 The analysis in the subsections on seasonality will focus on regular claims.
Historically, labour market conditions have had less of an effect on the volume of seasonal claims than on the volume of non-seasonal regular claims. However, the late-2000s recession and subsequent growth contributed to a drop in the share of seasonal claims as a proportion of all EI regular claims in 2008/09, and the subsequent increases from 2009/10 to 2012/13, as shown in Chart 31.
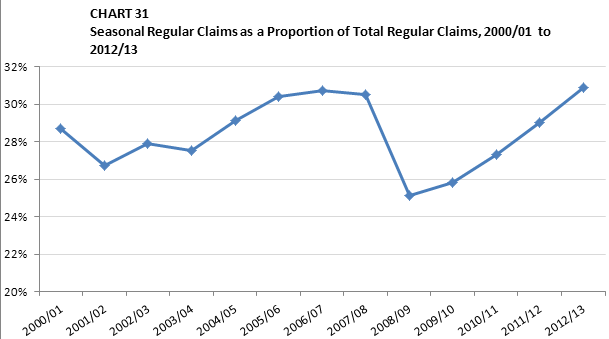
-
Show data table
Chart 31 Seasonal regular claims as a Proportion of Total regular Claims, 2000/01 to 2012/13 Seasonal Regular Claims as a proportion of Regular Claims 2000/01 28.7% 2001/02 26.7% 2002/03 27.9% 2003/04 27.5% 2004/05 29.1% 2005/06 30.4% 2006/07 30.7% 2007/08 30.5% 2008/09 25.1% 2009/10 25.8% 2010/11 27.3% 2011/12 29.0% 2012/13 30.9%
EI administrative data show that the number of seasonal claims from EI regular claims increased by 1.9% to 419,930 in 2012/13. These seasonal regular claims represented 30.9% of regular claims established in 2012/13, an increase from 29.0% in the previous year. The share of seasonal claims in 2012/13 is in line with the trend observed before the late-2000s recession, when seasonal claims accounted for about 30% of all EI regular claims.
As illustrated in Table 25, seasonal claims are more common among workers 45 and older, in the Atlantic provinces and Quebec, and in the goods sector. The construction, manufacturing and education industries account for about half of all EI seasonal claims.
| EI Seasonal Regular Claims | EI Regular Claims | Seasonal Regular Claims as a % of Regular Claims | Distribution of EI Seasonal Regular Claims | Distribution of EI Regular Claims | |
|---|---|---|---|---|---|
| Canada | 419,930 | 1,356,810 | 31.0% | 100.0% | 100.0% |
| Gender | |||||
| Male | 259,690 | 814,090 | 31.9% | 61.8% | 60.0% |
| Female | 160,240 | 542,720 | 29.5% | 38.2% | 40.0% |
| Age | |||||
| 15 to 24 years (Youth) | 11,980 | 138,910 | 8.6% | 2.9% | 10.2% |
| 25 to 44 years | 154,550 | 594,800 | 26.0% | 36.8% | 43.8% |
| 45 to 54 years | 128,020 | 339,570 | 37.7% | 30.5% | 25.0% |
| 55 years and over (Older workers) | 125,380 | 283,530 | 44.2% | 29.9% | 20.9% |
| Province/Territory | |||||
| Newfoundland and Labrador | 32,430 | 62,720 | 51.7% | 7.7% | 4.6% |
| Prince Edward Island | 9,000 | 16,370 | 55.0% | 2.1% | 1.2% |
| Nova Scotia | 26,980 | 62,440 | 43.2% | 6.4% | 4.6% |
| New Brunswick | 35,110 | 73,140 | 48.0% | 8.4% | 5.4% |
| Quebec | 161,190 | 436,640 | 36.9% | 38.4% | 32.2% |
| Ontario | 91,870 | 404,400 | 22.7% | 21.9% | 29.8% |
| Manitoba | 10,680 | 37,750 | 28.3% | 2.5% | 2.8% |
| Saskatchewan | 8,180 | 27,360 | 29.9% | 2.0% | 2.0% |
| Alberta | 12,390 | 84,700 | 14.6% | 3.0% | 6.2% |
| British Columbia | 31,100 | 146,720 | 21.2% | 7.4% | 10.8% |
| Nunavut | 80 | 900 | 8.9% | 0.0% | 0.1% |
| Northwest Territories | 280 | 1,610 | 17.4% | 0.1% | 0.1% |
| Yukon | 640 | 2,060 | 31.1% | 0.2% | 0.2% |
| Sector | |||||
| Goods Sector | 182,000 | 492,460 | 37.0% | 43.3% | 36.3% |
| Service Sector | 224,280 | 797,760 | 28.1% | 53.4% | 58.8% |
In general, about half of all seasonal regular claims are established in the third quarter of the fiscal year, between October and December. In 2012/13, 48.2% of all new seasonal regular claims were established between October and December. This fact mainly reflects seasonal patterns in the construction and manufacturing industries. On the other hand, the education services industry exhibits a different seasonal trend, as 93.1% of new seasonal claims in this industry are made in the first and second quarters of the fiscal year, between April and September.
Although seasonal regular claims are established in all provinces, the incidence of these claims is higher in provinces where a large portion of employment is concentrated in seasonal industries. Quebec has the highest incidence of seasonality; the province accounted for 38.4% of total seasonal regular claims in 2012/13, compared with 32.2% of all regular claims. Conversely, Ontario accounted for 21.9% of seasonal regular claims, but 29.8% of total regular claims. The disparity is partially explained by differences in the seasonality of their construction industries. For instance 46,670 (or 50.4%) of all regular claims in Quebec’s construction industry were seasonal in 2012/13. In comparison, 21,040 (or 31.9%) of all regular claims in Ontario’s construction industry were seasonal. Nationally, 99,980 (or 38.7%) of all construction claims were seasonal.
The Atlantic provinces, which rely heavily on seasonal industries, also had high incidences of seasonal regular claims. Collectively, the four Atlantic provinces accounted for 24.7% of seasonal regular claims but only 15.8% of total regular claims in 2012/13. British Columbia and Alberta, on the other hand, had a lower incidence of seasonal regular claims (these provinces accounted for only 7.4% and 3.0% of total seasonal regular claims, compared to 10.8% and 6.2% of all regular claims, respectively).
11.3 Access to EI Regular Benefits Among Seasonal Claimants
The Employment Insurance Coverage Survey (EICS) shows that access to regular benefits for seasonal workers is higher than that for other non-standard workers Footnote 96 but lower than that for full-time, permanent workers. A recent study, Footnote 97 based on the Canadian Out-of-Employment Panel Survey (COEP), further confirmed that seasonal workers are less likely than full-time permanent job separators (by 12 percentage points) to be eligible for EI regular benefits. In 2011, 81.2% of unemployed seasonal workers who had been paying premiums and then were laid off or quit with just cause were eligible for regular benefits. On the other hand, 60.0% of other non-standard workers and 91.2% of full-time permanent workers in that same situation were eligible for regular benefits in 2011.
EI administrative data show that the difference in access to regular benefits between seasonal and full-time permanent workers is due to the lower number of insurable hours seasonal claimants accumulate. In 2011/12, of claims for EI regular benefits, 94.5% had a minimum of 700 hours of insurable employment, which is the maximum number of hours required to qualify for EI benefits. The proportion for seasonal regular claims was slightly lower (92.4%). Moreover, the above-mentioned study also found that the average number of insurable hours accumulated by seasonal workers was 34.6% lower than that accumulated by full-time permanent workers.
11.4 Entitlement to EI Regular Benefits Among Seasonal Claimants
In 2012/13, the average entitlement per seasonal regular claim was 31.3 weeks of regular benefits, a drop from 32.7 weeks in 2011/12. The number of weeks of entitlement has been decreasing since the recession, when it reached 39.0 weeks in 2009/10. With the recent decreases, the average entitlement to regular benefits is once again close to the pre-recession level, which was 31.9 weeks in 2007/08.
Compared with all regular claimants, seasonal regular claimants tend to use less of their entitlement. The gap in the percentage of entitlement usage between seasonal regular and regular claimants increased in 2011/12 in comparison to the gap in 2010/11. On a per-claim basis, on average, seasonal regular claimants used 59.0% of their regular entitlement for claims established in 2011/12 and 60.5% for claims established in 2010/11. Footnote 98 In comparison, regular claimants used 62.2% of their entitlement for claims established in 2011/12 and 62.1% for claims established in 2010/11.
11.5 Duration of EI Regular Benefits Among Seasonal Claimants
Correspondingly, the average duration of regular benefits among seasonal regular claimants is also shorter than that for all regular claimants. The average seasonal regular claim established in 2011/12 received 18.5 weeks of benefits, while regular claims received an average of 19.9 weeks. The same holds true for claims established in 2010/11, as seasonal regular claims received an average of 19.9 weeks of benefits, while regular claims received an average of 21.5 weeks.
12. EI Regular Benefits and Labour Mobility
A significant movement of labour takes place in Canada, mainly from regions of high unemployment and low wages to regions of lower unemployment and higher wages. However, regional variations in unemployment rates that have persisted for decades continued during the late-2000s recession, which suggests that geographical rigidity exists in the Canadian labour market, at least to some extent. Despite the fact that jobs may be available in other regions of the country, some workers are not able or willing to move. This situation contributes to regional pockets of higher unemployment.
12.1 Labour Mobility Within Canada
Demographic estimates Footnote 99 from Statistics Canada on interprovincial labour mobility in 2012/13 showed that only three provinces—Alberta (+47,224), Saskatchewan (+1,779), and Newfoundland and Labrador (+519) —had positive net migration flows of population within the country, as shown in Chart 32. Ontario (-21,366), British Columbia (-7,165), and Quebec (-7,025), Canada’s three largest provinces, had the highest negative net migration flows of population.
-
Show data table
Chart 32: Labour Mobility within Canada, 2012/13 In-migrants Out-migrants Nfld. 8,877 8,358 P.E.I. 2,693 3,864 N.S. 14,482 19,806 N.B. 10,566 13,839 Que. 22,922 29,947 Ont. 63,321 84,687 Man. 13,693 17,465 Sask. 21,723 19,944 Alta. 102,206 54,982 B.C. 47,056 54,221 - Source: Statistics Canada, Labour Force Survey.
In 2012/13, Alberta attracted 102,206 in-migrants, more than any other province, followed by Ontario with 63,321, and British Columbia with 47,056. Alberta has experienced positive net migration every year since 2000/01 except 2009/10 (-2,343). Over the past 10 years combined, only Alberta (+226,517), British Columbia (+67,339), and Yukon (+1,955) have had positive net migration flows, while all other provinces and territories experienced negative net migration flows.
Two current trends in labour mobility in Canada are movement from east to west, and movement toward Alberta. According to analysis of migration data from Statistics Canada, the majority of workers (61.2%) who moved from the Atlantic provinces in 2012/13 relocated to either Alberta (33.3%) or Ontario (27.9%). Most of the workers moving from Quebec relocated to Ontario (57.7%), while those leaving Ontario moved primarily to Alberta (40.3%), as well as to Quebec (17.1%) and British Columbia (15.6%).
Alberta was the preferred destination among all provincial out-migrants, with the exception of out-migrants leaving Quebec and Prince Edward Island. Alberta was particularly popular among out-migrants from Ontario, British Columbia, and Saskatchewan, which combined to account for 71.9% of all Alberta in-migrants. The majority of individuals who left Alberta migrated to either British Columbia (36.0%) or Ontario (23.7%).
In 2012/13, Alberta registered a 4.5% unemployment rate, well below the national average of 7.2%, which is consistent with data from the past several years. Job opportunities could partially explain the influx of migration to Alberta in recent years. Future Monitoring and Assessment Reports will continue to examine provincial labour mobility.
12.2 Impact of EI on Labour Mobility
A number of studies in the past decade have looked at the determinants of labour mobility and whether EI plays a role in the decision to migrate for employment. Results of these studies indicate that factors such as personal and labour market characteristics, as well as moving costs, play a key role in mobility decisions, Footnote 100 while EI generosity does not seem to affect mobility decisions. Footnote 101
A recent research paper Footnote 102 concluded that among EI regular claimants, those in higher unemployment regions (with an unemployment rate of 12.1% or higher) were more likely to commute to work from one economic region to another but less likely to migrate to another economic region; however, the overall effect of EI entitlement on geographical attachment was very minimal.
Another recent study Footnote 103 compared commuting and mobility patterns of EI recipients and non-recipients. The findings suggested that EI does not discourage workers from being mobile. EI recipients were found to be more likely than non-EI recipients to commute 30 kilometres or more to work and more likely to work outside their census subdivision of residence. Also, following a job loss, EI recipients were more likely than non-EI recipients to move over 100 kilometres away.
Furthermore, a study Footnote 104 estimated that eliminating regional EI extended benefits and regional EI differences in the VER would increase the volume of migration by less than 1%. In general, the available evidence suggests that EI is generally not a barrier to mobility.