
EI Monitoring and Assessment Report 2012/13 III. EI FISHING BENEFITS
Notice: Refer to the Table of contents to navigate through the EI Monitoring and Assessment Report 2012/13.
EI fishing benefits are paid to eligible self-employed fishers, who do not meet the eligibility requirements for EI regular benefits in their region. The majority of EI fishing beneficiaries who rely on the fishing industry reside in rural communities. There are two separate benefit periods for fishing benefits: a winter qualifying period, for which a benefit period can be established starting in April; and a summer qualifying period, for which a benefit period can be established starting in October.
Fishing claims represent a significant part of the economy in many coastal communities. Fishing benefits are administered either directly or indirectly by three federal organizations: Employment and Social Development Canada (ESDC)/Service Canada, Fisheries and Oceans Canada (DFO), and the Canada Revenue Agency (CRA). DFO grants fishing licenses; CRA determines who is eligible as a self-employed fisher; and ESDC/Service Canada determine eligibility for and pay EI fishing benefits, which are based on insurable earnings rather than insurable hours.
1. EI Fishing Claims and Benefits
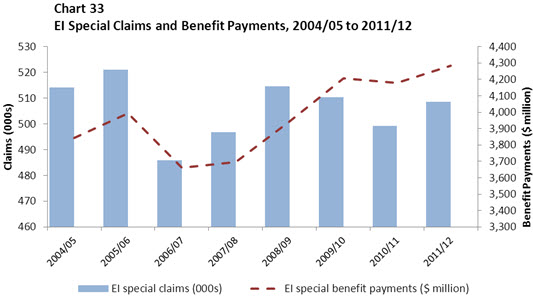
In 2012/13, the number of new fishing claims decreased by 4.1%, to 28,290 new claims (see Chart 33). Along with a decrease in the number of fishing claims, fishing benefits paid to self-employed fishers fell by 2.5% (-6.4 million) in 2012/13, after an increase of 7.2% in the previous year.
-
Table equivalent for Chart 33
Chart 33: EI Fishing Claims and Benefits, 2004/05 to 2011/12 EI fishing claims Total fishing benefits 2004/05 37.6 $288.7 2005/06 33.9 $259.1 2006/07 31.7 $242.1 2007/08 31.9 $248.9 2008/09 30.5 $246.2 2009/10 29.3 $245.1 2010/11 28.5 $241.7 2011/12 29.5 $259.2 2012/13 28.3 $252.8
In 2012/13, EI fishing benefits comprised 1.7% of total EI income benefits, the same proportion as in previous year. For the majority of self-employed fishers who reside in fishing-dominated communities, EI benefits are an important part of their annual income.
1.1 EI Fishing Benefits, by Province and Territory
The Atlantic provinces accounted for 81.1% of all fishing claims established in 2012/13. Within the region, the number of new fishing claims decreased in three out of four provinces, led by a decrease of 4.9% in Newfoundland and Labrador. The only exception was New Brunswick, where the number of new fishing claims increased by 0.2%. Quebec also saw a decrease of 2.7% in fishing claims in 2012/13, while fishing claims in British Columbia decreased by 10.7%.
Fishing claims in Newfoundland and Labrador represented 41.8% of all EI fishing claims in 2012/13, decreasing slightly from 42.2% in 2011/12. Since their peak in 2004/05, fishing claims in Newfoundland and Labrador have dropped significantly (-33.3%).
Fishing claims in British Columbia accounted for 9.9% of the national total, compared with 10.6% in the previous year. Similar to Newfoundland and Labrador, fishing claims in the province have dropped significantly (-36.2%) since their peak in 2003/04.
Among major fishing provinces, EI fishing benefits decreased in British Columbia (-6.8%), Newfoundland and Labrador (-4.3%), Prince Edward Island (-2.2%), and New Brunswick (-0.3%), while they increased in Manitoba (+3.1%), and Nova Scotia (+1.5%).
1.2 EI Fishing Benefits, by Gender and Age
In 2012/13, the number of fishing claims established by men decreased by 4.4% (-1,076), while those established by women decreased by 2.7% (-140). Men made 82.1% of EI fishing claims, a figure 0.2 percentage points lower than that in the previous year.
Core-aged fishers (those aged 25 to 54), who accounted for 62.9% of all new fishing claims, established 6.0% (-1,137) fewer fishing claims in 2012/13 than in the previous year. The number of new fishing claims registered by youth (aged 15 to 24) decreased significantly by 9.0% (-122) in 2012/13; consequently, their share of all EI fishing claims decreased by 0.2 percentage points to 4.4%.
Older workers (aged 55 and older) made slightly more fishing claims (+0.5%, +43) than they did in 2011/12. Canada's aging demographics have affected the fishing workforce in recent years, with the share of fishing claims made by older workers increasing from 28.6% in 2008/09 to 32.7% in 2012/13.
2. Eligibility for EI Fishing Benefits
EI fishing benefits are based on earnings from self-employment in fishing. To qualify for benefits, fishers need to earn between $2,500 and $4,200 from self-employment in fishing (depending on the regional unemployment rate) Footnote 105 in their qualifying period (generally 31 weeks prior to claim). Any claimant who qualifies for fishing benefits may receive a maximum entitlement of 26 weeks, with the possibility of establishing two claims a year, one in the winter and one in the summer.
However, if an individual has just started working as a self-employed fisher, or is returning to fishing after an absence of a year or more preceding the qualifying period, he or she is considered a new-entrant/re-entrant (NERE) and must earn $5,500 in insurable earnings to qualify for fishing benefits. Individuals who have received one week or more of maternity or parental benefits in the 208 weeks preceding the labour force attachment period Footnote 106 are not considered NEREs.
Historically, over 90% of all fishers who claim fishing benefits have qualified with earnings above $5,500, which is the minimum eligibility requirement for NERE fishers. In 2012/13, this figure was 98.2%, which is consistent with the figures recorded in the last five years.
-
Table equivalent for Chart 34
Chart 34: Distribution of Fishing Claims by Insurable Earnings, 2012/13 Insurable earnings Distribution <$2500 0% $2500-3999 1% $4000-4199 0% $4200-5499 1% $5500-6999 2% $7000-8499 3% $8500-9999 4% $10000-11499 7% $11500-12999 54% $13000-14499 15% $14500-15999 7% $16000-17499 3% $17500-18999 3% $19000-20499 1% Total 100%
3. Accessibility to EI Fishing Benefits
Among the 28,290 new fishing claims in 2012/13, claimants established 10,973 fishing claims based on the winter qualifying period, a 0.5% decrease over the previous year. The number of claims established based on the summer qualifying period also decreased (-6.3%), to 17,317 claims.
There were 20,080 fishers who made fishing claims in 2012/13, a decrease of 3.9% from 2011/12. The difference between the number of fishing claims and the number of fishers making these claims can be attributed to the fact that some fishers are active in both fishing seasons and are eligible to claim fishing benefits twice a year.
In the major fish-producing provinces, the number of fishers claiming benefits declined in British Columbia (-10.9%), Newfoundland and Labrador (-4.5%), Prince Edward Island (-2.9%), Nova Scotia (-2.7%), and Quebec (-2.6%), while New Brunswick (+2.2%) experienced an increase in the number of fishers claiming benefits.
In 2011/12, a total of 8,207 (40.9%) fishers who established a claim made multiple fishing claims, while 11,871 (59.1%) fishers made one fishing claim. The number of claims made by fishers who made multiple fishing claims (16,417) accounted for over half of all fishing claims. The number of fishers who made a single claim declined by 3.3%, while the number of fishers who made multiple claims decreased by 4.7%.
The Atlantic provinces accounted for 90.8% of all fishers who made multiple fishing claims. Nevertheless, the number of fishers who made multiple claims declined in all four provinces in 2012/13, as follows: Newfoundland and Labrador (-6.0%), Nova Scotia (-4.3%), Prince Edward Island (-3.8%), and New Brunswick (-2.6%). Fishers in Newfoundland and Labrador were the most likely to be active in both seasons, as 69.5% of claimants in the province established multiple fishing claims in 2012/13.
4. Level of EI Fishing Benefits
The average weekly fishing benefit increased by 2.9%, from $439 in 2011/12 to $452 in 2012/13. With this increase, the average weekly benefit for fishing claims was $57 higher than that for regular claims ($395). Moreover, the average weekly benefit for fishers remained close to the maximum weekly benefit of $485 in 2012.
A fisher's maximum weekly benefits are calculated by dividing the fishing insured earnings obtained during the qualifying period (generally 31 weeks prior to claim) by the divisor associated with the claimant's regional unemployment rate (see Table 26).
| Regional Rate of Unemployment | Divisor |
|---|---|
| 6% or less | 22 |
| 6.1% to 7% | 21 |
| 7.1% to 8% | 20 |
| 8.1% to 9% | 19 |
| 9.1% to 10% | 18 |
| 10.1% to 11% | 17 |
| 11.1% to 12% | 16 |
| 12.1% to 13% | 15 |
| 13.1% or more | 14 |
In 2012/13, almost two-thirds (60.3%) of self-employed fishers resided in regions with an unemployment rate higher than 13.1%, and they represented 65.0% of all fishing claims.
The proportion of fishing claimants who received the maximum weekly benefit increased from 78.1% in 2011/12 to 78.8% in 2012/13. This proportion is much higher than the proportion of regular claimants who received the maximum weekly benefit (41.6% in 2012/13).
5. Duration of EI Fishing Benefits
In 2011/12, the average duration of all fishing claims was 20.6 weeks, a slight increase from 20.3 weeks in 2010/11. Women claimed 2.2 weeks more than men did (22.4 weeks compared with 20.2 weeks).
Fishers in British Columbia, who tend to have only one fishing season, had the longest average benefit duration, at 23.1 weeks. Benefit durations in the Atlantic provinces varied slightly between 19.6 and 20.9 weeks.
Fishers who established one claim in 2011/12 received an average of 24.6 weeks, while fishers who established two claims received an average of 20.3 weeks on their first claim and 17.8 weeks on their second claim, for an average total of 38.1 weeks of benefits.