
Employment Insurance Monitoring and Assessment Report 2014/2015 Annex 3 - Employment Benefits and Support Measures data tables
-
Annex 3.1 Overview of Labour Market Development Agreements
Allocation ($000s)1 Province/Territory Signature Date Implementation Date 2015/2016 2014/2015 2013/2014 LMDA LMDA LMDA Newfoundland and Labrador September 4, 2008 November 2, 2009 126,780 127,992 129,219 Prince Edward Island September 5, 2008 October 5, 2009 25,292 25,656 26,084 Nova Scotia June 13, 2008 July 1, 2009 78,592 78,870 79,013 New Brunswick December 13, 1996 April 1, 1997 89,819 89,840 89,763 Quebec April 21, 1997 April 1, 1998 577,625 579,094 581,242 Ontario November 23, 2005 January 1, 2007 574,760 570,490 565,471 Manitoba April 17, 1997 November 27, 1997 43,083 43,083 43,507 Saskatchewan February 6, 1998 January 1, 1999 35,229 35,855 36,426 Alberta December 6, 1996 November 1, 1997 109,404 109,138 109,143 British Columbia February 20, 2008 February 2, 2009 279,959 280,504 280,647 Northwest Territories February 27, 1998 October 1, 1998 3,082 3,121 3,143 Yukon July 8, 2009 February 1, 2010 3,560 3,523 3,482 Nunavut May 11, 2000 April 1, 2000 2,811 2,834 2,859 Canada 1,950,000 1,950,000 1,950,000 - 1Funds that are transferred to cover administrative costs are not included in the amounts. Please refer to Annex 3.12 for administrative costs.
-
Annex 3.2 Employment Insurance (EI) Part II – General Definitions
Eligibility for Employment Benefits and Support Measures (EBSMs) or Similar Programs Funded Under Part II
To be eligible for Employment Benefits, individuals must be unemployed and have a current Employment Insurance (EI) claim as an “active EI client” or a claim that ended in the preceding three years as a “former EI client.” Those who began a maternity or parental claim in the preceding five years, after which they left the labour market to care for their newborn or newly adopted children, also qualify as former EI clients and are eligible for Employment Benefits upon re-entry into the labour market. Unemployed individuals who are neither active nor former EI clients are considered “non-insured” and are eligible to participate in Employment Assistance Services as well as self-services provided by the National Employment Service.
Labour Market Development Agreements (LMDAs)
LMDAs provide the frameworks within which EBSM delivery takes place. EBSMs are flexible by design, allowing provincial and territorial jurisdictions (P/Ts) to develop and deliver programs that respond to local and regional labour market needs. With the implementation of the Canada-Yukon LMDA on February 1, 2010, all provinces and territories are now fully responsible for the design and delivery of programs similar to EBSMs established under Part II of the EI Act. In support of these activities, Employment and Social Development Canada (ESDC) transfers LMDA funding to the provinces and territories and focuses on accountability, evaluation and ongoing policy development. ESDC also delivers Pan-Canadian programming and maintains, in partnership with the provinces and territories, specific projects and activities in the national interest under Part II of the EI Act. Canada retains responsibility for the delivery of insurance benefits under Part I of the EI Act and for the aspects of labour market development reflective of national interests. For more information on LMDAs, please refer to: Labour Market Development Agreements.
Apprentices
Apprentices are paid by their employer during periods of practical training. During the classroom portion of their training, apprentices are eligible for regular benefits under Part I of the EI Act. The apprentice requires a referral under the authority of Section 25 of the EI Act to access these benefits. Depending on the regional and local priorities of the province or territory, the apprentice may receive EI Part II support to cover classroom-related expenses.
Aboriginal Skills and Employment Training Strategy (ASETS)
ESDC negotiates agreements with indigenous organizations to design and deliver employment programs and services for indigenous people at the community level. Aboriginal Skills and Employment Training Strategy (ASETS) is the successor to the Aboriginal Human Resources Development Strategy (AHRDS), which expired on March 31, 2010.
The sunsetting of AHRDS and the modernization of ESDC's Aboriginal labour market programming—through ASETS—coincides with ESDC’s process of modernizing the administration of grants and contributions. The ASETS advances labour market outcomes for First Nations, Métis, and Inuit via demand-driven skills development, strategic partnerships with provinces, territories and the private sector, and via increased accountability. It also supports the development of a skilled Aboriginal workforce, which is one of the Aboriginal Economic Development Framework’s objectives.
Job Bank
Job Bank is an Internet service that helps connect employers and workers. It is the largest web-based network of job advertisements across Canada and is available to Canadian employers and job seekers free of charge. See Job Bank.
-
Annex 3.3 EBSM Program Descriptions
Employment Benefits
Targeted Wage Subsidies assist insured participants to obtain on-the-job work experience by providing employers with financial assistance toward the wages of participants. This benefit encourages employers to hire unemployed individuals whom they would not normally hire in the absence of a subsidy.
Self-Employment provides financial assistance and business planning advice to EI-eligible participants to help them start their own business. This financial assistance is intended to cover personal living expenses and other expenses during the initial stages of the business.
Job Creation Partnerships projects provide insured participants with opportunities to gain work experience that will lead to ongoing employment. Activities of the project help develop the community and the local economy.
Skills Development helps insured participants to obtain employment skills by giving them direct financial assistance that enables them to select, arrange for and pay for their own training.
Targeted Earnings Supplements encourage unemployed persons to accept employment by offering them financial incentives. Quebec offers a similar measure—Return to Work Supplement—to help with expenses related to returning to work (for example, new tools, office materials or clothing).
Support Measures
Employment Assistance Services provide funding to organizations to enable them to provide employment assistance to unemployed persons. The services provided may include individual counselling, action planning, job search skills, job-finding clubs, job placement services, the provision of labour market information, case management and follow-up.
Labour Market Partnerships provide funding to help employers, employee and employer associations, and communities to improve their capacity to deal with human resource requirements and to implement labour force adjustments. These partnerships involve developing plans and strategies, and implementing adjustment measures.
Research and Innovation supports activities that identify better ways of helping people to prepare for or keep employment and to be productive participants in the labour force. Funds are provided to eligible recipients to enable them to carry out demonstration projects and research for this purpose.
-
Annex 3.41 EBSM Overview
Clients Served2 Gender Men 59.3% Women 40.7% Age3 15 to 19 5.1% 20 to 24 14.3% 25 to 29 13.3% 30 to 34 12.8% 35 to 39 11.6% 40 to 44 10.5% 45 to 49 10.1% 50 to 54 9.9% 55 and Older 12.5% Unknown ─ EI Clients Served Active Claimants 78.7% Former Claimants 21.3% Intervention-to-Client Ratio Clients 689,459 Interventions 1,106,750 Ratio 1.61 Participation in Interventions as a Percentage of Total Employment Benefits Targeted Wage Subsidies 1.0% Self-Employment 0.7% Job Creation Partnerships 0.3% Skills Development-Regular 4.4% Skills Development-Apprentices 6.2% Targeted Earning Supplements 0.2% Support Measures: Employment Assistance Services Employment Services 52.3% Group Services 3.2% Individual Counselling 28.9% Pan-Canadian 2.5% Designated Group Participation in EBSMs Women 44.1% Indigenous People4 7.5% Persons with Disabilities4 9.7% Visible Minorities4 4.0% Labour Market Employment 17,829,642 Unemployment Rate 6.9% - Sources: Client and Participant datasets.
- 1 In 2013/2014, Newfoundland and Labrador implemented a one-stop employment services delivery model, which included the introduction of a new case management system and ending contracts with third-party providers of employment services. Due to this transition, the 2014/2015 administrative data on clients and interventions presented in this report for the province are estimates, based on partial counts and other sources of information, such as the audited financial statements and temporary transitional data capturing processes for that period. The province has undertaken a supplementary analysis and is adjusting the data collection process of its new system to ensure the data counts for the 2015/2016 MAR are complete.
- 2 Clients with an unknown gender were added to the male category.
- 3 SD-Apprentices and Group Services are excluded from the distribution because client date of birth is not collected.
- 4 Reported counts are generally lower than actual numbers because data are collected through self-identification.
-
Annex 3.51 EBSM Clients – Clients Served, by Client Type2
2014/2015 Provinces and Territories EI Clients Non-Insured Clients Served Total Clients Served EI Active Claimants Former Claimants Served Total EI Clients Served Target3 Active Claimants Served Newfoundland and Labrador 9,500 8,850 2,513 11,363 1,126 12,489 Prince Edward Island 2,844 2,709 621 3,330 1,470 4,800 Nova Scotia 10,000 9,360 2,202 11,562 4,397 15,959 New Brunswick 8,925 8,596 2,393 10,989 4,838 15,827 Quebec 136,500 140,026 24,986 165,012 64,769 229,781 Ontario 58,000 63,061 19,734 82,795 71,278 154,073 Manitoba 10,500 9,996 3,672 13,668 15,174 28,842 Saskatchewan 8,125 10,503 2,565 13,068 813 13,881 Alberta 37,500 43,398 15,820 59,218 60,344 119,562 British Columbia 39,000 34,937 9,502 44,439 32,365 76,804 Northwest Territories 338 294 138 432 500 932 Yukon 300 259 45 304 131 435 Nunavut 160 110 126 236 460 696 National Headquarters ─ ─ ─ ─ ─ ─ Total EBSMs 321,692 332,099 84,317 416,416 257,665 674,081 Indigenous Pan-Canadian 15,738 7,696 7,682 15,378 ─ 15,378 Canada 337,430 339,795 91,999 431,794 257,665 689,459 - Source: Client dataset.
- 1 In 2013/2014, Newfoundland and Labrador implemented a new case management system, ended Employment Services contracts with external service providers, and re-instituted their network of provincial counsellors. In the context of the transition to this new system, the 2013/2014 administrative data counts for the province are incomplete. Therefore, the 2013/2014 data on clients and interventions presented in this report for the province are estimates, based on partial counts and other sources of information such as the audited financial statements and temporary transitional data capturing processes for that period. The province will undertake supplementary analysis and fine tune the data collection process of its new system to ensure the data counts for the 2014/2015 Monitoring and Assessment Report are complete.
- 2 This table includes clients served between April 1, 2014, and March 31, 2015, with one count per client served.
- 3 Each jurisdiction's target refers to the number of EI active clients served, except in Quebec, where it includes both active and former clients served.
-
Annex 3.61 New EBSM Interventions2
2014/2015 N.L. P.E.I. N.S. N.B. Que. Ont.3 Man. Sask. Alta. B.C. N.W.T Yuk. Nun. NHQ Canada Employment Benefits Targeted Wage Subsidies 880 437 362 1,632 5,052 1,806 53 ─ 49 1,295 67 3 7 ─ 11,643 Self-Employment 179 118 422 286 1,680 2,406 120 66 120 1,946 14 2 2 ─ 7,361 Job Creation Partnerships 1,196 108 118 ─ ─ 512 135 ─ 598 498 ─ ─ ─ ─ 3,165 Skills Development–Regular 3,609 1,013 1,790 3,983 23,050 8,049 1,966 938 1,029 3,367 44 45 208 ─ 49,091 Skills Development–Apprentices 2,727 315 1,560 2,192 ─ 15,883 3,932 6,566 22,492 12,399 155 177 39 ─ 68,437 Targeted Earning Supplements ─ ─ ─ ─ 2,692 ─ ─ ─ ─ ─ ─ ─ ─ ─ 2,692 Total Employment Benefits 8,591 1,991 4,252 8,093 32,474 28,656 6,206 7,570 24,288 19,505 280 227 256 ─ 142,389 Support Measures: EAS Employment Services 8,238 4,252 20,603 9,094 146,501 ─ 39,241 5,494 212,188 131,710 ─ 293 678 ─ 578,292 Group Services 4,500 ─ 1,852 ─ 31,828 ─ ─ 560 ─ 602 ─ ─ ─ ─ 39,342 Individual Counselling 3,007 1,345 4,513 16,667 70,349 144,011 15,140 4,785 ─ 57,829 864 0 ─ ─ 318,510 Total Support Measures: EAS 15,745 5,597 26,968 25,761 248,678 144,011 54,381 10,839 212,188 190,141 864 293 678 ─ 936,144 Total Support Measures: EAS–Without Group Services 11,245 5,597 25,116 25,761 216,850 144,001 54,381 10,279 212,188 189,539 864 293 678 ─ 896,802 Total Benefits and Support Measures: EAS 24,336 7,588 31,220 33,854 281,152 172,667 60,587 18,409 236,476 209,646 1,144 520 934 ─ 1,078,533 Indigenous Pan-Canadian 231 140 462 533 3,229 5,621 4,905 2,727 2,651 6,957 270 201 101 189 28,217 Grand Total–Benefits and Support Measures: EAS 24,567 7,728 31,682 34,387 284,381 178,288 65,492 21,136 239,127 216,603 1,414 721 1,035 189 1,106,750 Grand Total–Without Group Services 20,067 7,728 29,830 34,387 252,553 178,288 65,492 20,576 239,127 216,001 1,414 721 1,035 189 1,067,408 - 1 In 2013/2014, Newfoundland and Labrador implemented a one-stop employment services delivery model, which included the introduction of a new case management system and ending contracts with third-party providers of employment services. Due to this transition, the 2014/2015 administrative data on clients and interventions presented in this report for the province are estimates, based on partial counts and other sources of information, such as the audited financial statements and temporary transitional data capturing processes for that period. The province has undertaken a supplementary analysis and is adjusting the data collection process of its new system to ensure the data counts for the 2015/2016 MAR are complete.
- 2 Interventions in this table refer to all new starts between April 1, 2014 and March 31, 2015.
- 3 Ontario counts one individual counselling intervention per client.
-
Annex 3.71 EBSM Designated Members – Women2
New Starts, by Intervention (%)─2014/2015 N.L. P.E.I. N.S. N.B. Que. Ont. Man. Sask. Alta. B.C. N.W.T Yuk. Nun. NHQ Canada Employment Benefits Targeted Wage Subsidies 30.0 35.7 51.9 28.2 44.6 48.3 20.8 ─ 63.3 45.0 9.0 66.7 28.6 ─ 41.5 Self-Employment 48.6 49.2 49.1 34.6 42.8 53.1 50.0 53.0 48.3 51.1 85.7 ─ 100.0 ─ 49.0 Job Creation Partnerships 49.2 51.9 64.4 ─ ─ 61.9 22.2 ─ 47.8 21.3 ─ ─ ─ ─ 46.1 Skills Development–Regular 44.9 51.5 52.5 45.6 40.9 48.6 53.3 44.9 49.3 48.8 29.5 53.3 49.0 ─ 44.8 Skills Development–Apprentices 6.1 2.9 3.8 3.2 ─ 2.8 2.5. 4.5 6.2 4.0 6.5 6.8 2.6 ─ 4.5 Targeted Earning Supplements ─ ─ ─ ─ 42.2 ─ ─ ─ ─ ─ ─ ─ ─ ─ 42.2 Total Employment Benefits 31.7 40.2 34.6 30.2 41.7 23.8 20.1 10.0 9.4 19.6 14.6 16.7 41.8 ─ 25.4 Support Measures: EAS Employment Services 48.0 50.7 50.6 47.7 44.6 2.6 52.2 35.2 47.6 46.8 2.6 42.7 44.8 ─ 47.0 Individual Counselling 48.0 52.1 52.0 39.5 43.7 50.0 50.0 41.3 ─ 46.6 35.4 ─ ─ ─ 47.3 Total Support Measures: EAS 48.0 51.0 50.8 42.4 44.3 50.0 51.6 38.0 47.6 35.4 44.8 46.8 42.7 ─ 47.1 Total Benefits and Support Measures: EAS 41.4 48.0 48.5 39.5 44.0 45.7 48.4 26.1 43.7 30.3 44.0 44.2 31.3 ─ 44.1 Indigenous Pan-Canadian 38.5 37.1 36.1 43.7 49.6 48.8 45.1 45.2 38.6 41.1 37.8 31.8 45.5 59.3 44.4 Grand Total, Benefits and Support Measures: EAS 41.4 48.2 48.3 39.5 44.1 45.8 48.1 28.7 43.6 44.1 31.8 31.5 44.2 59.3 44.1 - Source: Participant dataset.
- 1 In 2013/2014, Newfoundland and Labrador implemented a one-stop employment services delivery model, which included the introduction of a new case management system and ending contracts with third-party providers of employment services. Due to this transition, the 2014/2015 administrative data on clients and interventions presented in this report for the province are estimates, based on partial counts and other sources of information, such as the audited financial statements and temporary transitional data capturing processes for that period. The province has undertaken a supplementary analysis and is adjusting the data collection process of its new system to ensure the data counts for the 2015/2016 MAR are complete.
- 2 All percentages are based on new start interventions only (the number of interventions started in 2014/2015).
-
Annex 3.81 EBSM Designated Members – Persons with Disabilities2
New Starts, by Intervention (%)—2014/15 N.L. P.E.I. N.S. N.B. Que. Ont. Man. Sask. Alta. B.C. N.W.T Yuk. Nun. NHQ Canada Employment Benefits Targeted Wage Subsidies 2.3 2.7 27.3 1.7 39.2 4.2 7.5 ─ 2.0 17.9 ─ ─ ─ ─ 21.1 Self-Employment 1.1 1.7 12.8 2.4 2.1 ─ 4.2 3.0 1.7 22.3 ─ ─ ─ ─ 7.4 Job Creation Partnerships 0.9 2.8 11.9 ─ ─ ─ 2.2 ─ 4.0 8.4 ─ ─ ─ ─ 3.1 Skills Development–Regular 2.2 3.6 19.0 5.4 3.7 ─ 4.5 7.8 0.3 28.7 ─ 13.3 0.5 ─ 5.4 Skills Development–Apprentices 0.1 ─ 0.3 0.2 ─ ─ 0.2 0.8 ─ 0.2 ─ ─ ─ ─ 0.1 Targeted Earning Supplements ─ ─ ─ ─ 4.2 ─ ─ ─ ─ ─ ─ ─ ─ ─ 4.2 Total Employment Benefits 1.3 2.7 12.0 3.1 9.2 0.3 1.7 1.7 0.1 8.7 ─ 2.6 0.4 ─ 4.2 Support Measures: EAS Employment Services 1.4 20.9 25.5 21.9 8.5 ─ 10.5 9.2 2.9 26.8 ─ 42.0 0.9 ─ 11.6 Individual Counselling 1.4 5.7 39.1 9.7 4.9 3.9 5.6 9.3 ─ 28.4 0.8 ─ ─ ─ 9.5 Total Support Measures: EAS 1.1 17.2 27.9 14.0 7.3 3.9 9.2 9.2 2.9 27.3 0.8 42.0 0.9 ─ 10.4 Total Benefits and Support Measures: EAS 1.2 13.4 25.6 11.4 7.6 3.3 8.4 6.0 2.6 25.6 0.6 24.8 0.7 ─ 9.6 Indigenous Pan-Canadian 3.9 0.7 5.6 3.6 0.6 2.3 5.0 1.4 1.6 5.2 1.5 1.0 ─ 3.7 3.2 Grand Total, Benefits and Support Measures: EAS 1.4 13.2 25.3 11.3 7.5 3.3 8.1 5.4 2.6 24.9 0.8 18.2 0.7 3.7 9.7 - Source: Participant dataset.
- 1 In 2013/2014, Newfoundland and Labrador implemented a one-stop employment services delivery model, which included the introduction of a new case management system and ending contracts with third-party providers of employment services. Due to this transition, the 2014/2015 administrative data on clients and interventions presented in this report for the province are estimates, based on partial counts and other sources of information, such as the audited financial statements and temporary transitional data capturing processes for that period. The province has undertaken a supplementary analysis and is adjusting the data collection process of its new system to ensure the data counts for the 2015/2016 MAR are complete.
- 2 All percentages are based on new start interventions only (the number of interventions started in 2014/2015). These reported counts are generally lower than actual numbers because data are collected through self-identification.
-
Annex 3.91 EBSM Designated Members – Indigenous People2
New Starts, by Intervention (%)—2014/2015 N.L. P.E.I. N.S. N.B. Que. Ont. Man. Sask. Alta. B.C. N.W.T Yuk. Nun. NHQ Canada Employment Benefits Targeted Wage Subsidies 1.0 0.7 5.2 ─ 0.1 1.8 7.5 ─ 6.1 7.9 46.3 33.3 100.0 ─ 1.9 Self-Employment 3.4 0.8 4.5 ─ 0.1 1.7 10.0 12.1 0.8 7.8 ─ ─ 50.0 ─ 3.3 Job Creation Partnerships 0.3 0.9 6.8 ─ ─ 2.7 7.4 ─ 1.5 25.7 ─ ─ ─ ─ 5.5 Skills Development–Regular 2.8 1.3 4.1 ─ 0.1 1.6 8.5 10.9 0.3 9.3 72.7 24.4 85.1 ─ 2.3 Skills Development–Apprentices 0.1 ─ 0.2 ─ ─ 0.1 1.4 1.6 0.1 0.3 7.1 ─ ─ ─ 0.3 Targeted Earning Supplements ─ ─ ─ ─ 0.1 ─ ─ ─ ─ ─ ─ ─ ─ ─ 0.1 Total Employment Benefits 1.4 0.9 2.9 ─ 0.1 0.8 4.0 2.8 0.1 3.7 26.4 5.3 72.3 ─ 1.4 Support Measures: EAS Employment Services 0.1 1.0 4.4 ─ 0.1 ─ 12.5 14.5 5.5 12.6 ─ 20.5 84.1 ─ 6.2 Individual Counselling 1.2 0.9 3.9 ─ 0.1 2.3 7.6 13.8 ─ 13.5 66.3 ─ ─ ─ 4.3 Total Support Measures: EAS 0.5 1.0 4.3 ─ 0.1 2.3 11.1 14.2 5.5 12.9 66.3 20.5 84.1 ─ 5.5 Total Benefits and Support Measures: EAS 0.9 1.0 4.1 ─ 0.1 2.1 10.4 9.4 5.0 12.0 56.6 13.8 80.8 ─ 4.9 Indigenous Pan-Canadian 100.0 100.0 100.0 100.0 100.0 100.0 100.0 100.0 100.0 100.0 100.0 100.0 100.0 100.0 100.0 Grand Total, Benefits and Support Measures: EAS 1.9 2.8 5.6 1.6 1.4 5.1 17.1 21.4 6.0 14.8 64.9 37.9 82.7 100.0 7.5 - Source: Participant dataset.
- 1 In 2013/2014, Newfoundland and Labrador implemented a one-stop employment services delivery model, which included the introduction of a new case management system and ending contracts with third-party providers of employment services. Due to this transition, the 2014/2015 administrative data on clients and interventions presented in this report for the province are estimates, based on partial counts and other sources of information, such as the audited financial statements and temporary transitional data capturing processes for that period. The province has undertaken a supplementary analysis and is adjusting the data collection process of its new system to ensure the data counts for the 2015/2016 MAR are complete.
- 2 All percentages are based on new start interventions only (the number of interventions started in 2014/2015). These reported counts are generally lower than actual numbers because data are collected through self-identification.
-
Annex 3.101 EBSM Designated Members2 – Visible Minorities3
New Starts, by Intervention (%)—2014/2015 N.L. P.E.I. N.S. N.B. Que. Ont. Man. Sask. Alta. B.C. N.W.T Yuk. Nun. NHQ Canada Employment Benefits Targeted Wage Subsidies 1.7 3.0 2.5 1.0 ─ ─ 9.4 ─ 2.0 9.0 16.4 ─ ─ ─ 1.6 Self-Employment ─ 2.5 1.2 1.0 ─ ─ 9.2 4.5 4.2 11.3 7.1 ─ ─ ─ 3.4 Job Creation Partnerships ─ 2.8 1.7 ─ ─ ─ 12.6 ─ 2.0 4.8 ─ ─ ─ ─ 1.8 Skills Development–Regular ─ 3.9 2.5 2.2 ─ ─ 20.1 8.4 4.6 9.6 25.0 ─ 1.4 ─ 2.1 Skills Development–Apprentices ─ ─ 0.1 ─ ─ ─ 0.7 0.6 0.1 0.2 1.3 ─ ─ ─ 0.1 Targeted Earning Supplements ─ ─ ─ ─ ─ ─ ─ ─ ─ ─ ─ ─ ─ ─ ─ Total Employment Benefits 0.2 3.0 1.5 1.3 ─ ─ 7.3 1.6 0.3 3.6 8.9 ─ 1.2 ─ 1.1 Support Measures: EAS Employment Services 0.2 13.2 4.2 4.0 ─ ─ 17.5 9.3 1.9 12.5 ─ ─ 0.7 ─ 5.1 Individual Counselling 0.2 2.1 3.7 3.4 ─ ─ 20.3 8.3 ─ 12.3 18.2 ─ ─ ─ 3.6 Total Support Measures: EAS 0.2 10.5 4.1 3.6 ─ ─ 18.3 8.8 1.9 12.4 18.2 ─ 0.7 ─ 4.6 Total Benefits and Support Measures: EAS 0.2 8.5 3.8 3.0 ─ ─ 17.2 5.8 1.7 11.6 15.9 ─ 0.9 ─ 4.1 Indigenous Pan-Canadian ─ ─ ─ ─ ─ ─ ─ ─ ─ ─ ─ ─ ─ ─ ─ Grand Total–Benefits and Support Measures: EAS 0.2 8.4 3.7 3.0 ─ ─ 15.9 5.0 1.7 11.2 12.9 ─ 0.8 ─ 4.0 - Source: Participant dataset.
- 1 In 2013/2014, Newfoundland and Labrador implemented a one-stop employment services delivery model, which included the introduction of a new case management system and ending contracts with third-party providers of employment services. Due to this transition, the 2014/2015 administrative data on clients and interventions presented in this report for the province are estimates, based on partial counts and other sources of information, such as the audited financial statements and temporary transitional data capturing processes for that period. The province has undertaken a supplementary analysis and is adjusting the data collection process of its new system to ensure the data counts for the 2015/2016 MAR are complete.
- 2 Quebec, and NHQ did not report participation levels for members of the visible minority groups. Therefore, these jurisdictions were excluded from the calculation of the national average.
- 3 All percentages are based on new start interventions only (the number of interventions started in 2014/2015). These reported counts are generally lower than actual numbers because data are collected through self-identification.
-
Annex 3.11 EBSM and Pan-Canadian Activities: Part I – Final Expenditures
In $000s by Intervention—2014/2015 N.L. P.E.I. N.S. N.B. Que. Ont. Man. Sask. Alta. B.C. N.W.T. Yk. Nun. NHQ Canada Self-Employment 738 606 1,668 2,568 7,562 6,312 839 319 893 1,946 252 22 3 – 23,728 Job Creation Partnerships1 824 206 174 2 132 911 310 – 8 194 – – – – 2,761 Skills Development 21,391 6,797 13,156 28,815 49,166 76,247 23,661 22,944 96,017 41,743 929 916 293 – 382,075 TOTAL2 22,953 7,609 14,998 31,385 56,860 83,470 24,810 23,263 96,918 43,883 1,181 938 296 – 408,564 - Source: Benefit and Overpayment System.
- 1 In Quebec, this amount refers only to pan-Canadian activities.
- 2 Totals may not add due to rounding.
-
Annex 3.12 EBSM Final Expenditures
In $000s by Intervention—2014/2015 N.L. P.E.I. N.S. N.B. Que. Ont.1 Man. Sask. Alberta B.C. N.W.T. Yk. Nun. NHQ Canada5 Employment Benefits Targeted Wage Subsidies 7,860 2,135 3,181 9,586 69,792 3,619 317 – 733 5,893 140 8 406 – 103,671 Self-Employment 5,382 1,579 5,626 5,152 25,236 46,160 1,077 301 1,318 10,483 145 58 33 – 102,550 Job Creation Partnerships 8,156 1,381 1,341 – – 7,417 989 – 7,463 6,853 – – – – 33,599 Skills Development 94,319 13,487 37,624 55,142 241,446 193,770 25,224 28,278 74,452 140,459 1,164 1,871 886 – 908,122 Targeted Earning Supplements including Supplément de retour au travail – – – – 1,302 – – – – – – – – – 1,302 Total Employment Benefits 115,716 18,582 47,773 69,880 337,776 250,967 27,607 28,578 83,966 163,687 1,449 1,936 1,326 – 1,149,243 Support Measures: EAS Employment Assistance 4,973 4,686 29,070 11,651 157,270 290,022 7,838 4,692 23,177 92,890 1,281 1,314 1,033 – 629,896 Total Support Measures: EAS 4,973 4,686 29,070 11,651 157,270 290,022 7,838 4,692 23,177 92,890 1,281 1,314 1,033 – 629,896 Sub-Total : Employment Benefits and Support Measures: EAS 120,689 23,268 76,843 81,530 495,045 540,988 35,445 33,270 107,143 256,577 2,730 3,251 2,358 – 1,779,139 Other Support Measures Labour Market Partnerships 1,521 2,143 2,027 7,636 84,546 13,658 5,635 2,401 1,995 6,887 133 – – – 128,582 Research and Innovation – 245 – 673 253 15,843 2,003 184 – 12,909 18 – – – 32,129 Total Other Support Measures 1,521 2,388 2,027 8,310 84,799 29,502 7,638 2,585 1,995 19,796 151 – – – 160,711 Total EBSM— Part II 122,210 25,656 78,870 89,840 579,844 570,490 43,083 35,855 109,138 276,373 2,881 3,251 2,358 – 1,939,850 Overcontribution3 5,782 – – – – – – – – 4,131 240 272 476 – 10,901 Pan Canadian (see details in Annex 3.13) 1,861 225 1,596 1,302 9,086 20,750 14,145 11,253 12,881 13,453 2,475 975 2,314 24,395 116,713 Adjustment4 (13,462) – – (543) – – – – – (4,245) (91) (176) (1,506) (617) (20,640) Total including Pan Canadian 116,390 25,881 80,466 90,600 588,931 591,240 57,228 47,108 122,019 289,712 5,505 4,322 3,642 23,778 2,046,823 Administrative Costs Related to LMDAs5 8,883 2,646 10,112 8,922 58,920 57,058 6,078 6,021 9,594 20,535 1,450 389 787 – 191,394 - Source: provincial/territorial audited statements.
- 1 Expenditures for Ontario TWS (Job Placement with Incentives) were estimated by Ontario. In Ontario's financial statements, actual expenditures for Ontario's TWS-similar interventions were included in total EAS expenditures, because the province has integrated these services in its new employment service model in order to maximize the flexibility of program delivery by third-party service providers. This amount is estimated and may be revised at a later date.
- 2 Totals may not add due to rounding. Includes an additional $750,000 in EI Part II funds made available to Quebec in response to the Lac Mégantic train derailment in 2013.
- 3 Overcontributions will be recovered during 2015/16.
- 4 This adjustment reflects overpayments established, refunds of previous years' expenditures and other accounting adjustments.
- 5 Net Administrative costs include $181 million (salary and non-salary) to administer LMDAs and $10 million for rent.
-
Annex 3.13 EI Part II Pan-Canadian – Final Expenditures1
In $000s by Intervention—2014/2015 N.L. P.E.I. N.S. N.B. Que. Ont. Man. Sask. Alta. B.C. N.W.T. Yk. Nun. NHQ Canada Pan-Canadian - Programming Funds Aboriginal Skills and Employment Training Strategy 1,861 225 1,596 1,302 9,006 20,750 14,145 11,253 12,881 13,453 2,475 975 2,314 1,000 93,238 Labour Market Partnerships - - - - 80 - - - - - - - - 20,590 20,670 Research and Innovation - - - - - - - - - - - - - 2,805 2,805 Grand Total Pan-Canadian 1,861 225 1,596 1,302 9,086 20,750 14,145 11,253 12,881 13,453 2,475 975 2,314 24,395 116,713 - Source: SAP
- 1 Totals may not add due to rounding.
-
Annex 3.141 Returns to Employment and Unpaid Benefits Indicators
2014/2015 Clients Who Returned to Employment2 Unpaid Benefits ($ Millions)2 Targets3 Results Results vs. Targets (%) Targets3 Results Results vs. Targets (%) SD-Apprentices Group Services Other4 Total SD-Apprentices Group Services Other4 Total5 Newfoundland and Labrador 5,600 1,788 ─ 1,510 3,298 59% 24.0 21.2 ─ 4.2 25.4 106% Prince Edward Island 2,195 107 ─ 1,827 1,934 88% 7.3 1.2 ─ 4.9 6.1 83% Nova Scotia 6,000 1,441 191 3,976 5,608 93% 25.0 17.6 1.5 9.3 28.4 114% New Brunswick 7,800 564 ─ 6,907 7,471 96% 28.9 6.1 ─ 21.1 27.3 94% Quebec 50,900 ─ 8,358 51,591 59,949 118% 200.0 ─ 66.5 224.3 290.8 145% Ontario 24,000 12,003 ─ 24,163 36,166 151% 157.0 130.2 ─ 110.7 241.0 153% Manitoba 8,000 2,792 ─ 4,364 7,156 89% 45.0 28.4 ─ 14.7 43.1 96% Saskatchewan 5,500 3,907 63 2,068 6,038 110% 50.0 47.8 0.5 13.3 61.6 123% Alberta 22,500 14,811 ─ 10,934 25,745 114% 215.0 175.9 ─ 91.1 267 124% British Columbia 24,000 7,478 31 12,309 19,818 83% 134.0 86.1 0.2 40.4 126.7 95% Northwest Territories 209 66 ─ 127 193 92% 2.6 1.1 ─ 1.3 2.4 92% Yukon 250 104 ─ 66 170 68% 2.6 1.4 ─ 0.5 1.9 71% Nunavut 140 12 ─ 35 47 34% 0.9 0.2 ─ 0.3 0.5 58% Canada 157,094 45,073 8,643 119,877 173,593 111% 892.3 517.2 68.7 536.1 1,122.0 126% - Source: Results dataset.
- 1 In 2013/2014, Newfoundland and Labrador implemented a one-stop employment services delivery model, which included the introduction of a new case management system and ending contracts with third-party providers of employment services. Due to this transition, the 2014/15 administrative data on clients and interventions presented in this report for the province are estimates, based on partial counts and other sources of information, such as the audited financial statements and temporary transitional data capturing processes for that period. The province has undertaken a supplementary analysis and is adjusting the data collection process of its new system to ensure the data counts for the 2015/2016 MAR are complete.
- 2 ASETS activity resulted in 8,068 returns to employment and $15.5 million in unpaid benefits. These amounts are not included in the provincial totals.
- 3 Targets are for EBSM regular clients only.
- 4 The “Other” category includes all other EBSMs. SD-Apprentices and Group Services are reported separately because a different methodology is used to calculate returns to employment for these two measures.
- 5 Some unpaid benefit figures have been rounded.
-
Annex 3.151 Returns to Employment by EBSM Intervention2
2014/2015 N.L. P.E.I. N.S. N.B. Que. Ont. Man. Sask. Alta. B.C. N.W.T Yuk. Nun. NHQ Canada Employment Benefits Targeted Wage Subsidies 27 236 192 1,334 1,284 432 14 - 4 595 10 - 6 - 4,134 Self-Employment 52 115 319 243 1,237 211 42 19 52 667 14 2 - - 2,973 Job Creation Partnerships 237 73 79 - - 144 58 - 137 254 - - - - 982 Skills Development—Regular 1,037 534 1,007 2,195 8,555 889 663 310 142 1,508 25 16 14 - 16,895 Skills Development—Apprentices3 1,862 107 1,441 1,068 - 12,167 2,954 4,098 14,811 7,834 71 108 12 - 46,533 Targeted Earning Supplements - - - - 1,894 - - - - - - - - - 1,894 Total Benefits 3,215 1,065 3,038 4,840 12,970 13,843 3,731 4,427 15,146 10,858 120 126 32 ─ 73,411 Support Measures: EAS Employment Services 47 655 2,098 1,031 29,764 - 2,107 573 10,599 7,207 3 44 15 - 54,143 Group Services - - 191 - 8,358 - - 63 - 31 - - - - 8.643 Individual Counselling 36 214 281 1,600 8,857 22,323 1,318 975 - 1,722 70 - - - 37,396 Total Support Measures: EAS 83 869 2,570 2,631 46,979 22,323 3,425 1,611 10,599 8,960 73 44 15 ─ 100,182 Total Employment Benefits and Support Measures: EAS 3,298 1,934 5,608 7,471 59,949 36,166 7,156 6,038 25,745 19,818 193 170 47 ─ 173,593 Target 5,600 2,195 6,000 7,800 50,900 24,000 8,000 5,500 22,500 24,000 209 250 140 157,094 Results vs. Targets (%) 58.9% 88.1% 93.5% 95.8% 117.8% 150.7% 89.5% 109.8% 114.4% 82.6% 92.3% 68.0% 33.6% ─ 110.5% - Sources: Results dataset and Common System for Grants and Contributions (CSGC).
- 1 In 2013/2014, Newfoundland and Labrador implemented a one-stop employment services delivery model, which included the introduction of a new case management system and ending contracts with third-party providers of employment services. Due to this transition, the 2014/2015 administrative data on clients and interventions presented in this report for the province are estimates, based on partial counts and other sources of information, such as the audited financial statements and temporary transitional data capturing processes for that period. The province has undertaken a supplementary analysis and is adjusting the data collection process of its new system to ensure the data counts for the 2015/2016 MAR are complete.
- 2 Results associated solely with the ASETS are not available.
- 3 Results for SD-Apprentices do not match those in Annex 3.14. Results presented in this Annex are associated with the last intervention in which a client participated. Employment Benefits participation supersedes participation in Employment Services.
-
Annex 3.16 Incremental Impacts of EBSMs at the National and Provincial Levels
The following presents the results from an analysis of EBSM incremental impacts over three years after participation for active claimants who started participating in 2007-2008 or between 2006 and 2008 (i.e., post-program impacts over three consecutive years between 2008 and 2012 or 2006 and 2012). The national results from this analysis were presented in the 2013/2014 EI MAR. This section of Annex 3 presents the national results as well as those at the provincial levels.
1. Study Objective and Methodology
Incremental impacts of EBSMs represent the direct effect of program participation on participants’ labour market experience (i.e., earnings from employment/self-employment, incidence of employment and use of EI) after participation. The role of the incremental impact analysis is to isolate the effects of participation from other factors such as inflation, economic cycles, layoff, etc. In order to achieve this, the incremental impact analysis compares the labour market experience of participants before and after their participation, with that of non-participants before and after the same period (see diagram).
The analysis covered up to 100% of active and former claimants who started their participation in EBSMs between January 1, 2007 and December 31, 2008 or between January 1, 2006 and December 31, 2008. This analysis was conducted at the national level with participants from the 13 PTs. It was also conducted at the provincial level for 9 provinces. Results were not produced for Quebec since the Quebec Government is responsible for evaluating its LMDA Footnote 1 . As well, it was not possible to produce incremental impacts for the territories because the number of participants was too low to generate reliable results. The 2007-2008 reference period was used at the national level as well as in provinces where the number of participants was sufficient to produce results. The period was extended by one year (2006-2008) in other provinces in order to increase the sample size. Despite adding this year, the number of participants for some EBSMs was still too low to generate impacts for those program and services.
Example of Incremental Impact Calculation 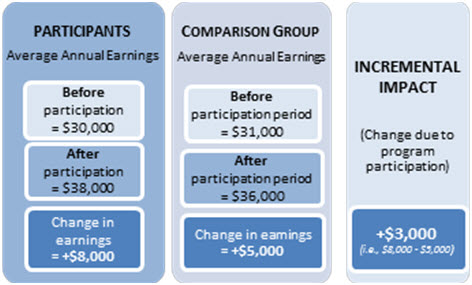
Text description of Example of Incremental Impact Calculation
Participants
Average Annual Earnings-
Before participation
= $30,000 -
After participation
= $38,000 - Change in earnings
= +$8,000
Comparison Group
Average Annual Earnings-
Before participation period
= $31,000 -
After participation period
= $36,000 - Change in earnings
= +$5,000
Incremental Impact
- (Change due to program participation)
- +$3,000
(i.e., $8,000 - $5,000)
The analysis was conducted using linked administrative data from EI Part I and II and the Canada Revenue Agency (CRA). The comparison group was composed of active claimants who were eligible to participate in EBSMs but did not start participation in 2007 or 2008 or between 2006 and 2008.
The impacts of EBSM participation on improving the labour market experience of participants were measured using the following indicators:
- Average earnings from employment and/or self-employment: An increase in earnings indicates that participants improved their employment situation by either working more hours or by having a better paying job than they did before participation.
- Incidence of employment (i.e., incidence of having earnings from employment and/or self-employment): Measures whether participants were more likely to be employed after participation. A gain means that a higher proportion of participants were employed after participation than they would have been if they had not participated or if they had received minimal employment services.
- Amount of EI benefits received: Measures the average amount of EI benefits collected.
- Average number of weeks in receipt of EI: Measures the average number of weeks participants spent on EI.
The same methodology was used at national and at the provincial levels.
2. Results
The following presents results at the national level and for the 9 provinces covered by this analysis. The national results are presented along with a text description to help readers understand how to interpret the results. The provincial results are presented in table format only. Since different reference periods were used at the national level and across provinces (i.e., 2007-2008 or 2006-2008) the results are not directly comparable.
2.1 National Level
The national analysis covered active claimants in the 2007-2008 period. Key results are as follows:
Skills Development (SD): As shown in Table 1 below, SD participants experienced earnings gains in each of the three years after participation but those increases became larger over time. The incremental gains averaged $2,300 per year. Active claimants also had an average incremental increase of 4.7 percentage points in their incidence of employment in the three years following participation. As well, SD participation resulted in lower use of EI benefits. The incremental decreases averaged $400 per year.
Targeted Wage Subsidies (TWS): Active claimants had incremental gains in earnings in each of the three years following the end of their TWS participation averaging $1,300 per year. These gains were accompanied by incremental increases in incidence of employment in each year after participation averaging 6.1 percentage points per year. Most impacts on EI benefits collected were not statistically significant at the 95% level. In this context, it is not possible to draw any clear conclusion about TWS effectiveness in reducing the use of EI after participation.
Self-Employment (SE): Over the three-year period following the end of their participation, active claimants had an average incremental reduction of $10,200 per year in their earnings from employment and/or self-employment and a reduction of 19 percentage points per year in their incidence of employment.
The earnings results should be interpreted with caution, as they may not fully capture the financial situation of participants. Impacts were examined using individual earnings reported in the T1 and T4 taxation files from CRA, and measured relative to active claimants who did not participate in SE and may have been in any employment/unemployment situation following participation (e.g., unemployed, paid employee or self-employed). According to a study from Statistics Canada, self-employed individuals in Canada have a lower average annual income than paid employees ($46,200 versus $52,400 in 2009), but the average net worth of their households is 2.7 times that of the paid employee households, which indicates that some self-employed individuals may leave funds within their business for reinvestment purposes. Footnote 2 Since the incremental impacts of SE were measured relative to a comparison group that also included paid employees and did not take the net worth of participants and comparison cases into account, the results may not be fully reflective of the financial situation of SE participants after their participation.
The incremental impact analysis also shows that SE participants collected $1,600 less in EI benefits per year on average. Those results should also be interpreted carefully since the time worked under self-employment does not allow self-employed Canadians to qualify for regular EI benefits.
Job Creation Partnerships (JCP): Participation in JCP improved active claimants’ earnings by an average of $1,200 per year. They also had incremental increases in the incidence of employment in each of the three years after participation, averaging 4.9 percentage points per year. As well, on average, active claimants collected $300 less in EI benefits annually.
Employment Assistance Services only (EAS-only): Impacts were measured for the active claimants who only participated in EAS without receiving other programs or services. EAS participation was effective at helping active claimants to return to employment. Incremental impact results show that they improved their incidence of employment, while reducing their use of EI in the three year period after participation. Specifically, they had an average incremental gain of 0.6 percentage points per year in their incidence of employment, as well as average incremental decreases of $390 per year in their use of EI benefits.
Active claimants had incremental decreases in their earnings averaging $465 per year. However, the result should be interpreted with caution, as EAS is a short term and low intensity measure that is not focused on human capital development. EAS mostly includes services such as counselling, help with job search, development of return-to-work action plans and, in some cases, very short training such as first aid. In this context, it may not be reasonable to expect that participation in EAS-only would result in improving participants’ earnings. However a recent evaluation on the timing of participation in EAS showed that participants who started their EAS within four weeks after initiating an EI claim had earnings gains in both the short- and medium-term after participation and achieved quicker return to employment.
Table 1. Incremental Impacts at the National Level
(for Active Claimants who Started an EBSM between 2007 and 2008)Indicators Post-program period Average annual impact Total impact 1st year 2nd year 3rd year Skills Development (n=18,025) Earnings ($) 292*** 2,745*** 3,904*** 2,314*** 6,943*** Incidence of employment
(percentage points)3.1*** 5.2*** 5.8*** 4.7*** N/A EI benefits ($) -755*** -298*** -191*** -415*** -1,244*** EI weeks (weeks) -2.3*** -0.9*** -0.5*** -1.2*** -3.7*** Targeted Wage Subsidies (n=9,114) Earnings ($) 1,270*** 1,112*** 1,580*** 1,338*** 4,014*** Incidence of employment
(percentage points)7.7*** 5.3*** 5.6*** 6.1*** N/A EI benefits ($) -32 -55 -209** -99 -296 EI weeks (weeks) 0.3 0.2 -0.3 0.1 0.2 Self-Employment (n=10,220)1 Earnings ($) -11,412*** -9,929*** -9,375*** -10,236*** -30,708*** Incidence of employment
(percentage points)-22.7*** -18.3*** -16.1*** -19.0*** N/A EI benefits ($) -2,038*** -1,473*** -1,172*** -1,561*** -4,682*** EI weeks (weeks) -5.7*** -4.0*** -3.1*** -4.2*** -12.7*** Job Creation Partnerships (n=2,456) Earnings ($) 1,427*** 1,286** 850 1,179** 3,537** Incidence of employment
(percentage points)6.1*** 4.5*** 3.8*** 4.9*** N/A EI benefits ($) -513*** -404*** -44 -320*** -961*** EI weeks (weeks) -0.8** -0.8** 0.3 -0.5 -1.4 Employment Assistance Services (EAS) (n=108,230) Earnings ($) -1,113*** -368*** 87 -465*** -1,395*** Incidence of employment
(percentage points)0.6*** 0.6*** 0.8*** 0.6** N/A EI benefits ($) -512*** -371*** -288*** -390*** -$1,171 EI weeks (weeks) -1.7*** -1.1*** -0.8*** -1.2*** -3.6*** - Significance level *** 1%; ** 5%; * 10%
- 1 1 Earnings results for Self-Employment should be interpreted with caution. They may not fully capture the financial wellbeing of participants. The impacts were examined using individual earnings reported in the T1 and T4 taxation files from CRA, and measured relative to active claimants who did not participate in SE and may have been in any employment/unemployment situation following participation (e.g., unemployed, paid employee or self-employed). According to a study from Statistics Canada, self-employed individuals in Canada have a lower average annual income than paid employees ($46,200 versus $52,400 in 2009), but the average net worth of their households is 2.7 times that of the paid employee households, which indicates that some self-employed individuals may leave funds within their business for reinvestment purposes. Footnote 3 Since the incremental impacts of SE were measured relative to a comparison group that also included paid employees and did not take the net worth of participants and comparison cases into account, the results may not be fully reflective of the financial wellbeing of SE participants after their participation. As well, the decreases in EI use may be due to EI eligibility effect as self-employed Canadians cannot qualify for regular EI benefits.
2.2 Newfoundland and Labrador
Table 2. Incremental Impacts for Active Claimants in Newfoundland and Labrador
(for Active Claimants who Started an EBSM between 2006 and 2008)Indicators Post-program period Average annual impact Total impact 1st year 2nd year 3rd year Skills Development (n=8,611) Earnings ($) $1,820*** $3,836*** $6,477*** $4,046*** $12,139*** Incidence of employment
(percentage points)1.0** 2.5*** 2.9*** 2.1*** N/A EI benefits ($) -$800*** -$319*** -$200*** -$440*** -$1,319*** EI weeks (weeks) -3.4*** -1.8*** -1.4*** -2.2*** -6.6*** Targeted Wage Subsidies (n=728) Earnings ($) $4,229*** $3,331*** $3,234*** $3,598*** $10,795*** Incidence of employment
(percentage points)6.5*** 5.3*** 4.9*** 5.6*** N/A EI benefits ($) -$1,677*** -$1,229*** -$1,055*** -$1,320*** -$3,961*** EI weeks (weeks) -4.4*** -3.1*** -2.5*** -3.3*** -9.9*** Self-Employment (n=314)1 Earnings ($) -$8,102*** -$5,771*** -$5,647*** -$6,507*** -$19,520*** Incidence of employment
(percentage points)-19.9*** -18.3*** -14.8*** -17.7*** N/A EI benefits ($) -$3,860*** -$2,951*** -$2,268*** -$3,026*** -$9,079*** EI weeks (weeks) -12.0*** -8.9*** -7.0*** -9.3*** -27.9*** Job Creation Partnerships (n=1,346) Earnings ($) -$300 -$678 -$837* -$605 -$1,815 Incidence of employment
(percentage points)3.2*** 1.6 2.3** 2.4*** N/A EI benefits ($) -$714*** -$445*** -$116 -$425*** -$1,275*** EI weeks (weeks) -1.0** -0.2 0.9** -0.1 -0.2 Employment Assistance Services (EAS) (n=11,904) Earnings ($) $927*** $2,158*** $2,503*** $1,863*** $5,588*** Incidence of employment
(percentage points)2.0*** 2.2*** 2.1*** 2.1*** N/A EI benefits ($) -$375*** -$176*** -$128** -$226*** -$679*** EI weeks (weeks) -0.9*** -0.3** -0.1 -0.4*** -1.3*** - Significance level *** 1%; ** 5%; * 10%
- 1 See note 1 under table 1.
2.3 Prince Edward Island
Table 3. Incremental Impacts for Active Claimants in Prince Edward Island
(for Active Claimants who Started an EBSM between 2007 and 2008)Indicators Post-program period Average annual impact Total impact 1st year 2nd year 3rd year Skills Development (n=1,516) Earnings ($) $2,635*** $4,591*** $5,054*** $4,091*** $12,273*** Incidence of employment
(percentage points)1.7** 3.0*** 2.6*** 2.4*** N/A EI benefits ($) -$477*** -$393*** -$168 -$346*** -$1,038*** EI weeks (weeks) -1.1*** -1.1** -0.7 -1.0*** -2.9*** Targeted Wage Subsidies Not available due to low sample size. Self-Employment Not available due to low sample size. Job Creation Partnerships Not available due to low sample size. Employment Assistance Services (EAS) (n=1,635) Earnings ($) $426*** $870 $1,089** $795** $2,386** Incidence of employment
(percentage points)1.7** 2.0** 1.0 1.6** N/A EI benefits ($) -$645*** -$330** -$506 -$494*** -$1,481* EI weeks (weeks) -1.8*** -0.6 -1.2*** -1.2*** -3.6*** - Significance level *** 1%; ** 5%; * 10%
2.4 Nova Scotia
Table 4. Incremental Impacts for Active Claimants in Nova Scotia
(for Active Claimants who Started an EBSM between 2006 and 2008)Indicators Post-program period Average annual impact Total impact 1st year 2nd year 3rd year Skills Development (n=4,911) Earnings ($) $3,427*** $5,996*** $7,728*** $5,714*** $17,142*** Incidence of employment
(percentage points)6.3*** 8.3*** 9.7*** 8.1*** N/A EI benefits ($) -$1,051*** -$532*** -$440*** -$675*** -$2,024*** EI weeks (weeks) -3.2*** -1.7*** -1.3*** -2.1*** -6.2*** Targeted Wage Subsidies (n=307) Earnings ($) $3,889*** $2,642** $3,151** $3,228** $9,683** Incidence of employment
(percentage points)6.2** 6.4** 7.7** 6.8** N/A EI benefits ($) -$1,374*** -$834*** -$835** -$1,015*** -$3,044*** EI weeks (weeks) -4.3*** -2.3** -2.5** -3.0*** -9.1*** Self-Employment (n=846)1 Earnings ($) -$10,302*** -$8,752*** -$9,691*** -$9,561*** -$28,683*** Incidence of employment
(percentage points)-29.5*** -25.4*** -22.4*** -25.8*** N/A EI benefits ($) -$2,506*** -$2,116*** -$1,814*** -$2,145*** -$6,436*** EI weeks (weeks) -7.3*** -5.7*** -5.0*** -6.0*** -18.0*** Job Creation Partnerships (n=350) Earnings ($) $571 $543 -$923 $64 $191 Incidence of employment
(percentage points)3.9* -1.1 -1.4 0.5 N/A EI benefits ($) -$664** -$426 -$245 -$445* -$1,335* EI weeks (weeks) -2.3** -1.3 -0.7 -1.4* -4.3* Employment Assistance Services (EAS) (n=9,456) Earnings ($) $177 $1,346*** $1,653*** $1,059*** $3,176*** Incidence of employment
(percentage points)1.2*** 1.9*** 1.4*** 1.5*** N/A EI benefits ($) -$705*** -$579*** -$414*** -$566*** -$1,698*** EI weeks (weeks) -2.3*** -1.7*** -1.2*** -1.7*** -5.1*** - Significance level *** 1%; ** 5%; * 10%
- 1 See note 1 under table 1.
2.5 New Brunswick
Table 5. Incremental Impacts for Active Claimants in New Brunswick
(for Active Claimants who Started an EBSM between 2006 and 2008)Indicators Post-program period Average annual impact Total impact 1st year 2nd year 3rd year Skills Development (n=4,528) Earnings ($) $1,051 $5,158*** $7,120*** $4,443*** $13,328*** Incidence of employment
(percentage points)9.4*** 9.9*** 11.9*** 10.4*** N/A EI benefits ($) -$752*** -$294 $86 -$320* -$960* EI weeks (weeks) -0.8 0.5 0.8 0.2 0.5 Targeted Wage Subsidies (n=388) Earnings ($) $1,998** $1,276 $1,777** $1,684** $5,051* Incidence of employment
(percentage points)7.6*** 6.0*** 7.7*** 7.1*** N/A EI benefits ($) $441 $802** $720** $655** $1,964** EI weeks (weeks) 2.0** 2.9*** 2.2** 2.4*** 7.2*** Self-Employment (n=628)1 Earnings ($) -$9,224*** -$8,154*** -$7,771*** -$8,383*** -$25,149*** Incidence of employment
(percentage points)-26.7*** -26.1*** -20.2*** -24.3*** N/A EI benefits ($) -$3,297*** -$2,804*** -$2,512*** -$2,871*** -$8,613*** EI weeks (weeks) -8.6*** -7.0*** -6.1*** -7.2*** -21.7*** Job Creation Partnerships JCP was not delivered in New Brunswick during the observed period. Employment Assistance Services (EAS) (n=12,841) Earnings ($) $1,636*** $2,528*** $2,668*** $2,277*** $6,832*** Incidence of employment
(percentage points)3.1*** 3.7*** 3.8*** 3.5*** N/A EI benefits ($) -$117 $6 $183* $24 $72 * EI weeks (weeks) 0.0 0.5* 1.0*** 0.5** 1.5* - Significance level *** 1%; ** 5%; * 10%
- 1 See note 1 under table 1.
2.6 Ontario2
Table 6. Incremental Impacts for Active Claimants in Ontario
(for Active Claimants who Started an EBSM between 2007 and 2008)Indicators Post-program period Average annual impact Total impact 1st year 2nd year 3rd year Skills Development (n=17,015) Earnings ($) -$1,959*** $379 $1,607*** N/A N/A Incidence of employment
(percentage points)4.2*** 5.4*** 6.0*** 5.2*** N/A EI benefits ($) -$799*** -$233*** -$187*** -$406*** -$1,219*** EI weeks (weeks) -2.3*** -0.6*** -0.5*** -1.1*** -3.4*** Targeted Wage Subsidies (n=2,530) Earnings ($) $2,176* $2,439* $2,650* $2,479** $7,437** Incidence of employment
(percentage points)7.3*** 11.3*** 8.6*** 9.1*** N/A EI benefits ($) $442* $61 -$104 $133 $399 EI weeks (weeks) 1.4* 0.2 0.0 0.6 1.7 Self-Employment (n=3,731)1 Earnings ($) -$10,930*** -$9,433*** -$8,575*** -$9,646*** -$28,937*** Incidence of employment
(percentage points)-23.9*** -18.4*** -14.5*** -18.9*** N/A EI benefits ($) -$1,681*** -$1,099*** -$794*** -$1,191*** -$3,573*** EI weeks (weeks) -4.7*** -2.9*** -2.0*** -3.2*** -9.6*** Job Creation Partnerships (n=668) Earnings ($) $2,248* $3,513*** $3,290** $3,017** $9,051** * Incidence of employment
(percentage points)7.3*** 7.2*** 5.8*** 6.8*** N/A EI benefits ($) -$518* -$381 $70 -$276 -$829 EI weeks (weeks) -1.9*** -1.2* -0.3 -1.1** -3.4* Employment Assistance Services (EAS) (n=35,302) Earnings ($) -$654*** $465*** $895*** $235 $706 Incidence of employment
(percentage points)2.8*** 3.1*** 3.3*** 3.1*** N/A EI benefits ($) -$669*** -$280*** -$162*** -$370*** -$1,111*** EI weeks (weeks) -2.2*** -0.7*** -0.5*** -1.1*** -3.3*** - Significance level *** 1%; ** 5%; * 10%
- 1 See note 1 under table 1.
- 2 In Ontario, participation in SD is up to three years in length. In the incremental impact analysis, the participation period is defined as two years. As a result, participants may still be in training during the first year of post-program results. Therefore, it is not unexpected to observe incremental decreases in earnings, as participants are not available for full time work in year 1 and will be transitioning into employment in year 2. To interpret trends for Ontario, the third year is the most relevant period to consider for incremental impacts. As a result, the average annual impact and total impact are not applicable for Ontario.
2.7 Manitoba
Table 7. Incremental Impacts for Active Claimants in Manitoba
(for Active Claimants who Started an EBSM between 2006 and 2008)Indicators Post-program period Average annual impact Total impact 1st year 2nd year 3rd year Skills Development (n=3,750) Earnings ($) $3,387*** $5,971** $7,032** $5,461** $16,384** Incidence of employment
(percentage points)10.6** 10.1** 11.8** 10.8** N/A EI benefits ($) -$546*** -$458*** -$212** -$405*** -$1,215*** EI weeks (weeks) -1.8*** -1.3*** -0.6** -1.2*** -3.7*** Targeted Wage Subsidies (n=339) Earnings ($) -$1,345 -$768 -$86 -$722 -$2,166 Incidence of employment
(percentage points)6.9* 2.6 2.7 4.1 N/A EI benefits ($) -$407 -$751** -$251 -$470 -$1,409 EI weeks (weeks) -1.4 -1.8 -0.5 -1.3 -3.8 Self-Employment (n=517)1 Earnings ($) -$12,450*** -$9,940*** -$9,231*** -$10,540*** -$31,621*** Incidence of employment
(percentage points)-26.6*** -21.3*** -19.1*** -22.3*** N/A EI benefits ($) -$1,364*** -$1,177*** -$999*** -$1,180*** -$3,541*** EI weeks (weeks) -3.8*** -3.0*** -2.5*** -3.1*** -9.3*** Job Creation Partnerships (n=286) Earnings ($) $4,126*** $4,655*** $5,029*** $4,470*** $13,409*** Incidence of employment
(percentage points)8.1*** 7.5*** 9.9*** * 8.5*** N/A EI benefits ($) -$549** -$427 -$130 -$369* -$1,106* EI weeks (weeks) -1.8** -1.7** -0.6 -1.4** -4.1* Employment Assistance Services (EAS) (n=15,131) Earnings ($) -$320 $266 $407* $118 $353 Incidence of employment
(percentage points)2.8*** 3.5*** 1.7*** 2.7*** N/A EI benefits ($) -$363*** -$235*** -$253*** -$284*** -$851*** EI weeks (weeks) -1.4*** -0.8*** -0.8*** -1.0*** -3.0*** - Significance level *** 1%; ** 5%; * 10%
- 1 See note 1 under table 1.
2.8 Saskatchewan
Table 8. Incremental Impacts for Active Claimants in Saskatchewan
(for Active Claimants who Started an EBSM between 2006 and 2008)Indicators Post-program period Average annual impact Total impact 1st year 2nd year 3rd year Skills Development (n=1,375) Earnings ($) $2,299*** $5,189*** $6,961*** $4,839*** $14,517*** Incidence of employment
(percentage points)5.8*** 6.4*** 6.5*** 6.2*** N/A EI benefits ($) -$401*** -$223** $83 -$180** -$541** EI weeks (weeks) -1.0*** -0.7*** 0.1 -0.5** -1.6** Targeted Wage Subsidies Not available due to low sample size. Self-Employment Not available due to low sample size. Job Creation Partnerships JCP was not delivered by Saskatchewan during the observed period. Employment Assistance Services (EAS) (n=5,269) Earnings ($) -$371 $731** $1,381*** $580** $1,741** Incidence of employment
(percentage points)1.9*** 2.1*** 0.9 1.6*** N/A EI benefits ($) -$442*** -$332*** -$278*** -$351*** -$1,052*** EI weeks (weeks) -1.3*** -1.0*** -0.8*** -1.0*** -3.1*** - Significance level *** 1%; ** 5%; * 10%
2.9 Alberta
Table 9. Incremental Impacts for Active Claimants in Alberta
(for Active Claimants who Started an EBSM between 2006 and 2008)Indicators Post-program period Average annual impact Total impact 1st year 2nd year 3rd year Skills Development (n=2,356) Earnings ($) -$121 $1,044 $2,359** $1,108 $3,324 Incidence of employment
(percentage points)9.3*** 10.0*** 10.6*** 10.0*** N/A EI benefits ($) -$277* $137 $42 -$33 -$98 EI weeks (weeks) -1.0** 0.2 0.0 -0.3 -0.7 Targeted Wage Subsidies Not available due to low sample size. Self-Employment (n=658)1 Earnings ($) -$13,493*** -$12,430*** -$13,046*** -$12,990*** -$38,970*** Incidence of employment
(percentage points)-14.7*** -14.4*** -13.9*** -14.3*** N/A EI benefits ($) -$971*** -$658*** -$308* -$646*** -$1,938*** EI weeks (weeks) -2.4*** -1.6*** -0.8* -1.6*** -4.9*** Job Creation Partnerships (n=521) Earnings ($) $144 -$950 -$1,144 -$650 -$1,950 Incidence of employment
(percentage points)7.0*** 9.8*** 3.7 6.8*** N/A EI benefits ($) $314 * $616*** $503** $478*** $1,433*** EI weeks (weeks) 0.9 1.6*** 1.4** 1.3*** 4.0** Employment Assistance Services (EAS) (n=20,997) Earnings ($) -$969*** -$627** -$602** -$733*** -$2,198*** Incidence of employment
(percentage points)1.7*** 1.6*** 0.8* 1.4*** N/A EI benefits ($) -$530*** -$253*** -$164*** -$315*** -$946*** EI weeks (weeks) -1.5*** -0.6*** -0.4*** -0.8*** -2.5*** - Significance level *** 1%; ** 5%; * 10%
- 1 See note 1 under table 1.
2.10 British Columbia
Table 10. Incremental Impacts for Active Claimants in British Columbia
(for Active Claimants who Started an EBSM between 2007 and 2008)Indicators Post-program period Average annual impact Total impact 1st year 2nd year 3rd year Skills Development (n=4,090) Earnings ($) $2,560*** $5,559*** $6,395*** $4,824*** $14,471*** Incidence of employment
(percentage points)5.8*** 7.2*** 6.9*** 6.6*** N/A EI benefits ($) -$768*** -$448*** -$173** -$463*** -$1,389*** EI weeks (weeks) -2.3*** -1.3*** -0.5*** -1.4*** -4.1*** Targeted Wage Subsidies (n=1,491) Earnings ($) $3,121*** $3,141*** $3,756*** $3,319*** $9,957*** Incidence of employment
(percentage points)7.1*** 5.9*** 6.5*** 6.5*** N/A EI benefits ($) $113 -$161 -$111 -$53 -$158 EI weeks (weeks) 0.5 -0.3 -0.4 -0.1 -0.2 Self-Employment (n=1,764)1 Earnings ($) -$10,521*** -$8,450*** -$7,806*** -$8,915*** -$26,746*** Incidence of employment
(percentage points)-17.7*** -13.8*** -13.1*** -14.8*** N/A EI benefits ($) -$1,723*** -$1,155*** -$735*** -$1,204*** -$3,613*** EI weeks (weeks) -4.7*** -3.1*** -1.8*** -3.2*** -9.5*** Job Creation Partnerships Not available due to low sample size. Employment Assistance Services (EAS) (n=28,985) Earnings ($) -$511*** $299*** $801*** $196 $589 Incidence of employment
(percentage points)3.6*** 2.6*** 3.0*** 3.0*** N/A EI benefits ($) -$507*** -$337*** -$298*** -$381*** -$1,142*** EI weeks (weeks) -1.7*** -0.9*** -0.8*** -1.1*** -3.4*** - Significance level *** 1%; ** 5%; * 10%
- 1 See note 1 under table 1.
-
Before participation