
Employment Insurance Monitoring and Assessment Report 2014/2015: Chapter III - Impacts and Effectiveness of Employment Benefits and Support Measures (EBSMs – Part II of the Employment Insurance Act)
Introduction
Activities delivered under Part II of the Employment Insurance (EI) Act help unemployed individuals in Canada prepare for, find and maintain suitable employment. Under the umbrella of Employment Benefits and Support Measures (EBSMs), these activities include similar programs delivered by provinces and territories under Labour Market Development Agreements (LMDAs), as well as the Government of Canada's pan-Canadian programming and functions of the National Employment Service (NES).
This chapter presents EBSM program results achieved under Part II of the EI Act during the 2014/2015 reporting period. A national overview of EBSM-similar programming, delivered under the LMDAs and by Aboriginal Skills and Employment Training Strategy (ASETS) agreement holders, is provided in section I, entitled "National Overview". Provincial and territorial employment programming activities are presented in section II, "Provincial and Territorial Summaries", with a description of each jurisdiction's labour market and employment priorities. Section III presents the results of an analysis of the incremental impacts of LMDAs for the "long-tenured workers" EI claimant type and a cost-benefit analysis of all LMDAs. Finally, section IV discusses the results of Employment and Social Development Canada's (ESDC's) delivery of pan-Canadian activities, and the administration of certain NES functions.
Notes to Readers
- The data used to analyze EBSM activities were collected from provinces, territories and ASETS agreement holders. Accordingly, the data were processed through several systems using a variety of sources. Governments are continuing to improve data quality and collection to ensure accurate, reliable and consistent information. While all data sets are verified before publication, systems and operational changes may affect the comparability of data from year-to-year. These instances are noted, where applicable.
- Throughout this chapter, references to average levels of activity, and highs and lows generally use the 10-year period from 2004/05 to 2014/2015 as a frame of reference.
- Statistics Canada's Labour Force Survey (LFS) is the source of labour market data reported herein. Data for Canada and the provinces are fiscal-year averages, calculated using seasonally unadjusted data, while monthly references are seasonally adjusted. Data for the Northwest Territories, Yukon and Nunavut are calculated using unadjusted three-month moving average monthly data. In discussions of employment trends by industry, standard industry titles are taken from the North American Industry Classification System (NAICS).
- Real GDP data and other non LFS macroeconomic indicators are from Statistics Canada's Economic accounts. Forecasts are based on published analysis from the Bank of Canada, the Conference Board of Canada, Canadian Banks, OECD and Statistics Canada, as well as on internal analysis, using information available as of February 2016.
1. National Overview
1.1 Context
1.1.1 Economic Conditions
Canada's real growth domestic product (GDP) rose moderately by 2.4% in 2014, slightly above the 2.1% growth recorded in 2013. At the subnational level, the strongest real GDP growth in 2014 was recorded in the Northwest Territories (+5.9%) followed by Alberta (+4.5%), Nunavut (+3.6%), British Columbia (+2.6%) and Ontario (+2.5%). Growth rates in Manitoba (+2%), Saskatchewan (+1.6%), Prince Edward Island (+1.5%), Quebec (+1.4%), and Nova Scotia (0.7%) were below the national average. New Brunswick (-0.3%), Yukon (-0.8%) and Newfoundland and Labrador (-2.3%) all experienced negative growth.
The Canadian economy experienced a mild recession through the first half of 2015. For the whole year, Canada's real GDP growth will likely be around 1.2%. The sharp decline in crude oil prices has weighed on the Canadian economy. Since peaking at $107USD per barrel in June 2014, oil prices have experienced a steady decline, averaging under $50 USD per barrel in the first quarter 2015 Footnote 1 . This drop has had an impact on Canada's energy sector, as high-cost oil producers responded by cancelling capital projects, decreasing drilling activities and laying off workers.
In 2014, Canada's economy was driven mainly by an increase in household final consumption expenditure (+2.8%), as outlays on goods (+3.4%) and services (+2.2%) both advanced. Spending on durable (+5.3%), semi-durable (+3.6%) and non-durable (+2.4%) goods all increased. Household disposable income (in current dollars) grew by 3.4%, the slowest pace in five years. As a result, the household saving rate declined from 5.2% in 2013 to 4.0% in 2014.
In 2014, exports rose by 5.4% after increasing 2.0% in the previous year. Exports of goods rose by 6.0%, while those of services were 2.3% higher. Imports grew 1.7%, following a 1.3% increase the previous year. The imports of goods increased by 2.4% and were partially offset by a 1.3% decline in imports of services.
Governments' gross fixed capital formation decreased (-2.3%) for the fourth consecutive year, amid fiscal constraint among many of the provincial and territorial governments throughout 2014/2015.
Mining and oil and gas extraction, as well as manufacturing, were the main contributors to overall growth in goods production (+2.4%). Construction and utilities also grew. The gains were partly offset by a decrease in the agriculture and forestry sectors, pulled down by falling crop production following strong growth in 2013. Wholesale and retail trade; finance and insurance; the public sector (education, health and public administration combined); transportation and warehousing services; professional services; as well as accommodation and food services, contributed to the increase in the service-producing sector (+2.4%).
In 2014, Canada's business productivity grew by 2.5%, following a gain of 1.2% in the previous year. Business productivity increased in every province and territory except Yukon, Newfoundland and Labrador, and New Brunswick. Growth in business productivity was above the national average in Nunavut (10%) and British Columbia (3%), while Alberta (2.6%), Quebec (2.5%), Ontario (2.4%) and Saskatchewan (2.3%) were similar to the national growth rate. Business productivity remained unchanged in New Brunswick, while Yukon and Newfoundland and Labrador declined by -10% and -1.5%, respectively.
Compared internationally, Canada's annualized real GDP growth is forecasted at 2.4% for 2014, which is above the OECD average of 1.8%. Among the G-7 countries, Canada's 2014 forecast ranks second—along with that of the United States—only behind the United Kingdom's. For 2015, Canada's ranking is expected to slip, with a real GDP growth rate of just over 1%. The United Kingdom, the United States and Germany are projected to experience stronger growth. Footnote 2 Lower oil prices have had a net negative impact on Canada's economy, while creating large regional differences. According to the Conference Board of Canada, Canada's oil industry is expected to post a pre-tax loss of $2.1 billion in 2015, compared to a profit of close to $6 billion the previous year. Footnote 3
1.1.2 Labour Market Context
Overall, labour market conditions improved in Canada for a fifth consecutive year, with employment levels reaching an all-time high of 17.8 million, and a net gain of 103,000 jobs recorded in 2014/2015. This represented a 0.6% year-over-year increase. In addition, both full-time and part-time employment jobs expanded, by 0.4% and 1.2%, respectively. The work force expanded by 1.1% to a total of 29.06 million, while the labour force grew at a rate of 0.4% (19.1 million).
1.1.3 Client Trends
Provinces and territories supported a lower number of LMDA clients (-3.1%) accessing EBSM interventions in 2014/2015. All three client type counts declined, as EI active claimants dropped by 2.7%, former clients edged down by 6.0% and non-insured clients decreased by 2.7%. The share of active clients (49.3%) edged down by 0.2 percentage points year-over-year, while former clients (12.5%) dropped by 0.4 percentage points. The share of non-insured clients increased by 0.2 percentage points to a total of 38.2%, representing an all-time high, as provinces and territories increasingly provided Employment Assistance Services (Support Measures) to non-insured clients.
1.1.4 Trends in Program Delivery
In 2014/2015, the number of EBSM interventions delivered by provinces, territories and Indigenous organizations decreased by 2.8%. Both Employment Benefits and Support Measures were down year-over-year, -4.8% and -2.7% respectively. Support Measures, which represented 86.8% of all interventions, increased in their share by 0.3 percentage points as clients relied more heavily on short-term interventions for quicker returns to work in a strengthening labour market.
Canada: EBSM Key Facts
| EI Active & Former |
Non-Insured | Pan-Canadian1 |
|---|---|---|
431,794
|
257,665
|
15,378
|
| Active | Former | Non-Insured |
| 49.3%
|
13.3%
|
37.4%
|
| Youth (15-24)2 |
Core Age (25-54) |
Older Workers (55+) |
| 19.4% - | 68.1%
|
12.5%
|
| 2014/2015 | Year-over-Year Change |
|
|---|---|---|
| Employment Benefits | 142,389 | 4.8%
|
| Support Measures: EAS | 936,144 | 2.7%
|
| Pan-Canadian | 28,217 | 7.0%
|
| 2014/2015 | Year-over-Year Change |
|
|---|---|---|
| Employment Benefits | 13.2% | 0.2
|
| Support Measures: EAS | 86.6% | 0.2
|
| 2014/2015 ($ Million) |
Year-over-Year Change |
|
|---|---|---|
| Employment Benefits | $1,149.2 | 2.4%
|
| Support Measures: EAS | $629.9 | 6.1%
|
| LMPs and R&I | $160.7 | 1.2%
|
| Pan-Canadian | $116.7 | 0.2%
|
| Total Expenditures3 | $2,056.6 |
0.5%
|
| Indicator | Total | Year-over-Year Change |
|---|---|---|
| Active Claimants Served | 339,795 | 2.6%
|
| Returns to Employment (active and former clients) |
173,593 | 1.0%
|
| Unpaid Benefits ($ Million) | $1,121.98 | 5.7%
|
- 1 EI Part II Pan-Canadian services to individuals are through the Aboriginal Skills and Employment Training Strategy.
- 2 Age distribution does not equal 100%, as the "unknown" category is not reported here. Date of birth is not collected for clients in SD-Apprentices and Group Services.
- 3 Totals may not add up exactly due to rounding; does not include accounting adjustments.
1.2 Main Results
Provinces, territories and Indigenous organizations helped a total of 689,459 clients prepare for, obtain and maintain employment during the 2014/2015 reporting period. This represented a 3.0% drop year over year. Canada's unemployed accessed a declining number (1,106,750) of EBSM interventions (-2.8% year over year). Accordingly, the ratio of the number of interventions per client increased slightly to 1.61, compared with 1.60 in the previous year. The number of EI active and former claimants returning to employment after participation in EBSM-similar programming rose to 173,593 (+1.0%), while unpaid benefits from the EI Operating Account increased significantly, reaching $1,121,980 in 2014/2015 (+5.7%).
1.2.1 Canada's Labour Market
Key Labour Market Indicators
In 2014/2015, Canada's labour market recorded soft but continued growth. Employment edged up by 0.6% adding 103,000 jobs, compared to 1.2% growth the previous year. Unemployment fell by 2.3% year over year (-30,600), bringing Canada's unemployment rate down to 6.9%. This was the first fiscal year since 2008/09 with an unemployment rate below 7%.
For a second consecutive year, the employment rate edged down in 2014/2015, dropping to 61.4%. As well, the labour market participation rate declined to 65.9%, a drop of 0.5 percentage points, the lowest rate since 2000/01. While the economy has continued to expand since the 2008-2009 recession, the downward trending participation rate will likely remain in place over the medium term as the baby-boomer generation enters retirement with fewer labour market entrants to replace them.
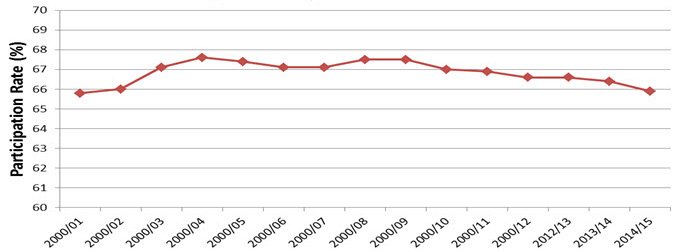
Show Data Table
| Year | Participation rate (%) |
|---|---|
| 2000/2001 | 65.8 |
| 2000/2002 | 66 |
| 2000/2003 | 67.1 |
| 2000/2004 | 67.6 |
| 2000/2005 | 67.4 |
| 2000/2006 | 67.1 |
| 2000/2007 | 67.1 |
| 2000/2008 | 67.5 |
| 2000/2009 | 67.5 |
| 2000/2010 | 67 |
| 2000/2011 | 66.9 |
| 2000/2012 | 66.6 |
| 2012/2013 | 66.4 |
| 2013/2014 | 65.9 |
| 2014/2015 | 66.5 |
Source: Labour Force Survey
In 2014/2015, employment gains were concentrated in the services-producing sector (+128,000), which more than offset the employment losses in the goods-producing sector (-25,000). All goods-producing industries recorded employment losses with the exception of construction, which experienced a growth of 3,900 net jobs. The manufacturing sector is often seen as the segment of the Canadian economy that benefits the most from the fall in oil prices through its weakening effect on the Canadian dollar. However, the export growth has been weaker than initially anticipated, holding back potential job gains. The services-producing sector was sustained by strong employment increases in: health care and social assistance (+42,400); accommodation and food services (+35,400); and, educational services (+30,200). Employment losses in the services-producing sector were observed in: other services (-12,200); information, culture and recreation (-4,700); and business, building, and other support services (-1,600).
Labour Market Tightness
According to Statistics Canada's Business Payroll Survey (BPS)
Footnote 4
, Canadian businesses reported on average 235,300 job vacancies in 2014/2015, representing a 10% increase compared to the 214,000 average reported in 2013/14. In absolute terms, growth in the number of job vacancies was concentrated in Ontario, Quebec, and British Columbia, which respectively registered increases of 14,200 (21.8%), 4,700 (11.6%) and 4,400 (14.7%). Job vacancies declined in Alberta (-2,800 or -5.8%) and Manitoba (-1,300 or -12.8%) and remained relatively constant in other provinces.
Over the same period, the number of unemployed persons across Canada was 1.317 million, compared to 1.348 million in 2013/14, a decrease of 2.3% year-to-year Footnote 5 . The largest drops in unemployed persons were recorded in Ontario (-23,800), British Columbia (-11,200) and Quebec (-2,800). Alberta and Newfoundland & Labrador saw the largest increase in the unemployed, with jumps of 9,500 and 1,000 respectively.
Labour market tightness is often assessed using the unemployment-to-job vacancies (U/V) ratio Footnote 6 . In 2014/2015, 5.6 individuals sought employment for every job vacancy, compared to 6.3 a year earlier. The decrease in the U/V ratio (number of unemployed people for every vacant position) suggests employers face more challenges in filling job vacancies, as the number of unemployed workers shrinks, or they are increasingly unable to find the required skills for their job openings.
| 2013/14 | 2014/2015 | Year-To-Year Change |
|
|---|---|---|---|
| Number of Unemployed | 1.348 Million | 1.317 Million | -2.3% |
| Number of Job Vacancies | 214,000 | 235,300 | +10% |
| Unemployment-to-Vacancy Ratio | 6.3 | 5.6 | -11.1% |
At the subnational level, the largest drop in the U/V ratio was observed in Prince Edward Island, sliding from 17.3 to 8.8 year-over-year. Moderate U/V ratio drops were also registered in Nova Scotia (from 10 to 8.4), Ontario (from 8.5 to 6.7) and British Columbia (from 5.3 to 4.3), pointing to a tightening labour market year-over-year. New Brunswick, Manitoba and Alberta recorded modest increases (0.3, 0.5 and 0.5, respectively) in their U/V ratios, suggesting greater slack in the labour market compared to 2013/14. Nonetheless, Alberta and Manitoba continued to register among the lowest U/V ratios in Canada (2.7 and 4.1, respectively) pointing to tight labour markets.
Since 2011/12, the national U/V ratio decreased modestly, from 5.8 to 5.6 as the number of unemployed persons has been on a steady decline (-5.4%). This suggests an overall tightening of the Canadian labour market over this period. Footnote 7 The trend is expected to continue in the coming years as large cohorts of workers begin to retire, with fewer younger workers to replace them.
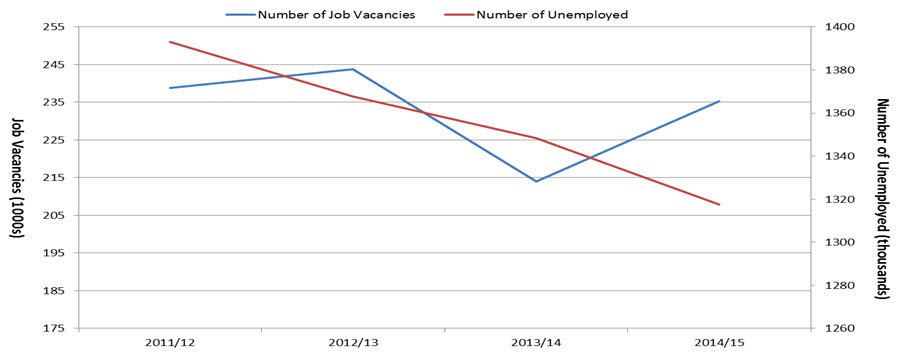
Show Data Table
| 2011/2012 | 2012/2013 | 2013/2014 | 2014/2015 | |
|---|---|---|---|---|
| Job Vacancies (thousands) | 238.8 | 243.85 | 214 | 235.325 |
| Number of Unemployed (thousands) | 1392.93 | 1367.78 | 1348.35 | 1317.48 |
Share of Job Vacancies by Industry
Of the annual average of 235,300 BPS job vacancies reported in 2014/2015, the following industries showed the most vacancies:
- health care and social assistance (39,800; 16.9%);
- accommodation and food services (31,100; 13.2%);
- retail trade (26,700; 11.3%);
- manufacturing (17,000; 7.2%); and
- construction (16,000, 6.8%).
Compared against their employment growth Footnote 8 in 2014/2015, these industries were among the strongest to record employment gains: health care and social assistance employment grew by 2.0%; accommodation and food services increased by 1.9%; retail trade was up 0.7%, and construction employment increased by 3.5%. Manufacturing employment dropped by 0.3%, despite being ranked as the 4th highest Canadian industry in terms of job vacancies over the same period.
Across all industries, finance and insurance (1.6), as well as health care and social assistance (1.3), posted the lowest U/V ratios. This suggests tighter labour market conditions in those industries than all others. Conversely, the highest U/V ratios were recorded in arts, entertainment and recreation (8.6), mining, quarrying, and oil and gas (7.6) and educational services (7.6). The high ratio points to more unemployed persons relative to job vacancies in those industries across Canada.
Job vacancy rates and unemployment rates by province
Among all provinces, Western Canada registered the highest job vacancy rates (i.e., the share of jobs that are unfilled out of all payroll jobs available) and lowest unemployment rates. Despite the recent downturn in Alberta's and Saskatchewan's resource sector, the two provinces posted the highest job vacancy rates and lowest unemployment rates as both goods and service-producing sectors of the two economies recorded employment growth. Manitoba's growth in key sectors like manufacturing, agriculture and construction had a positive impact on the labour market. The province registered an unemployment rate of 5.4%, which is well below the Canadian average. In Quebec and Ontario, slow growth in the provinces' trade sectors triggered some slack in the labour markets. Atlantic Canada's relatively high unemployment rates and low job vacancy rates suggested a significant mismatch between available job seekers and job vacancies.
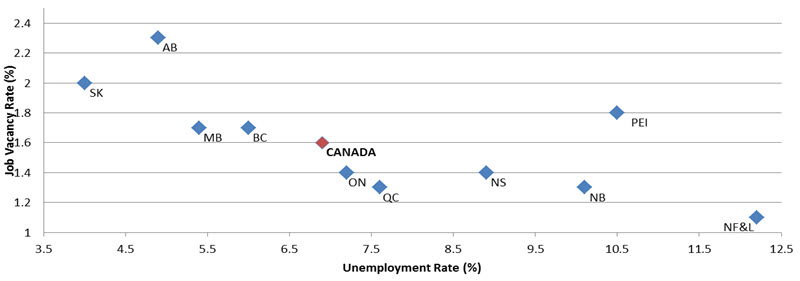
Show Data Table
| Area | Job Vacancy Rate (%) | Unemployment Rate (%) | |
|---|---|---|---|
| Canada | 1.6 | 6.9 | |
| Newfoundland and Labrador | 1.1 | 12.2 | 11.6 |
| Prince Edward Island | 1.8 | 10.5 | 11.5 |
| Nova Scotia | 1.4 | 8.9 | 9 |
| New Brunswick | 1.3 | 10.1 | 10 |
| Quebec | 1.3 | 7.6 | 7.7 |
| Ontario | 1.4 | 7.2 | 7.5 |
| Manitoba | 1.7 | 5.4 | 5.5 |
| Saskatchewan | 2 | 4 | 4.2 |
| Alberta | 2.3 | 4.9 | 4.6 |
| British Columbia | 1.7 | 6 | 6.5 |
Sources: Statistics Canada; Labour Force Survey, and Business and Payroll Survey.
Skills in Demand – Employment Growth by Skill Type
Footnote 9
In 2014/2015, employment in Canada grew by 103,000, to a total of 17.8 million; an increase of 0.6% compared to the previous year. By skill type, the largest proportional employment growth occurred in:
- Sales and Service Occupations (+59,300 or +1.4%)
- Natural and Applied Sciences and related occupations (+47,400 or +3.6%)
- Education, Law and Social, Community and Government Services (+23,600 or 1.2%)
- Art, Culture, Recreation and Sport (+13,300 or +2.5%)
- Health Occupations (+10,000 or +0.8%).
Employment declines were recorded in: management (-65,300 or -4.0%) and natural resources, agriculture, and related production occupations (-3,200 or -0.8%).
1.3 Client Profile and Participation
The number of EBSM clients decreased by 3.0% in 2014/2015, reaching a total of 689,459 as a result of improving labour market conditions in the Canadian economy. All three client type counts dropped: active claimants (-2.6%), former (-5.6%) and non-insured (-2.7%).
1.3.1 Client Types
Three client types can access EBSMs: active claimants, former claimants and non-insured clients. In 2014/2015, the distribution of client types continued to reveal an upward trend from the non-insured clients among provinces and territories. Their share of all clients increased to an all-time high of 38.2% (increase of 0.2 percentage points), while active clients increased by 0.2 percentage points to a total of 49.3% and former clients saw their share decrease to 12.5% from 12.9% in the previous year.
Since 2005/06, the number of non-insured clients has increased by 50.9%, while those of active and former claimants have declined by 6.1% and 3.3%, respectively. The rising numbers in non-insured clients can be attributed to the increasing reliance of provinces and territories on using Support Measures for quicker, short-term interventions to support the unemployed in finding jobs when they may otherwise face challenges in searching for employment on their own.
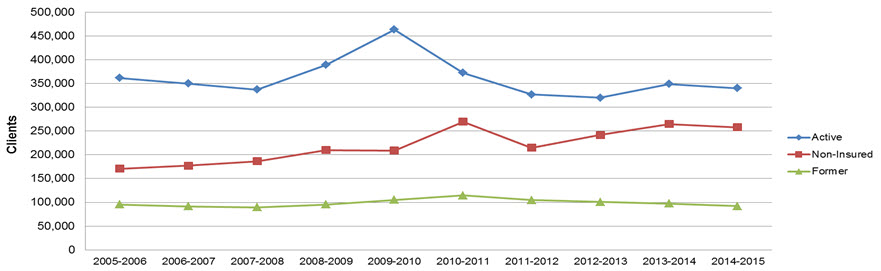
Show Data Table
| Clients | 2005/2006 | 2006/2007 | 2007/2008 | 2008/2009 | 2009/2010 | 2010/2011 | 2011/2012 | 2012/2013 | 2013/2014 | 2014/2015 |
|---|---|---|---|---|---|---|---|---|---|---|
| Active Clients | 361,490 | 349,865 | 337,148 | 388,714 | 463,158 | 372,340 | 326,892 | 319,904 | 348,909 | 339,795 |
| Non-Insured Clients | 170,714 | 176,879 | 186,159 | 209,871 | 209,020 | 269,350 | 214,587 | 241,834 | 264,716 | 257,665 |
| Former Clients | 95,499 | 91,458 | 89,315 | 95,468 | 104,972 | 114,356 | 104,816 | 100,522 | 97,417 | 91,999 |
Active claimants are those who had an active EI Part I regular claim when they requested assistance under Part II of the Employment Insurance Act. Typically, they have stronger recent labour force attachment and tend to be able to return to work more quickly than those with weaker ties to the labour market. Active claimants who are job ready often seek out short-term interventions under EI Part II to find their next employment opportunity. Others require longer-term Employment Benefits to upgrade their skills, establish certification or refine their job search strategies.
In total, the number of active claimants served in Canada declined to 339,795, a year-over-year decrease of 2.6%. Their share of all clients increased slightly (+0.2 percentage points) to 49.3% year over year. The proportion of active claimants returning to work after participating in an EBSM-similar programming was 45.8%, compared to 43.6% in 2013/14.
Former claimants are those who completed an EI claim in the past three years, or who began a parental or maternity claim in the preceding five years. They are no longer eligible for EI Part I; however, they remain eligible for EI Part II under certain criteria. Footnote 10 Former claimants do not receive income support under Part I of the Employment Insurance Act while they complete an Employment Benefit intervention; however, they may receive Part II support while completing their return-to-work action plan.
During the 2014/2015 reporting period, the number of former claimants fell to 91,999 (-5.6%) year over year. In addition, their share of all EBSM clients declined to 12.5% (-0.4 percentage points). The number of former claimants returning to work decreased moderately (-3.0%), to a total of 22,424, which represents 24.4% of the 91,999 former claimants served.
Non-insured clients are unemployed individuals who are neither active nor former EI claimants and usually have little substantive or recent labour force attachment. They include new labour force participants and individuals who were formerly self-employed. While these clients are not eligible for Employment Benefits under EI Part II, they may access interventions similar to EAS.
In 2014/2015, the numbers of non-insured clients dropped by 2.7%, to reach 257,665. However, their share among all client types increased to 37.4% (+0.2 percentage points). Since the 2004/05 reporting period, the share of non-insured clients has jumped by 13.2 percentage points, whereas the other two client types witnessed their share of total clients decline over the same time. Overall, 41,954 non-insured clients returned to work in 2014/2015 following their EBSM participation, a 6.5% increase from the previous year. Footnote 11
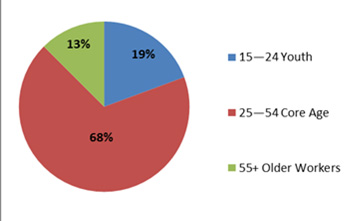
1.3.2 Age Distribution Footnote 12
Consistent with the growth of Canada's senior population, the older workers category (55+ years) was the only age group to experience growth in EBSM usage. This category increased by 5% with 73,170 clients served. Its share of the total age distribution increased by 0.9 percentage points, reaching 12.5%. In the last decade, older workers have consistently increased their share among all EBSM clients, reflecting greater use of active employment programs to improve their employability. Older workers' participation in the labour market reflects these trends; a cohort that now represents 35% of Canada's labour population. In 2014/2015, the labour population of older workers surpassed 10 million, on the strength of rapid growth in the last 10 years that added 1.5 million older workers into the workforce. This represents a 66% growth in this age group, which is significantly higher than any other age group. Consistent with these trends, older workers are increasingly reliant on employment supports, consistent with their growing share of Canada's labour force.
Show Data Table
| # | % | |
|---|---|---|
| 15–24 Youth | 113,492 | 19.4% |
| 25–54 Core Age | 399,428 | 68.1% |
| 55+ Older Workers | 73,170 | 12.5% |
| Unknown | 130 | 0.0% |
| Total | 586,220 | 100.0% |
In 2014/2015, the labour population of older workers surpassed 10 million, on the strength of rapid growth in the last 10 years that added 1.5 million older workers into the workforce. This represents a 66% growth in this age group, which is significantly higher than any other age group. Consistent with these trends, older workers are increasingly reliant on employment supports, consistent with their growing share of Canada's labour force.
The total number for the core-aged workers (25-54 years old) dropped by 3.7% year over year to 399,428. The share of the core-aged workers, as a proportion of all age groups, decreased by 0.9 percentage points to 68.1% in 2014/2015. Among core-aged workers, all the subgroups experienced drops with the largest declines among the 50-54 year olds (-4,462 or -7.1%). This trend among core-aged workers is consistent with labour market indicators: the total number of the unemployed among the core-aged workers declined by 20,000 (-2.7%) year over year. As well, the group's unemployment rate (5.7% in 2014/2015) has also continued on a downward trend since the recent high of 7.2% in 2009/10.
Following two years of growth, youth (15-24 year olds) participation decreased by 3,359 or -2.9% year-over-year, for a total of 113,492 youth clients. Its relative share remained unchanged at 19.4% year-over-year. Although youth continue to face struggles in the labour market, their employment prospects are beginning to improve. In 2014/2015, the youth unemployment rate dropped to 13.3%. This is a general downward trend observed in the last five years, since the youth unemployment rate hit a generational high of 15.6% in 2009/10. Other indicators of improved conditions for youth in 2014/2015 include employment being up by 14,400 year-over-year and unemployment being down by 8,000 in the same period. The Youth employment rate and participation rate are up for the second straight year, reaching 55.7% and 64.3%, respectively.
1.3.3 Designated Groups Footnote 13
ESDC collects information on the EBSM participation of women, Indigenous people, members of visible minorities and persons with a disability in support of employment equity principles.
- Women participated in a total of 471,765 EBSM interventions in 2014/2015, a 2.9% decrease year over year. Women represented 44.1% of all participants, slightly lower than their share in 2013/14. Similar to the previous year, the vast majority of women (92.1%) accessed EAS interventions, while their male counterparts had a lower rate of EAS participation (81.8%). This trend is explained by the lower participation of women in the Skills Development Apprentice program, and by the fact that women are more likely to work in part-time occupations, which results in lower EI eligibility rates and, therefore, less access to Employment Benefits. Overall, 47.7% of female EBSM participants were non-insured this year, compared with 37.4% of male EBSM participants.
- A total of 104,063 EBSM participants self-identified as persons with a disability. The share of persons with a disability increased 0.6 percentage points to 9.7%. Non-insured clients represented 57% of this client segment, a slight increase of 0.1 percentage points, year over year.
- Indigenous people participated in 79,687 EBSM interventions. This represented 5.1% more than the previous year. Indigenous people participated in 7.5% of all EBSM interventions delivered in 2014/2015, including programming delivered through ASETS. A total of 38.3% of Indigenous clients participated as non-insured clients. As a share of participation in all interventions delivered to Indigenous clients, Employment Benefits increased from 3.8% to 3.9% year over year.
- Members of visible minority groups participated in 42,788 interventions, a significant drop of 23.1% over year. Corresponding with this decline, visible minorities' share of total EBSM participants dropped to 4%, a 1.1 percentage point slide year-over-year. It is worth noting that representation rates may be influenced by changes in self-identification behaviour and recent demographic trends.
1.3.4 Official Languages
ESDC furthers the commitment of the Government of Canada to foster the full recognition and use of both English and French in Canadian society by ensuring that labour market programs and services are delivered in both official languages. In this context, all LMDAs contain commitments by provinces and territories to have programs and services delivered in both official languages where there is sufficient demand.
LMDA programming continues to evolve, with provinces and territories adapting program design and service delivery to meet local needs. ESDC is working with provinces and territories to improve the capture of official languages related data, in order to better assess how official languages requirements are being met.
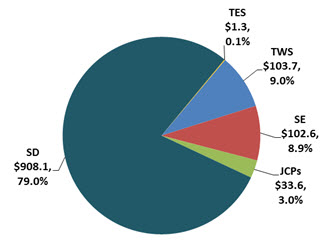
1.4 Interventions: Employment Benefits
Employment Benefits are available only to insured clients (active and former claimants). Historically, Employment Benefits have consisted of longer-term interventions focused on providing skills or work experience required to regain employment. Under LMDAs, provinces and territories provide employment benefits similar to the following six benefits types: Skills Development-Regular (SD-R); Skills Development-Apprentices (SD-A); Targeted Wage Subsidies (TWS); Self-Employment (SE); Job Creation Partnerships (JCPs); and Targeted Earnings Supplements (TES).
Show Data Table
| $ | % | |
|---|---|---|
| TWS | 103,671 | 9.0% |
| SE | 102,550 | 8.9% |
| JCPs | 33,599 | 2.9% |
| SD | 908,122 | 79.0% |
| TES | 1,302 | 0.1% |
| Total | 1,149,244 | 100.0% |
Total Employment Benefits interventions declined for a fourth consecutive year, reaching 142,389. In addition, Employment Benefits interventions lasted an average of 2 days longer, a 1.9% increase compared with the previous reporting period. At 13.2% of all EBSMs, the share of Employment Benefits continues to decline year over year, reflecting a focus on shorter-term interventions to help unemployed people return to work quickly. Employment Benefits expenditures totalled $1.15 billion, a decline of 2.4% from the previous year.
1.4.1 Skills Development
Skills Development (SD) is the most common Employment Benefit delivered under LMDAs. This benefit helps insured clients cover the cost of gaining the new skills they often need when facing a career change. In 2014/2015, the use of SD-Regular (SD-R) interventions fell significantly by 10.1% year over year, to 49,091. Also, the share of SD-R of all benefits trended downwards for a fifth consecutive year, dropping to 34.5%. In comparison, the number of SD-Apprentice (SD-A) interventions increased by 4.1%, to 68,437. Corresponding with this increase, the share of SD-A edged up to 48.1%, due to steady demand for skilled trades across Canada. SD expenditures saw a decline of $46.3M (-4.9%) for a total of $908 million.
EBSMs in Action:
Skills Development-Regular
Yukon
Yukon uses the SD-R program to assist eligible participants obtaining skills for employment, ranging from basic to advanced skills, through direct assistance to individuals to cover certain costs associated with taking a course/program or instruction or training. Eligible participants are those individuals who meet the 'Insured Participant' definition as per the Employment Insurance Act and who have been identified by a case manager as having insufficient employment or marketable skills to successfully obtain employment. The key principles of the program include: reinforcement that if participants plan their future development, commit to an action plan and contribute to the implementation of the plan are most likely to succeed; the action plan identifies lack of marketable skills as an employment barrier, and demonstrates that a SD-R intervention will support re-entry into employment; the level of assistance accorded to an eligible participant to take a course, program of instruction or training is negotiated; providing a mechanism that allows participants to make an appropriate financial contribution to the costs of the intervention where required; and, demonstrating that training activity supports the participants' ability to enhance their skills to obtain and maintain a job.
EBSMs in Action:
Skills Development-Apprentices
Ontario
Ontario's SD-Apprentices program provides temporary financial assistance to eligible apprentices who participate in full-time classroom training. As apprentices do not work for the duration of their in-class training, they may experience a significant financial impact during this portion of their apprenticeship training program. Participants include individuals currently eligible for Employment Insurance benefits or who were in receipt of Employment Insurance benefits in the past three to five years. Although the majority of training occurs in the workplace, the in-classroom training component is critical to apprentices' success as it provides them with the theoretical training that supports the practical on-the-job training. Full-time classroom training can be up to eight weeks in length and typically occurs two to three times during an apprenticeship training program. Along with basic living costs, this program provides personal supports, which includes dependent care allowance, travel allowance, living-away-from-home assistance and disability allowance.
Alberta
Skills Development-Apprentices benefits provide financial assistance to individuals to make their own arrangements to obtain skills for employment, including apprenticeship training. Alberta's apprenticeship and industry training is an industry-driven system that ensures Alberta has a highly skilled, professional and internationally competitive workforce in more than 50 designated trades and occupations. The Alberta Apprenticeship and Industry Training Board works with industry to set training and certification standards. The Board makes recommendations to the government to meet the needs of Alberta's labour market for skilled and trained workers, and the designation of trades and occupations. The Government of Alberta's priority is to ensure that the over 60,000 apprentices currently engaged at various stages in their learning career successfully meet the requirements for journeyman certification, and are therefore able to contribute to the continued growth of Alberta.
Nunavut
The Adult Learning and Training Supports (ALTS) program remains the flagship labour market program for skills development for apprentices and non-apprentices in the territory. Under ALTS, apprentices access support for technical training. Other non-apprentice clientele access ALTS to pursue training that responds to labour market demand and opportunity.
1.4.2 Targeted Wage Subsidies
Targeted Wage Subsidies encourage employers to hire individuals they would not normally hire, giving them a chance to complete a successful career transition. In 2014/2015, TWS interventions decreased considerably by 7.2% year over year, to 11,643. The share of TWS of all Employment Benefits interventions dropped to 8.2%. While total expenditures for TWS increased by 28.3% to $103.7 million, reflecting rising average cost per intervention in most jurisdictions, the duration of TWS interventions decreased, on average, by 0.6% year over year.
EBSMs in Action:
Targeted Wage Subsidies
Yukon
Yukon supports the Targeted Wage Subsidy (TWS) program, which assists individuals who lack work experience by enhancing their skills through employment. A wage subsidy is provided to the employer to hire someone they would not normally hire in the absence of a subsidy. Individuals who are approved for TWS may include individuals who do not have recent work experience, who may require substantial employer training, and/or who might have difficulty getting their "foot in the door" for other reasons. Employment offered under the TWS provides individuals with full-time (may be part-time for persons with disabilities) on-the-job work experience. Wages earned by the individual are insurable and provided directly by the employer. The employer is then reimbursed with a subsidy for a specified percentage of the wage. Financial assistance may be provided to employers to cover the costs associated with employment related costs (including workers' compensation actual costs). However, in most cases, employers are encouraged to cover such costs. The duration and level of subsidy are based on the needs of the participant. The TWS is intended to off-set costs related to hiring the individual and is not intended to resolve an employer's human resource or cash-flow problem. The expectation is that normally the subsidy will lead to permanent employment with the TWS employer.
1.4.3 Self-Employment
The Self-Employment intervention helps insured clients start their own businesses, through counselling and development related to launching a new business. In 2014/2015, participation in SE decreased by 8.3%, to 7,361 interventions. SE's share of total benefits interventions edged down slightly to 5.2% (-0.2 percentage points). Corresponding with these trends, SE total expenditures decreased by $8.5 million (-7.7%) for total of $102.5 million in 2014/2015.
EBSMs in Action:
Self-Employment
New Brunswick
The Self-Employment (SE) program helps insured clients start their own businesses, through counselling and development related to launching a new business or becoming a self-employed worker. New Brunswick's Workforce Expansion Self-Employment Benefit Program helps unemployed individuals create a job for themselves by starting a new business. The program provides various types of support during the initial development phase of the business including financial assistance, coaching and ongoing technical advice. Coaching is tailored to meet individual needs and can include subjects such as business plan development, accounting, and marketing. This program is delivered in partnership with non-profit, private and/or public organizations.
1.4.4 Job Creation Partnerships
Job Creation Partnerships provide EI-insured clients with work experience while helping the community and local economy. Provinces and territories delivered a significant increase (+9.5%) of JCP interventions, totalling 3,165. JCPs' share of total benefits interventions edged up by 0.3 percentage points for a total 2.2%. JCP expenditures reached $33.6 million (+19.4%), an increase of $5.5 million.
EBSMs in Action:
Targeted Wage Subsidies
British Columbia
Job Creation Partnerships (JCP) provides EI-insured clients with work experience while helping the community and local economy. In British Columbia, a number of JCP projects were funded to provide individuals with opportunities to gain work experience leading to ongoing employment. These include:
- Qatuwas 2014: Participants were members of the Heiltsuk First Nations community, who worked on the preparation, production, and post-production of the cultural celebration of canoe culture of Coastal First Nations. Their activities include building bleachers, kiosks, signage, harvesting and preparing traditional cuisine and making ceremonial gifts. Participants gained skills in event preparation while also connecting to their cultural legacy.
- Lake Babine Timber: Participants took part in a 47-week project to build firewood storage sheds and two timber bridges, as well as to perform general timber cutting. The Lake Babine First Nation plans to build a biomass plant for heating homes in the area. Participants gained skills in forestry and carpentry that should prepare them for participating in building the biomass plant.
- Plan@t: Participants with disabilities assessed and provided accessibility ratings for various Lower Mainland business for the Rick Hansen Foundation Plan@t website. People can use this site to search and review the accessibility of places worldwide.
1.4.5 Targeted Earnings Supplements
Targeting Earning Supplements provide insured clients with incentives to accept employment. In 2014/2015, Quebec offered TES-similar programming through its Return to Work Supplement program. This TES-similar benefit supported 2,692 participants in 2014/2015, a significant drop of 53.3% decrease year over year. In line with the drop in the number of interventions delivered, Quebec's total expenditure for this benefit fell 54.4% to $1.3 million.
1.5 Interventions: Support Measures
Part II of the Employment Insurance Act authorizes three support measures: Employment Assistance Services (EAS), Labour Market Partnerships (LMPs), and Research and Innovation (R&I). Through LMDAs, provinces and territories deliver these measures at the regional and local levels, while ESDC retains responsibility for pan-Canadian delivery of LMPs and R&I (see section IV of this chapter). Support Measures are available to all unemployed individuals in Canada, including non-insured clients; however, LMPs and R&I are generally not associated with direct client service and therefore do not have participants or interventions. Delivered by the provinces and territories, the EAS component of the Support Measures provides a full range of self-help and assisted services, such as help with determining career objectives through employment counselling; improving job search techniques; completing a return-to-work action plan; and accessing labour market information in support of career choices.
1.5.1 EAS Interventions
Provinces and territories design and deliver interventions similar to EAS, which are available to all unemployed people in Canada. In addition to helping EI-insured clients, EAS interventions provide crucial support to those who have been absent from the labour market for an extensive period or who have low labour market attachment. They may also support new immigrants or young people who are entering the Canadian labour market. These interventions are reported in one of the three following categories: Employment Services, Group Services, and Individual Counselling. In 2014/2015, a total of 936,144 EAS interventions were delivered, a notable year-over-year decrease of 2.7%. This decline reflects improving labour market conditions and less reliance by unemployed workers to require short-term active employment measures. However, its relative share of all EBSM interventions increased to 86.8% in 2014/2015; an increase of 0.3 percentage points year over year. Total expenditures on EAS increased to 629.9 million (+6.1%) in 2014/2015.
1.5.1.1 Employment Services
Interventions similar to Employment Services continued to be the most common EAS intervention type at 61.8% of all EAS interventions in 2014/2015. A total of 578,292 Employment Services interventions were provided to unemployed individuals in Canada, which represents a decline of 2.7% compared to 2013/14. Compared to 2009/10, a year during which provinces and territories were addressing unemployment peaks stemming from the recession, the number of Employment Services interventions is down by 44,652 or 7.2% in 2014/2015.
EBSMs in Action:
Employment Assistance Services
Manitoba
The Employment Assistance Service (EAS) program provides employment assistance to unemployed and underemployed Manitobans to help with career counselling and job search. Manitoba delivers EAS directly through 13 provincially operated Manitoba Jobs and Skills Development Centres, as well as indirectly through a vast network of third party service providers. In addition to supporting mainstream service providers that deliver services to all Manitobans, the province partners with a select number of specialized agencies to assist immigrants and refugees in various communities with large newcomer communities, including Winnipeg, Brandon, Steinbach, Winkler and Morden. These agencies provide tailored supports to address the employment needs of newcomers, such as offering multilingual services. In 2014/2015, these agencies assisted nearly 1,000 newcomers.
Yukon
Yukon's EAS program assists eligible participants to find and obtain employment, or to develop the skills necessary to maintain employment. Eligible recipients are individuals from businesses (including crown corporations), organizations (formal, ad hoc or partnerships), municipalities, First Nation organizations, governments and councils, public health and post-secondary educational institutions. Eligible participants are those who are unemployed, legally entitled to work in Canada and available for and actively seeking employment. Clients work with their case manager in a collaborative process in order to assess, plan, and facilitate activities and services that will meet the employment needs of the Participant. Each step in the case management process is important in developing an action plan that accurately reflects the participant's circumstances, existing skills, employment barriers and the related interventions. An action plan must be developed with the active input and agreement of both the participant and the case manager.
Newfoundland and Labrador
Fiscal 2014/2015 was the first full year in which Newfoundland and Labrador delivered EAS through its internal service delivery network for the majority of its clients, following the decision in 2013 to internalize the supports and services previously offered through third-party contracts for EAS. In an effort to improve access for clients, Newfoundland and Labrador has enhanced and promoted the use of on-line application for service, and on-line courses and workshops. In 2013, the Employment and Training Assessment (ETA) was introduced to allow clients to complete an on-line guided self-assessment of employment readiness and apply for employment and training supports. As well, a series of on-line workshops are available to assist individuals in their career and employment planning process, and to assist employers with a host of human resource related needs were developed in conjunction with the Bluedrop CoursePark Learning Management System (CPLMS). In 2014/2015, 3,570 workshops were accessed by individuals and employers.
Nunavut
Clients in Nunavut can receive face-to-face Employment Assistance Services through Career Development Officers (CDO) located in one of three regional offices in Pangnirtung, Rankin Inlet and Cambridge Bay, or in the communities of Arviat, Baker Lake, Igloolik, Iqaluit, and Kugluktuk. Career Development Officers are responsible for conducting community visits to locales where a CDO is not physically located. Clients can also contact the regional offices via a toll-free number.
1.5.1.2 Group Services
Group Services dropped significantly by 19.5% for a total of 37,849 interventions delivered in 2014/2015. In this context, the share of Group Services of all EAS-type interventions decreased by 0.9 percentage points for a total 4.0%.
1.5.1.3 Individual Counselling
In addition to being the initial intervention for establishing action plans and potential access to Employment Benefits, Individual Counselling can be an important measure for multi-barriered clients. A total of 320,003 Individual Counselling interventions were supported in 2014/2015. This represented a drop of 0.4% year over year. Individual Counselling accounted for 34.2% of all EAS interventions, edging up from its 33.4% share in 2013/14. The use of Individual Counselling is consistent with the increased numbers of multi-barriered clients, who access EBSM-similar programming following short-term unemployment, as well as an indication of the participation of displaced workers. Footnote 14
1.5.2 Labour Market Partnerships
The Labour Market Partnership (LMP) initiative facilitates the collaboration of employers, employee and employer associations, community groups, and communities to develop solutions to labour force imbalances such as persistent high unemployment or skill shortages. LMP expenditures contracted for a second consecutive year, dropping significantly to a total of $128.6 million in 2014/2015 (-10.5%). Almost all jurisdictions made noticeable investments in LMP initiatives in 2014/2015, with strongest commitments made by Quebec, Ontario, Prince Edward Island, New Brunswick, British Columbia and Manitoba.
EBSMs in Action:
Labour Market Partnerships
Ontario
Ontario's LMP funding provides financial assistance to local communities, employers, sector groups and employee and employer associations to aid the development and implementation of strategies that address and respond to labour force adjustments, local economic development and human resource planning needs. For example, funding was provided to an Employment Ontario service provider in Windsor that is seeking to better understand the challenges that employers face in recruiting, hiring and retaining women in the skilled trades. This funding allowed them to identify strategies that increase employment and also identify potential policy strategies that promote women's employment in the trades. Funding was also provided to a community stakeholder with a background in addressing labour market issues to determine common success factors for people who were able to find a job match and begin an apprenticeship. In addition, the project explored whether there are differences in success factors between industries or specific trades based on considerations such as level of education, related training, and willingness to travel.
Nova Scotia
In 2014/2015, LMP funding in Nova Scotia was used exclusively for the Sector Council Program—a cooperative partnership between Labour and Advanced Education and various industry sector organisations to support human resource development, attraction and retention, and training. The purpose of the Sector Council Program is to support an industry-led approach to human resource development tailored to meet the labour market needs of industry sectors. The program focuses on ensuring that small- and medium-sized enterprises in Nova Scotia have increased access to expertise, resources and support in the area of human resource planning. The three priority areas of the program include human resource planning; attraction and retention; and, training. The sector council program was created as a 3 year pilot program, and an evaluation was competed in the final year of the pilot. Results from the evaluation have shown that the objectives laid out in the program were the correct ones, and that the 3 year funding model allowed for strategic planning and investments, and for the ability to reach the employer community. The program received a great deal of support and is planned to continue.
Northwest Territories
In the Northwest Territories, LMP funding supports Skills Canada-NWT to assist with their mission to promote careers in skilled trades and technology for northern youth. The organization pursues this mission through community-based skills clubs, youth conferences, regional skills competitions, and a territorial skills competition, as well as taking a team to the annual Skills Canada National Competition. The organization also hosts career expos with its competitions and offers presentations about careers in skilled trades. Skills Canada-NWT is well positioned to link youth, employers, and educators. The organization works with stakeholders in many sectors including education, government, and industry.
Saskatchewan
In partnership with New Brunswick, Community Based Organizations, and the Canadian Career Development Foundation, Saskatchewan contributed to evidence-based research for the Career Development field of practice. Launched in July 2014 and concluded in 2015, Transforming the Culture of Evaluation in Career and Employment Services, Common Indicators Project-Phase II, was conducted by the Canadian Career Development Foundation. It focused on determining changes job seekers experience as a result of career and employment programs and services. The study identified the types of interventions and delivery methods best suited to achieve outcomes with EI eligible job seekers. In Saskatchewan, 31 career practitioners and 249 job seekers participated. The project provided a model and incremental resources to enhance career practitioners' skills and professional competence to better serve Saskatchewan job seekers. Furthermore, the project served to enhance Saskatchewan's evaluation of how career and employment programs and services respond to the needs of diverse job seekers, help job seekers make meaningful progress in the employability dimensions and connect to employment.
1.5.3 Research and Innovation
Research and Innovation (R&I) initiatives identify better ways of helping people prepare for, return to or maintain employment, and participate productively in the labour force. In 2014/2015, all jurisdictions with R&I programs increased investments in this area, more than doubling expenditures from $15.1 million to $32.1 year over year. Five provinces and territories Footnote 15 used $21 million in LMDA funding through R&I projects to test the reach and impact of the Canada Job Grant (CJG). The CJG encourages employer involvement and investment in training by providing financial assistance to employers on a cost-shared basis to help Canadians develop the skills needed for available jobs.
EBSMs in Action:
Research and Innovation (R&I) Activities
Prince Edward Island
Prince Edward Island continues to support R & I projects to identify creative ways of helping Islanders prepare for, return to or keep employment and become productive participants in the labour force. In the context of higher rates of youth unemployment, the province continues to develop strategies to ensure youth are well informed about future career opportunities and have the support to make successful transitions to training and employment. In 2014/2015, collaboration between the province's secondary and post-secondary systems resulted in the development of the Student Graduation and Transition Planner. This pilot project is designed to assist all secondary students with planning their graduation pathways, post-secondary transitions and labour market attachment. The Student Graduation and Transition Planner will include career planning tools that focus on pertinent labour force information. The objective is to permit more informed career pathway choices and a foundation to empower secondary students to engage in a comprehensive, personalized three-year planning process of personal and career goals during their secondary school years. Teachers, students, parents/guardians, and post-secondary partners will work together to ensure informed educational and career transition goals are developed and articulated.
Ontario
Using R&I funding, in 2014/2015, Ontario launched the Canada-Ontario Job Grant, working with small, medium and large enterprises to establish pilot approaches that encourage employers to take a greater role in skills training and workforce development investments. The three pilots were:
- Canada-Ontario Job Grant: the program helps businesses purchase short-term training for new or existing workers that will help meet workforce performance needs.
- Canada–Ontario Job Grant: Customized Training Pilot: supports partnerships between employers and training institutions to develop and implement new-firm-specific technical or essential skills where no such training exists.
- Canada–Ontario Job Grant: UpSkill Pilot: supports partnerships between employers and training providers to develop and deliver sector-specific integrated and technical skills training to meet employers' needs, specifically targeting low and medium skilled occupations.
Following the launch, Ontario estimated approximately 2,500 clients would benefit from training under this new program in the first year.
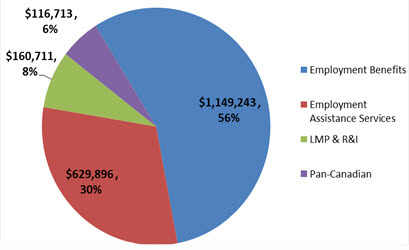
1.6 Expenditures
In 2014/2015, total expenditures under Part II of the Employment Insurance Act increased by 0.5% to $2.06 billion. Footnote 16 Of that amount, Employment Benefits remained the largest category of expenditures, representing 55.9% of the total, while its relative share decreased by 1.6 percentage points from last year. LMPs and R&I increased by 1.2% to a total of $160.1 million. EAS expenditures increased 6.1%, representing a greater share of overall expenditures (30.6%, or an increase of +1.6 percentage points). Pan-Canadian expenditures remained unchanged with a slight drop of $242,000 for a total of $116.7 million (-0.2%).
Show Data Table
| 2013/2014 | ||
|---|---|---|
| $ | % | |
| Employment Benefits | 1,149,243 | 56% |
| Employment Assistance Services | 629,896 | 31% |
| LMP & R&I | 160,711 | 8% |
| Pan-Canadian | 116,713 | 6% |
| Total | 2,056,563 | 100% |
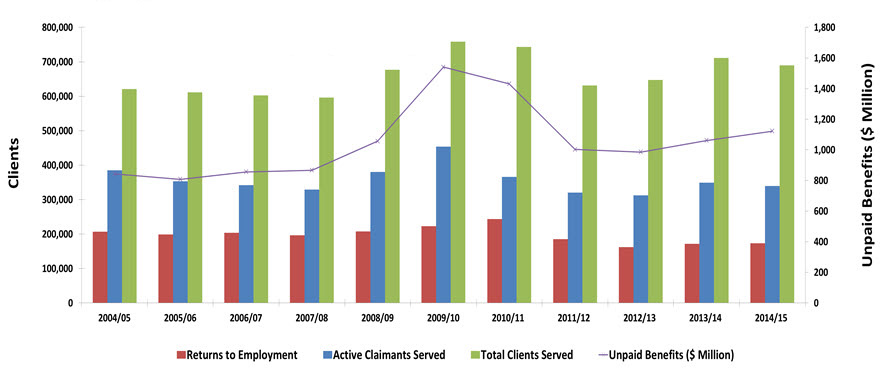
1.7 Key Performance Indicators Footnote 17
ESDC monitors the results of EBSM-similar programming delivered by provinces and territories through three key performance indicators:
- the number of active EI claimants served; Footnote 18
- the number of EI clients (active and former) who return to employment following an intervention; Footnote 19 and
- the amount of unpaid EI Part I benefits resulting from the returns to employment.
Show Data Table
| 2004/2005 | 2005/2006 | 2006/2007 | 2007/2008 | 2008/2009 | 2009/2010 | 2010/2011 | 2011/2012 | 2012/2013 | 2013/2014 | 2014/2015 | |
|---|---|---|---|---|---|---|---|---|---|---|---|
| Returns to Employment | 207,073 | 198,727 | 203,692 | 196,498 | 207,927 | 222,526 | 243,476 | 185,029 | 161,993 | 171,956 | 173,593 |
| Active Claimants Served | 385,213 | 353,542 | 342,145 | 329,127 | 380,181 | 453,781 | 365,978 | 320,006 | 312,553 | 348,909 | 339,795 |
| Total Clients Served | 620,787 | 611,420 | 602,157 | 595,910 | 676,842 | 758,761 | 724,907 | 631,522 | 647,127 | 711,042 | 689,459 |
| Unpaid Benefits ($ Million) | $843.08 | $807.47 | $856.30 | $866.90 | $1,056.70 | $1,540.30 | $1,430.40 | $1,002.86 | $985.44 | $1,061.50 | $1,121.98 |
In 2014/2015, the three main performance indicators overall reflected Canada's labour market performance. The number of clients (173,593) employed increased by 1.0% year over year, while number of active claimants served (332,099) dropped by 2.7%. As a result, unpaid benefits ($1,122 million) increased by 5.7%. That said, the average length of an Employment Benefits intervention increased by 2 days (106 days), stemming from duration increases for all benefits.
1.8 Early Interventions with EI clients
The Government of Canada is committed to working with interested provinces and territories to make active employment supports available to EI claimants earlier in their claim, and to study the impacts of such measures. In 2013/14, this included Collaboration Projects with British Columbia and Manitoba, which tested the impact of early interventions in the delivery of active measures on EI claimants. Results suggest that the Collaboration Projects were most effective when early interventions focused on clients with relatively high re-employment potential.
These results complement internal evaluation work, previously mentioned in the 2013/14 EI MAR, on the timing of participation in EAS. This study showed that participants who started their intervention within four weeks after initiating an EI claim achieved quicker returns to employment and had earnings gains in both the short and medium term after participation.
Such evidence provided the rationale for the development of a national Targeting, Referral and Feedback (TRF) tool to help provinces and territories identify and target EI applicants for employment programming based on local labour market needs. Similar tools for targeted interventions have been implemented in the United States, Australia and Denmark to support unemployed individuals with active employment services. The Province of Québec pioneered the development of the TRF with the Government of Canada, and in 2014 implemented an improved national TRF system. British Columbia also implemented the TRF system in the fall of 2015 to promote early interventions with clients.
2. Provincial and Territorial EBSM Activities
This section analyzes the provincial and territorial economic environment and EBSM-similar activities in 2014/2015, linking trends in clients served, interventions and expenditures to local labour market conditions, as well as employment programming priorities.
2.1 Context
To address their unique labour market challenges, provinces and territories deliver employment programming under LMDAs, which were individually negotiated with the Government of Canada. Under the LMDAs, provinces and territories receive funding to support the delivery of programs and services that are similar to the EBSMs established in Part II of the EI Act. Footnote 20 Provinces and territories design and deliver virtually all EI-funded employment programming, with the exception of pan-Canadian activities, which are discussed in Section IV of this chapter.
In 2014/2015, most provinces and territories recorded modest to moderate economic growth. In this context, the demand for EBSM-similar programming in most jurisdictions decreased, as observed in declining numbers of all client types (active, former, and non-insured), stemming from somewhat improving labour market conditions. In terms of interventions, all Employment Benefits declined, with the exception of Skills Development-Apprentices and Job Creation Partnerships, which saw a moderate increase. For provinces and territories, apprentice training remains an integral component as a means of preparing their workforce for skilled trades.
Provinces and territories continued to identify an aging workforce, and skills and labour shortages, as the key labour market challenges they planned to address with EBSM-similar programming. They also focused on developing and delivering skills training to meet current and future skills requirements, and on optimizing the existing labour supply, by working to increase the participation of underrepresented groups in the labour force, such as immigrants, Indigenous people, persons with disabilities and youth.
To support EI clients with programming earlier in their EI claims, some jurisdictions have implemented mechanisms to support targeted early interventions aimed at quicker returns to employment. Some of the strategies are discussed in this section under the provincial and territorial summaries. In addition, all jurisdictions set targets for the three key performance indicators: clients served, clients employed and unpaid benefits to the EI Account.
2.2 Newfoundland and Labrador Footnote 21
In 2014, Newfoundland and Labrador experienced negative growth as real GDP shrank by 3.0%. In 2015, real GDP is poised to decline by roughly 2.0% as well. The weakness in commodity prices presented significant challenges for the Newfoundland and Labrador economy. However, the weaker Canadian dollar had a positive impact on the provincial manufacturing sector.
In 2014/2015, Newfoundland and Labrador registered an average of 2,200 (+100 year over year) job vacancies, with the strongest labour demand observed in health care, construction and retail trade. The province's job vacancy rate of 1.1% was below the national average of 1.6%, suggesting a relatively loose labour market, which is consistent with the decline in the province's real GDP for 2014.
Newfoundland and Labrador: EBSM Key Facts
| EI Clients | Non-Insured Clients |
|---|---|
| 11,363
|
1,126
|
| Interventions Type | 2014/2015 | Year-over-Year Change |
|---|---|---|
| Employment Benefits | 8,591 | 15.5%
|
| Support Measures: EAS | 15,745 | 43.1%
|
| Interventions Type | 2014/2015 | Year-over-Year Change (pp) |
|---|---|---|
| Employment Benefits | 35.3% | 5.0
|
| Support Measures: EAS | 64.7% | 5.0
|
| Total Expenditures | 2014/2015 ($ Million) |
Year-over-Year Change |
|---|---|---|
| Employment Benefits | $115.7 | 7.0%
|
| Support Measures: EAS | $5.0 | 9.1%
|
| LMPs and R&I | $1.5 | 49.9%
|
| Total Expenditures1 | $122.2 | 5.6%
|
| 2013/14 | 2014/2015 | Year-over-Year Change |
|---|---|---|
| $25.69 | $25.35 | 1.3%
|
- 1 Totals may not add due to rounding; does not include accounting adjustments.
In this economic context, the unemployment rate in Newfoundland and Labrador edged up by 0.6 percentage points to 12.2%. Employment decreased to 237,100 (-4,800), with full-time employment declining by 6,000 and part-time employment increasing by 1,200. The province's unemployment totals increased by 3% (+1,000). Newfoundland and Labrador's labour market participation rate stood at 60.8%, a downward slide of 0.7 percentage points year over year.
Employment in the goods-producing industries edged down by 1,800, reaching a total of 54,300 in 2014/2015. The biggest losses were experienced in the manufacturing (-1,200) and forestry, fishing, mining, oil and gas (-900) industries. Employment in the services-producing sector dropped to 182,800 (-3,000 or -1.6%). Employment losses were concentrated in: other services (-2,300 or -16.3%); public administration (-2,200 or -11.5%); educational services (-1,300 or -6.8%); as well as in health care and social assistance (-1,300 or -3.3%). Solid employment gains were recorded in professional, scientific, and technical services (+1,400 or +14.6%) and trade (+3.3% or +1,300).
Skill shortages and mismatches continued to be among the main labour market challenges in Newfoundland and Labrador. Other issues include population aging combined with declining population growth, and a relatively large proportion of the labour force in rural areas of the province (47% versus 16% in Canada). The province identified a number of labour market priorities in 2014/2015 to address labour and skill shortages and mismatches. To ensure a sufficient supply of skilled workforce is available, Newfoundland and Labrador focused its efforts on recruitment and retention and skills development strategies, investing significantly in employment and training programs, as well as in working closely and collaboratively with stakeholders, including with its recently established network of 27 employment centres to implement education and employment training objectives.
| Employment Benefits | Interventions | Year-over-Year Change | Expenditures ($ 000s) | |
|---|---|---|---|---|
| TWS | Newfoundland and Labrador Wage Subsidies | 880 | +22.1% | 7,860 |
| SE | Newfoundland and Labrador Self-Employment Assistance | 179 | -5.8% | 5,382 |
| JCPs | Newfoundland and Labrador Job Creation Partnerships | 1,196 | +42.6% | 8,156 |
| SD-R | Newfoundland and Labrador Skills Development | 3,609 | +7.3% | 94,319 |
| SD-A | Newfoundland and Labrador Skills Development | 2,727 | +17.1% | |
| Support Measures | ||||
| EAS | Newfoundland and Labrador Employment Assistance Services | 15,745 | +43.1% | 4,973 |
| LMPs | Newfoundland and Labrador Labour Market Partnerships | N/A | N/A | 1,521 |
| R&I | Research and Innovation | N/A | N/A | |
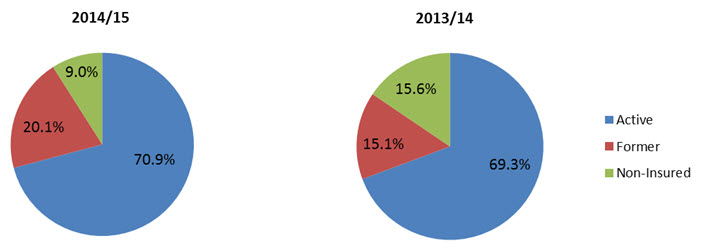
In 2014/2015, Newfoundland and Labrador served a decreasing numbers of clients, totaling 12,489 (-2.0%), compared to 12,739 in 2013/14. This is recorded in the context of a downward trend over the last five years. Two of the three client types expanded, with the numbers of active (8,850) and former (2,513) claimants both rising, though at different pace (+0.2% and +30.3%, respectively). Similarly, the shares of active (70.9%) and former (20.1%) claimants both rose, the first by 1.6 percentage points, and the second more significantly (+5.0 percentage points), consistent with the shift in their respective numbers. In contrast, the non-insured clients fell considerably from the 2013/14 total of 1,980, down to 1,126, influencing the overall total in terms of clients served. Similarly, its share of all clients served also contracted significantly to 9.0% (-6.5 percentages points).
Show Data Table
| # | % | |
|---|---|---|
| Active Clients | 8,850 | 70.9% |
| Former Clients | 2,513 | 20.1% |
| Non-Insured | 1,126 | 9.0% |
| Total | 12,489 | 100.0% |
| # | % | |
|---|---|---|
| Active Clients | 8,831 | 69.3% |
| Former Clients | 1,928 | 15.1% |
| Non-Insured | 1,980 | 15.5% |
| Total | 12,739 | 100.0% |
Show Data Table
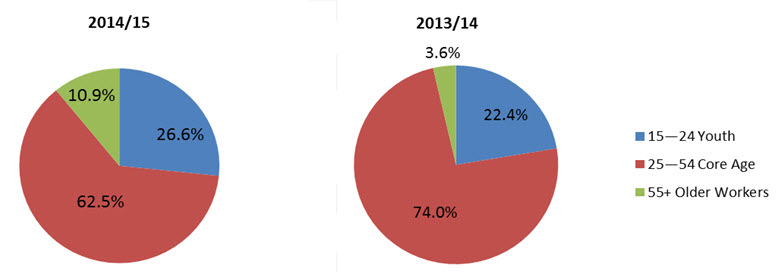
| # | % | |
|---|---|---|
| 15–24 Youth | 1,627 | 26.6% |
| 25–54 Core Age | 3,814 | 62.5% |
| 55+ Older Workers | 665 | 10.9% |
| Unknown | 1 | 0.0% |
| Total | 6,107 | 100.0% |
| # | % | |
|---|---|---|
| 15–24 Youth | 2,325 | 22.3% |
| 25–54 Core Age | 7,699 | 73.9% |
| 55+ Older Workers | 376 | 3.6% |
| Unknown | 18 | 0.0% |
| Total | 10,418 | 100.0% |
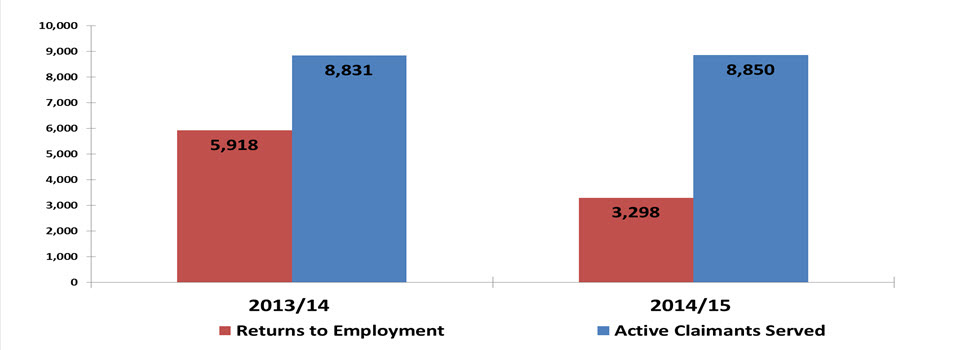
Newfoundland and Labrador's clients accessed a growing number (24,336) of EBSM-similar interventions in 2014/2015, a sharp year-over-year increase of 32.0%, largely attributed to the province resuming its Group Services support measure. Employment Benefits accounted for a declining share of 35.3%, while the numbers of its interventions expanded to a total of 8,591 (+15.5%), compared to 7,441 in the previous year. Consistent with the shift in the numbers of the EAS interventions, its share of all interventions increased, up to 64.7% from last year's 59.6%. A significantly declining total (3,298) of EI clients returned to employment following participation in the program (-44.3% year-over-year). Expenditures for EBSM-similar programming totalled $122.2 million of the $128.0 million allocated.
Show Data Table
| 2013/2014 | 2014/2015 | |
|---|---|---|
| Returns to Employment | 5,918 | 3,298 |
| Active Claimants Served | 8,831 | 8,850 |
2.2.1 Employment Benefits
In 2014/2015, the province delivered significantly more Employment Benefit interventions, totaling 8,591 (+15.5% year over year increase). The use for Skill Development interventions rose, with SD-R (3,609) and SD-A (2,727) both expanding significantly by 7.3% and 17.1%, respectively. JCP (1,196) is another benefit intervention that experienced considerable growth (+42.6%). In addition, TWS (880) grew for a second consecutive year, edging up significantly in 2014/2015 by 22.1%, while SE (179) fell (-5.8%) this year, after expanding in 2013/14. As for the shares of the benefit types, SD-R accounted for a decreasing proportion of all benefits at 42.0%, but the share of SD-A edged up slightly to 31.7% (+0.4 percentage points). Combined SD-R and SD-A accounted for a 73.8% share of all benefits, compared to 76.5% in the previous year, reflecting a continued focus on skills development and enhancement. Employment Benefits total expenditures rose significantly to a total of $115.7 million (+7.0%), consistent with the increase in the number of benefit interventions delivered.
2.2.2 Support Measures: EAS
After four consecutive years of decline, the use of EAS in Newfoundland and Labrador increased considerably in 2014/2015, with total numbers reaching a five-year high of 15,745 (+43.1). The EAS types delivered in the province all recorded noticeable gains, though at different paces. Employment Services—the most widely used EAS—grew significantly to a total of 8,238 (+5.6%), and Individual Counselling (4,500) edged up sharply (+40.6%). Additionally, Group Services—an intervention that was last used in 2009/10—resumed in 2014/2015, with a total number of interventions delivered reaching 3,007. The noticeable increase in the EAS numbers can be attributed to a growing demand for employment programming due to weakening labour market conditions. EAS expenditures reached a total of $5.0 million (+9.1%), consistent with the increase in the total numbers of EAS interventions.
2.2.3 Other Support Measures: LMPs
After expanding significantly to $6.4 million in 2012/13, expenditures for Newfoundland and Labrador's LMPs contracted over the past two years, with total expenditures dropping to $1.5 million in 2014/2015. This represented almost half of last year's value and a 10-year low. LMP expenditures accounted for a smaller share of 1.2%, compared to 2.6% in 2013/14.
2.2.4 Managing for Results
Newfoundland and Labrador manages for results through its new management information system, the Labour Market Programs Support System (LaMPSS), which has been operational as of 2014/2015. The LaMPSS is expected to maximize efficiency and improve service delivery for labour market programs and services. Data on interventions delivered in 2014/2015 are estimates based on the results generated through Newfoundland and Labrador's regional service delivery network. However, the province is undertaking supplementary data analysis in order to improve data quality for 2015/16.
2.3 Prince Edward Island
Prince Edward Island's real GDP rose by 1.2% in 2014 and is forecasted to have increased by 1.5% in 2015. The strength of the Island's construction, manufacturing, as well as surging exports, contributed to this growth. Strong demand for lobster in the United States and Europe is expected to boost the fishing industry, which makes up nearly one-third of the Island's primary sector. Coming off a strong year for tourism in 2014, the low Canadian dollar will continue to attract visitors from the United States, as well as Canadian-based traffic. However, weak growth in non-commercial services such as education as well as health and social services was observed in a period of government spending restraints.
Prince Edward Island: EBSM Key Facts
| EI Clients | Non-Insured Clients |
|---|---|
| 3,330
|
1,470
|
| Interventions Type | 2014/2015 | Year-over-Year Change |
|---|---|---|
| Employment Benefits | 1,991 | 6.8%
|
| Support Measures: EAS | 5,597 | 6.1%
|
| Interventions Type | 2014/2015 | Year-over-Year Change (pp) |
|---|---|---|
| Employment Benefits | 26.2% | 2.6
|
| Support Measures: EAS | 73.8% | 2.6
|
| Total Expenditures | 2014/2015 ($ Million) |
Year-over-Year Change |
|---|---|---|
| Employment Benefits | $18.6 | 6.3%
|
| Support Measures: EAS | $4.7 | 3.7%
|
| LMPs and R&I | $2.4 | 38.0%
|
| Total Expenditures1 | $25.7 | 1.6%
|
| 2013/14 | 2014/2015 | Year-over-Year Change |
|---|---|---|
| $7.19 | $6.08 | 15.4%
|
- 1 Totals may not add due to rounding; does not include accounting adjustments.
In 2014/2015, Prince Edward Island recorded an average of 1,000 job vacancies (+500 year over year) with labour demand strongest in health care and social assistance, retail trade, and manufacturing. PEI's job vacancy rate (1.8%) surpassed the national average of 1.6% suggesting a relatively tight labour market.
In line with its moderate economic growth, Prince Edward Island's labour market reacted accordingly. Unemployment rate was down a full percentage point, going from 11.5% to 10.5%. Employment remained unchanged at 73,900, as full-time employment grew slightly by 1,000 while part-time employment declined marginally by 900. Participation rate dropped to 68.4%, a drop of a full percentage point year-over-year.
Employment in the goods-producing sector edged up by 3.3% to 17,900, boosted by growth in the manufacturing industry (+19.2% or +1,000). Following several years of increases in the services-producing sector, employment dropped by 0.8% to 56,100. Employment declines were concentrated in information, culture and recreation (-11.6%); health care and social assistance (-6.6%); as well as in educational services (-5.0%). Some of the losses were offset with gains in transportation and warehousing (+18%); business, building and other support services (+10.3%); and, in other services (+10.2%).
Prince Edward Island continued to face the following labour market challenges in 2014/2015: skill shortages; short-term job attachment of some groups, mainly associated with a dominant seasonal economy; an aging population; as well as interprovincial migration and out-migration. To ensure its workforce gains the required skills for a successful transition to sustainable employment, the province continued to support skill training and skill enhancement for all Islanders. Prince Edward Island has invested in establishing a network to help private sector employers connect with job seekers by continuing to provide targeted employment services and programs. The province identified key labour market priorities aimed at advancing skills enhancement, economic growth and development, including supporting small and medium-size enterprises (SMEs) and participating in joint stakeholder tables, diversifying its economy through innovation and supporting collaboration among government, business and post-secondary institutions. In addition, the province continued to work collaboratively with the other Atlantic jurisdictions on active employment programming.
| Employment Benefits | Interventions | Year-over-Year Change | Expenditures ($ 000s) | |
|---|---|---|---|---|
| TWS | Employ PEI | 437 | +8.7% | 2,135 |
| SE | Self Employ PEI | 118 | -19.7% | 1,579 |
| JCPs | Work Experience PEI | 108 | -36.1% | 1,381 |
| SD-R | Training PEI—Individual | 1,013 | -9.2% | 13,487* |
| SD-A | Training PEI—Apprentice | 315 | +4.3% | |
| Support Measures | ||||
| EAS | Employment Assistance Services | 5,597 | +6.1% | 4,686 |
| LMPs | Labour Market Partnerships | N/A | N/A | 2,143 |
| R&I | Research & Innovation | N/A | N/A | 245 |
- *Combined investment for SD-A and SD-R
Prince Edward Island served a total of 4,800 clients in 2014/2015, a moderate year-over-year decline of 3.0%. The province served fewer EI clients, with active (2,709) and former (621) claimants both declining significantly, by 8.6% and 11.7% respectively. The non-insured clients, on the other hand, expanded significantly, to a total number of 1,470 (+14.4%). As for the shares of these client types, the proportions of active (56.4%) and former (12.9%) claimants both edged down (-3.4 and -1.3 percentage points, respectively), while the share of the non-insured rose notably, consistent with its respective numbers, to 30.6%, compared to last year's 26.0%.
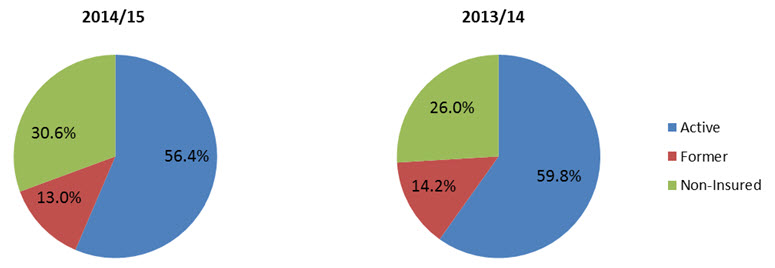
Show Data Table
| # | % | |
|---|---|---|
| Active Clients | 2,709 | 56.4% |
| Former Clients | 621 | 12.9% |
| Non-Insured | 1,470 | 30.6% |
| Total | 4,800 | 100.0% |
| # | % | |
|---|---|---|
| Active Clients | 2,963 | 59.8% |
| Former Clients | 703 | 14.2% |
| Non-Insured | 1,285 | 26.0% |
| Total | 4,951 | 100.0% |
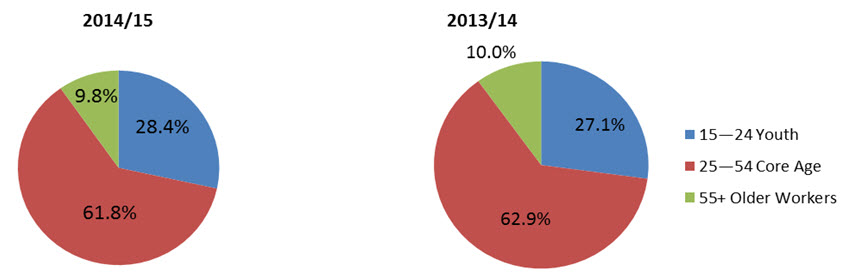
Show Data Table
| # | % | |
|---|---|---|
| 15–24 Youth | 1,276 | 28.4% |
| 25–54 Core Age | 2,776 | 61.8% |
| 55+ Older Workers | 438 | 9.8% |
| Unknown | 0 | 0.0% |
| Total | 4,490 | 100.0% |
| # | % | |
|---|---|---|
| 15–24 Youth | 1,259 | 27.1% |
| 25–54 Core Age | 2,920 | 62.9% |
| 55+ Older Workers | 463 | 10.0% |
| Unknown | 3 | 0.1% |
| Total | 4,645 | 100.0% |
Following a decline in the previous year, Prince Edward Island delivered a growing number of interventions, totalling 7,588 (+2.4%) in 2014/2015. Overall, the number of Employment Benefits (1,991) decreased (-6.8%), in contrast to last year's growth. On the other hand, EAS numbers (5,597) increased by 6.1%, after a decline in the previous year. A significantly lower number of active and former claimants (1,934; -11.9%) returned to work after participation in an EBSM-similar intervention. At $25.7 million, Prince Edward Island's total expenditures for its EBSM-similar programming represented 100% of the allocated funding.
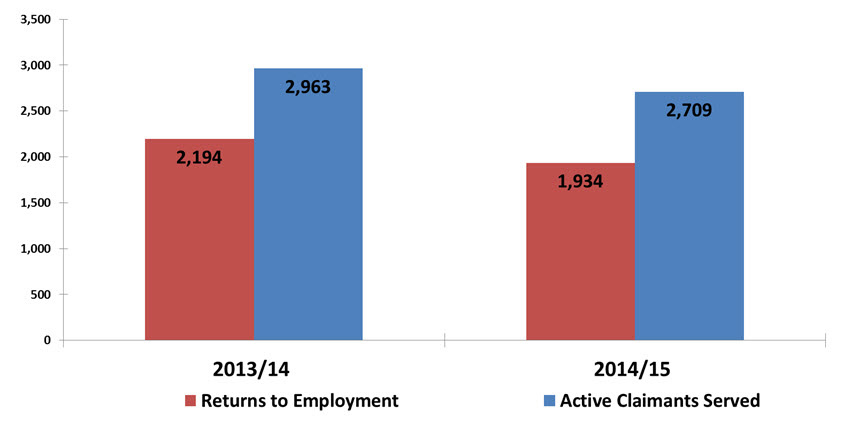
Show Data Table
| 2013/2014 | 2014/2015 | |
|---|---|---|
| Returns to Employment | 2,194 | 2,963 |
| Active Claimants Served | 1,934 | 2,709 |
2.3.1 Employment Benefits
After a moderate expansion in the previous year, Prince Edward Island delivered a lower number of Employment Benefits interventions (1,991) in 2014/2015. This represented a significant year-over-year decline of 6.8%. TWS (437) and SD-A (315) both expanded (+8.7% and +4.3% year over year), while the other three benefit types all contracted, with JCP (108) declining by 36.1%, followed by SE (118), which dropped by 19.7%, and SD-R (1,013)—the most frequently used benefit intervention in the province—was down 9.2%. At 66.7%, combined SD-R and SD-A continued to account for the greatest share of all employment benefits, indicating a continued focus in the province on addressing pressing skills shortages. Employment Benefits expenditures fell down to $18.6 million (-6.3%), consistent with the decline in the numbers of most benefit types.
2.3.2 Support Measures: EAS
Prince Edward Island delivered a significantly higher number of EAS interventions (5,597) in 2014/2015 (+6.1%). Employment Services (4,252) and Individual Counselling (1,345)—the province's two EAS types—shifted differently, with the first expanding considerably (+11.3%), after a decline in the previous year, while the latter contracted notably (-7.6%), which constitutes the third consecutive yearly decline. Consistent with the increase in EAS numbers, the total expenditures of EAS rose to $4.7 million (+3.7%) in 2014/2015.
2.3.3 Other Support Measures: LMPs and R&I
In 2014/2015, LMPs and R&I funding increased considerably to $2.4 million (+38.0%), compared to last year's $1.7 million. LMPs total expenditures grew significantly (+25.0%), to a total of $2.1 million. Similarly, R&I's expenditures expanded, though at a remarkably faster pace, reaching $245,000 (+1,431%). LMPs and R&I funding supported initiatives led by industries and communities to identify and address labour market challenges.
2.3.4 Managing for Results
In an effort to measure the effectiveness of programming, SkillsPEI implemented adjustments to its database management system to analyze the employability of clients participating in paid interventions. New functionality and modifications were implemented in phases. As of the end of fiscal year, all database requirements were deployed including the logic model to manage and survey completed interventions.
2.4 Nova Scotia
Nova Scotia's real GDP expanded by 0.6% in 2014 and is expected to have increased closer to 1% in 2015, thanks to gains in manufacturing and construction. The stronger growth in the U.S. and the weaker Canadian dollar is helping Nova Scotia-produced goods compete in international markets. As well, military shipbuilding projects are providing an additional boost to the province's manufacturers. Nova Scotia's tourism sector continues to perform thanks to an influx of U.S. travellers, as well a rise in visitors from other parts Canada. The sharp drop in natural gas production had a negative impact on the economy.
Nova Scotia: EBSM Key Facts
| EI Clients | Non-Insured Clients |
|---|---|
| 11,562
|
4,397
|
| Interventions Type | 2014/2015 | Year-over-Year Change |
|---|---|---|
| Employment Benefits | 4,252 | 10.3%
|
| Support Measures: EAS | 26,968 | 5.1%
|
| Interventions Type | 2014/2015 | Year-over-Year Change (pp) |
|---|---|---|
| Employment Benefits | 13.6% | 0.7
|
| Support Measures: EAS | 86.4% | 0.7
|
| Total Expenditures | 2014/2015 ($ Million) |
Year-over-Year Change |
|---|---|---|
| Employment Benefits | $47.8 | 10.8%
|
| Support Measures: EAS | $29.1 | 23.7%
|
| LMPs and R&I | $2.0 | 2.4%
|
| Total Expenditures1 | $78.9 | 0.2%
|
| 2013/14 | 2014/2015 | Year-over-Year Change |
|---|---|---|
| $28.60 | $28.41 | 0.7%
|
- 1 Totals may not add due to rounding; does not include accounting adjustments.
In 2014/2015, Nova Scotia posted an average of 5,200 job vacancies (+800 year over year), with the strongest labour demand originating in health care and social assistance, retail trade, as well as in accommodation and food services. The province's annual job vacancy rate of 1.4% was below the national average of 1.6%.
Due to its modest economic growth, Nova Scotia's labour market had a tepid performance in 2014/2015. The labour force shrunk by 0.7% year over year, settling at 491,600. Overall, employment was down (-0.6% or -2,900). However, there were gains in full-time employment (+0.4% or +1,400). Unemployment decreased by 1.4% to a total of 43,700. In this context, the unemployment rate edged down to 8.9%, compared to 9% in 2013/14.
Following an increase in the previous year, employment in the goods-producing sector dropped noticeably to 82,400 (-4,700 or -5.4%) in 2014/2015. Employment losses were registered in all industries, except in forestry, finishing, mining, oil and gas (+300 or +2.9%). The largest employment losses were concentrated in construction (-2,100 or -6.0%) and manufacturing (-1,700 or -5.5%). Employment gains were registered in the services-producing industries (+1,800 or +0.5%), led by transportation and warehousing (+1,800 or +9.4%); finance, insurance, real estate and leasing (+1,000 or +4.8%); as well as in accommodation and food services (+1,100 or +3.5%). Offsetting these gains were employment losses concentrated in business, building and other support services (-2,300 or -10.3%), as well as in other services (-1,400 or -7.4%).
Labour and skill shortages in select industries and relatively low labour productivity continued to be among the main labour market challenges in Nova Scotia in 2014/2015. Specifically, some individuals are experiencing difficulty in transitioning smoothly to the knowledge-based economy, due to low education and employable skills. To ensure a skilled and sustainable workforce is available to meet employers' needs, the province oriented its strategic investments toward attracting and retaining skilled and talented workers; providing training opportunities for workers and employers; as well as supporting workers in building the required skills for the new technologies.
Going forward, job openings in Nova Scotia are expected to be largely driven by the need to replace workers retiring from the labour force. The largest source of new entrants to the workforce will continue to be youth, complemented by immigration and other workforce adjustments (i.e. delayed retirements). This demographic shift could result in new and/or different skills and training needs to ensure new entrants have the skills to meet the demands of the labour market.
| Employment Benefits | Interventions | Year-over-Year Change | Expenditures ($ 000s) | |
|---|---|---|---|---|
| TWS | START | 362 | -32.0% | 3,181 |
| SE | Nova Scotia Self-Employment Benefit | 422 | -9.8% | 5,626 |
| JCPs | Nova Scotia Job Creation Partnerships | 118 | -25.8% | 1,341 |
| SD-R | Nova Scotia Skills Development | 1,790 | -13.9% | 37,624 |
| SD-A | Nova Scotia Skills Development | 1,560 | +3.8% | |
| Support Measures | ||||
| EAS | Nova Scotia Employment Assistance Services | 26,968 | -5.1% | 29,070 |
| LMPs | Nova Scotia Labour Market Partnerships | N/A | N/A | 2,027 |
| R&I | Research and Innovation | N/A | N/A | |
For a second consecutive year, Nova Scotia served a lower number of clients (15,959), down by 4.1% in 2014/2015. Two out of the three client types declined, with former claimants (2,202) decreasing significantly (-20.8%) and the non-insured clients (4,397) falling moderately (-3.3%). Active claimants, on the other hand, grew slightly (+0.5%), reaching 9,360 in 2014/2015, after experiencing a downward trend over the past four years. Their shares shifted in the same direction as their respective totals: active claimants' share rose (+2.7 percentage points) to 58.7%, and former claimants dropped by 2.9 percentage points to 13.8%. The share of the non-insured clients edged up slightly, to 27.6% (+0.3 percentage points year over year).
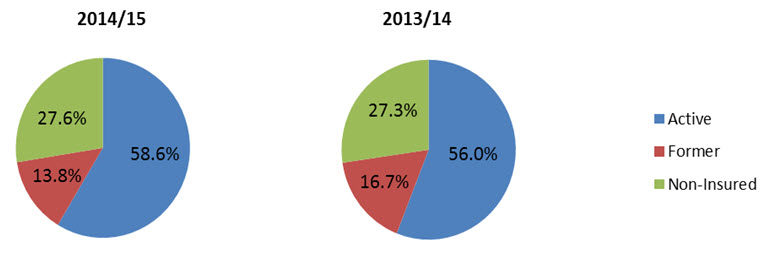
Show Data Table
| # | % | |
|---|---|---|
| Active Clients | 9,360 | 58.7% |
| Former Clients | 2,202 | 13.8% |
| Non-Insured | 4,397 | 27.6% |
| Total | 15,959 | 100.0% |
| # | % | |
|---|---|---|
| Active Clients | 9,313 | 56.0% |
| Former Clients | 2,779 | 16.7% |
| Non-Insured | 4,545 | 27.3% |
| Total | 16,637 | 100.0% |
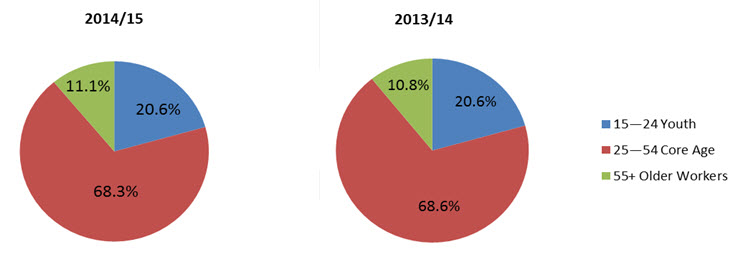
Show Data Table
| # | % | |
|---|---|---|
| 15–24 Youth | 2,618 | 20.6% |
| 25–54 Core Age | 8,667 | 68.3% |
| 55+ Older Workers | 1,401 | 11.0% |
| Unknown | 2 | 0.0% |
| Total | 12,688 | 100.0% |
| # | % | |
|---|---|---|
| 15–24 Youth | 2,963 | 20.6% |
| 25–54 Core Age | 9,848 | 68.6% |
| 55+ Older Workers | 1,548 | 10.8% |
| Unknown | 4 | 0.0% |
| Total | 14,363 | 100.0% |
Nova Scotia delivered a declining number of EBSM interventions for a second year in a row, totaling 31,220 (-5.9%) in 2014/2015. The share of Employment Benefits of the total interventions delivered in the province dropped slightly by 0.7 percentage points, to 13.6%. Conversely, EAS accounted for a greater share of 86.4%, compared to last year's 85.7%. A total of 5,608 of EI clients returned to employment after participating in Nova Scotia's EBSM-similar programming (-1.3%). At $78.9 million, Nova Scotia's total expenditures for its EBSM-similar programming represented 100% of the allocated funding.
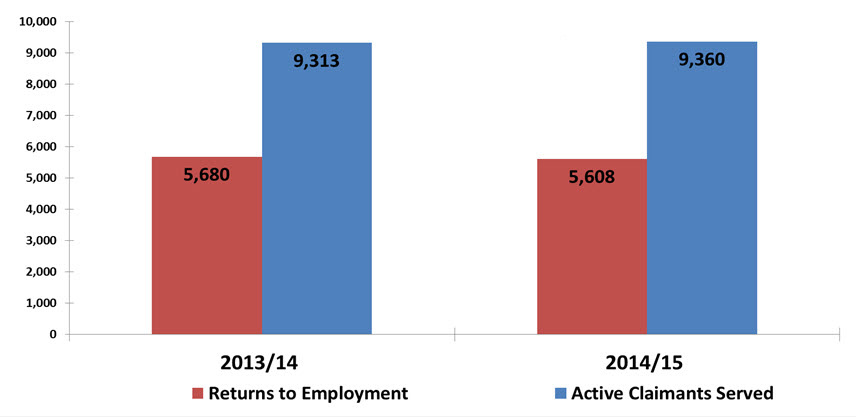
Show Data Table
| 2013/2014 | 2014/2015 | |
|---|---|---|
| Returns to Employment | 5,680 | 5,608 |
| Active Claimants Served | 9,313 | 9,360 |
2.4.1 Employment Benefits
For a second consecutive year, Nova Scotia delivered fewer Employment Benefits interventions, totalling 4,252 (-10.3%) in 2014/2015. With the exception of SD-A, which grew moderately to a total of 1,560 (+3.8%), all the other Employment Benefits contracted significantly. TWS declined the most (-32.0%) to a total of 362; followed by JCP (-25.8%) down to 118; SD-R (-13.9%), to a total of 1,790; and SE (-9.8%) with 422 total interventions. The shares of the benefit types shifted consistently with their levels, except for SE which remained stable at 9.9%. Despite the significant decrease in SD-R, the combined shares of both SD-A (36.7%) and SD-R (42.1%) continued to be the most used benefit intervention in the province at 78.8% compared to 75.5% in 2013/14, reflecting a continued focus on clients' long-term job attachment and reduction in the reliance on government support. Employment Benefits expenditures totaled $47.8 million in 2014/2015, a significant decrease of 10.8% from 2013/14 levels.
2.4.2 Support Measures: EAS
For a fourth consecutive year, Nova Scotia delivered a decreasing number of EAS interventions (26,968) in 2014/2015, compared to last year's 28,423. Group Services was the sole EAS intervention expanding in 2014/2015, reaching a total of 1,852 (+100%). Conversely, Employment Services (20,603) and Individual Counselling (4,513) both declined by 8.4% and 9.9%, respectively. The shares of the three EAS types shifted in the same directions, with Group Services rising to 6.9% of all EAS interventions, while Employment Services (76.4%) and Individual Counselling (16.7%) both edging down (-2.7 and -0.9 percentage points, respectively). Despite the decline in the numbers of EAS, it accounted for a growing share (86.4%) of all interventions delivered in the province (+0.7 percentage points), signalling a continued demand for EAS in the province. Nova Scotia uses EAS to help job-ready clients meet the growing demand for skilled labour and increase the job attachment of vulnerable groups. EAS total expenditures increased significantly to $29.1 million (+23.7%).
2.4.3 Other Support Measures: LMPs
The total expenditures for LMPs continued to rise for a third consecutive year, reaching $2.0 million in 2014/2015 (+2.4%). Through investing in LMPs, the province supports employers, employer/employee associations, community groups and communities in developing and implementing strategies for dealing with changes in the labour force and meeting human resource requirements. LMP investment supports partnerships in key business/industry sectors, strengthens stakeholder engagement and fosters collaboration in identifying the right labour market priorities and strategies.
2.4.4 Managing for Results
To improve assessment and monitoring of EBSM programming, Employment Nova Scotia uses the provincially developed Labour Market Programs Support System (LaMPSS) for the documentation and administration of LMDA organisation and individual funding agreements and for tracking participant case management information. In 2014/2015, an extensive review of case management data was undertaken to determine how each External Service Provider was performing. The review included comparative analysis to identify areas that need improvement, with the overarching objective to ensure quality service delivery and achieving client outcomes. The review also provides input for further development as the Province undertakes an employment services transformation.
2.5 New Brunswick
Real GDP in New Brunswick fell 0.3% in 2014 after increasing by 0.4% in 2013. The province is expected to post real GDP closer to 1.0% in 2015. New Brunswick's forestry sector is experiencing robust growth with increasing lumber and softwood shipments stemming from a steady rise in U.S. demand. Other primary industries like agriculture and fishing experienced decent growth. Construction will weigh down on the economy as residential investment spending has declined.
New Brunswick: EBSM Key Facts
| EI Clients | Non-Insured Clients |
|---|---|
| 10,989
|
4,838
|
| Interventions Type | 2014/2015 | Year-over-Year Change |
|---|---|---|
| Employment Benefits | 8,093 | 4.9%
|
| Support Measures: EAS | 25,761 | 0.2%
|
| Interventions Type | 2014/2015 | Year-over-Year Change (pp) |
|---|---|---|
| Employment Benefits | 23.9% | 0.9
|
| Support Measures: EAS | 76.1% | 0.9
|
| Total Expenditures | 2014/2015 ($ Million) |
Year-over-Year Change |
|---|---|---|
| Employment Benefits | $69.9 | 2.4%
|
| Support Measures: EAS | $11.7 | 3.3%
|
| LMPs and R&I | $8.3 | 14.6%
|
| Total Expenditures1 | $89.8 | 0.7%
|
| 2013/14 | 2014/2015 | Year-over-Year Change |
|---|---|---|
| $28.67 | $27.27 | 4.9%
|
- 1 Totals may not add due to rounding; does not include accounting adjustments.
In 2014/2015, New Brunswick recorded an average of 3,700 job vacancies, unchanged year over year. The strongest labour demand was concentrated in retail trade, manufacturing, as well as in accommodations and food services. Over the course of the entire fiscal year, the provincial job vacancy rate stood at 1.3%, which was 0.3 percentage points below the national average.
In 2014/2015, the labour market experienced some weakness. The size of the labour force declined (-2,700 or -0.7%), settling at 392,500. Overall, employment was down by 0.8%, totalling 352,900, with net losses of 1,400 in both full-time and part-time jobs. New Brunswick's participation rate declined 0.4 percentage points to 63.1%. In this context, the unemployment rate reached 10.1%, edging up by 0.1 percentage points.
The goods-producing industries registered a loss of (-4,200 or -5.3%) in employment. The losses were mainly concentrated in construction (-3,300 or -10.9%), as well as in forestry, fishing, mining, oil and gas (-800 or -6.1%). Services-producing industries delivered a modest gain of 1,500 net jobs. Employment increases were mainly in professional, scientific and technical services (+2,600 or +17.2%); business, building and other support services (+1,800 or +9.9%); as well as in public administration (+1,400 or +6.5%). Offsetting some these gains, employment losses were registered in: health care and social assistance (-2,000 or -3.7%); trade (-1,400 or -2.4%); as well as in information, culture, and recreation (-700 or -6.1%).
A sluggish economy and a small and aging population are currently the main labour market challenges in New Brunswick. The province established a number of priorities to help its workforce secure and maintain employment. These included: investing in innovative programs and services, as well as strengthening partnerships with stakeholders and employers in order to address skills shortages and training needs; promoting adult literacy and continuous learning; and assisting workers through creating opportunities for job matching. Additionally, New Brunswick continued to invest in all levels of skills training from literacy and academic upgrading to apprentices in an effort to respond to the training needs of employers and job seekers. An example is an investment in the One Job Pledge component of the Workforce Expansion program, launched in 2013, which connects employers with recent post-secondary graduates.
| Employment Benefits | Interventions | Year-over-Year Change | Expenditures ($ 000s) | |
|---|---|---|---|---|
| TWS | Workforce Expansion—Employer Wage Subsidy | 1,632 | +12.2% | 9,586 |
| SE | Workforce Expansion—Self-Employment Benefit | 286 | -9.5% | 5,152 |
| SD-R | Training and Skills Development Program | 3,983 | +8.2% | 55,142 |
| SD-A | Training and Skills Development Program | 2,192 | -3.0% | |
| Support Measures | ||||
| EAS | Nova Scotia Employment Assistance Services | 25,761 | -0.2% | 11,651 |
| LMPs | Nova Scotia Labour Market Partnerships | N/A | N/A | 7,636 |
| R&I | Research and Innovation | N/A | N/A | 673 |
Following a notable increase in the numbers of clients (+6.4%) served in 2013/14, a moderate decline of 4.3% was observed in 2014/2015, resulting in the total number of clients dropping (15,827). All the three client types also decreased, with active claimants (8,596) and former claimants (2,393) both declined significantly (-5.2% and -7.7% year over year, respectively), and the non-insured clients (4,838) slightly shrinking (-0.8%). An increased focus on providing more comprehensive assistance to clients facing particular barriers to employment has likely contributed to the observed contraction in the numbers of these client types. Similarly, the shares of these client types followed suit their respective numbers, with the shares of active (54.3%) and former claimants (15.1%) both edging down from last year's 54.8% and 15.7%, respectively. As for the proportion of the non-insured clients of all clients, it grew to 30.6% (+1.1% percentage points year over year).
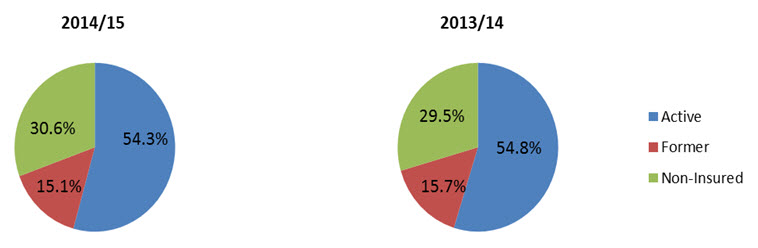
Show Data Table
| # | % | |
|---|---|---|
| Active Clients | 8,596 | 54.3% |
| Former Clients | 2,393 | 15.1% |
| Non-Insured | 4,838 | 30.6% |
| Total | 15,827 | 100.0% |
| # | % | |
|---|---|---|
| Active Clients | 9,070 | 54.8% |
| Former Clients | 2,592 | 15.7% |
| Non-Insured | 4,876 | 29.5% |
| Total | 16,538 | 100.0% |
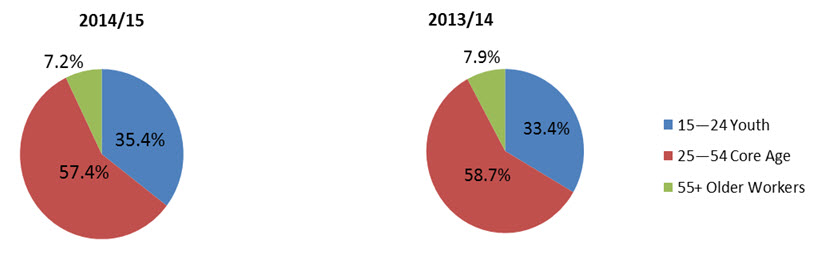
Show Data Table
| # | % | |
|---|---|---|
| 15–24 Youth | 5,466 | 35.4% |
| 25–54 Core Age | 8,870 | 57.4% |
| 55+ Older Workers | 1,116 | 7.2% |
| Unknown | 6 | 0.0% |
| Total | 15,458 | 100.0% |
| # | % | |
|---|---|---|
| 15–24 Youth | 5,287 | 33.4% |
| 25–54 Core Age | 9,297 | 58.7% |
| 55+ Older Workers | 1,257 | 7.9% |
| Unknown | 6 | 0.0% |
| Total | 15,847 | 100.0% |
The total number of interventions delivered in New Brunswick has grown for two years in a row, reaching 33,854 in 2014/2015 (+0.9%). Despite a slight decrease (-0.2%) in Support Measures (25,761), a notable increase (+4.9%) in the numbers of Employment Benefits lifted its total number to 8,093 in 2014/2015, which pushed up the total number of interventions. The share of Employment Benefits of all interventions rose (+0.9 percentage points) to 23.9%, while that of EAS dropped slightly from last year's 77.0%, down to 76.1% in 2014/2015, consistent with the decline in total numbers. A smaller total of 7,471 active and former claimants returned to work after participation in an EBSM-similar intervention, compared to 7,927 in 2013/14. At $89.8 million, New Brunswick's total expenditures for its EBSM-similar programming represented 100% of the allocated funding.
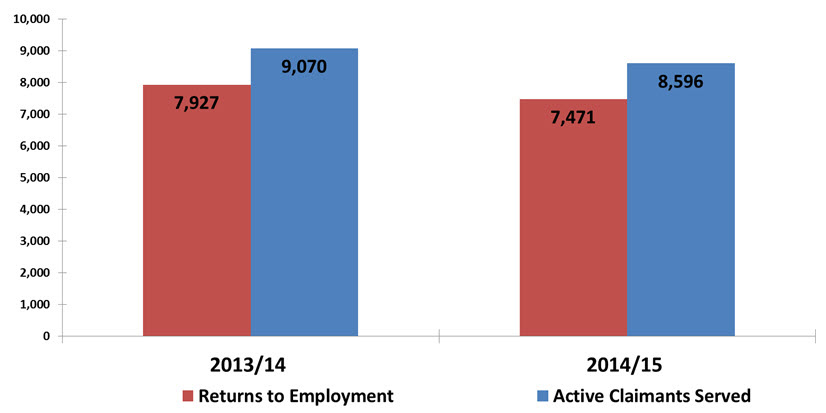
Show Data Table
| 2013/2014 | 2014/2015 | |
|---|---|---|
| Returns to Employment | 7,927 | 7,471 |
| Active Claimants Served | 9,070 | 8,596 |
2.5.1 Employment Benefits
After delivering a smaller number of Employment Benefits (7,712) interventions last year, New Brunswick served a total of 8,093 in 2014/2015 (+4.9%). The two Skills Development types shifted differently, with the total number of SD-R expanding significantly (+8.2%), to a total of 3,983. In contrast, SD-A (2,192) declined for a second consecutive year, dropping moderately (-3.0%) in 2014/2015. Consistent with the change in the numbers of these two benefit types, their respective shares shifted similarly, with the share of SD-R rising by 1.5 percentage points to 49.2%, while that of SD-A declined at a faster pace (-2.2 percentage points to 27.1%). The combined SD share declined slightly, but continued to represent the greatest proportion of all interventions at 76.3%, reflecting New Brunswick's continued support for new skills acquisition. TWS expanded significantly (+12.2%) to a total of 1,632, while SE (286) declined noticeably (-9.5%). The substantial increase in TWS could be attributed to a continued investment in the province's One Job Pledge component of Workforce Expansion—a program that saw its first full year of delivery in 2013/14. This program offers up to 52 weeks of wage subsidy for recent post-secondary graduates. Employment Benefits total expenditures increased to $69.9 million (+2.4%) in 2014/2015.
2.5.2 Support Measures: EAS
With a total of 25,761, New Brunswick delivered a slightly smaller number of EAS interventions (-0.2%). Consistent with the decline in the total numbers of EAS, its share of all interventions delivered edged down slightly (-0.9%), to 76.1% in 2014/2015. The two EAS types delivered in the province shifted differently, with Individual Counselling edging up by 0.7% to a total of 16,667, while Employment Services dropped to a total of 9,094 (-1.9%). The demand for EAS reflects a continued focus in the province on assisting job-ready individuals and supporting vulnerable clients. Additionally, the province continued to strengthen its efforts in targeting specific groups including persons with disabilities and social assistance recipients. New Brunswick clients participated in an increasing average of 2.14 interventions per client in 2014/2015, compared to 2.03 in 2013/14. Total expenditures for EAS increased to $11.7 million (+3.3%).
2.5.3 Other Support Measures: LMPs and R&I
After a considerable growth (+22.7%) in LMPs and R&I total expenditures of $9.7 million last year, this total dropped significantly to $8.3 million (-14.6%) in 2014/2015, mainly due to a sharp decline (-19.2%) in LMP funding. LMP total expenditures fell to $7.6 million, compared to $9.5 million in 2013/14. Conversely, R&I total expenditures expanded dramatically (+145.6%) in 2014/2015, reaching $673,000, more than double last year's value of $274,000. Investment in R&I increased, as New Brunswick used R&I funds ($347,149) to support the Canada-New Brunswick Job Grant initiatives. Compared to last year's 10.9%, combined LMP and R&I total expenditures represented a declining share of 9.2% of EBSM total expenditures.
2.5.4 Managing for Results
To support EI clients with active employment programming earlier in their EI claim, New Brunswick works closely with local Service Canada partners to reach clients as early as possible. Some regions have made arrangements with their local Service Canada partners to include the coordinates of the local offices and as well as information regarding the programs and services offered by the Department of Post-Secondary Education Training and Labour.
2.6 Quebec
In 2014, Quebec's real GDP expanded by 1.5%. A slightly weaker growth rate of 1.4% is expected for 2015 due to sluggish conditions in the first half of the year. Quebec's trade sector was weaker than expected, due to low final demand from U.S. businesses and consumers for its goods and services. A pull-back in the province's construction sector has also weighed on its real GDP growth. However, the lower dollar bodes well for Quebec's manufacturing sector, which recorded strong performance in the machinery and aerospace industries. As the U.S. economy picks up, Quebec's trade sector is projected to improve.
Quebec: EBSM Key Facts
| EI Clients | Non-Insured Clients |
|---|---|
| 165,012
|
64,769
|
| Interventions Type | 2014/2015 | Year-over-Year Change |
|---|---|---|
| Employment Benefits | 32,474 | 19.4%
|
| Support Measures: EAS | 248,678 | 2.0%
|
| Interventions Type | 2014/2015 | Year-over-Year Change (pp) |
|---|---|---|
| Employment Benefits | 11.6% | 2.6
|
| Support Measures: EAS | 88.4% | 2.6
|
| Total Expenditures | 2014/2015 ($ Million) |
Year-over-Year Change |
|---|---|---|
| Employment Benefits | $337.8 | 2.8%
|
| Support Measures: EAS | $157.3 | 12.5%
|
| LMPs and R&I | $84.8 | 9.7%
|
| Total Expenditures1 | $579.8 | 0.2%
|
| 2013/14 | 2014/2015 | Year-over-Year Change |
|---|---|---|
| $252.38 | $290.84 | 15.2%
|
- 1 Totals may not add due to rounding; does not include accounting adjustments.
In 2014/2015, Quebec's job vacancies were at 45,600 (+4,700 year over year), with the strongest labour demand recorded in retail trade, heath care and social assistance, as well as in manufacturing. The province's job vacancy rate stood at 1.3%, which was 0.3 percentage points below the national average. This points to a labour market that was slightly looser than Canada's overall labour market.
Quebec's labour force remained unchanged at 4.4 million, with weak employment growth (+3,200) while unemployment edged down slightly (-2,800). The province's unemployment rate declined by 0.1 percentage points, reaching 7.6% in 2014/2015.
In the goods-producing industries, employment declined by 2.9%, shedding 26,000 net jobs with the greatest losses concentrated in construction (-13,900 or -5.2%) and manufacturing (-8,900 or -1.8%). Offsetting these losses, the services-producing industries added 29,200 net jobs, an increase of 0.9 year over year. The strongest employment jobs were registered in accommodations and food services (+16,600 or 6.4%), health care and social assistance (+10,600 or 1.9%), public administration (+10,300 or 4.8%) and trade (+4,100 or 0.6%). At the same time, the strongest employment declines were observed in other services (-11,100 or 6.1%), professional, scientific and technical services (-8,300 or -2.7%), as well as in educational services (-1,800 or 0.6%).
In the context of an aging population, misalignment between skills and available jobs continued to pose challenges in Quebec's labour market. Through working in concert with its labour market partners, the province advanced a number of key priorities, including improving its labour market performance and providing timely labour market information services in order to help the unemployed quickly return to work. Specific actions to achieve identified labour market priorities included: engaging employers and supporting their employment and skills development training initiatives; identifying and analyzing structural measures negatively impacting current and future integration and attachments of its workforce; and clarifying issues and possible solutions to consider in improving the match between skills and available jobs. The province also focused on increasing labour market participation, improving productivity, reinforcing the business community's capacity to adapt to structural changes, and supporting underrepresented groups in the labour market.
| Employment Benefits | Interventions | Year-over-Year Change | Expenditures ($ 000s) | |
|---|---|---|---|---|
| TWS | Wage Subsidies | 5,052 | -17.1% | 69,792 |
| SE | Support for Self-Employment Measure | 1,680 | -12.3% | 25,236 |
| TES | Return to Work Supplement | 2,692 | -53.3% | 1,302 |
| DC | Manpower Training Measure Job Readiness | 23,050 | -13.1% | 241,446 |
| Support Measures | ||||
| EAS | Labour Market Information Job Placement Job Research and Assistance Services |
248,678 | +2.0% | 157,270 |
| LMPs | Job Cooperation Services Manpower Training Measure for Enterprises |
N/A | N/A | 84,546 |
| R&I | Research and Innovation Strategy | N/A | N/A | 253 |
Following three years of consecutive growth, the number of clients who participated in Quebec's EBSM-similar programming fell moderately (-3.2%) in 2014/2015 to a total of 229,781, down from last year's 237,337. Two out of the three client types followed suit, while the third maintained an upward trend. The numbers of active (140,026) and former (24,986) claimants both declined significantly by 5.0% and 6.7%, respectively. Non-insured clients, on the other hand, increased moderately (+2.5%), lifting total numbers to a ten-year high of 64,769. The increase in this client type also softened the pace at which the overall total number of all clients declined.
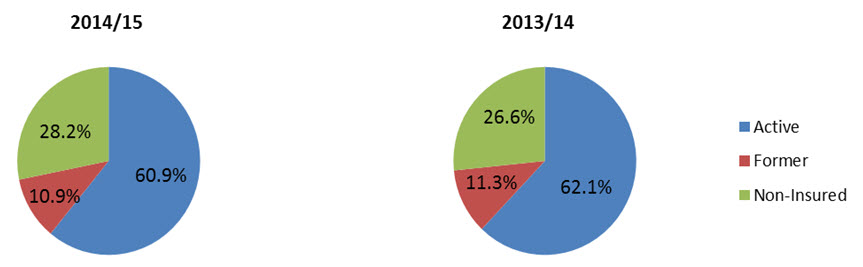
Show Data Table
| # | % | |
|---|---|---|
| Active Clients | 140,026 | 60.9% |
| Former Clients | 24,986 | 10.9% |
| Non-Insured | 64,769 | 28.2% |
| Total | 229,781 | 100.0% |
| # | % | |
|---|---|---|
| Active Clients | 147,396 | 62.1% |
| Former Clients | 26,779 | 11.3% |
| Non-Insured | 63,162 | 26.6% |
| Total | 237,337 | 100.0% |
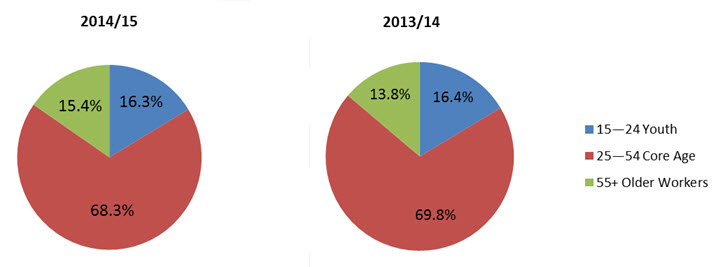
Show Data Table
| # | % | |
|---|---|---|
| 15–24 Youth | 32,259 | 16.3% |
| 25–54 Core Age | 134,939 | 68.3% |
| 55+ Older Workers | 30,334 | 13.8% |
| Unknown | 4 | 0.0% |
| Total | 197,536 | 100.0% |
| # | % | |
|---|---|---|
| 15–24 Youth | 31,409 | 16.4% |
| 25–54 Core Age | 133,491 | 69.8% |
| 55+ Older Workers | 26,454 | 13.8% |
| Unknown | 12 | 0.0% |
| Total | 191,366 | 100.0% |
Consistent with the decline in the numbers of clients served, the total number of interventions delivered in Quebec in 2014/2015 fell to 281,152 (-1.1%). The share of Employment Benefits (11.6%) of the total number of interventions delivered remained on a downward trend for a fifth consecutive year. This number also represented the lowest share since 2005/06. Conversely, the proportion of EAS continued to increase, reaching a 10-year high of 88.4%, which is also a moderate year-over-year growth of 2.6 percentage points.
A total number of 59,949 EI clients returned to work following participation in EBSM-similar interventions in 2014/2015, a significant year-over-year increase of 8.9%. This figure constituted a third consecutive year of growth and a 10-year high. As a result of the increased returns to employment by active claimants, it was estimated that $290.84 million of unpaid benefits from the EI Operating Account were generated in 2014/2015, compared to $252.38 million last year. Quebec's total expenditures for its EBSM-similar programming reached $579.4 million. This amount includes additional expenditures of $331,627 taken from the $750,000 envelope made available to Quebec, following the July 2013 Lac Mégantic train derailment incident, which is above the province's initial LMDA allocation.
To support workers affected by the July 2013 train derailment in Lac Mégantic, $1.5 million in EI Part II funds were made available to Quebec in 2014/2015 through a time-limited amendment to its LMDA. As per the terms of the agreement, an initial payment of $750,000 was provided to Quebec in September 2014 (with the remaining sum to be provided to Quebec upon their request). In December 2014, Quebec indicated that they did not require the remaining funds. Ultimately, Quebec used $331,627 of the funding and returned the remaining $418,373 to the GC early in the 2015/16 fiscal year. This additional funding was used to provide active measures programming and income support to help unemployed workers maintain their workforce attachment, gain relevant skills, and meet community needs. Specifically, the province provided programming through Job Cooperation Services and their Manpower Training Measures. All active employment measures were delivered in the EI Region of South Central Quebec where Lac-Mégantic is located.
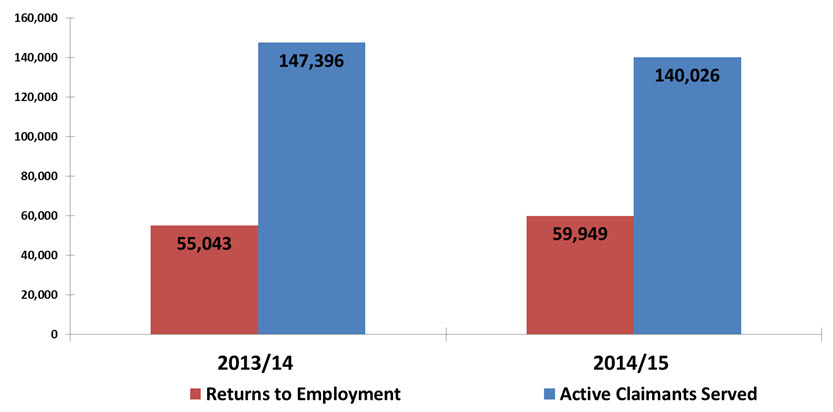
Show Data Table
| 2013/2014 | 2014/2015 | |
|---|---|---|
| Returns to Employment | 55,043 | 59,949 |
| Active Claimants Served | 147,396 | 140,026 |
2.6.1 Employment Benefits
The number of Employment Benefits interventions fell significantly to a total of 32,474 (-19.4%) in 2014/2015. All the four benefit types also declined at a similar rate, except for TES which declined considerably (-53.3%), down to 2,692 due to a closure of this program. TWS (5,052), SD-R (23,050) and SE (1,680) all dropped by 17.1%, 13.1% and 12.3%, respectively. Despite the noticeable decline in SD-R, it continued to account for a greater share (71.0%) of all benefits delivered in the province, signalling a continued priority in Quebec. As for TWS, it accounted for a greater share (15.6%) despite the drop in its total numbers. The Employment Benefits total expenditures fell to $337.8 million (-2.8%) in 2014/2015, consistent with recorded decline in intervention numbers.
2.6.2 Support Measures: Employment Assistance Services (EAS)
In 2014/2015, the increased EAS share (88.4%) of all interventions served in the province reflects a continued demand in the use of Support Measures. The number of EAS interventions grew to a total of 248,678, compared to 243,873 in 2013/14, representing the highest level in 10 years. It also reflects the continued increase in the number of non-insured clients served. Significantly increased numbers of Employment Services were delivered in Quebec in 2014/2015, reaching a total of 146,501 (+6.5%). The share of this EAS type also rose to 58.9% (+2.5 percentage points year over year). Similarly, Quebec served a growing number of Individual Counselling interventions (70,349), an increase of 15.7%. Conversely, the province delivered a significantly lower number of Group Services interventions, totaling 31,828 in 2014/2015 (-30.1%), with the share of this EAS type dropping also significantly to 12.8% from last year's 18.7%. The total expenditures of EAS rose notably to $157.3 million (+12.5%).
2.6.3 Other Support Measures: LMPs and R&I
For a second consecutive year, Quebec's total LMP and R&I expenditures fell, dropping to $84.8 million in 2014/2015 (-9.7%). The total expenditures for LMPs was $84.5 million, a significant decline of 9.7%, while R&I expenditures expanded considerably, (+21.1%) to a total of $253,000. However, total LMPs and R&I funding represented a declining share of the total expenditures of EBSM-similar programming, down from last year's 16.2% to 14.6% in 2014/2015.
2.6.4 Managing for Results
Quebec uses an evidence based approach to identify and address the main challenges of its labour market. To manage for results, the province also uses a decentralized approach, and allocates budgets and outcome targets based on factors pertaining to local labour markets, as well as personal characteristics of EI applicants. A key component of this approach is an effective targeting and referral (TRF) system, which supports and advances the acceleration of employment integration of those ready to enter the job market. A continued focus on increasing awareness as well as adapting and facilitating the use of labour market information is also a key aspect of its effective practices in managing for results effective practices. It is also worth noting also is that Quebec is responsible for assessing the effectiveness of its EBSM-similar programming.
2.7 Ontario
Ontario's real GDP grew by 2.7% in 2014 and by around 2.4% in 2015. Household spending, investments, and exports remain the main drivers of growth. Furthermore, lower oil prices, a more competitive Canadian dollar and solid US economic growth present opportunities for further growth in Ontario
In 2014/2015, Ontario averaged 79,500 job vacancies, an increase of 14,200 year over year. The province recorded its highest labour demand in retail trade, manufacturing, as well as in health care and social assistance. Despite a relatively solid economic performance, the province's job vacancy rate of 1.4% was just below the national average of 1.6%.
Ontario: EBSM Key Facts
| EI Clients | Non-Insured Clients |
|---|---|
| 82,795
|
71,278
|
| Interventions Type | 2014/2015 | Year-over-Year Change |
|---|---|---|
| Employment Benefits | 28,656 | 4.6%
|
| Support Measures: EAS | 144,011 | 3.3%
|
| Interventions Type | 2014/2015 | Year-over-Year Change (pp) |
|---|---|---|
| Employment Benefits | 16.6% | 0.2
|
| Support Measures: EAS | 83.4% | 0.2
|
| Total Expenditures | 2014/2015 ($ Million) |
Year-over-Year Change |
|---|---|---|
| Employment Benefits | $251.00 | 10.0%
|
| Support Measures: EAS | $290.00 | 6.7%
|
| LMPs and R&I | $29.50 | 101.0%
|
| Total Expenditures1 | $570.5 | 0.9%
|
| 2013/14 | 2014/2015 | Year-over-Year Change |
|---|---|---|
| $237.59 | $240.96 | 1.4%
|
- 1 Totals may not add due to rounding; does not include accounting adjustments.
Ontario's improving economic conditions are reflected in its 2014/2015 labour market aggregates. The labour forced expanded by 0.3% (+19,800) to a total of 7.42 million. Employment was up 0.6% (+43,700) to a total of 6.89 million, with full-time and part-time employment edging up by 0.5% (+26,600) and 1.3% (+17,100) respectively. Unemployment was down by 23,900 (-4.3%). In this context, the province's unemployment rate decreased to 7.2% (-0.3 percentage points).
In the goods-producing industries, overall employment edged down by 1.0% (-14,400), with notable losses recorded in manufacturing (-18,900 or -2.5%); agriculture (-3,700 or -4.4%); as well as in forestry, fishing, mining, oil and gas (-2,500 or -7.0%). The construction sector recorded a growth of 12,400 net jobs (+2.7%). Ontario's overall employment growth was sustained with an additional 58,000 net jobs (+1.1%) in the services-producing industries. Notable gains were observed in trade (+25,100 or +2.5%); educational services (+24,000 or +5.0%); health care and social assistance (+15,300 or +1.9); as well as in professional, scientific and technical services (+14,300 or +2.6%). Offsetting these gains on a net basis were notable employment losses observed in: transportation and warehousing (-15,300 or -4.5%); other services (-9,200 or -3.2%); and, public administration (-6,600 or -1.8%).
Ontario continues to face a number of labour market challenges, including an aging workforce and growing departures from the labour force (e.g. retirements from the baby-boom cohort). Recent immigrants (landed 10 years or less) with international qualifications still face a number of challenges, such as getting their foreign credentials and experience recognized. In addition, indigenous people, persons with disabilities, youth, and older workers experience unique labour market challenges compared to the rest of the labour force. To address these challenges, the province continued to focus on supporting its workforce through investments in skills development and training, as well as on enhancing employment programs to support quick returns to work. Specific activities included the launch of the Canada-Ontario Job Grant in 2014. In addition, the province continued to engage extensively with key stakeholders to build awareness and solicit feedback on Ontario's employment and training programs, as well as on its labour market priorities.
| Employment Benefits | Interventions | Year-over-Year Change | Expenditures ($ 000s) | |
|---|---|---|---|---|
| TWS | Employment Service - Job Placement with Incentive | 1,806 | -8.2% | 3,619 |
| SE | Ontario Self-Employment Benefit | 2,406 | -2.8% | 46,160 |
| JCPs | Ontario Job Creation Partnerships | 512 | -1.7% | 7,417 |
| SD-R | Second Career | 8,049 | -12.8% | 193,770 |
| SD-A | Skills Development-Apprenticeship | 15,883 | +0.3% | |
| Support Measures | ||||
| EAS | Ontario Employment Assistance Services/ Employment Service | 144,011 | -3.3% | 290,022 |
| LMPs | Ontario Labour Market Partnerships | N/A | N/A | 13,658 |
| R&I | Research and Innovation (including Canada Job Grant) | N/A | N/A | 15,843 |
Ontario served a total of 154,073 clients in 2014/2015, compared to 159,367 in 2013/14, a decrease of 3.3%. All the three client types contracted moderately, with the number of the non-insured clients (71,278) decreasing by 4.4%; followed by active claimants dropping down by 2.5% to 63,061; and, former claimants (19,734), edging down by 2.0%. The respective share of active and former EI insured clients rose to 40.9% and to 12.8% (up by +0.3 and +0.2 percentage points, respectively). On the other hand, the share of the non-insured clients declined to 46.3%, compared to 46.8% in 2013/14, consistent with its drop in total number of clients.
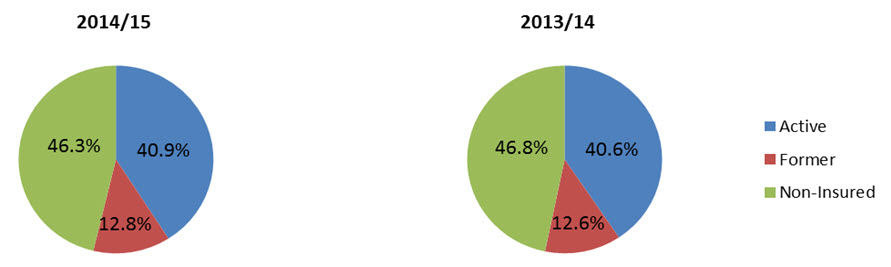
Show Data Table
| # | % | |
|---|---|---|
| Active Clients | 63,061 | 40.9% |
| Former Clients | 19,734 | 12.8% |
| Non-Insured | 71,278 | 46.3% |
| Total | 154,073 | 100.0% |
| # | % | |
|---|---|---|
| Active Clients | 64,689 | 40.6% |
| Former Clients | 20,145 | 12.6% |
| Non-Insured | 74,533 | 46.8% |
| Total | 159,367 | 100.0% |
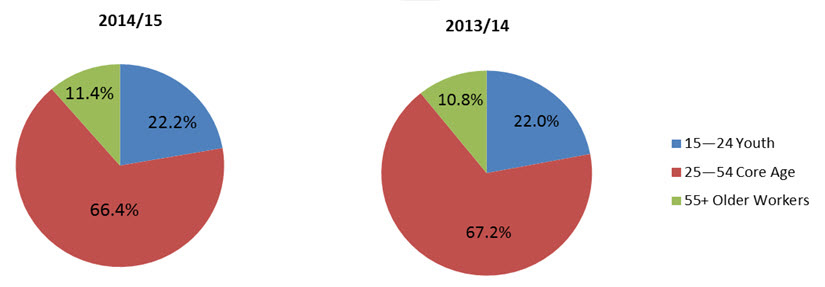
Show Data Table
| # | % | |
|---|---|---|
| 15–24 Youth | 30,738 | 22.2% |
| 25–54 Core Age | 91,792 | 66.4% |
| 55+ Older Workers | 15,687 | 11.3% |
| Unknown | 45 | 0.0% |
| Total | 138,262 | 100.0% |
| # | % | |
|---|---|---|
| 15–24 Youth | 31,648 | 22.0% |
| 25–54 Core Age | 96,636 | 67.2% |
| 55+ Older Workers | 15,477 | 10.8% |
| Unknown | 82 | 0.0% |
| Total | 191,366 | 100.0% |
After an increase over the past two years, the total number of EBSM-similar interventions delivered in the province declined to 172,667 in 2014/2015 (-3.6%). Both intervention types contracted, with Employment Benefits decreasing by 4.6% to total of 28,656 and EAS dropping moderately by 3.3% to a total of 144,011 interventions. Nonetheless, EAS interventions accounted for a greater share of 83.4% of all interventions delivered in the province (+0.2 percentage points). Returns to employment rose slightly (+0.4%) to total of 36,166 EI clients returning to work following participation in EBSM programing in 2014/2015. At $570.5 million, Ontario's total expenditures for its EBSM-similar programming represented 100% of the allocated funding.
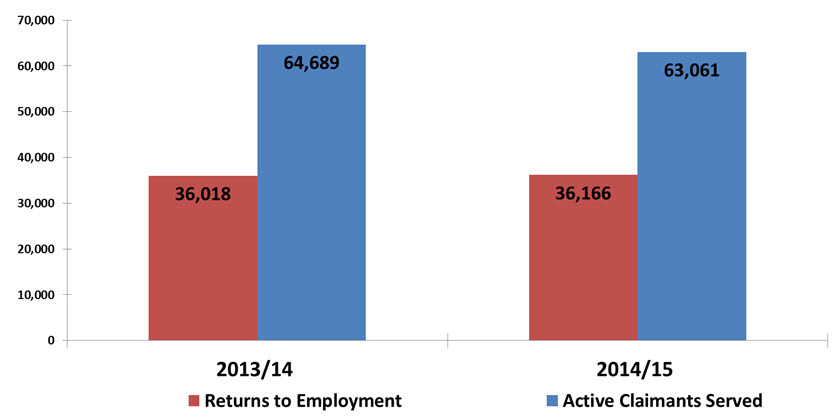
Show Data Table
| 2013/2014 | 2014/2015 | |
|---|---|---|
| Returns to Employment | 36,018 | 36,166 |
| Active Claimants Served | 64,689 | 63,061 |
| Clients total | 159,367 | 154,076 |
2.7.1 Employment Benefits
Ontario delivered 28,656 Employment Benefits interventions in 2014/2015, a year-over-year decline of 4.6%. Skills Development (SD-R) decreased by 12.8%, to a total of 8,049. SD-A grew slightly by 0.3% to 15,883. The other three benefit types all contracted, with TWS (1,806), SE (2,406) and JCPs (512) declining by 8.2%, 2.8% and 1.7%, respectively. Employment Benefits expenditures totalled $251.0 million in 2014/2015, compared to $279.0 million in 2013/14.
2.7.2 Support Measures: EAS
Following a notable growth in the previous two years, Ontario delivered a smaller number (144,011) of EAS interventions in 2014/2015 (-3.3%)—all delivered as Individual Counselling interventions. Footnote 22 EAS expenditures totalled $290 million (+6.7%).
2.7.3 Other Support Measures
Ontario's expenditures for LMPs and R&I more than doubled in 2014/2015, to a total $29.5 million (+101%). A dramatic increase (+1,797%) in the R&I total expenditures to $15.9 million compared to $840,000 in 2013/14 lifted this year's overall total of LMPs and R&I. This is the result of launching the Canada-Ontario Job Grant in September 2014. Ontario used R&I funds ($15,974,503) to support the Canada Job Grant initiatives. LMP decreased moderately (-1.3%) this year, to a total of $13.7 million in 2014/2015, compared to $13.8 million last year. The considerable growth in overall total investment reflects the province's support and commitment to workforce innovation and improving knowledge of trends in local labour markets to better target resources to meet Ontarians' needs.
2.7.4 Managing for Results
To support clients with active employment programming, Ontario's Ministry of Training, Colleges and Universities, Service Canada and employment service providers conduct joint client information sessions with EI claimants. These sessions provide clients with information on programs and services offered by the province and support them in re-entering the workforce. These services are available to all clients, regardless of where they are in their EI claim.
To improve assessment and monitoring of EBSM programming, Ontario has a performance management system for Employment Services that focuses on core measures and standards for the Service Quality Standard (SQS). The SQS allows the province to effectively monitor the progress and performance of its service providers according to their: effectiveness, efficiency, and quality of customer service. The system ensures funded service providers understand what is expected of them by setting out clear and consistent expectations. This allows Ontario to evaluate program and service provider performance in a consistent, transparent and evidence-based manner.
2.8 Manitoba
All key sectors of Manitoba's economy have been expanding, pushing the province's real GDP growth to 2.3% in 2014, and it is projected to grow at 1.8% in 2015. Led by solid gains in manufacturing, construction, and agriculture, Manitoba's goods sector is driving growth. With an improving U.S. economy and a lower Canadian dollar, export-orientated industries are well-positioned to capitalize on this context. The healthy growth in the goods-producing industries will be mirrored in the services sector.
In 2014/2015, Manitoba posted a significantly lower number of job vacancies (8,725) than in the previous year (10,000). The strongest labour demand was seen in health care and social services, retail trade and manufacturing. Manitoba's job vacancy rate was 1.7%, slightly higher than the national average 1.6%.
Manitoba: EBSM Key Facts
| EI Clients | Non-Insured Clients |
|---|---|
| 13,668
|
15,174
|
| Interventions Type | 2014/2015 | Year-over-Year Change |
|---|---|---|
| Employment Benefits | 6,206 | 4.2%
|
| Support Measures: EAS | 54,381 | 15.1%
|
| Interventions Type | 2014/2015 | Year-over-Year Change (pp) |
|---|---|---|
| Employment Benefits | 10.2% | 1.8
|
| Support Measures: EAS | 89.8% | 1.8
|
| Total Expenditures | 2014/2015 ($ Million) |
Year-over-Year Change |
|---|---|---|
| Employment Benefits | $27.6 | 6.7%
|
| Support Measures: EAS | $7.8 | 4.7%
|
| LMPs and R&I | $7.6 | 18.9%
|
| Total Expenditures1 | $43.1 | 1.0%
|
| 2013/14 | 2015/15 | Year-over-Year Change |
|---|---|---|
| $44.28 | $43.09 | 2.7%
|
- 1 Totals may not add due to rounding; does not include accounting adjustments.
Aligned with Manitoba's economic performance, the labour force in the province expanded (+5,400 or +0.8%) to a total of 665,900. On a net basis, employment increased by 1% (+6,100), with full-time jobs up by 7,900 while part-time employment shrunk by 1,900. Unemployment dropped by 600 (-1.6%) finishing the year at 36,000. In this context, the unemployment rate edged down to 5.4%, a decrease of 0.1 percentage points year over year.
Both goods-producing and services-producing industries recorded net employment gains, increasing by 2,100 and 3,900 respectively. Across goods-producing industries, construction (+1,500 or +3.4) and manufacturing (+1,300 or +2%) recorded the strongest gains. The agriculture saw the biggest decline, shedding 1,300 net jobs compared to the previous year. Among services-producing industries, health care and social assistance (+4,500 or +4.7%), as well as educational services (+3,200 or +6.9%) saw the biggest employment gains. Business, building and other support services (-3,100 or -15.5%), as well as professional, scientific and technical services (-2,100 or -8.1%) recorded the largest losses.
Strong economic conditions, growth and expansions of businesses and aging population coupled with an exodus of retirees from the workforce have increased the demand for skilled workers in Manitoba. In 2014/2015, the province continued to advance its Skills Strategy to address reported skilled labour shortages.
Labour market priorities included ensuring foreign credentials align well with employer-demand for skills, especially among occupations with the most vacancies, and addressing gaps in language and essential skills to move towards a greater degree of labour market integration. Additional labour market priorities are: supporting pathways to employment, primarily through improving coordination among and fostering partnerships with service providers, training institutions and community agencies; placing emphasis on employer needs in order to ensure that long term employment outcomes are realized; and supporting Indigenous peoples, persons with disabilities and those detached from the labour market, who continue to be an important priority for the province's economic and social development goals.
| Employment Benefits | Interventions | Year-over-Year Change | Expenditures ($ 000s) | |
|---|---|---|---|---|
| TWS | Wage Subsidies | 53 | -3.6% | 317 |
| SE | Self-Employment | 120 | -14.9% | 1,077 |
| JCPs | Employment Partnerships | 135 | +6.3% | 989 |
| SD-R | Skills Development | 1,966 | -15.8% | 25,224 |
| SD-A | Skills Development-Apprenticeship | 3,932 | +2.9% | |
| Support Measures | ||||
| EAS | Employment Assistance Services | 54,381 | +15.1% | 7,838 |
| LMPs | Labour Market Partnerships | N/A | N/A | 5,635 |
| R&I | Research and Innovation | N/A | N/A | 2,003 |
After a decline in 2013/14, the number of clients served increased moderately by 2.6% year over year, to a total of 28,842. The numbers of former (3,672) claimants and non-insured clients (15,174) both expanded (+2.6% and +12.1%, respectively). Active claimants' numbers (9,996), on the other hand, decreased significantly (-9.0%). As a result, the share of former claimants remained stable at 12.7%, while the share of non-insured clients grew notably to 52.6% (+4.4 percentage points) and that of active claimants fell to 34.7%, compared to 39.1% in 2013/14.
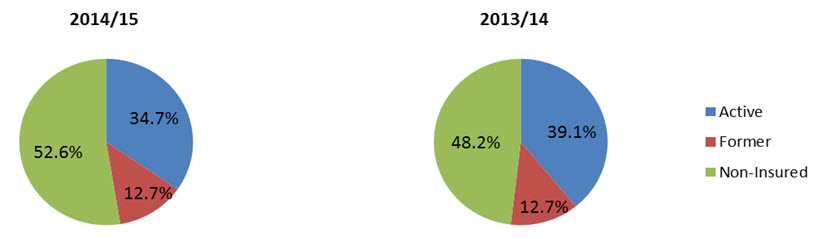
Show Data Table
| # | % | |
|---|---|---|
| Active Clients | 9,996 | 34.7% |
| Former Clients | 3,672 | 12.7% |
| Non-Insured | 15,174 | 52.6% |
| Total | 28,42 | 100.0% |
| # | % | |
|---|---|---|
| Active Clients | 10,988 | 39.1% |
| Former Clients | 3,579 | 12.7% |
| Non-Insured | 13,540 | 48.2% |
| Total | 28,107 | 100.0% |
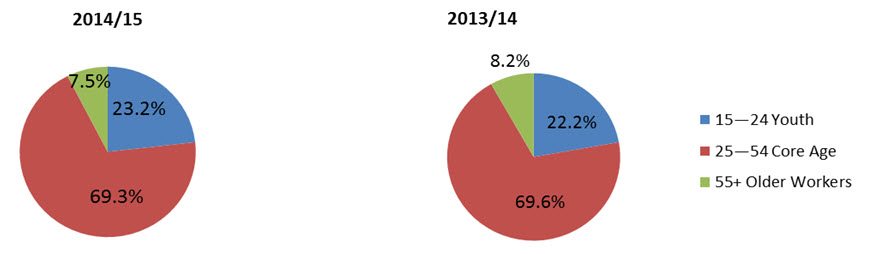
Show Data Table
| # | % | |
|---|---|---|
| 15–24 Youth | 5,632 | 23.2% |
| 25–54 Core Age | 16,828 | 69.2% |
| 55+ Older Workers | 1,830 | 7.5% |
| Unknown | 11 | 0.0% |
| Total | 24,301 | 100.0% |
| # | % | |
|---|---|---|
| 15–24 Youth | 5,264 | 22.2% |
| 25–54 Core Age | 16,519 | 69.6% |
| 55+ Older Workers | 1,943 | 8.2% |
| Unknown | 15 | 0.0% |
| Total | 23,741 | 100.0% |
Manitoba delivered a total of 60,587 interventions in 2014/2015, a significant year-over-year increase of 12.8% (+6,864), possibly due to slow economic growth in 2014. The Support Measures accounted for an increasing share of 89.8% of all interventions, compared to 87.9% in the previous year. Overall, the EAS share has remained on an upward trend over the last several years, reaching a 10-year high. Conversely, the share of Employment Benefits continued to decline, reaching 10.2% (-1.8 percentage points year over year). At $43.1 million, Manitoba's total expenditures for its EBSM-similar programming represented 100% of the allocated funding.
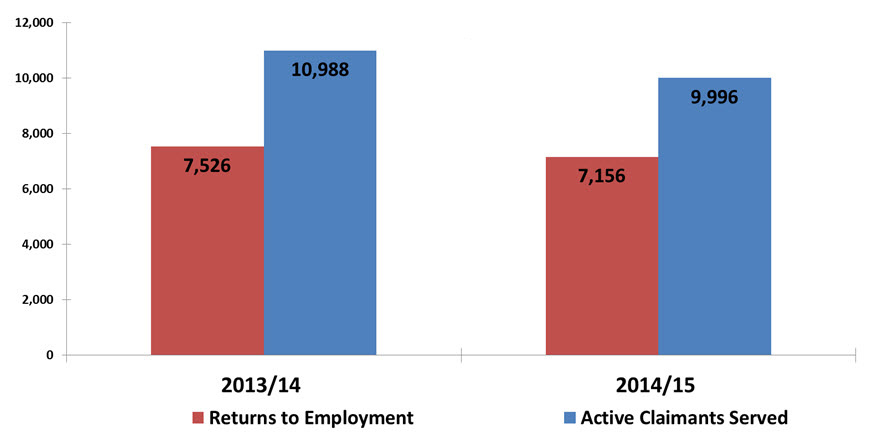
Show Data Table
| 2013/2014 | 2014/2015 | |
|---|---|---|
| Returns to Employment | 7,526 | 7,156 |
| Active Claimants Served | 10,988 | 9,996 |
2.8.1 Employment Benefits
Manitoba delivered a smaller number of Employment Benefits interventions in 2014/2015 totaling 6,206, a 4.2% year-over-year drop, consistent with the significant decline in active clients served. SD-A (3,932) and JCP (135) both increased, by 2.9% and 6.3% respectively. The other three benefit types all decreased, with SD-R (1,966) declining the most at 15.8%; followed by SE (120) at 14.9% and TWS (53) at 3.6%. Consequently, SD-R's share of all benefits declined, from 36.0% in the previous year to 31.7% in 2014/2015. Overall, the shares of SD-R and SD-A combined continued to account for an increasing proportion of all benefits (95.1%). Consistent with the decline in the numbers of Employment Benefits, its total expenditures also dropped significantly (-6.7%), to $27.6 million in 2014/2015.
2.8.2 Support Measures: EAS
An increasing number of EAS interventions (54,381) were delivered in Manitoba in 2014/2015, a significant increase of 15.1% (+7,138) year over year, reflecting a continued support to employment-ready clients for quick returns to work. The share of EAS of all EBSM interventions also grew to 89.8%, compared to 87.9% in the previous year. The increase in the number and share of EAS is largely due to the increase in the number of non-insured clients, which grew from 48.2% in 2013/14 to 52.6% of all clients served in 2014/2015. Conversely, the share of active claimants dropped from 39.1% to 34.7%, while that of former claimants remained unchanged at 12.7%. For a second consecutive year, the province delivered a greater number of Employment Services interventions, reaching 39,241 in 2014/2015, a considerable year-over-year growth of 26.4% (+8,195). In contrast, Individual Counselling has declined significantly, dropping from 16,197 in 2013/14 to 15,140 this year (-6.5%). EAS expenditures rose to $7.8 million (+4.7%), consistent with the expansion in those of Employment Services.
2.8.3 Other Support Measures: LMPs and R&I
After a noticeable decline in 2013/14, Manitoba's total expenditures for LMPs and R&I increased significantly to $7.6 million this year (+18.9%). Expansion in total expenditures was mainly driven by a sharp growth in R&I to $2.0 million (+61.5%), of which $1.4 million supported the Canada-Manitoba Job Grant initiatives. A significant increase (+8.7%) in LMPs expenditures lifted its total to $5.6 million. Together, the overall growth of LMPs and R&I expenditures represented an increasing share (17.7%) of EBSM-similar programming, as compared to last year's (14.8%).
2.8.4 Managing for Results
To support clients with active employment programming, Manitoba has developed and implemented an Employment and Training Assessment (ETA) tool as part of the intake process for all clients. The tool is used to assess an individual's employability and work readiness to determine appropriate interventions based on the assessment results. Manitoba is updating existing information systems (i.e. the Integrated Case Management System and the Service Provider Reporting System) to support implementation of the ETA across the external service provider network and ensure a level of standardization of client assessment.
2.9 Saskatchewan
After expanding at a rate of 1.9% in 2014, Saskatchewan's real GDP is estimated to have contracted by around 1% in 2015. The drop in oil prices, as well as drought conditions that led to a decline in agriculture output had a negative impact on the province's economy. In addition, Saskatchewan's construction sector slowed down in 2015, as major mine expansion projects were completed or postponed. The housing market exhibited weakness reflecting slowing demand, as well as, a multi-year period of overbuilding. However, the mining sector has been a bright spot in the economy, driven by continued strength in potash and uranium production.
Saskatchewan: EBSM Key Facts
| EI Clients | Non-Insured Clients |
|---|---|
| 13,068
|
813
|
| Interventions Type | 2014/2015 | Year-over-Year Change |
|---|---|---|
| Employment Benefits | 7,570 | 7.7%
|
| Support Measures: EAS | 10,839 | 4.2%
|
| Interventions Type | 2014/2015 | Year-over-Year Change (pp) |
|---|---|---|
| Employment Benefits | 41.1% | 3.0
|
| Support Measures: EAS | 58.9% | 3.0
|
| Total Expenditures | 2014/2015 ($ Million) |
Year-over-Year Change |
|---|---|---|
| Employment Benefits | $28.6 | 2.7%
|
| Support Measures: EAS | $4.7 | 15.7%
|
| LMPs and R&I | $2.6 | 14.5%
|
| Total Expenditures1 | $35.9 | 1.6%
|
| 2013/14 | 2014/2015 | Year-over-Year Change |
|---|---|---|
| $60.81 | $61.60 | 1.3%
|
- 1 Totals may not add due to rounding; does not include accounting adjustments.
In 2014/2015, Saskatchewan recorded an average of 9,100 job vacancies, an increase of 600 job vacancies over the previous fiscal year. The strongest labour demand in the province came from health care and social assistance, retail trade, and educational services. The provincial job vacancy rate of 2% was higher than the national average of 1.6%, making Saskatchewan one of the tightest labour markets in Canada.
Despite a slowing economy, Saskatchewan's labour market posted generally positive indicators. In 2014/2015, the labour force grew (+0.7%) to a total of 595,100. Employment increased by 1%, totalling 571,400 jobs, with full-time employment increasing (+5,600), while part-time work decreased slightly (-300). Unemployment edged down by 1,100 (-4.3%) from last year's level of 24,900. In this context, the provincial unemployment rate dipped to 4%, the lowest of any Canadian province.
Both goods-producing and services-producing industries recorded employment gains, increasing by 4,400 and 1,000, respectively. Among goods-producing industries, construction (+3,400 or +6.3%) and forestry, fishing, mining, oil and gas (+1,600 or +5.9%) posted the strongest employment gains. The services-producing industries added a total of 1,000 net jobs (+0.2%), with employment gains mainly observed in finance, insurance, real estate and leasing (+2,700 or +9.6%); accommodation and food services (+2,000 or +5.7%); as well as in educational services (+2,000 or +4.7%). The largest declines came in trade (-2,500 or -2.9%), as well as in information, culture and recreation (-1,200 or -6.7%).
Skills shortages, competition for skilled workers and an aging population continued to pose challenges for Saskatchewan's labour market in 2014/2015 despite a slower economy. The province highlighted a number of priorities to address these challenges, including: increasing future labour supply through developing the knowledge and skills of its workforce (especially under-represented groups); pursuing five new training initiatives in partnerships with employers, First Nations and post-secondary institutions; improving employment outcomes and skills matching for adults, through an expansion of demand driven labour market programs that address the needs of employers; attracting skilled workers from across Canada and the world, and continuing to offer a "Talent Team" approach to address the short-term and long-term workforce needs for large capital infrastructure projects.
| Employment Benefits | Interventions | Year-over-Year Change | Expenditures ($ 000s) | |
|---|---|---|---|---|
| TWS | Skills Training Allocation | - | N/A | - |
| SE | Self-Employment Program | 66 | -14.3% | 301 |
| JCPs | Employment Programs | - | N/A | - |
| SD-R | Skills Training Benefit Provincial Training Allowance | 938 | -11.7% | 28,278 |
| SD-A | Apprenticeship Training | 6,566 | -7.0% | |
| Support Measures | ||||
| EAS | Workforce Development | 10,839 | +4.2% | 4,692 |
| LMPs | Regional and Sectoral Partnerships | N/A | N/A | 2,401 |
| R&I | Research and Innovation | N/A | N/A | 184 |
For a second consecutive year, Saskatchewan served an increased number of clients, reaching a total of 13,881 in 2014/2015 (+0.6%). The numbers of active claimants (10,503) and the non-insured clients (813) each expanded at an equal pace of 1.9% year over year. In addition, these two client types accounted for a greater share of all clients served (75.7%, and 5.9%, respectively), compared to 74.7% and 5.8% in 2013/14. On the other hand, the total number (2,565) and share (18.5%) of former claimants both declined (-4.5% and -1.0 percentage points, respectively).
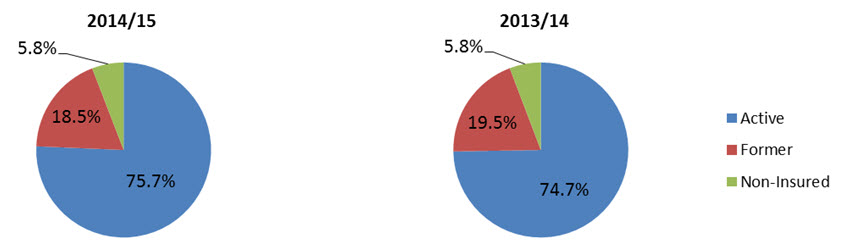
Show Data Table
| # | % | |
|---|---|---|
| Active Clients | 10,503 | 75.7% |
| Former Clients | 2,565 | 18.5% |
| Non-Insured | 813 | 5.9% |
| Total | 13,881 | 100.0% |
| # | % | |
|---|---|---|
| Active Clients | 10,308 | 74.7% |
| Former Clients | 2,687 | 19.5% |
| Non-Insured | 798 | 5.8% |
| Total | 13,793 | 100.0% |
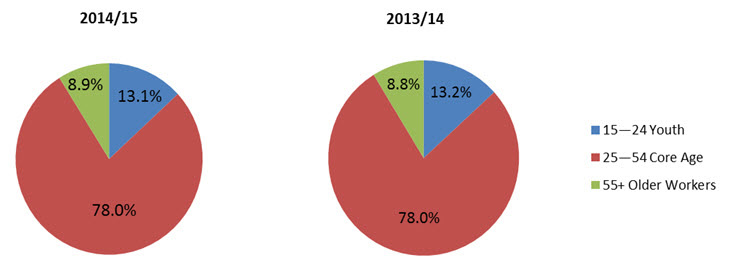
Show Data Table
| # | % | |
|---|---|---|
| 15–24 Youth | 968 | 13.1% |
| 25–54 Core Age | 5,743 | 77.9% |
| 55+ Older Workers | 657 | 8.9% |
| Unknown | 3 | 0.0% |
| Total | 7,371 | 100.0% |
| # | % | |
|---|---|---|
| 15–24 Youth | 946 | 13.2% |
| 25–54 Core Age | 5,574 | 77.9% |
| 55+ Older Workers | 627 | 8.8% |
| Unknown | 10 | 0.0% |
| Total | 7,157 | 100.0% |
Saskatchewan delivered a lower number of interventions in 2014/2015, totaling 18,409, compared to 18,603 last year. The share of Employment Benefits of this total dropped to 41.1% (-3.0 percentage points), while that of EAS grew to 58.9% (+3.0 percentage points), after dipping slightly in 2013/14. The growth in the share of EAS reflects the notable increase in the number of the support measures, which reached a total of 10,839 (+4.2%). As the case was in 2013/14, a total of 6,038 EI clients returned to employment following participation in the program. At $35.9 million, Saskatchewan's total expenditures for its EBSM-similar programming represented 100% of the allocated funding. At the same time, with stable returns to work over recent years, unpaid benefits rose to $61.6 million (+1.3% year over year).
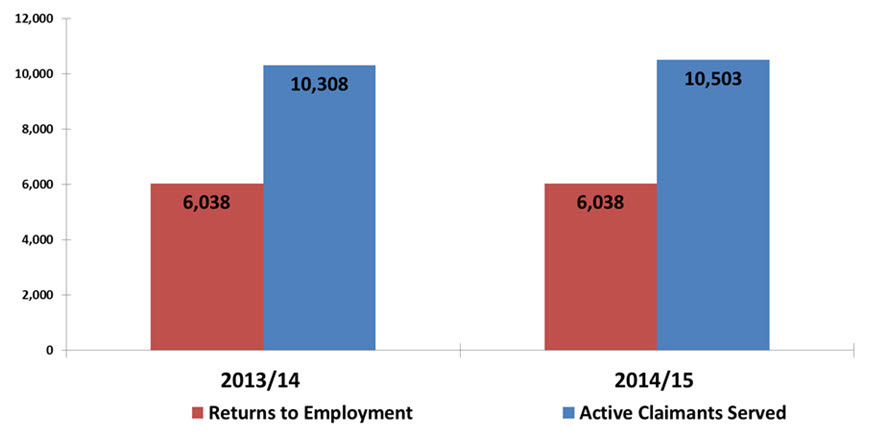
Show Data Table
| 2013/2014 | 2014/2015 | |
|---|---|---|
| Returns to Employment | 6,038 | 6,038 |
| Active Claimants Served | 10,308 | 10,503 |
2.9.1 Employment Benefits
A significantly smaller total number of Employment Benefits (7,570) were delivered in Saskatchewan in 2014/2015, compared to 8,200 in the previous year, with the three benefit types all declining. SD-A, the most commonly used benefit intervention in the province, decreased (-7.0%) to 6,566. Similarly, the numbers of SD-R (938) and SE (66) both declined significantly, by 11.7% and 14.3%, respectively. Consistent with growth in its numbers, SD-A accounted for a growing share of 86.7% of total benefits, compared to 86.1% in the previous year, reflecting a continued emphasis on meeting rising demand for skilled trades in the province. Overall, expenditures for Employment Benefits rose to $28.6 million (+2.7%).
2.9.2 Support Measures (EAS)
The numbers of EAS delivered in Saskatchewan in 2014/2015 expanded to a total of 10,839 (+4.2%), consistent with increased demand by clients ready for quick returns to employment in the province's robust labour market. Saskatchewan delivered more Individual Counselling (4,785) and Group Services (560) interventions (+9.1% and +18.9%, respectively), while the use of Employment Services dropped slightly to 5,494 (-0.9%). For a second consecutive year, EAS expenditures declined significantly, down to $4.7 million in 2014/2015 (a year-over-year decrease of 15.7%), another indication of a strong labour market.
2.9.3 Other Support Measures: LMPs and R&I
Saskatchewan's total expenditures for LMPs and R&I fell significantly to $2.6 million, compared to $3.0 million in 2013/14. LMP's funding ($2.4 million) recorded a notable decline of 8.0%. At a drop rate of 55.6%, R&I's declined sharply to a total of $0.2 million, almost half the value recorded in 2013/14.
2.9.4 Managing for Results
Saskatchewan's Outcomes-Based Contract Management (OBCM) is developed in collaboration with community-based organizations to support shared commitments to positive results for job seekers and employers. It also improves client outcomes. The province has negotiated specific outcomes directly into contracts with third party suppliers, so that they understand what they are responsible for achieving and how their performance will be measured.
2.10 Alberta
After a solid growth of 4.8% in its real GDP for 2014, Alberta's economy is forecasted to contract by 2.0% in 2015, stemming from the slide in oil prices since mid-2014. This drop is rippling through the entire economy as construction output is down by 20%; and housing starts, by 10%. In this context, consumer confidence also dropped.
In 2014/2015, Alberta posted an average of 44,900 job vacancies (-2,800 year over year). The strongest labour demand in the province is concentrated in retail trade, construction, and in accommodation and food services. With a job vacancy rate of 2.3%, Alberta's rate was considerably higher than the national average of 1.6%. In this context, at the sub-national level, the province's labour market remains the tightest in Canada.
Alberta: EBSM Key Facts
| EI Clients | Non-Insured Clients |
|---|---|
| 59,218
|
60,344
|
| Interventions Type | 2014/2015 | Year-over-Year Change |
|---|---|---|
| Employment Benefits | 24,288 | 6.5%
|
| Support Measures: EAS | 212,188 | 9.3%
|
| Interventions Type | 2014/2015 | Year-over-Year Change (pp) |
|---|---|---|
| Employment Benefits | 10.3% | 1.4
|
| Support Measures: EAS | 89.7% | 1.4
|
| Total Expenditures | 2014/2015 ($ Million) |
Year-over-Year Change |
|---|---|---|
| Employment Benefits | $84.0 | 4.9%
|
| Support Measures: EAS | $23.2 | 14.4%
|
| LMPs and R&I | $2.0 | 0.3%
|
| Total Expenditures1 | $109.1 | 0.0% ─ |
| 2013/14 | 2014/2015 | Year-over-Year Change |
|---|---|---|
| $249.34 | $266.99 | 7.1%
|
- 1 Totals may not add due to rounding; does not include accounting adjustments.
Employment in the province increased by 2.1%, adding 46,500 jobs on a net basis: 28,200 were full-time and 18,200 were part-time. Unemployment increased by 9,500 (+8.8%), finishing the year at 117,300. The provincial unemployment rate went up by 0.3 percentage points, to a total of 4.9%. The labour participation rate decreased (-0.3 percentage points) to 72.8%, dropping below 73% for the first time since 2010/11.
The goods-producing industries added 13,200 net jobs, mainly concentrated in construction (+11,900 or +4.8%). The services-producing industries added 33,300 net jobs, with the majority of the gains focused in transportation and warehousing (+14,800 or +12.2%); health care and social assistance (+14,300 or +6.1%); as well as accommodation and food services (+5,800 or +3.9%). Offsetting some of these gains were net employment losses in: trade (-12,200 or -3.7%); information, culture, and recreation (-2,400 or -3.2%); and public administration (-1,300 or -1.5%).
Alberta continues to face labour and skill shortages associated with a relatively strong long term economic growth trend, and an increased need to meet operating requirements in a knowledge-based economy. In this context, the province established a number of priorities to address key labour force pressures stemming from an aging workforce, combined with internal and external competition for talents of skilled and experienced workers.
| Employment Benefits | Interventions | Year-over-Year Change | Expenditures ($ 000s) | |
|---|---|---|---|---|
| TWS | Workplace Training | 49 | +19.5% | 733 |
| SE | Self Employment | 120 | -42.0% | 1,318 |
| JCPs | Integrated Training | 598 | -7.9% | 7,463 |
| SD-R | Occupational Training Work Foundations | 1,029 | -39.0% | 74,452 |
| SD-A | Skills Development-Apprenticeship | 22,492 | +11.2% | |
| Support Measures | ||||
| EAS | Career Information | 222,188 | -9.3% | 23,177 |
| LMPs | Workforce Partnerships | N/A | N/A | 1,995 |
A smaller number of clients (119,562) participated in EBSM-similar programming in Alberta in 2014/2015, signaling yet again a continued low demand for employment programming. This represented a drop of 2.6% year-over-year, and the lowest recorded over the last seven years. Despite the decline in the total number of clients, the number of active claimants served continued to increase, reaching 43,398 (2.2%). Conversely, former claimants (15,820) and non-insured clients (60,344) both declined, with their numbers falling significantly by 5.9% and 5.0%, respectively. As a result, active claimants' share increased to 36.3% of the total clients served, while the shares of former claimants (13.2%) and non-insured clients (50.5%) both dropped (-0.5 and -1.2 percentage points, respectively).
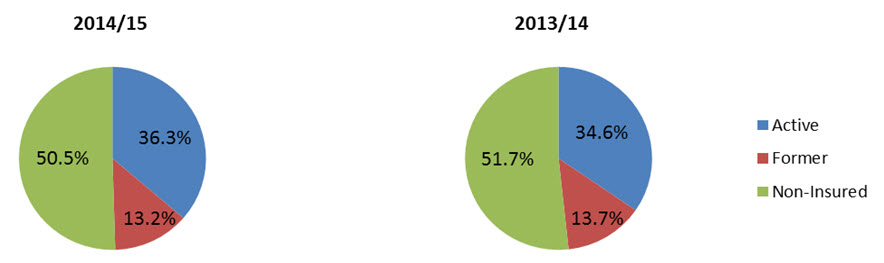
Show Data Table
| # | % | |
|---|---|---|
| Active Clients | 43,398 | 36.3% |
| Former Clients | 15,820 | 13.2% |
| Non-Insured | 60,344 | 50.5% |
| Total | 119,562 | 100.0% |
| # | % | |
|---|---|---|
| Active Clients | 42,472 | 34.6% |
| Former Clients | 16,819 | 13.7% |
| Non-Insured | 63,516 | 51.7% |
| Total | 122,807 | 100.0% |
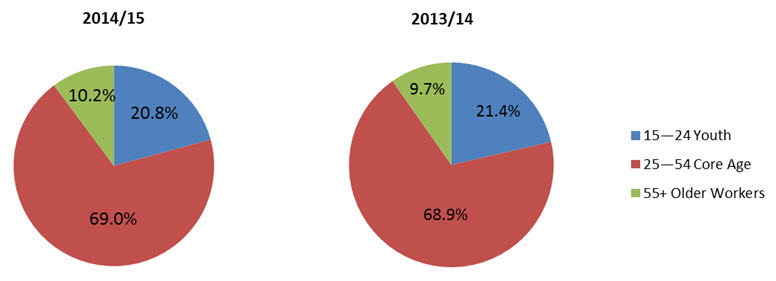
Show Data Table
| # | % | |
|---|---|---|
| 15–24 Youth | 20,752 | 20.8% |
| 25–54 Core Age | 68,930 | 69.0% |
| 55+ Older Workers | 10,157 | 10.2% |
| Unknown | 31 | 0.0% |
| Total | 99,870 | 100.0% |
| # | % | |
|---|---|---|
| 15–24 Youth | 22,398 | 21.4% |
| 25–54 Core Age | 72,087 | 68.8% |
| 55+ Older Workers | 10,204 | 9.7% |
| Unknown | 39 | 0.0% |
| Total | 191,366 | 100.0% |
In 2014/2015, Alberta delivered a decreasing total number of interventions of 236,476 (-7.9%) compared to 256,692 in the previous year. This total also represented the lowest count over the last seven years. Changes in the shares of employment benefits (10.3%) and support measures (89.7%) both mirrored their respective interventions, with the proportion of employment benefits trending upwards, while that of support measures trending downwards. For a second consecutive year, the number of returns to employment increased, with a total of 25,745 EI clients returning to employment following participation in EBSM-similar programming, a moderate year-over-year increase of 2.6% (+653). The number of returns to employment is also 10.5% higher than in 2005/06. At $109.1 million, Alberta's total expenditures for its EBSM-similar programming represented 100% of the allocated funding.
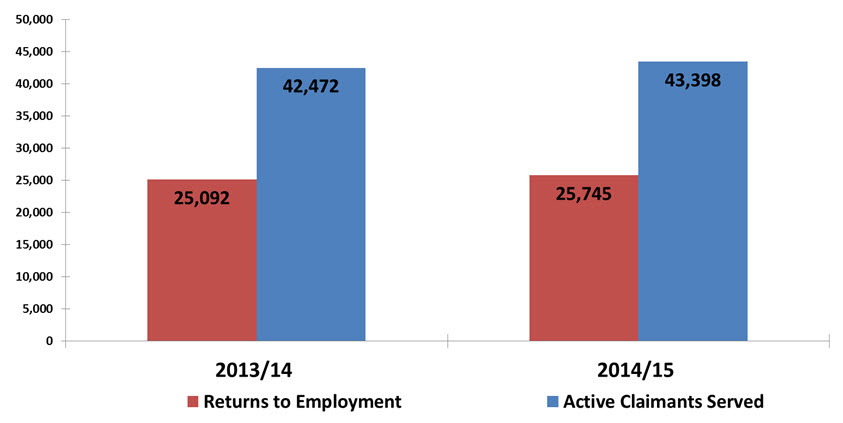
Show Data Table
| 2013/2014 | 2014/2015 | |
|---|---|---|
| Returns to Employment | 25,092 | 25,745 |
| Active Claimants Served | 42,472 | 43,398 |
2.10.1 Employment Benefits
Alberta delivered more Employment Benefits (24,288) interventions in 2014/2015, a significant year-over-year growth of 6.5% and a four-year high. SD-A (+11.2%) and TWS (+19.5%) both expanded by reaching 22,492 and 49, respectively. In contrast, the numbers of the other three benefit types all declined significantly, with SD-R dropping to 1,029 (-39.0%), SE falling by 42.0% to 120 and JCP down by 7.9% to 598 interventions. SD-A continued to account for a growing share (92.6%) of all benefits, compared to 88.7% in the previous year. Furthermore, the share of SD-A and SD-R combined represented 96.8% of all benefits. The expenditures of Employment Benefits totalled $84.0 million, a year-over-year increase of 4.9%.
2.10.2 Support Measures: EAS
The number of EAS interventions delivered in Alberta declined for a fifth consecutive year, reflecting Alberta's strong long-term economic growth trend and its robust labour market. The province delivered a total of 212,188 Employment Services interventions in 2014/2015, a significant year-over-year drop of 9.3%. Similarly, the EAS expenditures also fell notably (-14.4%) in 2014/2015, its lowest value since 2005/06, at $23.2 million.
2.10.3 Other Support Measures: LMPs
After a significant increase of 12.3% in 2013/14, Alberta's investment in LMPs remained stable at $2.0 million in 2014/2015. In addition, LMPs funding's share of the total EBSM's expenditures stayed unchanged at 1.8%. Alberta's continued investment in LMPs reflects a collaborative labour force partnership focused on the labour force needs of business and industry, support of employers hiring underrepresented workers and the promotion of workplace essential skills.
2.10.4 Managing for Results
To support EI clients with active employment programming, Alberta is engaged in the Citizen Centred Integrated Service Delivery (CCISD) planning stage. One component is to identify Career and Employment programming for those closer to the labour market while also building more supportive programming for those who are farther from the labour market.
2.11 British Columbia
In 2014, British Columbia's real GDP expanded by 3.2% and is poised to have grown closer to 2.4% in 2015. Strong growth in manufacturing and gains in the services-sector is propelling the province's economy. British Columbia's export received a large boost from growing momentum in the U.S. economy. Exports of aircraft products and services; motor vehicles; as well as of machinery and equipment were strong. In addition, a strong resale housing market supported consumer spending activities, and retail sales were higher in British Columbia than in any other provinces and territories.
British Columbia: EBSM Key Facts
| EI Clients | Non-Insured Clients |
|---|---|
| 44,439
|
32,365
|
| Interventions Type | 2014/2015 | Year-over-Year Change |
|---|---|---|
| Employment Benefits | 19,505 | 2.7%
|
| Support Measures: EAS | 190,141 | 7.6%
|
| Interventions Type | 2014/2015 | Year-over-Year Change (pp) |
|---|---|---|
| Employment Benefits | 9.3% | 0.9
|
| Support Measures: EAS | 90.7% | 0.9
|
| Total Expenditures | 2014/2015 ($ Million) |
Year-over-Year Change |
|---|---|---|
| Employment Benefits | $163.7 | 3.3%
|
| Support Measures: EAS | $92.9 | 3.2%
|
| LMPs and R&I | $19.8 | 9.7%
|
| Total Expenditures1 | $276.4 | 0.0%─ |
| 2013/14 | 2014/2015 | Year-over-Year Change |
|---|---|---|
| $121.85 | $126.68 | 4.0%
|
- 1 Totals may not add due to rounding; does not include accounting adjustments.
In 2014/2015, British Columbia averaged 34,300 job vacancies, an increase of 4,400 year over year. The greatest labour demand was recorded in retail trade, health care and social assistance, as well as in accommodation and food services. With a job vacancy rate of 1.7%, British Columbia's average was slightly higher than the 1.6% national average.
The labour force (2,424,000) remained relatively stable (-0.1%) while employment edged up by 0.4% (+8,500). On a net basis, gains in full-time employment (+20,600) more than offset part-time job (-12,100) losses. Unemployment was down by 11,200 year over year. In this context, the unemployment rate dropped from 6.5% to 6% since 2013/14.
Employment in the goods-producing industries increased by 5,800 (+1.3) with the strongest gains observed in manufacturing (+12,100 or +7.9%); forestry, fishing, mining, oil and gas (+2,200 or +4.6); and utilities (+2,000 or +16.8%). The biggest net losses were registered in construction (-6,700 or -3.2%) and agriculture (-3,900 or -14.2%). The services-producing industries experienced a moderate employment growth rate of 0.2%, to a total of 1,827,000. Notable net gains were registered in: transportation and warehousing (+9,000 or +7.1%); other services (+6,400 or +6.5%) and professional, scientific and technical services (+3,700 or +2%). Employment decreases were concentrated in: business, building and other support services (-7,000 or -7.4%); finance, insurance, real estate and leasing (-6,200 or -4.4%); and trade (-4,600 or -1.3%).
With a continued focus on sustaining job opportunities that meet employer needs, the province advanced its commitments to strengthening the labour market through delivering responsive programs and services and by better aligning skills training with local labour market needs and priorities. Key labour market priorities for 2014/2015 included: investing in training to better align British Columbians with sustainable job opportunities and to meet employer needs; developing strategies to engage all British Columbians in the activation of the unemployed; continuing to partner with local communities and organizations to further develop and increase community-based partnerships across the province; and enhancing support for its Employment Program British Columbia (EPBC) through continued improvement of research and innovation, measurement, and reporting capabilities.
| Employment Benefits | Interventions | Year-over-Year Change | Expenditures ($ 000s) | |
|---|---|---|---|---|
| TWS | Wage Subsidies | 1,295 | +11.7% | 5,893 |
| SE | Self Employment | 1,946 | -5.7% | 10,483 |
| JCPs | Job Creation Partnerships | 498 | +16.9% | 6,853 |
| SD-R | Skills Development Employment Benefit | 3,367 | +0.7% | 140,459 |
| SD-A | Skills Development Employment Benefit - Apprenticeship | 12,399 | +3.3% | |
| Support Measures | ||||
| EAS | Employment Assistance Services | 190,141 | -7.6% | 92,890 |
| LMPs | Labour Market Partnerships Employer-Sponsored Training | N/A | N/A | 6,887 |
| R&I | Research and Innovation | N/A | N/A | 12,909 |
With a total number of 76,804 clients in 2014/2015, British Columbia's count was 5.9% below the total of 81,628 recorded a year earlier. Active claimants total numbers increased slightly (+0.9%), to 34,937. Conversely, the other two client types decreased, with former claimants declining the most (-16.2%), to 9,502, and non-insured clients dropping significantly (-9.3%), down to a total number of 32,365. The shares of the three client types also shifted similarly to their respective intervention's numbers with that of active claimants growing to 45.5%, up from the 42.4% in the previous year, and the shares of former claimants (12.4 %) and non-insured clients (42.1%), both declining compared to 13.9% and 43.7%, respectively, in 2013/14.
With respect to client distribution by age, the share of the core age of all clients remained stable (69.9%), while the proportion of older workers edged up to 15.1% from 14.6% in 2013/14. Conversely, the share of youth dropped down to 15.0% from a high of 15.5%, another sign of an aging population.
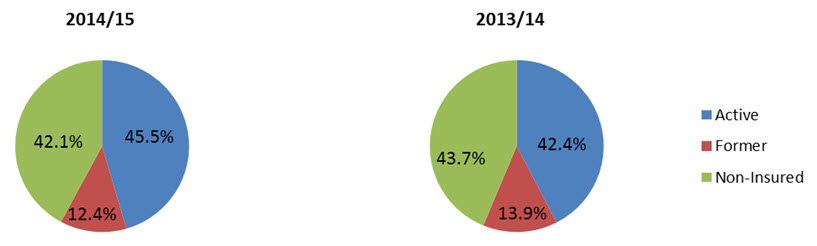
Show Data Table
| # | % | |
|---|---|---|
| Active Clients | 34,937 | 45.5% |
| Former Clients | 9,502 | 12.4% |
| Non-Insured | 32,365 | 42.1% |
| Total | 76,804 | 100.0% |
| # | % | |
|---|---|---|
| Active Clients | 34,612 | 42.4% |
| Former Clients | 11,336 | 13.9% |
| Non-Insured | 35,680 | 43.7% |
| Total | 181,628 | 100.0% |
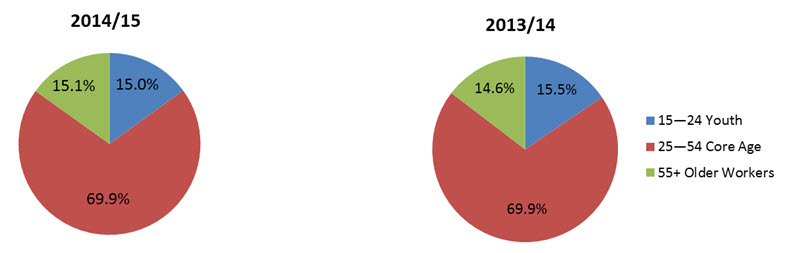
Show Data Table
| # | % | |
|---|---|---|
| 15–24 Youth | 9,666 | 15.0% |
| 25–54 Core Age | 45,010 | 69.9% |
| 55+ Older Workers | 9,738 | 15.1% |
| Unknown | 9 | 0.0% |
| Total | 197,536 | 100.0% |
| # | % | |
|---|---|---|
| 15–24 Youth | 10,935 | 15.5% |
| 25–54 Core Age | 49,179 | 69.8% |
| 55+ Older Workers | 10,295 | 14.6% |
| Unknown | 4 | 0.0% |
| Total | 191,366 | 100.0% |
British Columbia delivered a smaller number (209,646) of EBSM-similar interventions in 2014/2015, a year-over-year significant decrease of 6.8% Despite this decline, a greater number of Employment Benefits (19,505) were served, compared to (18,993) in the previous year. A noticeable decline in Support Measures (-7.6%), resulted in a total of 190,141. However, with 90.7%, its share of all interventions delivered in the province, Support Measures continued to be the most used intervention in the province.
A total of 19,818 active and former claimants returned to work after participation in an EBSM-similar intervention in 2014/2015, representing a 1.1% year over year decline. In 2014/2015, the total expenditures for British Columbia's EBSM-similar programming totaled $276.4 million of $280.5 million allocated.
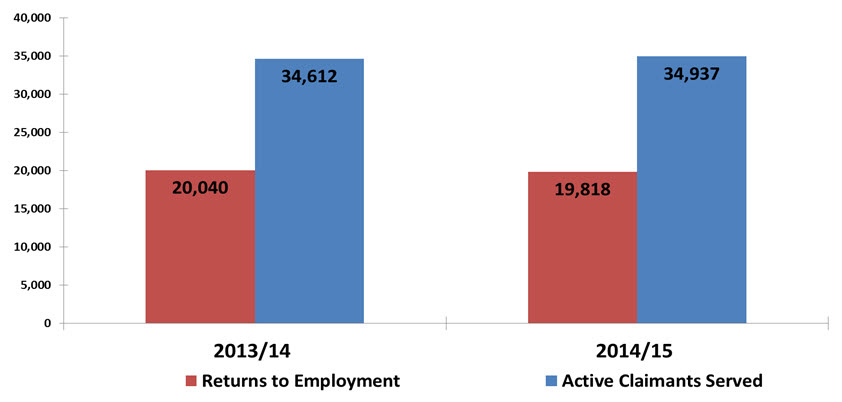
Show Data Table
| 2013/2014 | 2014/2015 | |
|---|---|---|
| Returns to Employment | 20,040 | 19,818 |
| Active Claimants Served | 34,612 | 34,937 |
2.11.1 Employment Benefits
A total number of 19,505 Employment Benefit interventions were delivered in 2014/2015 (+2.7%). All the benefit types expanded, with the exception of Self Employment, which fell significantly (-5.7%) to 1,946; reflecting that unemployed participants are more likely to opt for employment over starting a business in a context of a robust economy. JCP (+16.9%) and TWS (+11.7%) expanded at the fastest pace, reaching 498 and 1,295, respectively. SD-A (+3.3%) and SD-R (+0.7%) both experienced growth, though at a slower pace, reaching a total of 12,399 and 3,367, respectively. Consistent with the growth in the numbers of Employment benefit interventions, their respective total expenditures also increased, reaching $163.7 million in 2014/2015 compared to $158.5 million in the previous year (+3.3%).
2.11.2 Employment Assistance Services
Following a notable increase in the total number (205,855) of EAS interventions delivered in 2013/14, the province served a smaller number of 190,141 interventions (-7.6%) in 2014/2015. Despite the decline in the total EAS numbers, Group Services (602) experienced a phenomenal growth, increasing sharply from the 88 total of 2013/14. The other two EAS types declined, with Individual Counselling (57,829) and Employment Services (13,710) both decreasing significantly by 9.3% and 7.3%, respectively, year over year.
2.11.3 Other Support Measures: LMPs and R&I
Following a continued increase in terms of investments in LMP and R&I over the last several years, with total investment reaching a peak of $21.9 million in 2013/14 (+47.8%), funding for these two initiatives dropped significantly (-9.7%) in 2014/2015, down to $19.8 million. Investment in R&I continued to increase (+6.5%) reaching $12.9 million, which can be attributed to British Columbia using R&I funds ($3.3 million) to support the Canada-British Columbia Job Grant initiatives. LMP expenditures dropped sharply (-29.7%) down to $6.9 million, compared to $9.8 million in the previous year.
2.11.4 Managing for Results
In 2014/2015, British Columbia planned the implementation of the Targeting, Referral and Feedback (TRF) initiative to support EI clients with active employment programming earlier in their EI claim (launched in fall 2015). This tool is anticipated to improve early client interventions; better job matching for the unemployed or those who need earlier assistance to enable quicker returns to work; and an overall increase in EI clients served by the province's Employment Program of British Columbia (EPBC). Additionally, British Columbia launched a formal evaluation of its EPBC in 2014/2015 to gain practical insights into the success and impacts of the program and the relevance and effectiveness of its design and delivery.
2.12 Northwest Territories
After advancing significantly by 5.8% in 2014, the territory's real GDP is poised to have shrunk by 2% in 2015. The territory's diamond production, which represents almost 18% of the entire GDP, is declining, contributing to the economy's contraction. The oil and gas sector also saw a slowdown, due in part to low prices. The weak commodity prices and uncertain mining conditions are translating to weakness in the construction industry as well.
Northwest Territories: EBSM Key Facts
| EI Clients | Non-Insured Clients |
|---|---|
| 432
|
500
|
| Interventions Type | 2014/2015 | Year-over-Year Change |
|---|---|---|
| Employment Benefits | 280 | 13.0%
|
| Support Measures: EAS | 864 | 11.2%
|
| Interventions Type | 2014/2015 | Year-over-Year Change (pp) |
|---|---|---|
| Employment Benefits | 24.5% | 0.4
|
| Support Measures: EAS | 75.5% | 0.4
|
| Total Expenditures | 2014/2015 ($ Million) |
Year-over-Year Change |
|---|---|---|
| Employment Benefits | $1.5 | 11.5%
|
| Support Measures: EAS | $1.3 | 19.2%
|
| LMPs and R&I | $0.2 | 55.5%
|
| Total Expenditures1 | $2.9 | 5.6%
|
| 2013/2014 | 2014/2015 | Year-over-Year Change |
|---|---|---|
| $2.33 | $2.35 | 0.9%
|
- 1 Totals may not add due to rounding; does not include accounting adjustments.
The recent evolutions in these economic aggregates are spilling over into the labour market. The labour force decreased to a total of 24,000 (-1,000 or -4.1%), while employment was down by 1,000 (-4.2%), finishing the year at 22,100. The unemployment rate increased by 0.2 percentage points year over year, reaching 8.1%. After a strong performance in recent years, the participation rate dropped by 2.7 percentage points (74.2%). In 2014/2015, the Northwest Territories registered an average of 400 job vacancies. This represents a drop of 100 vacancies noted in the previous fiscal year.
In 2014/2015, skills shortages, barriers to workforce mobility and the relative stability in employment, related to a shift away from the provision of services towards the production of goods, continued to be the main labour market challenges in the Northwest Territories. The territory focused on a number of priorities to improve its labour market conditions. These included supporting local labour market partnerships and collaboration with stakeholders on enhancing skill development and training programs for work-readiness skills, and fostering opportunities for gaining work experience. Building workforce capacity through LMDA programs and services and by working closely with Indigenous governments also continues to be a priority.
| Employment Benefits | Interventions | Year-over-Year Change | Expenditures ($ 000s) | |
|---|---|---|---|---|
| TWS | Apprenticeship Training on the Job Youth Employment | 67 | -13.0% | 140 |
| SE | Self-Employment Option | 14 | -36.4% | 145 |
| SD-R | Building Essential Skills | 44 | +4.8% | 1,164 |
| SD-A | Building Essential Skills-Apprenticeship | 155 | -14.4% | |
| Support Measures | ||||
| EAS | Employment Assistance Services Career Development Service | 864 | -11.2% | 1,281 |
| LMPs | Labour Market Partnerships | N/A | N/A | 133 |
| R&I | Research and Innovation | N/A | N/A | 18 |
The Northwest Territories served a declining number of clients (932) in 2014/2015, representing a significant year-over-year drop of 9.5%, attributable to changes to EI Part I eligibility in the territory. The three client types all decreased, with active claimants (294) experiencing the largest decline of 15.3%, followed by former claimants (138), which dropped by 8.6%, and non-insured clients down by 6.0% to a small total number (500). With respect to the shares of these clients, the non-insured clients accounted for a growing share at 53.6% (+1.9 percentage points). Similarly, the proportion of former claimants of all clients served also edged up, reaching 14.8% (+0.1 percentage points). Consistent with its numbers, the share of active claimants slid (-2.2 percentage points) to 31.5%, compared to 33.7% in 2013/14.
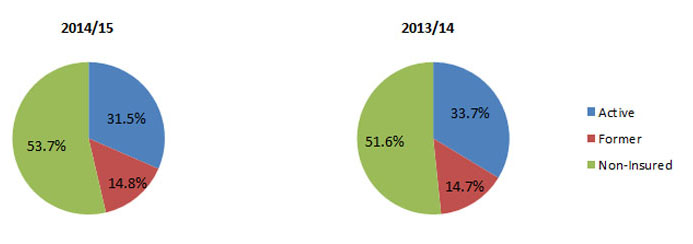
Show Data Table
| # | % | |
|---|---|---|
| Active Clients | 294 | 31.5% |
| Former Clients | 138 | 14.8% |
| Non-Insured | 500 | 53.6% |
| Total | 932 | 100.0% |
| # | % | |
|---|---|---|
| Active Clients | 347 | 33.7% |
| Former Clients | 151 | 14.7% |
| Non-Insured | 532 | 51.7% |
| Total | 1,030 | 100.0% |
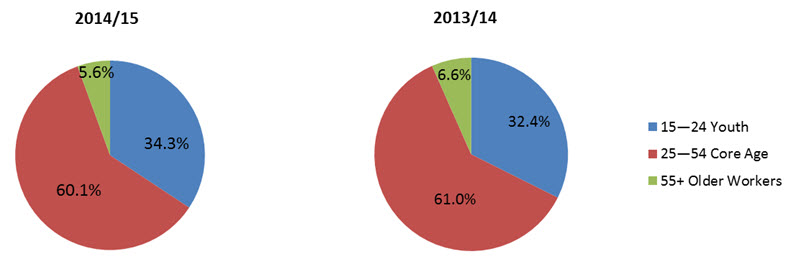
Show Data Table
| # | % | |
|---|---|---|
| 15–24 Youth | 283 | 34.2% |
| 25–54 Core Age | 496 | 60.0% |
| 55+ Older Workers | 46 | 5.6% |
| Unknown | 2 | 0.0% |
| Total | 827 | 100.0% |
| # | % | |
|---|---|---|
| 15–24 Youth | 274 | 32.3% |
| 25–54 Core Age | 516 | 60.9% |
| 55+ Older Workers | 56 | 6.6% |
| Unknown | 1 | 0.0% |
| Total | 847 | 100.0% |
The Northwest Territories delivered 1,144 EBSM-similar interventions in 2014/2015, a significant decrease of 11.7% year over year. The share of Employment Benefits accounted for 24.5% of this total, lower than last year's 24.9%. Accordingly, the proportion of EAS interventions increased slightly, reaching 75.5%, compared to 75.1% in 2014/2015. A total of 193 EI clients returned to employment following participation in EBSM-similar programming, representing a decline of 3.5% year over year. EBSM expenditures totalled $2.9 million of the $3.1 million allocated.
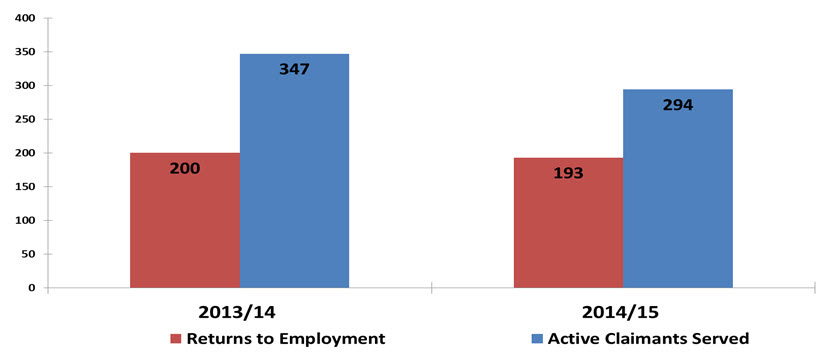
Show Data Table
| 2013/2014 | 2014/2015 | |
|---|---|---|
| Returns to Employment | 200 | 193 |
| Active Claimants Served | 347 | 294 |
2.12.1 Employment Benefits
The number of Employment Benefits interventions delivered in the territory declined, for a fifth consecutive year, to 280 in 2014/2015 (-13%). Decreases were observed across most benefit types, with a substantial drop in SE (-36.4%); SD-A (-14.4%); and TWS (-13.0%). The decline can be attributed to the lower numbers of active and former claimants who participated in the program, and also the territory's strong economic performance in 2014. However, SD-R saw an increase of 4.8%, in line with the territory's focus on building human capital through skills development. Employment Benefits total expenditures fell to $1.4 million (-11.5%) in 2014/2015.
2.12.2 Support Measures: EAS
The Northwest Territories delivered fewer (864) Individual Counselling interventions in 2014/2015, representing a significant drop of 11.2% year over year. The total expenditures of EAS increased, reaching $1.3 million in 2014/2015, compared with $1.1 million in the previous year.
2.12.3 Other Support Measures: LMPs
Expenditures for LMPs fell significantly in 2014/2015, to $133,000, representing a drop of 60.8% year over year. In addition, the Northwest Territories used R&I ($27,318) as a funding source to support the newly launched Canada-Northwest Territories Job Grant initiatives.
2.12.4 Managing for Results
To support EI clients with active employment programming earlier in their EI claim, Northwest Territories is reviewing the Information Sharing Agreement (ISA) for the LMDA, putting procedures in place to utilize the Targeting, Referral and Feedback (TRF) component to engage with EI claimants. This will ensure that these clients are fully informed regarding any and all employment opportunities that may exist in their field.
To strengthen the capture and the use of data, Northwest Territories government implemented a new approach for all unemployed clients (EI- and non-eligible clients alike) accessing services. A Skills Inventory database is being created to allow potential employers to contact clients, if there are jobs available that match their skill set. This initiative will be a valuable resource for all employers seeking to employ local labour.
2.13 Yukon
In 2014, Yukon's real GDP shrank by 0.7% and is poised to have dropped by another 3.4% in 2015. Mining exploration spending bottomed out in 2013, and no new mines are planned in the near future. Existing mines are facing difficulties due to low commodity prices. The weakness of the mining industry is having a spillover effect on the construction industry, with limited development projects. On a positive note, Yukon's tourism sector is posting record numbers of visitors, stemming from the weakened Canadian dollar and Yukon becoming an increasingly popular destination for domestic travellers. Public investments into health facilities, schools, and other infrastructure projects are at a record high in terms of capital budgets, correcting for some of the downturn in the territory's mining industry.
Yukon: EBSM Key Facts
| EI Clients | Non-Insured Clients |
|---|---|
| 304
|
131
|
| Interventions Type | 2014/2015 | Year-over-Year Change |
|---|---|---|
| Employment Benefits | 227 | 6.6%
|
| Support Measures: EAS | 293 | 10.9%
|
| Interventions Type | 2014/2015 | Year-over-Year Change (pp) |
|---|---|---|
| Employment Benefits | 43.7% | 1.2
|
| Support Measures: EAS | 56.3% | 1.2
|
| Total Expenditures | 2014/2015 ($ Million) |
Year-over-Year Change |
|---|---|---|
| Employment Benefits | $1.9 | 4.6%
|
| Support Measures: EAS | $1.3 | 3.3%
|
| LMPs and R&I | $0 | |
| Total Expenditures1 | $3.3 | 1.7%
|
| 2013/14 | 2014/2015 | Year-over-Year Change |
|---|---|---|
| $2.40 | $1.85 | 22.8%
|
- 1 Totals may not add due to rounding; does not include accounting adjustments.
Despite the weakened economy, Yukon's labour market posted moderate improvements in 2014/2015. The labour force grew (+0.8%) and employment increased (+2.0%) to an annual total of 19,800, while unemployment dropped substantially (-18.2%). As a result, the unemployment rate stood at 4.4%, a full percentage point lower than in the previous year, while the participation rate increased by 0.1 percentage points to 74.4%. In 2014/2015, Yukon's number of job vacancies stood at 400, an increase of 25% year over year.
In 2014/2015, Yukon identified a number of priorities for improving its labour market. These included increasing participation of its underrepresented and vulnerable groups; enhancing the quality of training and skills development, particularly in the growing sectors of the economy; attracting skilled workers; facilitating workforce mobility; and improving labour market information. The territory also continued to engage employers and support ongoing community-driven initiatives, to stimulate economic growth.
| Employment Benefits | Interventions | Year-over-Year Change | Expenditures ($ 000s) | |
|---|---|---|---|---|
| TWS | Targeted Wage Subsidies | 3 | +50.0% | 8 |
| SE | Self-Employment | 2 | -66.7% | 58 |
| SD-R | Skills Development Employment Benefit | 45 | +12.5% | 1,871 |
| SD-A | Skills Development Employment Benefit - Apprenticeship | 177 | -9.2% | |
| Support Measures | ||||
| EAS | Employment Assistance Services | 293 | -10.9% | 1,314 |
| LMPs | Labour Market Partnerships Employer-Sponsored Training | N/A | N/A | N/A |
Yukon served a growing number of clients (435), a significant year-over-year increase of 5.6%. In contrast, EBSM-similar programming interventions (520) declined by a notable 9.1%. Active claimants (259) decreased slightly by 4.4% while former claimants (45) remained unchanged and non-insured clients (131) increased considerably, by 36.5% compared to 2013/14. The share of non-insured (30.1%) clients increased by 6.8 percentage points while the shares of active claimants (59.5%) and former claimants (10.3%) both dropped by 6.3 and 0.6 percentage points, respectively.
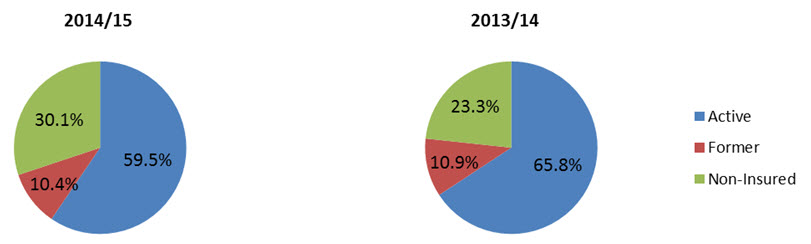
Show Data Table
| # | % | |
|---|---|---|
| Active Clients | 259 | 59.5% |
| Former Clients | 45 | 10.3% |
| Non-Insured | 131 | 30.1% |
| Total | 435 | 100.0% |
| # | % | |
|---|---|---|
| Active Clients | 271 | 65.8% |
| Former Clients | 45 | 10.9% |
| Non-Insured | 96 | 23.3% |
| Total | 412 | 100.0% |
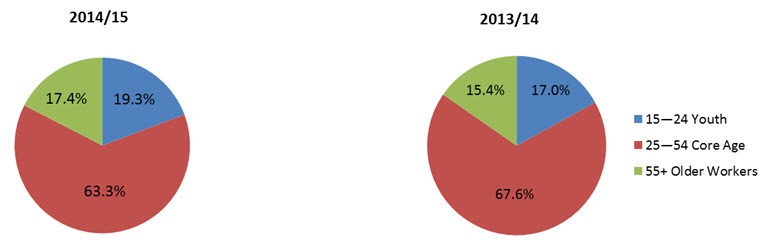
Show Data Table
| # | % | |
|---|---|---|
| 15–24 Youth | 53 | 19.3% |
| 25–54 Core Age | 174 | 63.3% |
| 55+ Older Workers | 48 | 17.5% |
| Unknown | 0 | 0.0% |
| Total | 275 | 100.0% |
| # | % | |
|---|---|---|
| 15–24 Youth | 41 | 17.0% |
| 25–54 Core Age | 163 | 67.6% |
| 55+ Older Workers | 37 | 15.4% |
| Unknown | 0 | 0.0% |
| Total | 241 | 100.0% |
Yukon delivered a total of 520 EBSM-similar intervention in 2014/2015, a significantly year-over-year decline of 9.1%. This total also represented the lowest over the last nine years. Employment Benefits accounted for a slightly growing share of 43.7% of the total interventions delivered in Yukon compared to last year's 42.5% despite the decline in its numbers, which dropped significantly to 227 (-6.6%). In contrast, the numbers (293) and share (56.3%) of EAS of all interventions delivered in the territory both dropped, with the first declining notably (-10.9%) and the latter, by a modest 1.2 percentage points. A total of 170 EI clients returned to employment following participation in EBSM-similar programming, a considerable year-over-year decrease of 26.1%. Consistent with the decline in the total interventions served in Yukon. At $3.3 million, Yukon's total expenditures for its EBSM-similar programming represented 100% of the allocated funding.
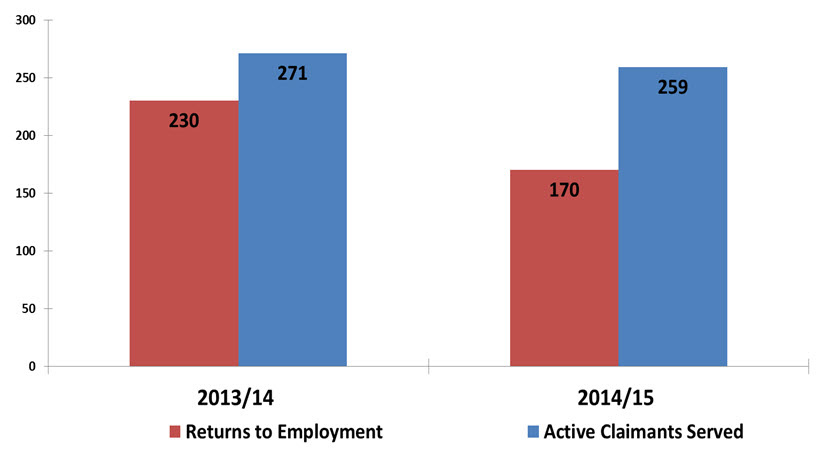
Show Data Table
| 2013/2014 | 2014/2015 | |
|---|---|---|
| Returns to Employment | 230 | 170 |
| Active Claimants Served | 271 | 259 |
2.13.1 Employment Benefits
In 2014/2015, Yukon delivered a total of 227 Employment Benefits interventions (-6.6%). SD-A, the most used employment benefit, dropped by 9.2%, totalling 177 interventions. Its share of all benefits slid from 80.2% to 78%. SD-R edged up by 12.5% to a total of 45 interventions, as its share of all benefits increased to 19.8%. SE contracted by 67% year over year. Employment Benefits expenditures totalled $1.9 million (-4.6%).
2.13.2 Support Measures: EAS
Consistent with Yukon's labour market performance, the territory delivered fewer Employment Services interventions (293) in 2014/2015, a substantial decrease of 10.9% year over year. For a second consecutive year, no Individual Counselling interventions were delivered in the territory, reflecting a pattern of decreased usage over recent years. Total EAS expenditures were $1.3 million (+3.3%).
2.13.3 Other Support Measures: LMPs
In 2014/2015, Yukon did not report any expenditure on LMPs, a measure that has seen a steady decline since 2012/13. In the previous year, only $5,000 was spent on LMPs.
2.13.4 Managing for Results
In Yukon, the capture and use of data to improve program results is through the new Labour Market Information (LMI) Portal. This website gathers Yukon specific LMI from a variety of sources such as Statistics Canada, Yukon Bureau of Statistics, Canada Job Bank, Yukon WorkFutures, Yukon Occupational Modeling System and others. In doing so, the Portal provides relevant labour market data, supporting LMDA evidence-based investments and improving program results.
2.14 Nunavut
After expanding at a rate of 3.3% in 2014, Nunavut's real GDP is forecasted to have grown at a faster pace of 3.8% in 2015, which is still solid. In recent years, the territory's construction industry has been recording strong growth rates, which are expected to continue beyond 2015. The public sector is making significant contributions to the construction industry, with federal government investments in arctic research stations, the City of Iqaluit's plan to build a new aquatic centre, as well as public-private partnerships between the private sector, the federal government and the territorial government in upgrades to the Iqaluit airport. The fishing industry, while a small part of the economy, is rapidly expanding, with Government of Nunavut partnering with the federal government in three fisheries and science projects. Mining output continues to grow, further contributing to Nunavut's strong economic expansion.
Nunavut: EBSM Key Facts
| EI Clients | Non-Insured Clients |
|---|---|
| 236
|
460
|
| Interventions Type | 2014/2015 | Year-over-Year Change |
|---|---|---|
| Employment Benefits | 256 | 52.4%
|
| Support Measures: EAS | 678 | 78.9%
|
| Interventions Type | 2014/2015 | Year-over-Year Change (pp) |
|---|---|---|
| Employment Benefits | 27.4% | 3.3
|
| Support Measures: EAS | 72.6% | 3.3
|
| Total Expenditures | 2014/2015 ($ Million) |
Year-over-Year Change |
|---|---|---|
| Employment Benefits | $1.3 | 2.0%
|
| Support Measures: EAS | $1.0 | |
| LMPs and R&I | $0 | |
| Total Expenditures1 | $2.4 | 74.3%
|
| 2013/14 | 2014/2015 | Year-over-Year Change |
|---|---|---|
| $0.38 | $0.52 | 38.3%
|
- 1 Totals may not add due to rounding; does not include accounting adjustments.
In 2014/2015, Nunavut's labour market posted mixed results. The labour force shrunk by 4% (14,300) and employment by 3.1%. Unemployment declined from 2,100 to 1,900 (-9.5%). The participation rate dropped considerably year over year, sliding from 65.8% to 61.3%. In this context of a shrinking labour market, the unemployment rate (13.3%) actually declined, a decrease of 0.9 percentage points compared to 2013/14. The territory recorded an average of 100 job vacancies in 2014/2015, relative to the 150 noted in the previous year. This represents a decline of 33% year over year.
A number of labour market challenges continued to surface in Nunavut in 2014/2015. These included: seasonal employment; a high unemployment rate despite skills shortages; issues related to literacy and educational attainment; and capacity pressures related to delivering active employment programming. To address these challenges, the territory supported its workforce through skills development and literacy upgrading, in addition to providing career development through educational training and employability services to new and young workers. A focus on improving its service delivery capacity continues to be a key priority. In 2014/2015, the territory focused on a number of actions to advance identified priorities, including:
- preparing the labour force to meet the needs of a growing economy;
- managing the ongoing transition from a traditional to an industrial economy;
- increasing the participation of underrepresented groups; and
- connecting Nunavummiut job seekers with available jobs through increased employer participation and labour market information.
| Employment Benefits | Interventions | Year-over-Year Change | Expenditures ($ 000s) | |
|---|---|---|---|---|
| TWS | Training on the Job | 7 | -83.7% | 406 |
| SE | Nunavut Entrepreneurship Incentive | 2 | -33.3% | 33 |
| SD-R | Adult Learning and Training Supports | 208 | +114.4% | 886 |
| SD-A | Adult Learning and Training Supports - Apprenticeship | 39 | +56.0% | |
| Support Measures | ||||
| EAS | Employment Assistance Services | 678 | +78.9% | 1,033 |
| LMPs | Target Training Initiatives | N/A | N/A | N/A |
| R&I | Research and Innovation | N/A | N/A | N/A |
After a notable decline in the previous year, the total number of clients served in Nunavut for 2014/2015 increased significantly, to a total of 696 (+74.4%). The non-insured clients and the active claimants both expanded considerably, with the total number of the non-insured (460) more than doubling (+166%) from last year's 173. As for the active claimants (110), their numbers also grew significantly, though at a slower pace (+12.2%). Conversely, the former claimants' total number (126) edged down moderately (-1.6%). The expansion in the numbers of the non-insured clients resulted in its share making up 66.1% of the total share of all clients served, an increase of 22.7 percentage points. On the other hand, the share of active claimants (15.8%) actually dropped, despite a significant increase in its numbers. Consistent with the shift in its total numbers, the share of former claimants declined from last year's 32.1% to 18.1% in 2014/2015.
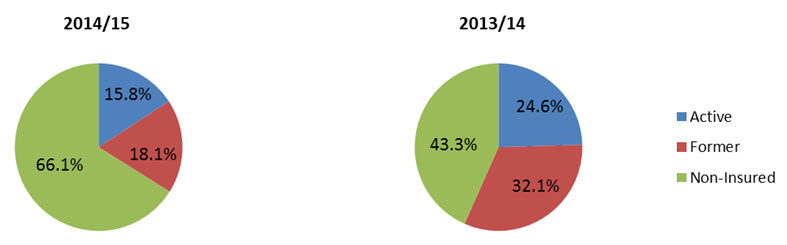
Show Data Table
| # | % | |
|---|---|---|
| Active Clients | 110 | 15.8% |
| Former Clients | 126 | 18.1% |
| Non-Insured | 460 | 66.1% |
| Total | 696 | 100.0% |
| # | % | |
|---|---|---|
| Active Clients | 98 | 24.6% |
| Former Clients | 128 | 32.1% |
| Non-Insured | 173 | 43.4% |
| Total | 399 | 100.0% |
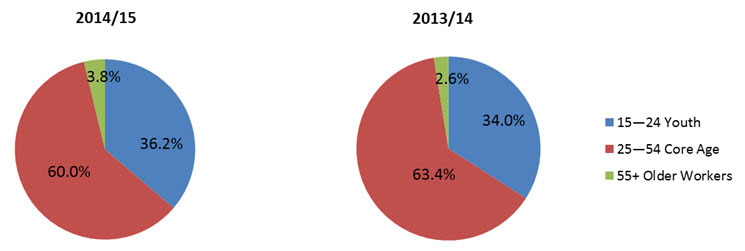
Show Data Table
| # | % | |
|---|---|---|
| 15–24 Youth | 241 | 36.1% |
| 25–54 Core Age | 399 | 59.8% |
| 55+ Older Workers | 25 | 3.7% |
| Unknown | 2 | -.3% |
| Total | 667 | 100.0% |
| # | % | |
|---|---|---|
| 15–24 Youth | 12- | 34.0% |
| 25–54 Core Age | 223 | 63.2% |
| 55+ Older Workers | 9 | 2.5% |
| Unknown | 1 | 0.3% |
| Total | 353 | 100.0% |
Nunavut served its clients with an increasing number of EBSM-similar programming. Clients participated in 934 interventions, a significant year-over-year growth of 70.7%. For a fourth consecutive year, Employment Benefits represented a declining share (27.4%) of total interventions, a decrease of 3.3 percentage points year-over-year. A total of 47 EI clients returned to employment after participating in the program (-6.0%). Expenditures for EBSM-similar programming totalled $2.4 million of the $2.8 million allocated funding.
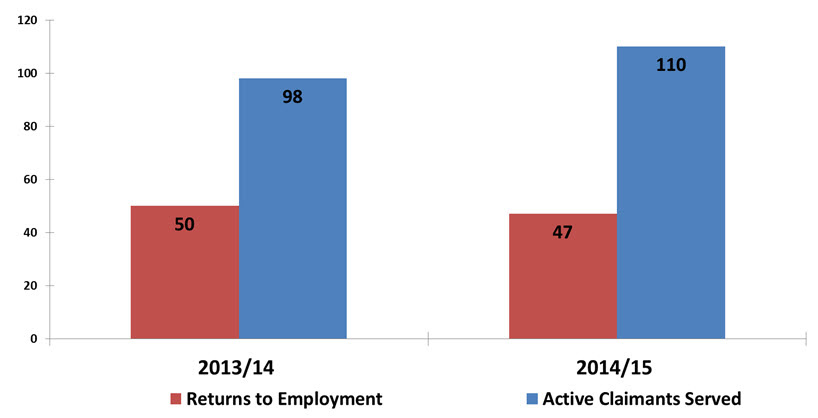
Show Data Table
| 2013/2014 | 2014/2015 | |
|---|---|---|
| Returns to Employment | 50 | 98 |
| Active Claimants Served | 47 | 110 |
14.1 Employment Benefits
Nunavut delivered a total of 256 Employment Benefit interventions, a significant jump of 52.4% year over year. SD-R contributed to this increase by a staggering 114.4%. SD-A increased as well, by a rate of 56%. TWS fell significantly by 83.7%, down from last year's 43 to only 7 in 2014/2015. Given the large increase in SD-R, its share of Employment Benefits grew significantly, from 57.7% to 81.3%. TWS lost a large chunk of its share, going from 25.6% to 2.7%. Employment Benefits total expenditures remained stable at $1.33 million in 2014/2015, compared to $1.35 million the previous fiscal year.
14.2 Support Measures: EAS
For a fourth consecutive year, EAS interventions increased significantly. The territory delivered a total of 678 Employment Services interventions, a remarkable year-over-year increase of (+78.9%)—signalling a greater demand for this intervention type as the gateway to all programs. EAS total expenditures reached $1.0 million in 2014/2015.
14.3 Other Support Measures: LMPs and R&I
As has been the case in the previous year, Nunavut made no new investments in LMPs and R&I.
14.4 Managing for Results
Nunavut is closely monitoring its results to better understand how best to engage with EI claimants to promote early interventions. Through increased community and employer engagement, the territory continues to inform potential clients about the programs and services available to them. New promotional material has been developed for this purpose, and distributed.
Increased capacity for the collection and collation of labour market information continues to better inform the unemployed about current and future labour market demands, and opportunities for (re) training.
3. National evaluation of Employment Benefits and Support Measures (EBSM): incremental impacts for the "long-tenured workers" EI claimant category and cost-benefit analysis of EBSMs
This section presents results from recent studies conducted as part of the second cycle of LMDA evaluations. The first part of the section presents incremental impacts from EBSM participation for unemployed individuals that qualified under the "Long-Tenured Workers" EI claimant category. The second part discusses the results of a cost-benefit analysis of EBSMs for all active and former claimants.
3.1 Incremental Impacts for the "Long-Tenured Workers" EI Claimant Category
The incremental impact analysis represents the foundation of LMDA evaluations. The 2012/13 EI Monitoring and Assessment Report presented incremental impacts over five years post-program for all active and former EI claimants who started their EBSM participation between 2002 and 2005 Footnote 23 . This study measured impacts over five consecutive years that occurred between 2002 and 2011. The 2013/14 EI Monitoring and Assessment Report reported incremental impacts over three years post-program for all active and former claimants who started participation in 2007-2008 Footnote 24 . This analysis assessed impacts over three consecutive years that occurred between 2002 and 2012. This year's edition discusses incremental impacts for active and former claimants who met the criteria defined under the "long-tenured workers" EI claimant category.
The "long-tenured worker" EI claimant category was introduced with the 2013 modifications to the EI Regulations under the Connecting Canadians with Available Jobs initiative. Individuals who correspond to this new category are EI regular or fishing benefit claimants who had paid at least 30% of the annual maximum employee's EI premiums in seven of the ten years preceding their EI claim and who had collected 35 or fewer weeks of EI regular or fishing benefits in the five years preceding their claim.
3.1.1 Methodological Approach
The role of the incremental impact analysis is to isolate the effects of EBSM participation on participant's key labour market indicators (e.g., earnings, employment and EI use) from other factors such as inflation, economic cycles, etc. As shown in Diagram 1 below, this is achieved by comparing key labour market indicators (e.g., earnings) for participants before and after their participation, with those for non-participants before and after the same period.
The study reported in this year's edition of the EI Monitoring and Assessment Report examined incremental impacts for active and former claimants who met the criteria of the EI claimant category "long-tenured workers". These individuals are referred to as active and former claimants who were "long-tenured workers" in the remaining parts of this section. The study focused on individuals who started their EBSM participation across all 13 provinces and territories between January 1, 2007 and December 31, 2009 and measured impacts over three years after participation (i.e., three consecutive years between 2007 and 2013).
A different comparison group was used for active and former claimants. The comparison group for active claimants was composed of active claimants who were "long-tenured workers" but did not participate in EBSMs. It was not possible to create a comparison group of non-participants for former claimants using administrative data, because available data do not identify whether former claimants who did not participate in EBSMs were motivated to find employment. Therefore, for former claimants, the impacts of Skills Development (SD), Targeted Wage Subsidies (TWS), Self-Employment (SE) and Job Creation Partnerships (JCP) were measured relative to former claimants who were "long-tenured workers" and who received only Employment Assistance Services (EAS-only). As two different comparison groups were used, the results for active claimants are not directly comparable to those for former claimants.
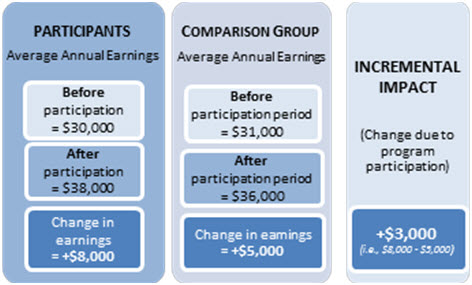
Text description of Example of Incremental Impact Calculation
Participants
Average Annual Earnings
-
Before participation
= $30,000 -
After participation
= $38,000 - Change in earnings
= +$8,000
Comparison Group
Average Annual Earnings
-
Before participation period
= $31,000 -
After participation period
= $36,000 - Change in earnings
= +$5,000
Incremental Impact
- (Change due to program participation)
- +$3,000
(i.e., $8,000 - $5,000)
Since participants usually receive a continuum of services (e.g., EAS plus SD), results were measured for all EBSMs received by a participant as long as there was no more than a 6 month gap between each EBSM. The results were attributed to the longest EBSM each person received (e.g., SD). This means that the impacts of providing EAS along with SD, TWS, SE or JCP were accounted for in the calculations; however, it was not possible to identify what proportion of those impacts is attributable to EAS. Results for EAS were measured for active claimants who only received EAS without receiving another EBSM (referred to as EAS-only)
The analysis relied solely on administrative data from the EI part I and II databank and taxation files from the Canada Revenue Agency. The following sections reports incremental impacts of EBSMs for the following indicators:
- Average earnings from employment and/or self-employment: An increase in earnings indicates that participants improved their employment situation by either working more hours and/or by having a better paying job than they did before participation and relative to the experience of the comparison group.
- Incidence of employment (i.e., incidence of having earnings from employment and/or self-employment): Measures whether participants were more likely to be employed after participation and relative to the comparison group.
- Amount of EI benefits received: Measures the changes in the average amount of EI benefits collected from before to after participation and relative to the comparison group.
- Average number of weeks in receipt of EI: Measures the change in the average number of weeks during which participants were in receipt of EI relative to the comparison group.
3.1.2 Caveats about the Study
The criteria used to define the EI claimant category "long-tenured workers" do not consider the number of years the worker remained employed with the same employer. Therefore, the results of this analysis do not pertain to long-tenured workers as commonly defined in the literature. Instead, the results pertain to a larger category of workers who had regular employment or long-term attachment to the workforce but not necessarily with the same employer.
The process for matching participants and the comparison group aimed to ensure that participants and the comparison group were similar in terms of age, sex, location, skills level required by the last major occupation held prior to participation, reason for separation from employment, industry in which they were previously employed as well as employment earnings and use of EI and Social Assistance before participation. As well, the comparison group is composed of individuals who met the criteria set out in the EI claimant category "long-tenured workers".
Overall, the matching process used all relevant data available to capture factors that could affect the decision to participate in EBSMs or the outcomes from EBSM participation. However, it is possible that some other factors were not reflected in the data available. For example, workers who were employed in the same workplace for a long period accumulated job-specific human capital and may suffer from large wage loss following their re-employment if this new employment does not require their skills.
This factor is not accounted for in the matching process. As a result, it is not possible to know whether participants and the comparison groups were similar in terms of level of job-specific human capital accumulation and in their likelihood of being re-employed in a job that would require their skills. This may not be a major consideration since the study is not focusing strictly on individuals who had a long tenure with the same employer. However, when interpreting the results, readers should be aware that incremental impacts may be affected by factors not captured by the matching process.
3.1.3 Incremental Impacts for Active Claimants
The following description focuses on discussing impacts that are statistically significant at a 95% confidence level or above. Table 15 below provides details on incremental impacts measured in each of the three post-program years as well as the annual average impacts and the total impacts over the total post-program period. The description in section 1.3 and 1.4 focuses on discussing the average annual impact over the post-program period (i.e., average of the impacts measured over the first, second and third year after participation).
Overall, incremental impacts presented in Table 15 show that participating in SD, JCP and EAS-only helped active claimants who were "longtenured workers" reduce their use of EI after participation. Participating in SD, TWS and JCP also helped them improve their incidence of employment. However, those gains in employment and reductions in EI use were often accompanied by reductions in earnings.
Skills Development (SD): Active claimants improved their incidence of employment and reduced their use of EI in all three years after participation. Their incidence of employment increased, on average, by 3.6 percentage points per year relative to the comparison group. Their use of EI benefits decreased, on average, by $206 per year. Although they increased their employment and reduced their use of EI, these individuals earned $2,854 less from employment in the first year after participation. Their earnings started to increase in the second ($254) and third years ($1,548) after participation. As shown in Table 15, those increases could not compensate for the decrease in the first year after participation.
Targeted Wage Subsidies (TWS): Active claimants were more likely to be employed after participating in TWS. On average, their incidence of employment increased by 2.3 percentage points per year. The employment gains, however, were accompanied by decreases in earnings averaging $960 per year. Results suggest that TWS did not have much of an impact on EI use as EI usage increased by 0.2 weeks per year on average after their TWS participation. Impacts on EI benefits were not statistically significant.
Self-Employment (SE): Following their SE participation, active claimants decreased their earnings by an average of $14,338 per year. They also decreased their incidence of employment by an average of 21.7 percentage points per year. These results should be interpreted with caution, as they may not be fully reflective of the financial situation of participants. Footnote 25 Active claimants also decreased their use of EI following participation in SE. Such results should be interpreted with caution, as self-employed individuals are not entitled to EI regular benefits. Therefore, the decreases in EI use could be partly due to EI eligibility effects.
Job Creation Partnership (JCP): Participating in JCP improved the incidence of employment of active claimants. These individuals increased their incidence of employment by 5.6 percentage points annually, on average. Their use of EI benefits also decreased after participation by an average of $244 per year. While those results show that active claimants were more likely to be employed and had lower use of EI after participation, no clear conclusion can be drawn about their earnings, as most results were not statistically significant.
Employment Assistance Services (EAS)-only: Active claimants reduced their use of EI benefits after their EAS-only participation by an average of $214 per year. However, they were less likely to be employed as their incidence of employment decreased by an average of 1.1 percentage points per year. They also earned less from employment as their earnings decreased by an average of $1,588 per year. Overall, along with SE, EAS-only had the least favorable result of all EBSMs examined for active claimants.
3.1.4 Incremental Impacts for Former Claimants
The results for former claimants who were "long-tenured workers" are presented in Table 15. With the exception of those who took part in SE, former claimants increased their use of EI after participation. For those who participated in SD and TWS, the increases in EI use were accompanied by gains in earnings and incidence of employment. The results were less favourable for former claimants who participated in JCP since they reduced their employment earnings after participation.
Skills Development (SD): Former claimants who were "long-tenured workers" experienced a decrease in employment earnings in the first year after participation (-$914) and increases in the second ($674) and third years ($1,155). However, they improved their incidence of employment in all years after participation by an average of 3.9 percentage points per year. Their use of EI benefits decreased only in the first year after participation (-$166) but increased in the second ($203) and third years ($276).
Targeted Wage Subsidies (TWS): Participation in TWS resulted in increasing both the earnings and incidence of employment of former claimants. The gains averaged $3,203 and 5.7 percentage points per year, respectively. Those gains were accompanied by increases in EI use averaging $272 per year.
Self-Employment (SE): As observed among active claimants, former claimants decreased their earnings, incidence of employment and use of EI after participating in SE. The decreases in earnings and incidence of employment should be interpreted with caution due to methodological reasons while the reductions in EI use should also be interpreted with caution due to the fact that self-employed individuals are not entitled to EI regular benefits.
Job Creation Partnerships (JCP): Following their participation in JCP, former claimants increased their use of EI benefits by an average of $401 per year relative to the comparison group. They also reduced their employment earnings in all years after participation by an annual average of $2,389. It is not possible to draw conclusions about their incidence of employment as results were not statistically significant.
3.1.5 Lessons Learned from the Incremental Impacts
Incremental impact analyses reported in the 2012/13 and 2013/14 EI Monitoring and Assessment Report showed that EBSMs, except SE and EAS-only, are generally effective at improving the earnings of all active claimants. EBSMs are also generally effective at increasing the incidence of employment and reducing the EI use by all active claimants. The results presented for active claimants who were "long-tenured workers" depict a mixed portrait. They indicate that participation in SD, TWS and JCP increased the incidence of employment for these individuals. They also indicate that participation in SD, JCP and EAS reduced the use of EI. However, there were decreases in employment earnings in the short-term for SD, and in all three years following participation for TWS and EAS-only.
Overall, the results suggest that some EBSMs may be effective at returning active claimants who were "long-tenured workers" to employment, but they may have a limited effect, at least in the short-term, in terms of offsetting the earnings loss they experienced following their job separation. As explained in section 1.2 above, there is a possibility that the results could have been affected by factors (i.e., differences between participants and the comparison group) that were not accounted for in the matching process. In particular, controlling for the earnings loss incurred by workers who had a high level of job-specific human capital is challenging.
It is also important to note that other studies have shown that individuals who worked for the same employer for a long period of time suffered a wage loss after losing their employment. Footnote 26 Although the present study covered a larger group of individuals who had long term employment; this group included workers who had a long tenure with one employer. In this context, the incremental decreases in earnings found for active claimants in the "long-tenured worker" EI claimant category are not totally unexpected.
Finally, as shown in Table 15, earnings impacts for active and former claimants in SD and active claimants in TWS and EAS-only improved over time. This suggests that EBSMs may have a more positive impact on earnings of these participants in the medium-term as compared to the short-term.
The results for former claimants who were "long-tenured workers" are in the same direction as those reported in the 2012/13 and 2013/14 EI Monitoring and Assessment Report for all former claimants. Similar to the results for all former claimants, the results for former claimants who were "long-tenured workers" show that they improved their earnings and incidence of employment following SD and TWS participation as well as increased their EI use following participation in any EBSM, except SE.
| Indicators | Post-Program Period | Total impact | Average annual impact |
||
|---|---|---|---|---|---|
| 1st year | 2nd year | 3rd year | |||
| Active Claimants | |||||
| Skills Development Plus EAS and Other EBSMs (n=41,714) | |||||
| Earnings ($) | -$2,854* | $254* | $1,548* | -$1,052* | -$350* |
| Incidence of employment (percentage points) |
2.5* | 4.2* | 4.7* | n/a | 3.6* |
| EI benefits ($) | -$348* | -$196* | -$72* | -$617* | -$206* |
| EI weeks (weeks) | -1.1* | -0.5* | -0.3* | -1.9* | -0.6* |
| Targeted Wage Subsidies Plus EAS and Other EBSMs (n=9,471) | |||||
| Earnings ($) | -$1,727* | -$959* | -$225 | -$2,879* | -$960* |
| Incidence of employment (percentage points) |
2.1* | 2.3* | 2.6* | n/a | 2.3* |
| EI benefits ($) | $13 | -$3 | $28 | $37 | $12 |
| EI weeks (weeks) | 0.3* | 0.2 | 0.2* | 0.6* | 0.2* |
| Self-Employment Plus EAS and Other EBSMs (n=6,352) | |||||
| Earnings ($) | -$15,787* | -$14,217* | -$13,010* | -$43,014* | -$14,338* |
| Incidence of employment (percentage points) |
-25.1* | -21.5* | -18.6* | n/a | -21.7* |
| EI benefits ($) | -$1,370* | -$959* | -$673* | -$3,002* | -$1,001* |
| EI weeks (weeks) | -3.6* | -2.5* | -1.7* | -7.8* | -2.6* |
| Job Creation Partnerships Plus EAS and Other EBSMs (n=872) | |||||
| Earnings ($) | $368 | $1,668 | $947 | $2,983 | $994 |
| Incidence of employment (percentage points) |
5.6* | 6.2* | 5.0* | n/a | 5.6* |
| EI benefits ($) | -$506* | -$157 | -$70 | -$733* | -$244* |
| EI weeks (weeks) | -1.0* | -0.1 | 0.0 | -1.0 | -0.3 |
| Employment Assistance Services (EAS)-only (n=45,182)1 | |||||
| Earnings ($) | -$2,659* | -$1,281* | -$822* | -$4,763* | -$1,588* |
| Incidence of employment (percentage points) |
-1.4* | -1.1* | -1.0* | n/a | -1.1* |
| EI benefits ($) | -$8 | -$374* | -$263* | -$644* | -$214* |
| EI weeks (weeks) | -0.5* | -1.0* | -0.7* | -2.2* | -0.7* |
| Former Claimants | |||||
| Skills Development Plus EAS and Other EBSMs (n=8,647) | |||||
| Earnings ($) | -$914* | $674* | $1,155* | $917 | $306 |
| Incidence of employment (percentage points) |
2.8* | 4.5* | 4.5* | n/a | 3.9* |
| EI benefits ($) | -$166* | $203* | $276* | $312* | $104* |
| EI weeks (weeks) | -0.6* | 0.4* | 0.6* | 0.3 | 0.1 |
| Targeted Wage Subsidies Plus EAS and Other EBSMs (n=4,883) | |||||
| Earnings ($) | $3,704* | $2,956* | $2,958* | $9,608* | $3,203* |
| Incidence of employment (percentage points) |
6.5* | 5.5* | 5.0* | n/a | 5.7* |
| EI benefits ($) | $454* | $214* | $148* | $816* | $272* |
| EI weeks (weeks) | 1.2* | 0.4* | 0.1* | 1.7* | 0.6* |
| Self-Employment Plus EAS and Other EBSMs (n=1,835) | |||||
| Earnings ($) | -$9,933* | -$8,552* | -$8,694* | -$27,177* | -$9,059* |
| Incidence of employment (percentage points) |
-20.4* | -16.5* | -16.0* | n/a | -17.6* |
| EI benefits ($) | -$1,066* | -$713* | -$589* | -$2,367* | -$789* |
| EI weeks (weeks) | -2.8* | -1.7* | -1.2* | -5.7* | -1.9* |
| Job Creation Partnerships Plus EAS and Other EBSMs (n=532) | |||||
| Earnings ($) | -$2,229* | -$2,682* | -$2,257* | -$7,168* | -$2,389* |
| Incidence of employment (percentage points) |
3.1 | 3.2 | 2.8 | n/a | 3.0 |
| EI benefits ($) | $39 | $667* | $497* | $1,204* | $401* |
| EI weeks (weeks) | 0.7 | 2.4* | 2.1* | 5.2* | 1.7* |
- * Statistically significant results at the 95% confidence level or higher
- 1Random sample of 40% of participants
3.2 Cost-Benefit Analysis for all Active and Former Claimants
A cost-benefit analysis was recently conducted to complement the incremental impact analyses for all active and all former claimants. This cost-benefit analysis assessed how the costs of EBSMs compare to the benefits from the social perspective. The social perspective represents the sum of the costs and benefits experienced by program participants and the government. As shown in Tables 16 and 17 below, the analysis addressed three different questions:
- By how much do the benefits exceed the costs within six years after end of participation? (net present value)
- How much does it cost in EI part II funds to achieve one dollar in benefit within six years after end of participation? (cost-benefit ratio)
- How many years from the end of participation would it take for the benefits to recover the costs? (payback period) Footnote 27
This recent study represents the second attempt at measuring costs and benefits for EBSMs. A cost-benefit analysis was previously conducted in most provinces and territories during the first cycle of LMDA summative evaluations. Those evaluations used different methodologies across provinces and territories. In most cases, the analysis accounted for impacts on earnings observed within one to three years after participation. This recent analysis is the first to measure costs and benefits at the national level. As well, the study included all possible costs and benefits that could be measured using available administrative data. As well, both experts and the literature highlighted the importance of assessing costs and benefits over the medium-term since impacts from employment programs often grow over time. Consequently, the study considered costs and benefits over six years after participation.
3.2.1 Methodological Approach
This recent analysis was conducted for all active and former claimants who started SD, TWS, JCP and EAS-only between 2002 and 2005 (results reported in the 2012/13 EI Monitoring and Assessment Report). This was the most recent cohort of participants possible considering that 2012 was the most recent year of Canada Revenue Agency data available at the time of undertaking the study. Overall, the study compared costs and benefits over the participation period of one or two years, and six years after participation, representing up to eight consecutive years that occurred between 2002 and 2012.
SE was not examined because of the methodological limitations surrounding the incremental impacts analysis (see explanation provided in section 1 about incremental impacts of SE for active claimants who were long tenured workers).
Costs and benefits from a social perspective are as follows: Footnote 28
- Program cost: consists of the administrative costs and the direct cost paid by the government for delivering the program.
- Marginal social costs of public funds (MSCPF): represents the loss incurred by society when raising additional revenues such as taxes to fund government spending. The value was estimated as 20% of the program cost, sales taxes, income taxes, impacts on EI and impacts on SA paid or collected by the government.
- Employment earnings: consists of incremental impacts on participants' earnings during and after participation.
- Fringe benefits: are the employer-paid health and life insurance as well as pension contributions. They were estimated as 15% of the incremental impact on earnings.
Although this analysis is more sophisticated than any of the previous EBSM cost-benefit analyses, it is still limited. While it accounts for all quantifiable costs and benefits that are directly attributable to EBSMs, it does not account for non-quantifiable benefits such as improvements in a participant's wellbeing or for the multiplier effect on the economy. When interpreting the results, readers should keep in mind that many public programs may not result in a direct return on investment for the government. For example, a government would not make direct financial gains from building a bridge, but this bridge would result in significant economic benefits for society.
3.2.2 Results for Active Claimants
Skills Development (SD): Incremental impacts showed that SD is effective at improving the earnings and incidence of employment, as well as reducing the use of EI by active claimants. As indicated in Table 16 below, the cost-benefit analysis revealed that the benefits of SD were $4,600 lower than the costs six years after participation. Those results are partly explained by the substantial earnings loss experienced by active claimants while on training. The benefits of SD would have to persist over 7.4 years after participation in order to recover the costs. Since SD focuses on human capital development, it is reasonable to expect the benefits from this intervention to last and even increase over a lifetime.
Targeted Wage Subsidies (TWS): As demonstrated by the incremental impact analyses, active claimants who participated in TWS had better earnings and incidence of employment following participation but also used more EI. The cost-benefit analysis showed that the total benefits of TWS six years after participation exceeded the costs by $167. The costs of this program were recovered within 5.9 years after the end of participation.
Job Creation Partnerships (JCP): The incremental impact analyses revealed that JCP is effective at improving active claimants' earnings and incidence of employment as well as at reducing their use of EI in the short-term after participation. The cost-benefit analysis showed that six years after participation, the benefits of JCP exceeded the costs by $366. The benefits equalled the costs within 5.9 years after participation.
Employment Assistance Services (EAS)-only: The incremental impact analysis indicated that EAS-only is effective at achieving its objective of helping unemployed individuals to return to employment as it improved active claimant's incidence of employment and reduced their use of EI after participation. However, the cost-benefit analysis showed that the benefits of EAS-only were $3,280 lower than the costs six years after the end of participation. The benefits from EAS-only would need to persist over 10.9 years in order to recover the costs.
Readers should note that the cost-benefit result is partly due to the decreases in earnings experienced by active claimants during and immediately after participation. The main expected outcome from EAS-only is the return to employment itself, and not necessarily an improvement in earnings as EAS-only does not focus on skill acquisition. The value of the return to employment was not accounted for in this analysis since it is difficult to attribute a dollar figure to such an event. The decrease in EI use was also not considered, because it represents a benefit for the government and a cost to the individual – both of them cancel each other out.
| Results for SD, TWS, JCP Plus EAS and Other EBSMs | Results for EAS-only (n=38,564) |
|||
|---|---|---|---|---|
| Total Costs and Benefits Over Participation (1 to 2 years) and 6 Years Post-program | SD (n=64,283) |
TWS (n=18,767) |
JCP (n=5,055) |
|
| Program cost | -$8,500 | -$6,259 | -$9,834 | -$692 |
| Marginal Social Costs of Public Fund | -$1,707 | -$1,166 | -$1,605 | -$197 |
| Employment earnings | $4,875 | $6,601 | $10,265 | -$2,079 |
| Fringe benefit | $731 | $990 | $1,540 | -$312 |
| Net Present Value (By how much do the benefits exceed the costs within 6 years after participation?) |
-$4,600 | $167 | $366 | -$3,280 |
| Cost-Benefit Ratio (How much does it cost in EI part II funds to achieve $1 in benefit within 6 years after participation?) |
$2.20 | $1.00 | $1.00 | Negative benefits |
| Payback period (How many years from the end of participation would it take for the benefits to recover the costs?) |
7.4 years after participation | 5.9 years after participation | 5.9 years after participation | 10.9 years after participation |
3.2.3 Results for Former Claimants
Skills Development (SD): The incremental impact analyses showed that SD improved former claimants' earnings and incidence of employment. However, they generally increased their use of EI after participation. As shown in Table 17, the benefits from SD were $5,176 lower than the costs six years after participation. The benefits would have to persist over 8.6 years after participation in order to equal the costs. As explained for active claimants, it is reasonable to expect the benefits of SD to persist over a longer period since the effects from skill acquisition may last and even increase over a lifetime.
Targeted Wage Subsidies (TWS): As demonstrated in the incremental impact analyses, TWS was effective at improving former claimants' earnings and incidence of employment but they used more EI after participation. From a cost-benefit stand point, TWS had the most positive results of all EBSMs for former claimants. Six years after the end of participation, its benefits exceeded the costs by $12,452. The costs of this Employment Benefit were recovered within the second participation year.
Job Creation Partnerships (JCP): Incremental impacts for former claimants who participated in JCP showed that this program is effective at increasing their earnings and incidence of employment but also increased their use of EI after participation. As shown in Table 17 below, the benefits of JCP from the social perspective were $9,338 lower than the costs six years after participation. The benefits from JCP may never recover the costs.
| Results for SD, TWS, JCP Plus EAS and Other EBSMs | |||
|---|---|---|---|
| Total Costs and Benefits Over Participation (1 to 2 years) and 6 Years Post-program | SD (n=42,513) |
TWS (n=24,523) |
JCP (n=5,013) |
| Program cost | -$8,766 | -$6,102 | -$9,376 |
| Marginal Social Costs of Public Fund | -$1,471 | -$812 | -$1,512 |
| Employment earnings | $4,333 | $16,839 | $1,348 |
| Fringe benefit | $728 | $2,526 | $202 |
| Net Present Value (By how much do the benefits exceed the costs within 6 years after participation?) |
-$5,176 | $12,452 | -$9,338 |
| Cost-Benefit Ratio (How much does it cost in EI part II funds to achieve $1 in benefit within 6 years after participation?) |
$2.40 | $0.30 | $248.30 |
| Payback period (How many years from the end of participation would it take for the benefits to recover the costs?) |
8.6 years after participation | Within the 2nd participation year | Cost may never be recovered |
3.2.4 Lessons Learned from the Cost-Benefit Analysis
The incremental impact analyses reported in the previous two EI Monitoring and Assessment Reports showed that EBSMs, except SE, are generally fulfilling their objective of helping unemployed individuals find employment. The cost-benefit analysis provides some insights about how the direct quantifiable benefits from EBSMs compare to the quantifiable costs of those programs.
Results show that, from a social perspective, the costs of TWS for both active and former claimants and of JCP for active claimants can be recovered within less than six years after participation. The costs of SD may be recovered within seven to nine years after participation. In this regard, it should be acknowledged that SD requires a significant investment from the government since its costs are relatively high compared to other EBSMs. It also requires a significant investment from the participants whom experience earnings loss while on training. However, since SD focuses on skill acquisition and human capital development, its benefits can last many years, if not a life time.
The benefits from JCP, when offered to former claimants, may never match the costs of this program. However, JCP funds help develop the community and the local economy, but none of those benefits were taken into account in the cost-benefit analysis.
The benefits from EAS-only would need to persist over more than 10 years to recover the costs. EAS-only participants had reductions in their employment earnings in the short-term after participation, even though these interventions are effective at helping unemployed individuals return to employment. In addition, evidence from another recent evaluation study Footnote 29 , conducted by ESDC showed that participating in EAS-only early during an EI benefit period leads to higher earnings and employment impacts as compared to participating later. This suggests that reaching unemployed individuals soon after they open an EI claim may improve the program success. Further analysis would be required to determine if this could also improve the cost-benefit results. In addition, there are significant benefits associated with EAS-only that are not quantifiable.
4. Pan-Canadian activities and the National Employment Service
This section analyzes pan-Canadian activities that ESDC supports and delivers using EI Part II funds.
4.1 Context
In addition to objectives established with provinces and territories through the LMDAs, the Government of Canada plays a leadership role in EI Part II by ensuring accountability and evaluation of LMDA programming, and by developing labour market policy. In addition, the federal government plays a primary role in responding to challenges that extend beyond local and regional labour markets by delivering pan-Canadian activities.
Pan-Canadian activities fulfill three primary objectives:
- promoting an efficient and integrated national labour market, and preserving and enhancing the Canadian economic union;
- helping address common labour market challenges and priorities of international or national scope that transcend provincial borders; and
- promoting equality of opportunity for all Canadians with a focus on helping underrepresented groups reach their full potential in the Canadian labour market.
Pan-Canadian funding is focused on four streams of investment:
- Programming for Indigenous People;
- Enhancing Investments in Workplace Skills;
- Supporting Agreements with Provinces, Territories and Indigenous Peoples; and
- Labour Market Information and National Employment Service Initiatives.
In 2014/2015, pan-Canadian program expenditures remained stable, totalling $117.4 million compared to $117 million in the previous year. Pan-Canadian programming delivered through ASETS totalled $93.2 million, while expenditures on LMPs were $20.7 million and $3.5 million was spent through R&I.
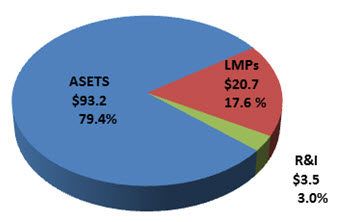
Show Data Table
| $ | % | |
|---|---|---|
| ASETS | $93.2 | 79.4% |
| LMPs | $20.7 | 17.6% |
| R&I | $3.5 | 3.0% |
- * Total of percentages may not add up exactly to 100.0% due to rounding.
4.2 Programming for Indigenous People Footnote 30
Pan-Canadian Programming in Action:
The Aboriginal Community Career Employment Services Society (ACCESS)
ACCESS was formed in 1999 as a non-profit society, mandated to serve the Indigenous community in the field of human resource development across 21 municipalities and one electoral area in the Greater Vancouver Regional District: Anmore, Belcarra, Bowen Island, Burnaby, Coquitlam, Delta, Electoral Area A, Langley City, Langley Township, Lions Bay, Maple Ridge, New Westminster, North Vancouver City, North Vancouver District, Pitt Meadows, Port Coquitlam, Port Moody, Richmond, Surrey, Vancouver, West Vancouver and White Rock.
Guided by a group of six Indigenous service delivery organizations, ACCESS, which is a member of the ASETS network, works collaboratively with its partners, such as Native Education College, Helping Spirit Lodge and Fraserworks, to develop skills and increase the labour market participation of Indigenous people in today's economy.
ACCESS provides labour market services to Indigenous people in the Greater Vancouver Area including such programming as literacy and essential skills upgrading, career counseling and training-to-employment activities, including job specific skills training, job retention counseling, on-the-job training, wage subsidies, etc.
In 2014-2015, ACCESS training programs assisted over 1,500 clients, placed over 540 Indigenous people in employment and supported over 90 returning to school.
Pan-Canadian funding is delivered through ASETS and its objective is to improve Indigenous peoples' participation in the Canadian workforce, ensuring that First Nations, Inuit and Métis people have the skills and training for sustainable, meaningful employment. It also supports the development of a skilled Indigenous pool of workers, which is one of the objectives of the Federal Framework for Aboriginal Economic Development.
ASETS constitutes an investment of $1.68 billion over five years (2010-2015). The program was set to end on March 31, 2015, but was extended to March 31, 2017.
ASETS supports a network of over 80 Indigenous service delivery organizations (agreement holders), with over 600 points of service across Canada. These organizations help develop and deliver training and employment programs, as well as services that are designed for the unique needs of their clients. These programs and services help Indigenous clients prepare for, obtain and maintain sustainable employment, and assist Indigenous youth in making a successful transition from school to work or to support their return to school.
Specific attention under ASETS is given to the development of service provider partnerships with the private sector, educational institutions and other levels of government in demand-driven labour markets. In addition, ASETS is linked to the First Nations and Inuit Child Care Initiative (FNICCI), which provides child care support to assist Indigenous parents/caregivers accessing labour market programs. ASETS also supports labour market obligations specified in treaty and self-government agreements that are in place with some Indigenous groups.
The 2014/2015 investment in ASETS totalled $347.6 million, which included expenditures of $93.2 million from EI Part II funds. In 2014/2015, ASETS resulted in 20,274 clients becoming employed (a cumulative total of 89,266 since 2010) and 9,767 clients returning to school (a cumulative total of 42,695 since 2010).
4.3 Enhancing Investments in Workplace Skills
This investment stream helps the federal government ensure that Canada's labour market functions as an integrated national system by:
- removing barriers and impediments to labour mobility;
- building capacity among workplace partners to improve skills development as a key factor in increasing productivity;
- leveraging investment in and ownership of skills issues, especially in addressing skills and labour shortages; as well as
- supporting efforts to ensure Canada's learning system responds to employers' skills requirements.
4.3.1 Sectoral Initiatives Program (SIP)
Launched on April 1, 2013, the Sectoral Initiatives Program (SIP) aims to address current and future skills shortages by supporting the development and distribution of sector-specific labour market intelligence (LMI), national occupational standards (NOS), and skills certification and accreditation systems.
The SIP's mandate is to help industries identify, forecast, and address their human resources as well as their skills issues. The SIP funds partnership-based projects for key sectors of the Canadian economy from both the federal Consolidated Revenue Fund and EI Part II. These projects are developed and implemented by such industry partners as workplace organizations; employer associations; education and training bodies; professional associations; unions; and, Indigenous organizations.
Through its LMI business line, the SIP supports the development, validation and distribution of timely, national, sectoral and cross-sectoral LMI. SIP also plays an important role within the Department, in engaging with employers and industry stakeholders, facilitating deeper sectoral analysis and informing government policy and program issues.
In funding the development of NOS, the SIP aims to helping the different industry sectors document and communicate sector-specific skills requirements to educators, trainers, employers and workers.
Pan-Canadian Programming in Action:
BuildForce Canada (BFC)
In 2014/2015, through the project entitled "Labour Market Intelligence: Construction Sector Forecasts", SIP supported Buildforce Canada's Labour Market Information (LMI) program. It provides an annual forecast by province for 34 trades and occupations, a national summary, provincial highlights, and a database website. The reports are bilingual, and available in print and online at www.constructionforecasts.ca.
Using the BuildForce Canada database and reports:
- improves the functioning of the construction labour market;
- enables all construction stakeholders to plan for and mitigate human resource issues;
- assists owners in planning and addressing skilled labour requirements to meet demand;
- facilitates labour mobility for construction tradespeople;
- informs training and apprenticeship planning and decision making;
- helps education and training communities plan construction skills development offerings;
- provides jobseekers valuable information to assist them in making better informed career and training decisions; and,
- provides information useful to government policy making.
By supporting employee certification and learning program accreditation, the SIP provides a key solution for integrating a formal quality control framework for education and training, founded on employer-validated NOS, to help ease labour mobility and labour market adjustment.
The SIP funds 33 multi-year agreements that exist for projects currently being implemented with various stakeholders representing different industry sectors for the development of the following products: labour market information and/or forecasting systems (42%), NOS (12%), certification and accreditation (10% combined) and multiple activities (36%). For example, in 2014/2015, the SIP was funding several cross-sectoral projects as well as projects for the: environment, tourism, mining, transportation, oil and gas, manufacturing, agriculture, forestry, information technology, aerospace, supply chain, and construction sectors.
In 2014/2015, 85 new labour market research reports and 12 forecasting systems were developed and released through SIP agreements in sectors such as construction, environment, oil and gas, as well as mining. More than 5,000 people used these reports and forecasting tools. Fifty NOS were created or updated, and the SIP contributed to the development of 36 certification programs and 22 accreditation programs. Furthermore, the program succeeded in leveraging almost $10M from the private sector and other stakeholders. Many of the projects have not yet achieved their ultimate objectives as they are multi-year projects. The following is an example of a project that involved developing or updating an LMI and/or forecasting program/system.
4.3.2 National Occupation Classification (NOC)
The National Occupational Classification (NOC) provides a standard taxonomy for dialogue on the world of work and a national framework for collecting, analyzing and disseminating occupational data for Labour Market Information (LMI), as well as employment-related program administration. It comprises more than 40,000 occupational titles grouped into 500 Unit Groups ("NOC codes"), organized according to skill levels and skill types. Each Unit Group describes Main Duties and Employment Requirements, in addition to providing examples of occupational titles.
The NOC is used by students; workers; employers; educational and training organizations; as well as career and vocational counsellors, to support career exploration and informed career decision-making. It is also used by researchers and to support policy and program design, as well as service delivery. It is the foundation for capturing occupation-related LMI in Canada.
Managed jointly by ESDC and Statistics Canada since 1966, the NOC is revised every five years, in line with Census and National Household Survey cycles, to reflect labour market dynamics. The most recent NOC 2011 was released in January 2012, and NOC users are in the process of moving to the NOC 2011 structure. Work is continuing on migrating ESDC systems and programs to the NOC 2011. Work is also well underway with Statistics Canada on revisions to the NOC for the next release in 2016.
4.3.3 Skilled Trades and Apprenticeship, and the Red Seal Program
Apprenticeships are essential to building a highly skilled and mobile trades workforce that supports Canadian competitiveness. The Interprovincial Standards Red Seal Program is Canada's standard of excellence for training and certification in the skilled trades and provides a vehicle to promote harmonization. The program is well-established at developing common interprovincial standards for trades. In most provinces and territories, the Red Seal examination is used as the certification exam for Red Seal trades. Under this program, experienced tradespeople and apprentices, who have completed their training, may take the interprovincial Red Seal examination. If successful, they receive a Red Seal endorsement on their provincial or territorial certificate of qualification.
Red Seal Program Fast Facts:
- More than 20,000 Red Seal endorsements were issued to apprenticeship completers and 7,000 to trade qualifiers in 2014.
- Key Red Seal trades by endorsements include: Construction Electrician, Welder, Plumber, Automotive Service Technician and Carpenter.
- Red Seals issued in 2014 increased by 30%. In the last decade, there has been a 52% increase in Red Seals issued.
- More than 350 industry representatives have participated in ESDC organized workshops to develop Red Seal products.
- 47,486 Red Seal examinations were written. 78% of apprentices successfully challenged the exam.
- The Red Seal Program's website has counted 345,000 visitors.
Source: Canadian Council of Directors of Apprenticeship, 2014. Statistics are compiled on a calendar year basis.
The Red Seal endorsement is widely recognized and respected by industry as a standard of excellence in the skilled trades. Each year, approximately 44,000 completing apprentices and qualified uncertified tradespeople from across Canada write Red Seal examinations, and over 25,000 Red Seals are issued.
The Canadian Council of Directors of Apprenticeship (CCDA), comprised of the apprenticeship authorities from each province and territory and representatives from ESDC, administers the Red Seal program. In addition to functioning as the national secretariat—providing administrative, operational and strategic support—ESDC provides significant funding for the Red Seal Program.
The Red Seal program currently covers 57 skilled trades, which encompass 77% of registered apprentices. Footnote 31 ESDC works closely with industry experts and apprenticeship authorities to coordinate the development of high-quality Red Seal products, including National Occupational Analyses (NOAs) and interprovincial examinations. These products are updated periodically to reflect evolving labour market needs. Because each province and territory needs standards and examinations to certify thousands of apprentices and trade qualifiers each year, the collaboration involved in developing interprovincial Red Seal standards and examinations results in significant economies of scale for governments.
The core of the Red Seal Program lies in quality interprovincial standards for industry, against which tradespeople can be trained and assessed. With ESDC support, the CCDA collaborates to build these standards with industry from across Canada. The program also encourages the harmonization of apprenticeship training outcomes through common standards, which provinces and territories use to inform the in-school portion of apprenticeship programs. In 2014/2015, ten new National Occupational Analyses and two Interprovincial Program Guides were published.
In 2014/2015, significant work was done to develop enhanced standards for the Construction Electrician and Steamfitter/Pipefitter trades under the Strengthening the Red Seal (SRS) initiative. Continuous improvement is essential to ensure that the Red Seal Program and its standards remain rigorous, relevant to industry and labour market demands and is nationally recognized. New occupational standards were developed through national workshops and were piloted to include industry-defined performance expectations, evidence of skills attainment and learning outcomes. The project established industry advisory committees for each pilot trade which give industry a more direct role in guiding the process of standards development. Evaluation of the pilot was carried out and the final evaluation will be used to inform enhancements to the development processes going forward.
To further reduce barriers to accreditation in the skilled trades in Canada and increase opportunities for apprentices, the Government of Canada continues to work closely with provinces and territories through the CCDA to facilitate the harmonization of apprenticeship training requirements in targeted Red Seal trades. Harmonization will encourage labour mobility across the country and help more apprentices complete their training. In July 2014, the Forum of Labour Market Ministers (FLMM) endorsed the CCDA's Harmonization initiative as a top priority with a focus on harmonizing the first ten Red Seal trades Footnote 32 . As part of this work, the CCDA identified four harmonization priorities in consultation with industry and training stakeholders: use of the Red Seal trade name; consistent total training hours (in-school and on-the-job); same number of training levels; and more consistent sequencing of training content using the most recent National Occupational Analyses. In 2014/2015, the CCDA developed proposed harmonization recommendations for the first 10 Red Seal trades and consultations with industry and training stakeholders were held for seven of the 10 trades. The CCDA also hosted pan-Canadian webinars with stakeholders to reach consensus on harmonization recommendations for the Carpenter, Welder and Metal Fabricator (Fitter) trades.
With ESDC support, CCDA representatives meet annually with national apprenticeship stakeholder groups to provide updates and seek input on key initiatives. At the CCDA's 2015 meeting, 30 national stakeholders confirmed their support for the work underway on the CCDA's strategic priorities with respect to the Red Seal Program, such as work to strengthen the Red Seal Program, employer engagement and promote the harmonization of apprenticeship training and trade certification requirements in targeted trades.
ESDC continues to work with provinces and territories to increase employer engagement in apprenticeship. In 2014/2015, ESDC, on behalf of the CCDA, commissioned a research report Footnote 33 to inform the development of new collaborative efforts by the FLMM to encourage employer participation. In addition, ESDC, working with Public Works and Government Services Canada and Defence Construction Canada, launched the Apprentice Procurement Initiative in June 2014 to support the use of apprentices through federal construction and maintenance contracts.
The Red Seal website (www.red-seal.ca) is the communications portal for the Red Seal Program. In 2014/2015, the CCDA, with ESDC funding, undertook to improve awareness of apprenticeship and the Red Seal Program through an enhanced and user-friendly website. Communications and outreach resulted in more than 210,000 visitors on the Red Seal Program's website, for a total of 1,164,862 page views, over the course of the year. The Red Seal kiosk and promotional materials informed Canadians about the value of the Program and apprenticeships at nine public events across Canada. As the National Secretariat for the program, in 2014, ESDC responded to more than 2,000 e-mails and 750 Red Seal Info Line messages.
Through the Red Seal Program, essential skills tools are developed to help apprentices build their essential skills such as numeracy, document use and problem solving. In 2014/2015, there were a total of 67,352 visitors to the Essential Skills tools on the ESDC website.
The Government of Canada introduced new measures to support apprentices and improve the apprenticeship system. The Canada Apprenticeship Loan (CAL) was launched in January 2015 to provide apprenticeships in Red Seal trades up to $4,000 in interest-free loans per period of technical training. The CAL is expected to assist at least 26,000 apprentices per year with over $100 million in loans. In addition, the Government of Canada introduced the Flexibility and Innovation in Apprenticeship Technical Training (FIATT) pilot project to explore the use of innovative approaches to the technical training of apprentices. Further to the first call for proposals launched in January 2015, 37 project proposals were received. Projects are expected to roll out in 2015/16.
Research
The Registered Apprenticeship Information System (RAIS) is an annual survey conducted by Statistics Canada with ESDC funding support. The RAIS obtains information from provinces and territories on individuals who receive training or certification within a trade where apprenticeship training is being offered by at least one province or territory.
According to Statistics Canada Footnote 34 , there were 349,806 apprentices in 2013. Of the 95,058 new registrations, 69,783 (73%) were in Red Seal trades.
- New registrations in the top 10 Red Seal trades were led by construction electricians (10,173); carpenters (8,043); automotive service technicians (6,054); welders (4,461); and steamfitter/pipefitters (3,762).
- The fastest growth was in the automotive service trade (+69.7%) and ironworker trade (+37.6%).
In March 2015, ESDC, working with Statistics Canada finalized the questionnaire for the National Apprenticeship Survey (NAS). The NAS is designed to understand the factors that affect apprentices' completion and certification; examine the perceptions of apprentices in all aspects of their programs; and, assess the potential influence of recent federal supports to apprentices. The survey will be administered from August 2015 to February 2016.
The Apprenticeship Incentive Grant, the Apprenticeship Completion Grant and the Apprenticeship Job Creation Tax Credit for employers are tied to designated Red Seal trades to promote interprovincial mobility and national standards.
4.3.4 Youth Awareness
The national Youth Awareness program provides financial assistance for projects designed to address community labour market issues. Through job fairs and promotional events, this program aims to raise awareness among employers and communities of the fact that young people are the labour force of the future.
In 2014/2015, program priorities included raising awareness of skilled trades and technologies among youth. Delivered at the national and regional levels, Youth Awareness also leverages funds from many sources, including provinces and territories. In 2014/2015, Youth Awareness expenditures totalling over $2 million, supported two projects.
Pan-Canadian Programming in Action:
Youth Awareness
In organizing skills competitions, Skills/Compétences Canada (a non-governmental organization) and its regional counterparts work in partnership with local organizations, educators and governments to make skilled trade occupations more visible to youth, teachers, students, parents and the general public. The philosophy of the skills competitions is to recognize student excellence; to directly involve industry in evaluating student performance; to keep training relevant to employers' needs; and to promote the skilled trades.
The 20th Skills Canada National Competition was held in Toronto, Ontario, in June 2014. More than 500 skilled trade and technology students and apprentices from all regions of Canada competed in 43 contest areas. The competition highlighted the importance of Essential Skills within the skilled trade and technology occupations. Over 65 employers, associations, labour groups, training institutes and government partners hosted exhibitor booths and interactive activities for all attendees. They all worked in partnership to profile the valuable career opportunities in trades and technologies, as well as provide information about the educational requirements and supports for these occupations. The four-day event attracted over 7,500 visitors. According to an on-site survey, 75% of young visitors said they would consider a career in skilled trade and technology fields after attending the event, and 88% of spectators felt they learned about new career options in skilled trade and technology fields as a result of visiting the event.
In 2014/2015, the Youth Awareness program received its last year of funding through the pan-Canadian envelope. Starting in 2015/16, awareness activities such as skills competitions will be funded through the Career Focus program, as part of the Youth Employment Strategy, allowing for increased program efficiencies.
4.3.5 National Essential Skills Initiative
The National Essential Skills Initiative (NESI) helps support the mandate of ESDC's Office of Literacy and Essential Skills (OLES), in supporting all Canadians to improve their essential skills (ES) to better prepare for, get and keep a job, and adapt and succeed at work. This is aligned with the Government of Canada's commitment to building a highly skilled, adaptable and inclusive labour force and efficient labour market.
Given that employment and training programs are predominantly delivered through provincial and territorial governments, non-profit organizations, unions and private firms, ESDC helps these entities integrate ES interventions into their programming, services and policies. This enhances opportunities and resources for Canadian workers and employers, supporting the development of a more skilled workforce. ESDC helps improve awareness and application of ES knowledge and information among partners, stakeholders and employers; develops tools to support ES in and for the workplace; and reduces non-financial barriers to skills development. The program supports the development of innovative approaches to strengthen the capacity of employment and training service providers to help improve the ES of adult Canadians.
Project funding is provided through NESI, which includes both the Research and Innovations and Labour Market Partnerships of EI Part II funds. Complementary initiatives are supported through Consolidated Revenue Funds (CRF) and delivered under the Terms and Conditions of the Adult Learning, Literacy and Essential Skills Program (ALLESP).
Since 2010, OLES has collaborated with over 4,000 employers and industry stakeholders, 41 post-secondary institutions, as well as with all 13 provinces and territories, in the design and delivery of projects. Beneficiaries of these projects include over 30,000 Canadians, including skills development for over 7,000 job seekers and workers.
The OLES places an emphasis on essential skills for work, including skills associated with literacy (i.e. reading, writing, document use and numeracy), thinking skills, oral communication, computer use, working with others and commitment to continuous learning. It has been demonstrated that improving these skills helps adult Canadians get a job, adapt and succeed in the labour market while responding to employers' need to find skilled workers.
A recent NESI-funded project was the UPSKILL project Footnote 35 with the Social Research and Demonstration Corporation (SRDC), a non-profit social policy research organization. The UPSKILL project delivered by SRDC used a random assignment design to provide the most reliable measures of impacts of ES training on workers' skills and job performance in the Accommodations sector of the Tourism industry. The project provided a credible test of the effectiveness of workplace and essential skills training by measuring its impacts on workers and firms and estimating the return on investment for all those engaged. The project provided a cost-benefit analysis of workplace essential skills training and determined that firms are estimated to earn an average return of 23% on their investment in the first year after providing training to employees, as measured by reduced error rates, increased retention, improved productivity and customer service. Workers experienced higher success in industry performance certification, greater earnings and lower levels of periods of unemployment.
Another recently funded project was dedicated to helping instructors and trainers in the construction industry improve their instructional practice and increase their apprentices' success by integrating ES into their technical training. The Sustainable Essential Skills in Construction website, Footnote 36 developed by BuildForce Canada, helps technical instructors in the skilled trades help their apprentices successfully complete their apprenticeship training, evolve with their jobs and adapt to workplace change.
Other projects funded through ALLESP provided further evidence of the benefits of investing in ES. Key findings from a survey of employers in the skilled trades, Footnote 37 has also demonstrated that investing in essential skills training is a sound business decision. When both direct and indirect costs are considered, employers experience a return of $3.08 for every $1 invested on training. In another research study, Footnote 38 the Canadian Apprenticeship Forum created a statistical measure of the relationship between ES and labour market outcomes with a particular focus on apprentices and vulnerable populations including Indigenous peoples, immigrants and persons with disabilities. For all groups, it was statistically demonstrated that improved ES fosters higher pay, emphasizing their importance in today's knowledge economy.
A Call for Concepts was closed on February 18, 2015, in which projects were sought that would replicate and scale up proven approaches to skills upgrading, as well as to improve the quality of employment and training supports that are responsive to both worker and employer needs. Projects would support workers to be better prepared to meet on-the-job demands by engaging employers through the development of models targeted to specific industries or occupations that are of national significance. Submitted concepts are being reviewed and it is anticipated that the projects will be funded over the next three fiscal years with funds from both NESI and ALLESP.
4.3.6 Research Project: Respecting Financial Assistance to Internationally Trained Workers
Launched in February 2012, the Foreign Credential Recognition (FCR) Loans Pilot Project provided funding to internationally trained individuals (ITIs) who experienced difficulty in accessing traditional lending sources to finance costs associated with the FCR process in Canada.
The Government of Canada allocated $18 million for the pilot over a four year period, ending on March 31, 2015. The pilot was funded through the Research and Innovation support measure of EI Part II, and took place in nine communities across nine provinces.
Immigrants Face Unique Financial Barriers
A number of financial barriers can discourage internationally trained individuals from pursuing the assessment and recognition of their credentials for a regulated occupation in Canada, such as costs related to application fees, language and credential assessment, exam fees, bridge training tuition, travel, child care and lost income opportunities while preparing and undertaking FCR activities.
According to Statistics Canada's Longitudinal Survey of Immigrants of Canada (2003), 52% of immigrants in need of financial assistance for education or training were unable to find support. And 36% of immigrants encountered financial barriers in trying to get their credentials recognized.
In 2009, 70% of skilled immigrants arrived in Canada with dependents leading to a greater urgency to find work and satisfy family needs.
- To complement their first income, more than half of skilled immigrants held two or more jobs.
- Forgone income is a major barrier for immigrants in deciding whether or not to continue their licensure process.
- Income support during up-skilling activities is rare
The FCR Loans Pilot Project delivered over 1,800 loans with an average amount of $7,200. Loan recipients were typically seeking credential recognition in high-demand occupations, including those targeted in other federal government initiatives such as the Pan-Canadian Framework Footnote 39 for the Assessment and Recognition of Foreign Qualifications (e.g.: physicians, engineers, nurses, accountants, and trades).
SRDC, which was contracted to undertake the research and monitor pilot site activities, demonstrated the program's potential to alleviate the financial burden of having one's foreign credentials recognized in Canada and subsequently gaining employment in one's field. In addition, SRDC findings confirmed the demand for financial assistance among newcomers, the capacity of organizations to work together and the key role government plays in facilitating partnerships and leveraging private investment.
Specifically, the SRDC survey of 210 loan recipients indicated the following pilot outcomes:
- Increased employment: 47% increase in the full-time employment of survey participants after receiving the loan;
- Faster progress: The majority of loan recipients surveyed were able to accelerate their FCR process and 2/3 would have either taken more time to complete FCR or postponed it;
- Higher Income: Survey results indicate an upward shift in the distribution of income, with fewer loan recipients in the survey sample in the bottom income categories and more in the top within a year;
- Greater Self-Sufficiency: After one year, survey participants were less reliant on government transfers (i.e. EI); and
- High Loan Repayment: Of the loans that had entered their repayment period at the end of the Pilot, less than 1% were in default.
Demographics of loan recipients
Year 2 Implementation Report
Selection of loan recipients' characteristics
- Comparable number of men and women with 79% aged between 25 and 44 years.
- High levels of educational attainment – 58% undergraduate degree, 22% master's degree and 11% doctorate.
- 60% having lived in Canada less than five years.
- Top 3 Source Countries:30% Philippines, 12% India and,10% Iran
- Most popular intended occupations: 15% nurses, 11% doctors and, 9% accountant.
- Average monthly income of $1,859 before receiving loans.
- Most common use for loan:40% tuition, 28% living expenses and, 26% exam fees
4.4 Supporting Agreements with Provinces, Territories and Indigenous Peoples
This investment stream supports existing LMDAs with province and territories and agreements with Indigenous peoples through ASETS. These agreements require Canada to fund activities that support service delivery and labour market development, such as activities that provide EI systems connectivity, ensure timely access to EI Part II for EI claimants and effective reporting by provinces and territories.
4.4.1 LMDA Systems Connectivity
The secure electronic exchange of program data between Canada and provinces and territories sustains the delivery of EBSM-similar programming under the LMDAs. Provinces and territories exchange data with ESDC to verify EI eligibility; understand the characteristics of EI claimants; identify applicants who can benefit from EBSM-similar programming; report on service delivery; and, refer claimants to benefit programming while on claim. ESDC uses the data received from provinces and territories to monitor, assess and evaluate their programs. The systems and applications involved in these data exchanges require ongoing maintenance and improvements to maintain high quality service delivery standards. Some of the systems also support programming to Indigenous communities through the ASETS and a Federal/Provincial data exchange called the Assignment of Benefits that helps to coordinate social assistance payments while EI claims are adjudicated.
4.4.2 LMDA IT Systems Modernization
ESDC continued to modernize many components of the systems and applications that enable secure electronic data exchange and the management of data related to LMDA programming. In 2014/2015, ESDC introduced: new functions such as Alerts for changes in EI status to improve efficiency and the ability to flag the intent to recommend training for pending EI claimants; expanded the Targeting, Referral and Feedback component to enable provinces and territories to target EI clients for early interventions; and EI data for provinces and territories to inform strategic planning.
4.5. Labour Market Information
ESDC implements a National Work Plan for labour market information (LMI) services in support of the National Employment Service. In doing so, ESDC delivers accurate and reliable labour market information to individuals and employers to help them make informed labour market decisions.
LMI helps workers manage their careers and search for jobs by providing occupational and skills information. It assists employers in recruiting, training and retaining workers, and supports business and investment decisions by providing information on wages, labour supply and demand, as well as influencing educational programs.
LMI also strengthens Canada's economic and social union by helping the labour market function as an integrated national system by. In addition, it contributes to:
- aligning human capital investments with the needs of the economy;
- facilitating job searches and improving job fit for individuals;
- helping employers find or train required staff; and,
- improving the effectiveness of public policies at all levels of government.
ESDC assesses the employment outlooks and wages for 520 occupations (NOC 4-digit level), at the provincial and economic region level, where data permits. ESDC's latest outlooks and wages were disseminated on Job Bank in May 2015 and wages were updated in November 2015.
Weekly Labour Market News, monthly Labour Market Bulletins, and semi-annual Environmental Scans were also made available on the Job Bank website for all regions of the country. Additional LMI products, such as Sectoral Outlooks and Client Segment Profiles, were made available for some regions on Job Bank.
4.6 National Employment Service Initiatives
Departmental operating funds also support online national employment services administered by ESDC to help Canadians find suitable employment and help employers find suitable workers. These free, bilingual online services connect job seekers and employers, and help individuals prepare and carry out their return-to-work action plans. The Job Bank is designed to improve the way information about jobs and the labour market is disseminated by reducing duplication, improving the quality of information, and making online information more accessible and easier to use.
4.6.1 Job Bank
ESDC maintains this electronic labour exchange in partnership with provinces and territories, which fosters efficient and inclusive labour markets by connecting job seekers and employers. In addition to job postings and labour market information, the site provides basic information on how to acquire the skills needed for specific careers. Job Bank also launched the Career Tool in March 2015 to help youth make informed decisions on their education and career paths.
Job Bank also provides tools such as Job Match, which was modernized in 2014/2015 to help job seekers find jobs that match their skills and experience, and provide employers with better tools to look for qualified Canadians. Additionally, job seekers can subscribe to Job Alerts to receive daily email notifications including new jobs postings corresponding to the job seeker's search criteria, local job market information and more. 1,250,000 Job Alerts are sent to 600,000 subscribers daily.
In 2014/2015, Job Bank received more than 66 million visits and provided access to about 1.3 million job postings. The top five NOC advertised on Job Bank were: 1) retail salespersons and sales clerks; 2) material handlers 3) customer service, information and related clerks; 4) truck drivers; and 5) cooks.
The website provides job market information from over 30 sources, including private sector job boards, and can generate more than 34,000 unique job market reports based on a client's occupation and location. The reports provide targeted and comprehensive information on job postings, wage rates, employment trends and outlooks, licensing and certification requirements, job skills, and relevant educational and training programs for occupations at the regional, provincial and national levels.