
Employment Insurance Monitoring and Assessment Report for the fiscal year beginning April 1, 2016 and ending March 31, 2017
Chapter 1 - Labour market context
From: Employment and Social Development Canada
On this page
This chapter outlines key labour market developments and the economic situation that prevailed in Canada during the fiscal year beginning on April 1, 2016 and ending on March 31, 2017 (FY1617), the period for which this Report assesses the Employment Insurance program.Footnote 1 Section 1.1 provides a general overview and historical context of the economic situation for FY1617. Section 1.2 summarizes key labour market developments in the Canadian economy.Footnote 2, Footnote 3 Section 1.3 discusses long-term labour market trends, such as changes in the labour force composition, reflecting a more educated and ageing population, changes in the nature of jobs notably attributable to technological advancement leading to increasing job opportunities for high-skilled workers but also to fewer jobs for middle-skilled workers and changes in the unemployed population reflecting variations in labour supply and labour demand over time. Tables related to elements discussed in this chapter can be found in Annex 1.
1. Labour market context
1.1 Economic overview
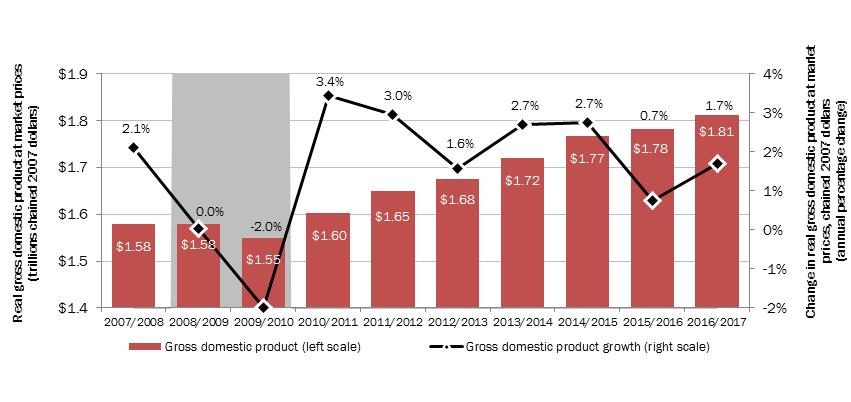
Canada’s real Gross Domestic Product (GDP) rebounded in the fiscal year beginning on April 1, 2016 and ending on March 31, 2017 (FY1617), increasing by 1.7%, following its slowest growth rate recorded since the 2008 to 2009 recession (+0.7% in FY1516). Nevertheless, economic growth remained somewhat below the average recorded in the five-year period following the end of the FY0809 recession (see Chart 1). This is partly attributable to persisting lower global commodity prices combined with major forest fires in Alberta putting pressure on the Canadian economy early in the year, and to low business investments which also continued to decline (-3.0%).Footnote 4 When compared to other Group of Seven (G7) countries, Canada ked third in real GDP growth in FY1617, below the United Kingdom (+2.0%) and Germany (+1.9%).Footnote 5 As a result, Canada continues to enjoy a high standard of living and ranked third among G7 nations (using fixed Purchasing Power Parity) with roughly USD 42,700 per capita.Footnote 6
Show Data Table
| Year | Gross domestic product growth (right scale) | Gross domestic product (left scale) |
|---|---|---|
| 2007 to 2008 | 2.1% | 1.58 |
| 2008 to 2009 | 0.0% | 1.58 |
| 2009 to 2010 | -2.0% | 1.55 |
| 2010 to 2011 | 3.4% | 1.60 |
| 2011 to 2012 | 3.0% | 1.65 |
| 2012 to 2013 | 1.6% | 1.68 |
| 2013 to 2014 | 2.7% | 1.72 |
| 2014 to 2015 | 2.7% | 1.77 |
| 2015 to 2016 | 0.7% | 1.78 |
| 2016 to 2017 | 1.7% | 1.81 |
- Note: Shaded area(s) corresponds to recessionary period(s) in Canada's economy.
- Source: Statistics Canada, Canadian System of Macroeconomic Accounts, CANSIM table 380-0064
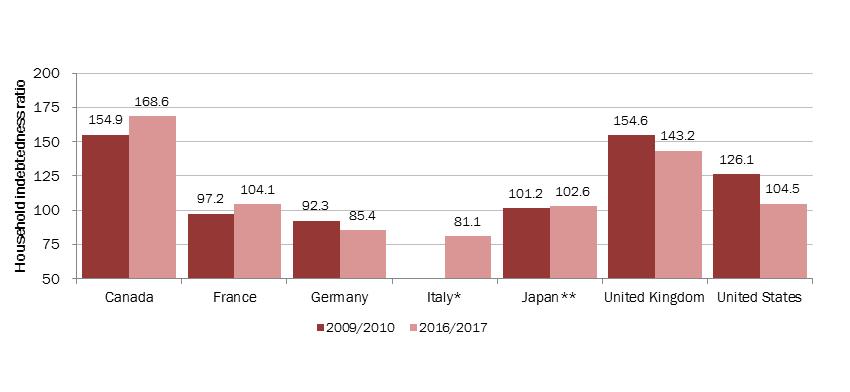
Even though energy prices remained well below the average observed in the past 10 years, economic growth picked up in FY1617 due to greater domestic consumer spending. Growth in consumer spending was driven by a faster increase in borrowing than in income, leading to a record high Canadian household debt in FY1617. The debt of Canadian households as a proportion of income has been the highest in the G7 countries since the end of the FY0809 recession (see Chart 2).
Show Data Table
| Country | 2009 to 2010 | 2016 to 2017 |
|---|---|---|
| Canada | 154.9 | 168.6 |
| France | 97.2 | 104.1 |
| Germany | 92.3 | 85.4 |
| Italy* | 81.1 | |
| Japan** | 101.2 | 102.6 |
| United Kingdom | 154.6 | 143.2 |
| United States | 126.1 | 104.5 |
- * Data not available for Italy for 2009 to 2010.
- ** 2015/2016 data for Japan.
- Source: OECD, National accounts, Household dashboard, February 2018.
A high debt to income ratio may reduce the capacity of households to meet their debt obligations. The higher minimum debts payments relative to total disposable income (also known as the debt service obligations) the more impact economic shocks such as job losses and/or higher interest ratesFootnote 7 will have on households. In FY1617, the Canadian households’ debt service obligations increased to its highest level since the historical highs recorded prior and during the FY0809 recession. A 2016 report from the Office of the Parliamentary Budget Officer projects that this could increase further over the coming years.Footnote 8
1.2 The Canadian labour market in FY1617
Canada’s labour forceFootnote 9 increased by 0.8% (+156,900) to 19.6 million in FY1617, slightly below the rate recorded in the previous fiscal year (+1.0%). This primarily reflects the decline in the labour force in Alberta in the first quarter of the fiscal year due to the forest wildfires in the north of the province. Growth was concentrated in British Columbia (+2.7%) and Ontario (+0.8%) while most Atlantic provinces recorded a small decline, New Brunswick being the exception (+0.1%). Although labour force growth in FY1617 was slightly below the previous year, employment growth (+1.0%) surpassed the increase in FY1516 (+0.8%). Furthermore, the number of unemployed individuals declined in FY1617 (-1.4%).
In addition to the increase in the number of employed individuals, the number of job vacancies (unoccupied jobs for which employers are actively seeking workers) also went up in FY1617 (+1.4%) for a total of 391,900 vacant positions. Along with the greater number of job vacancies, the duration of job vacancies also rose slightly, suggesting that, in general, it took employers slightly more time to fill their vacant positions relative to the previous year.Footnote 10 Job vacancies usually become more difficult to fill when available labour force, primarily the number of unemployed individuals, declines relative to the number of vacant positions.
In FY1617, the important increase in the number of employed individuals combined with the decline in the number of unemployed relative to the year before, led to a small decrease (-0.1 percentage points) in the national unemployment rate to 6.9%. There are nevertheless some significant regional variations, as outlined in greater details in subsection 1.2.1 Changing Regional Labour Markets. This also somewhat contrasts with the small increase in the average unemployment spell duration (continuous periods of unemployment where an individual is looking for work) registered over the same period.
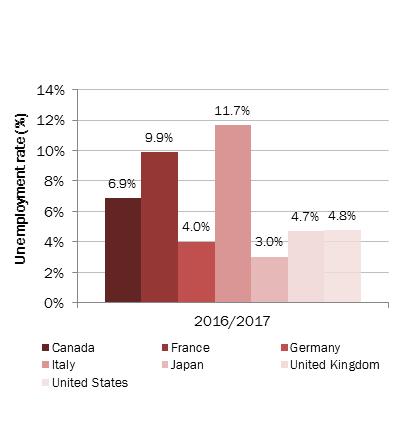
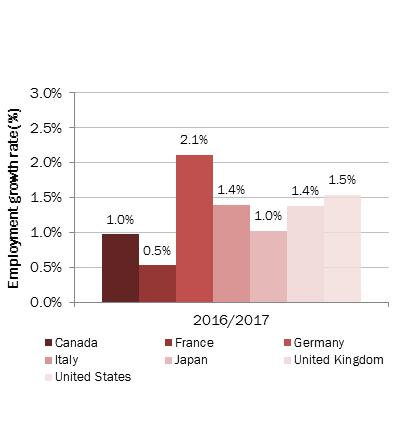
While Canada generally presented positive labour market developments in FY1617, these were modest when compared with other G7 countries. More specifically, Canada posted the third highest unemployment rate (see Chart 3A), the second smallest decline in the unemployment rate and the second lowest employment growth rate (see Chart 3B).Footnote 11
Show Data Table
| Country | 2016 to 2017 |
|---|---|
| Canada | 6.9% |
| France | 9.9% |
| Germany | 4.0% |
| Italy | 11.7% |
| Japan | 3.0% |
| United Kingdom | 4.7% |
| United States | 4.8% |
- Source: OECD, Labour force statistics, Short-term labour market statistics.
Show Data Table
| Country | 2016 to 2017 |
|---|---|
| Canada | 1.0% |
| France | 0.5% |
| Germany | 2.1% |
| Italy | 1.4% |
| Japan | 1.0% |
| United Kingdom | 1.4% |
| United States | 1.5% |
- Source: OECD, Labour force statistics, Short-term labour market statistics.
1.2.1 Changing regional labour markets
At the regional level, British Columbia presented one of the strongest year-over-year growth rates in employment and job vacancies and posted amongst the lowest unemployment rate in FY1617. Labour markets in Quebec and Ontario also presented positive developments while jurisdictions with economies more dependent on commodities (Alberta, Saskatchewan and Newfoundland and Labrador) fell back somewhat.
Labour force growth was concentrated in British Columbia (+2.7%), the only province to post an increase above the national average (+0.8%). It also was its most important growth rate since FY0203, notably reflecting the increased number of unemployed job seekers from Alberta looking for employment opportunities.Footnote 12 These were particularly important in British Columbia as both employment (+3.4%) and job vacancies (+10.4%) posted growth rates above the national averages (+1.0% and +1.4% respectively) in FY1617 (see Table 1). Employment and job vacancy growth rates were also above the national average in Quebec (+1.3% and +11.9% respectively) and Ontario (+1.1% and +8.2% respectively). Conversely, Newfoundland and Labrador, Prince Edward Island, Nova Scotia, Saskatchewan and Alberta all posted declines in both employment and job vacancies over the same period.
Moreover, in FY1617, for the first time since the Statistics Canada’s Labour Force Survey began collecting data on the Canadian labour market, British Columbia recorded the lowest unemployment rate (5.7%) among all provinces, down 0.6 percentage points from the previous year. The largest decline however was registered in Quebec (-0.9 percentage points) which also posted its lowest level (6.8%) on record. Conversely, low commodity prices continued to weigh on some regions, notably Alberta and Saskatchewan which presented the most important increases in the unemployment rate (+1.7 percentage points and +1.0 percentage point respectively), pushing up these to their highest level since the mid-1990s.
| Employment (thousands) |
Year-over-year change in employment (%) | Job vacancies (thousands) |
Year-over-year change in job vacancies (%) | Job vacancy rate (%) | |
|---|---|---|---|---|---|
| Newfoundland and Labrador | 231.3 | -1.5% | 3.6 | -22.9% | 1.7% |
| Prince Edward Island | 71.9 | -1.1% | 1.3 | -10.7% | 2.2% |
| Nova Scotia | 447.1 | -0.1% | 8.4 | -14.5% | 2.1% |
| New Brunswick | 352.8 | +0.7% | 6.5 | -10.5% | 2.2% |
| Quebec | 4,156.8 | +1.3% | 66.3 | +11.9% | 1.9% |
| Ontario | 7,024.5 | +1.1% | 168.5 | +8.2% | 2.8% |
| Manitoba | 635.2 | +0.1% | 11.2 | -8.8% | 1.9% |
| Saskatchewan | 569.0 | -0.8% | 9.0 | -24.2% | 1.9% |
| Alberta | 2,263.3 | -1.4% | 43.0 | -23.8% | 2.2% |
| British Columbia | 2,401.4 | +3.4% | 72.7 | +10.4% | 3.4% |
| Yukon | 20.7 | +6.8% | 0.6 | -13.1% | 3.2% |
| Northwest Territories | 22.3 | +0.6% | 0.6 | -32.3% | 2.5% |
| Nunavut | 13.5 | +5.9% | 0.3 | -21.0% | 2.7% |
| Canada | 18,209.9 | +1.0% | 391.9 | +1.4% | 2.5% |
- Note: Data may not add up to the total due to rounding. Percentage change is based on unrounded numbers.
- Sources: Statistics Canada, Labour Force Survey, CANSIM tables 282-0087 and 282-0100 (for data on employment) and Job Vacancy and Wage Survey, CANSIM table 285-0001 (for data on job vacancies).
As a result of contrasting regional labour market developments in FY1617, the average duration of unemployment spells varied significantly across provinces. While the decline in commodity prices continued to weigh on Alberta’s and Saskatchewan’s economies, reducing job opportunities and increasing unemployment, it also significantly increased the average unemployment spell duration in those regions. The average unemployment spell duration in Alberta reached its highest level on record (21.9 weeks) and was, for the first time in FY1617, the highest across Canada (which posted an average duration of 20.3 weeks), as shown in Table 2.Footnote 13 Saskatchewan also registered a significant increase (+4.6 weeks) and posted its highest duration (17.8 weeks) since the early 2000s. Unemployment duration was little changed in other regions.
Changes in average nominal weekly earnings were also uneven across provinces, as Alberta and the Northwest Territories were the only two regions recording a decrease. However, when compared with the increase in the cost of living—as approximated by the Consumer Price Index, or CPI—only Prince Edward Island, Quebec and Saskatchewan recorded a greater increase in weekly earnings relative to the increase in the CPI, leading to a decline in the purchasing power of Canadian workers on average in FY1617 (see Table 3).Footnote 14
| Unemployment rate | Unemployment spell duration (weeks) | |||||
|---|---|---|---|---|---|---|
| 2015 to 2016 | 2016 to 2017 | Change (in ppts) | 2015 to 2016 | 2016 to 2017 | Change | |
| Newfoundland and Labrador | 13.3% |
13.7% |
+0.4 |
17.6 |
17.9 |
+0.3 |
| Prince Edward Island | 10.5% |
10.6% |
+0.1 |
15.6 |
14.0 |
-1.6 |
| Nova Scotia | 8.6% |
8.1% |
-0.5 |
19.0 |
18.3 |
-0.7 |
| New Brunswick | 9.8% |
9.2% |
-0.6 |
18.5 |
19.5 |
+1.0 |
| Quebec | 7.7% |
6.8% |
-0.9 |
23.5 |
21.8 |
-1.7 |
| Ontario | 6.7% |
6.4% |
-0.3 |
20.0 |
20.2 |
+0.2 |
| Manitoba | 5.8% |
6.1% |
+0.3 |
17.0 |
18.0 |
+1.0 |
| Saskatchewan | 5.4% |
6.4% |
+1.0 |
13.2 |
17.8 |
+4.6 |
| Alberta | 6.6% |
8.3% |
+1.7 |
15.5 |
21.9 |
+6.4 |
| British Columbia | 6.3% |
5.7% |
-0.6 |
18.9 |
18.4 |
-0.5 |
| Yukon | 6.2% |
5.3% |
-0.9 |
n/a |
n/a |
n/a |
| Northwest Territories | 8.3% |
7.1% |
-1.2 |
n/a |
n/a |
n/a |
| Nunavut | 17.2% |
14.3% |
-2.9 |
n/a |
n/a |
n/a |
| Canada | 7.0% |
6.9% |
-0.1 |
19.8 |
20.3 |
+0.5 |
- Sources: Statistics Canada, Labour Force Survey, CANSIM tables 282-0087, 282-0100 and 282-0047.
| Average nominal weekly earnings ($)* | Year-over-year change in nominal weekly earnings (%) | Year-over-year change in consumer price index (%) | |
|---|---|---|---|
| Newfoundland and Labrador | 1,024 | +0.4% | +3.4% |
| Prince Edward Island | 822 | +1.9% | +1.4% |
| Nova Scotia | 848 | +0.8% | +1.3% |
| New Brunswick | 877 | +2.0% | +2.5% |
| Quebec | 882 | +1.0% | +0.6% |
| Ontario | 978 | +1.3% | +2.0% |
| Manitoba | 894 | +1.2% | +1.4% |
| Saskatchewan | 994 | +1.3% | +1.0% |
| Alberta | 1,116 | -1.7% | +1.1% |
| British Columbia | 924 | +1.5% | +2.0% |
| Yukon | 1,062 | +0.7% | +1.3% |
| Northwest Territories | 1,395 | -2.1% | +1.2% |
| Nunavut | 1,285 | +1.9% | +2.4% |
| Canada | 960 | +0.7% | +1.5% |
- * Earnings include overtime and apply to employees paid by the hour, salaried employees and other employees.
- Sources: Statistics Canada, Survey of Employment, Payrolls and Hours, CANSIM table 281-0026 (for data on nominal earnings), and Statistics Canada, Consumer Price Index Measures, CANSIM table 326-0020 (for data on CPI).
1.2.2 Labour mobility trends reverse as commodity prices fall
Every year, a substantial number of people in Canada (286,900 in between July 1, 2016 and June 30, 2017) relocate across provincial and territorial borders. The majority (154,800) of this group is aged between 25 and 54 years old. This movement across provinces is partly attributable to individuals in search of job opportunities and provides workers with the chance to access other labour markets and obtain a job or find one that may be better suited for their skillset. From a national perspective, interprovincial mobility can increase growth related to aggregate labour productivity and real GDP and improve individual outcomes as workers from provinces with high unemployment and an excess of labour supply move to provinces with lower unemployment and labour shortages.
While several factors can influence an individual’s decision to move (including, but not limited to, job opportunities, education/school or family reasons) the desire to seek a higher standard of living is often a driving force. Since the mid-1990s, Western Canada, especially Alberta, was the destination of choice for a majority of Canadian interprovincial migrants. However, with persisting low commodity prices and less favorable labour markets in Alberta, trends have somewhat shifted over recent years to British Columbia and Ontario (see Chart 4).
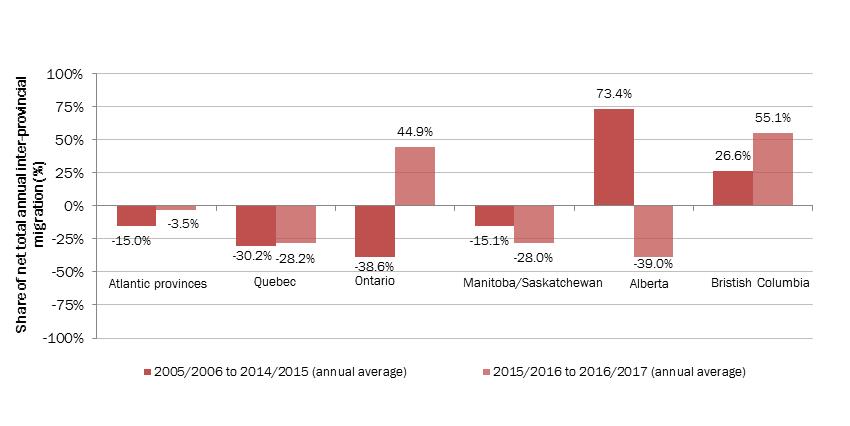
Show Data Table
| Region | 2005 to 2006 to 2014 to 2015 (annual average) | 2015 to 2016 to 2016 to 2017 (annual average) |
|---|---|---|
| Atlantic provinces | -15.0% | -3.5% |
| Quebec | -30.2% | -28.2% |
| Ontario | -38.6% | 44.9% |
| Manitoba/Saskatchewan | -15.1% | -28.0% |
| Alberta | 73.4% | -39.0% |
| Bristish Columbia | 26.6% | 55.1% |
- Source: Statistics Canada, Cansim table 051-0012.
Labour market developments in British Columbia have made the province the preferred destination of interprovincial migrants since FY1516 (+21,400 on average per year). Ontario has also been posting positive inflows of migrants since then (+17,400 per year). The outflow from the Atlantic provinces is significantly lower (-1,300 per year since FY1516 compared with -6,200, on average, in the previous two years).
In addition to interprovincial migration, some workers may also commute regularly — commuting daily or fly-in, fly-out—between their province of residence and another one for work. A Statistics Canada studyFootnote 15 on interprovincial employment in Canada found that an estimated 420,000 (3% of the paid Canadian workforce) individuals were classified as interprovincial employees in 2011. The results of this study indicated that smaller provinces (that is, Atlantic Canada) had a larger percentage of their paid workforce participating in interprovincial employment.Footnote 16 In 2011, roughly 10% of the paid workforce in Newfoundland and Labrador were interprovincial employees compared to less than 2% in Ontario.
The important out-migration flows recorded by Atlantic provinces over the last decades combined with their high levels of interprovincial employees have further exacerbated the limited pool of available workers in those provinces. Interprovincial employment has proven to be a significant source of earnings for a large share of the population in Newfoundland and Labrador (about 9% of total wages and salaries in 2011), Prince Edward Island (6 %), Nova Scotia (5%) and New Brunswick (5%). At the same time however, interprovincial employment has also made these provinces slightly more at risk to feel the effects of economic shocks originating in other parts of the country as these may have corresponding impacts on local labour markets and the use of Employment Insurance (which is based on residence) as a result.
1.3 Long-term trends in the Canadian labour market
Along with the changes observed in FY1617, the Canadian labour market is characterised by long-term trends reshaping the labour force. Labour supply have been through significant changes reflecting the impact of population ageing, public policies and the demand for high-skilled workers or workers with a university degree. Job composition has also changed, as a greater share of jobs now require postsecondary education and are found in the services-producing industries. These changes had repercussions on the unemployed population which is also composed, on average, of a greater share of postsecondary graduates and individuals with no recent work experience.
1.3.1 Evolving Canadian labour force
As in most developed countries, Canada’s population has experienced a sizeable increase in the median age, going from 26.2 years in 1971 to 40.6 years in 2017.Footnote 17 Population ageing, notably driven by lower fertility rates and longer life expectancies, can be expected to affect the economy profoundly, both in the demand for goods and services and in the supply of labour.
Participation in the labour force largely corresponds to key life events and therefore, age. In general, individuals aged between 15 and 19 years old are primarily pursuing their studies and are not as active in the labour force. As this group gets older, a declining share focuses on their study and a greater one become more active labour market participants. Following the core working years, between 25 and 54 years old, individuals will tend to exit the labour force in greater numbers as they begin to retire. As a result, changes in the distribution of the workforce across different age groups such as the increase in the share of the workforce aged 55 years old and over observed in recent years, may affect aggregate labour supply.
In addition to fluctuations in the age composition of the labour force, changes in labour force participation rates—share of individuals of a given socio-economic group participating in the labour market—over time also affects aggregate labour supply. In particular, public policies and educational attainment are key factors which likely play a role. For instance, researchers noted that more affordable public day cares, such as those implemented in Quebec in 1997, have contributed to increase women’s employment. This increase aligns with a more general trend observed for Canada as a whole as labour market participation of women increased by 15.4% since FY7677 and more markedly (+29.7%) among those aged 25 to 54 years old. Nevertheless, the participation rate of women remained below the labour market participation rate for men (by about nine percentage points) in FY1617.
Over the years, public policies, financial factors and imbalances between labour supply and labour demand, among other factors, may also have contributed to the shifts observed in labour market participation of workers nearing retirement age. More or less generous retirement pensions as well as performing or underperforming stock markets likely affected retirement income and may have either moved forward or pushed back the decision to retire.
For instance, since its implementation in the 1960s, the Canada Pension Plan (CPP) underwent various reforms, some of which coincided with changes in available labour demand and labour supply. Chart 5 shows that changes in CPP in the late 1980s, a period associated with high unemployment rates, were combined with a declining trend in the average retirement age.
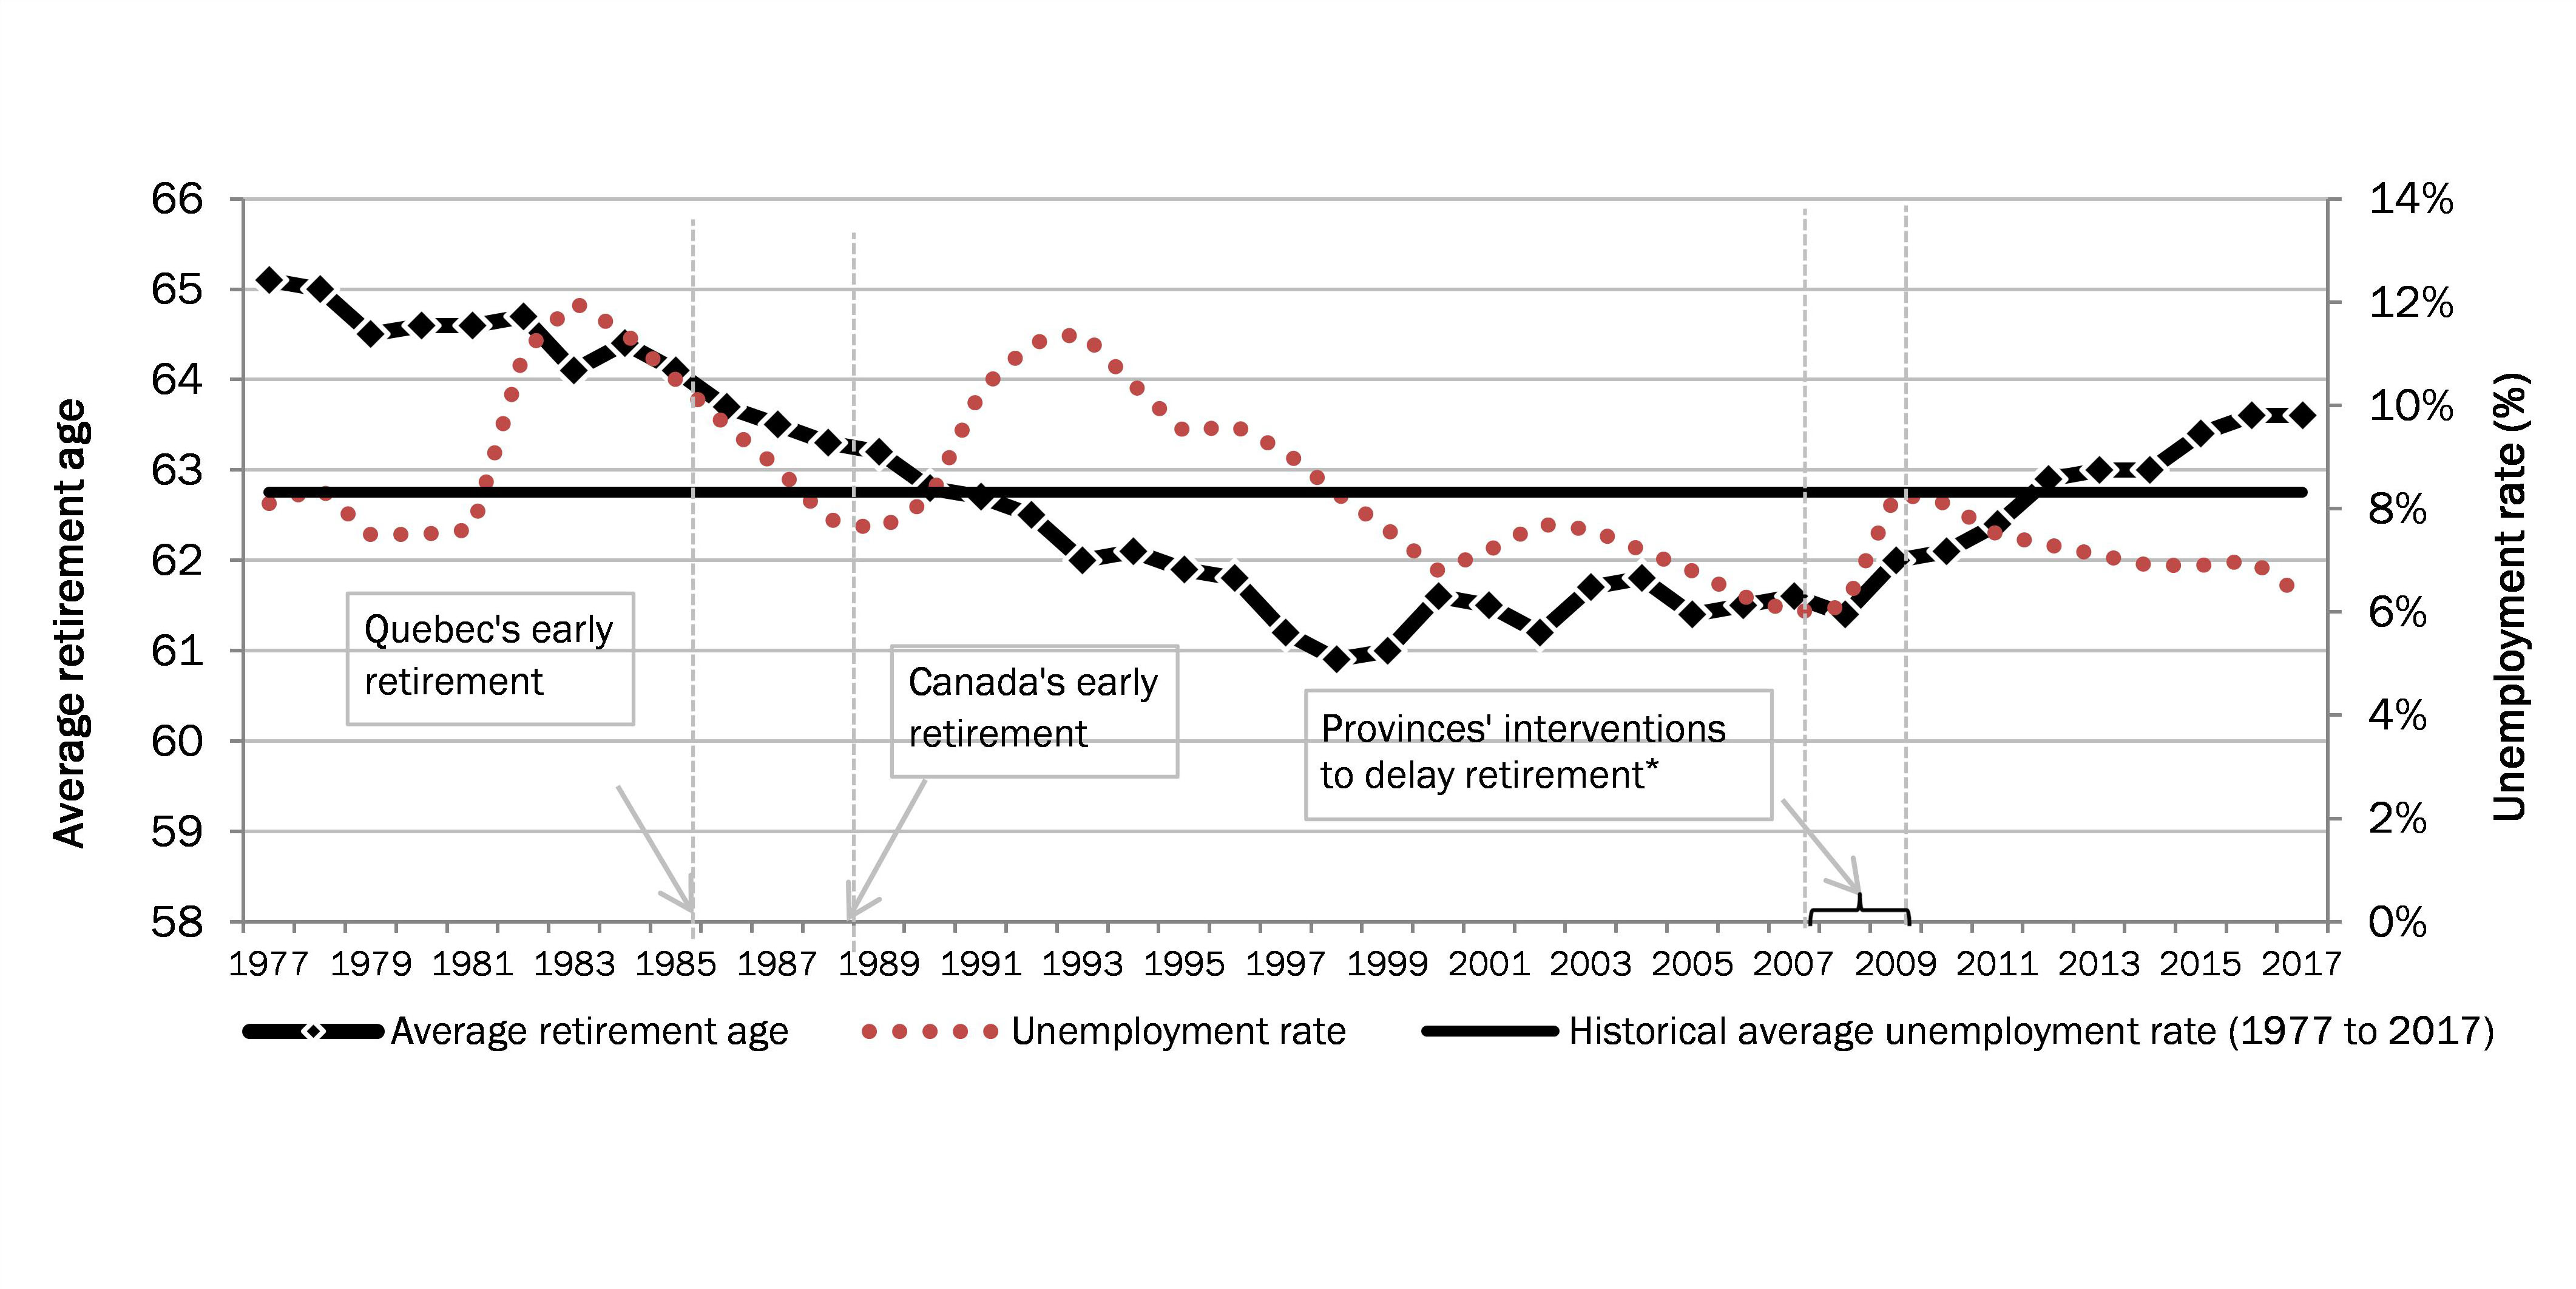
Show Data Table
| Year | Average retirement age | Historical average unemployment rate (1977 to 2017) | Unemployment rate |
|---|---|---|---|
| 1977 | 65.1 | 8.3% | 8.1% |
| 1978 | 65 | 8.3% | 8.4% |
| 1979 | 64.5 | 8.3% | 7.5% |
| 1980 | 64.6 | 8.3% | 7.5% |
| 1981 | 64.6 | 8.3% | 7.6% |
| 1982 | 64.7 | 8.3% | 11% |
| 1983 | 64.1 | 8.3% | 12% |
| 1984 | 64.4 | 8.3% | 11.4% |
| 1985 | 64.1 | 8.3% | 10.5% |
| 1986 | 63.7 | 8.3% | 9.6% |
| 1987 | 63.5 | 8.3% | 8.8% |
| 1988 | 63.3 | 8.3% | 7.8% |
| 1989 | 63.2 | 8.3% | 7.6% |
| 1990 | 62.8 | 8.3% | 8.2% |
| 1991 | 62.7 | 8.3% | 10.3% |
| 1992 | 62.5 | 8.3% | 11.2% |
| 1993 | 62 | 8.3% | 11.4% |
| 1994 | 62.1 | 8.3% | 10.4% |
| 1995 | 61.9 | 8.3% | 9.5% |
| 1996 | 61.8 | 8.3% | 9.6% |
| 1997 | 61.2 | 8.3% | 9.1% |
| 1998 | 60.9 | 8.3% | 8.3% |
| 1999 | 61 | 8.3% | 7.6% |
| 2000 | 61.6 | 8.3% | 6.8% |
| 2001 | 61.5 | 8.3% | 7.2% |
| 2002 | 61.2 | 8.3% | 7.7% |
| 2003 | 61.7 | 8.3% | 7.6% |
| 2004 | 61.8 | 8.3% | 7.2% |
| 2005 | 61.4 | 8.3% | 6.8% |
| 2006 | 61.5 | 8.3% | 6.3% |
| 2007 | 61.6 | 8.3% | 6% |
| 2008 | 61.4 | 8.3% | 6.1% |
| 2009 | 62 | 8.3% | 8.3% |
| 2010 | 62.1 | 8.3% | 8.1% |
| 2011 | 62.4 | 8.3% | 7.5% |
| 2012 | 62.9 | 8.3% | 7.3% |
| 2013 | 63 | 8.3% | 7.1% |
| 2014 | 63 | 8.3% | 6.9% |
| 2015 | 63.4 | 8.3% | 6.9% |
| 2016 | 63.6 | 8.3% | 7% |
| 2017 | 63.6 | 8.3% | 6.9% |
- * During the mid-2000s’, four provinces modified their regulations to eliminate employers mandatory retirement policies in their provinces. Changes took place in December 2006 for Ontario, May 2007 for Newfoundland and Labrador, in November 2007 for Saskatchewan and January 2008 for British Columbia.
- Sources: Statistics Canada, Labour Force Survey, CANSIM tables 282-0051 and 282-0087.
As the Canadian labour market entered a period o0f low and declining unemployment rate in the 2000s, changes in some provinces’ labour law were made so that workers nearing retirement could remain active in the labour market. This coincides with an upward trend observed in the average retirement age. Public policies have thus been associated with key changes in labour market conditions—high or low labour demand relative to available labour supply—over time.
Going forward, an increase in the labour market participation rate of socio-economic groups with low participation rates could help subdue the negative impacts of population aging on the Canadian economy. For instance, in addition to the lower participation rate of women relative to the one for men discussed previously, the economy could also benefit from an increase in the participation rates of Aboriginal people and individuals aged 25 and over with no post-secondary degree or diplomaFootnote 18.
In addition to changes in demographics and public policies, shifts in labour demand also influence labour supply. The increase in the demand for skilled labour over the years has contributed to higher postsecondary enrollment rates which also affected aggregate labour supply in two ways. First, the participation rate of youth (people aged 15 to 24 years old) has declined relative to the 1980s (see Chart 6) partly reflecting the fact that a greater share of this population has remained enrolled full-time in school and are thus less likely to be actively participating in the labour market. Second, because individuals holding a post-secondary education degree are more likely to be actively participating in the labour market upon graduation, the participation rate increased significantly among all other age groups over the same period.
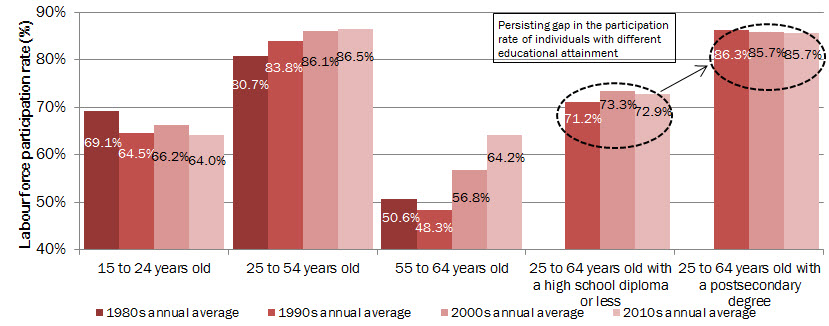
Show Data Table
| Period | 15 to 24 years old | 25 to 54 years old | 55 to 64 years old | 25 to 64 years old with a high school diploma or less | 25 to 64 years old with a postsecondary degree |
|---|---|---|---|---|---|
| 1980s annual average | 69.1% | 80.7% | 50.6% | ||
| 1990s annual average | 64.5% | 83.8% | 48.3% | 71.2% | 86.3% |
| 2000s annual average | 66.2% | 86.1% | 56.8% | 73.3% | 85.7% |
| 2010s annual average | 64.0% | 86.5% | 64.2% | 72.9% | 85.7% |
- Source: Statistics Canada, Labour Force Survey, CANSIM table 282-0087.
The relative importance of high-skilled jobs as well as college and universities in larger cities, have also likely contributed to the rural out-migration trend, especially of young Canadians, observed since 1991.Footnote 19 The concentration of the Canadian population within urban centers was the second highest (57.2%) among all G7 countries—second only to Japan— in 2014 according to the Organization for Economic Co-operation and Development (OECD).Footnote 20 The increasing reliance on technology and in the associated demand for high-skilled workers, which have been more important in urban centers, along with the difficulties faced by the Canadian manufacturing industry since the early 2000s, among other things, also contributed to recent rural out-migration flows. The growing concentration of individuals, especially high-skilled individuals, in urban regions results in very distinct regional labour markets.
In addition to the concentration of high-skilled people in urban areas, there are growing regional differences in the age structure of the labour force. Between 2011 and 2017, the share of the labour force aged between 15 and 24 years old declined more rapidly in rural areasFootnote 21 (-1.7 percentage points) than in urban centersFootnote 22 (-1.3 percentage points) and the share of the labour force aged 55 and over increased much more rapidly (+5.3 percentage points) than in urban centres (+3.2 percentage points).Footnote 23
Regional differences in the age of the labour force are also observed across provinces. As shown in Table 4, all provinces have experienced in the past 20 years a decline in the share of their labour force that is between 15 and 24 and an increase in the share of the labour force that is aged 55 and over. The changes were more marked in the Atlantic provinces. With these demographic changes, regional labour markets are not facing the same challenges going forward, notably with regards to economic development and job opportunities.
| Share of labour force aged between 15 and 24 years old | Share of the labour force aged 55 and over | |||||
|---|---|---|---|---|---|---|
| 1997 | 2017 | Change (in ppts) | 1997 | 2017 | Change (in ppts) | |
| Newfoundland and Labrador | 15.3% | 12.9% | -2.4 | 6.9% | 21.5% | +14.6 |
| Prince Edward Island | 18.5% | 14.8% | -3.7 | 10.0% | 24.5% | +14.5 |
| Nova Scotia | 16.9% | 14.1% | -2.8 | 8.3% | 23.3% | +15.0 |
| New Brunswick | 16.8% | 13.3% | -3.6 | 8.2% | 23.9% | +15.7 |
| Quebec | 15.1% | 13.6% | -1.5 | 8.9% | 20.5% | +11.6 |
| Ontario | 15.9% | 14.3% | -1.6 | 9.8% | 21.1% | +11.3 |
| Manitoba | 18.3% | 16.0% | -2.3 | 9.9% | 20.4% | +10.5 |
| Saskatchewan | 18.7% | 14.4% | -4.3 | 12.4% | 22.0% | +9.7 |
| Alberta | 17.6% | 13.6% | -3.9 | 9.5% | 19.3% | +9.8 |
| British Columbia | 15.7% | 14.9% | -0.8 | 9.8% | 21.8% | +12.0 |
| Canada | 16.1% | 14.1% | -1.9 | 9.5% | 21.0% | +11.4 |
- Note: Change in percentage points is based on unrounded numbers.
- Source: Statistics Canada, Labour Force Survey, CANSIM table 282-0087.
As a result of changes in the composition of the labour force, in its participation intensity and of economic cycles, labour force participation rate in Canada declined from a peak of 67.5% in FY0809, to 65.7% in FY1617. It is expected to continue to decline further as more workers from the baby boomer generation reach retirement age. However, when compared with other G7 countries, Canada still posted the highest participation rate among the population aged 15 and over in 2016.Footnote 24 It is expected that Canada will be able to manage the effects of its ageing population over the coming decades better than some other G7 countries, with the help of higher fertility rates and immigration.Footnote 25 Immigrants represent a growing share of total labour force in Canada, composing 24.2% of the Canadian labour force in FY1617, up 3.8 percentage points over FY0607.Footnote 26
1.3.2 Changing nature of jobs
Since the mid-20th century, two important trends have been prevalent in advanced economies. These are the greater reliance on the use and production of knowledge as an economic driver, which relies more heavily on high-skilled workers, as well as the growing share of employment in services-producing industries. The changes have also been accompanied by an increase in wage inequality over time and the emergence of sources of income non-associated with traditional labour market activities.
Technological advancements have led to the automation of certain tasks that were performed by manual workers in the past. An increasing number of tasks performed by workers are being automated every year, further changing the need and the demand for skills. Employment growth in the Professional, scientific and technical services industry primarily composed of knowledge-based industries was the fastest (+4.3% annually) in Canada over the last four decades. It grew almost three times faster than the national average (+1.6%). This above-average employment growth in knowledge-based industries reflects the greater reliance in the economy on computers and on information and communication technologies, which require high-skilled workers.
These changes led to an increased demand for high-skilled workers or workers with higher educational attainment.Footnote 27 The number of jobs usually requiring a university degree went up by 2.0 million (or +123.0%) between FY8788 and FY1617 compared with an increase of 1.2 million (or +22.2%) for jobs generally requiring either a high school diploma or on-the-job training. Over that period, the share of jobs usually requiring a university went up by about 7.0 percentage points, accounting for 20.1% of all jobs in FY1617 (see Chart 7).

Show Data Table
| Year | Share of high-skilled employment | Share of middle-skilled employment | Share of low-skilled employment |
|---|---|---|---|
| 1987 to 1988 | 13.1% | 64.7% | 11.2% |
| 2000 to 2001 | 16.2% | 61.8% | 10.9% |
| 2016 to 2017 | 20.1% | 60.2% | 10.8% |
- Note: High-skilled jobs correspond to those usually requiring a university degree; middle-skilled jobs correspond to those usually requiring a college or high-school degree or apprenticeship trainining while low-skilled jobs are those usually requiring on-the-job training. Occupations associated with management, usually considered as high-skilled occupations are excluded because no specific educational level is required for those jobs.
- Source: Statistics Canada, Labour Force Survey, Cansim table 282-0141.
Between FY8788 and FY1617, the share of jobs usually requiring a college degree, an apprenticeship training or a high school diploma (mostly representing middle-skilled jobs) declined by 4.5 percentage points while the employment share of jobs associated with on-the-job training (mostly low-skilled jobs) remained relatively unchanged. As noted in the OECD’s 2017 Employment Outlook, employment polarization at the high- and low-ends of the skill distribution, which is partly attributable to technological advancements, has also been observed in the United States and in many European countries.
In addition to the employment polarization, there is some evidence that employees’ wages increased more at the high-end of the wage distribution over the last four decades, thus increasing wage inequality in Canada. The shift toward higher-skilled jobs and increased wage inequality can be depicted using changes in average and median wages. As shown in Table 5 employees associated with the highest median hourly earnings in FY9798 generally recorded the fastest average increases in hourly wages between FY9798 and FY1617.
Shifts in the composition of employment can have subtle effects related to Employment Insurance (EI). For instance, while the growing demand for high-skilled workers created many well-paying job opportunities for individuals, these are very specialized. As a result, it might be difficult for laid-off high-skilled workers to find a new job matching their specific skills and knowledge. Moreover, on average in FY1617, high-skilled vacant positions (or positions for which a university degree was the minimum level of education sought) accounted for 15.6% of all job vacancies while during the same period high-skilled jobs accounted for 20.1% of all jobs.Footnote 28
When combined with the 55% earnings replacement rate of the EI program, the declining share of middle-skilled jobs and rising earnings inequalities also have implications for the unemployed. For instance, while EI benefits may allow laid-off high-skilled workers to search for longer periods of time in order to find a suitable job, the 55% earnings replacement rate applied to the EI Maximum Insurable Earnings (MIE)—$51,700 in 2018 sets a limit to the EI benefits high-skilled (and likely high-income) unemployed workers are eligible to receive.
Similarly, the fixed EI earnings replacement rate of 55% when applied to low-income, and frequently low-skilled EI claimants results in lower levels of benefits being paid. While the EI program provides a family supplement to low-income families, the earnings amounts used to determine eligibility to this supplement have not changed since 2000. As a result, every year, a declining share of EI claimants qualifies for the family supplement.
| 1997 to 1998 | 2016 to 2017 | Change between 1997 to 1998 and 2016 to 2017 | ||||
|---|---|---|---|---|---|---|
| Share of high-skilled employees | Median hourly wage ($) | Share of high-skilled employees | Median hourly wage ($) | Share of high-skilled employees (in ppts) | Median hourly wage ($) | |
| Management occupations | 100.0% | $19.4 | 100.0% | $40.1 | n/a | +$20.7 |
| Business, finance and administration occupations | 14.9% | $14.3 | 22.1% | $23.5 | +7.2 | +$9.2 |
| Natural and applied sciences and related occupations | 52.2% | $20.1 | 55.5% | $34.0 | +3.3 | +$14.0 |
| Health-related occupations | 46.6% | $17.9 | 43.7% | $27.1 | -2.9 | +$9.2 |
| Occupations in education, law and social, community and government services | 62.9% | $19.5 | 61.1% | $29.7 | -1.8 | +$10.2 |
| Occupations in art, culture, recreation and sport | 33.7% | $13.6 | 24.3% | $20.1 | -9.4 | +$6.5 |
| Sales and service occupations | 0.0% | $8.7 | 0.0% | $13.9 | n/a | +$5.3 |
| Trades, transport and equipment operators and related occupations | 0.0% | $15.4 | 0.0% | $24.1 | n/a | +$8.8 |
| Natural resources, agriculture and related production occupations | 0.0% | $11.6 | 0.0% | $19.7 | n/a | +$8.1 |
| Occupations in manufacturing and utilities | 0.0% | $13.1 | 0.0% | $19.7 | n/a | +$6.7 |
| Canada | 15.5% | $14.1 | 19.3% | $22.3 | +3.8 | +$8.2 |
- Note: High-skilled employees are associated with jobs usually requiring a university degree or management occupations. Changes in percentage points or percentage ares based on unrounded numbers. Excludes self-employed individuals.
- Source: Statistics Canada, Labour Force Survey, CANSIM table 282-0051.
Another emerging trend attributable to the increased reliance on technology is the growing importance of less conventional sources of earnings, either as a main source of earnings or as a supplement to wages. For instance, from November 2015 to October 2016, an estimated 2.7 million (9.5%) Canadians were involved in economic activities related to the peer-to-peer sale, rental or exchange of goods or servicesFootnote 29, a significant portion of which was facilitated by the Internet. These types of activities are expected to keep growing over the coming years and may further disrupt the current economic structure. It should also be noted that income earned from those activities are often not considered as insurable earnings for the purpose of the EI program.
In addition to the increasing importance of knowledge, altogether the service-producing industries have been outperforming the goods-producing ones over the last four decades. While the employment level of goods-producing industries has slightly increased (+0.3% annually) over the last 40 years, it more than doubled in the service-producing industries (+2.0% annually) from 6.4 million in FY7677 to 14.3 million in FY1617. In FY1617, services made up 78.9% of Canadian employment, compared with 65.5% four decades earlier.
The slower pace of growth in the goods-producing industries over that period, in particular in the last decade, is partly attributable to the decreasing importance of the manufacturing industry in the Canadian economy (see Chart 8). This reflects a long-term declining trend in manufacturing industry employment which is common to all advanced economies. This trend is connected to technological improvements, a greater reliance on capital equipment to produce goods and increased trade between developed and developing countries that can produce labour-intensive products at a lower cost relative to Canada.
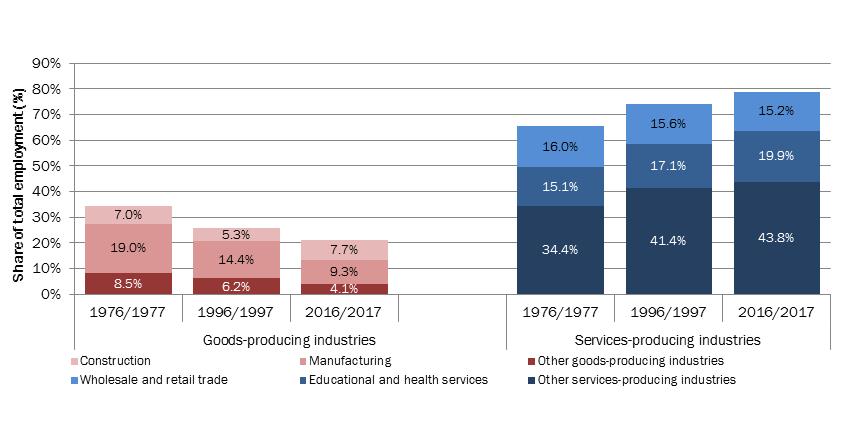
Show Data Table
| Industry | 1976 to 1977 | 1996 to 1997 | 2016 to 2017 | |
|---|---|---|---|---|
| Goods-producing industries | Construction | 7.0% | 5.3% | 7.7% |
| Manufacturing | 19.0% | 14.4% | 9.3% | |
| Other goods industries | 8.5% | 6.2% | 4.1% | |
| Service-producing industries | Wholesale and retail trade | 16.0% | 15.6% | 15.2% |
| Educational and health services | 15.1% | 17.1% | 19.9% | |
| Other services industries | 34.4% | 41.4% | 43.8% |
- Source: Statistics Canada, Labour Force Survey, Cansim table 282-0007.
The greater importance of employment in the service-producing industries also has implications for the EI program. As workers in services-producing industries work, on average, fewer hours each week when compared with workers from goods-producing industries (see Table 6) they may have more difficulties qualifying for EI benefits. In addition, the median hourly wage for the services-producing industries ($21.60 in FY1617) is lower than that of the goods-producing industries ($24.90 in FY1617). This leads to lower weekly benefit rates when an EI claim is established and proportionally lesser total benefits paid to workers from services-producing industries on average.Footnote 30, Footnote 31
| 1986/1987 | 1996/1997 | 2006/2007 | 2016/2017 | |
|---|---|---|---|---|
| Goods-producing industries | 37.4 | 38.3 | 37.7 | 37.4 |
| Agriculture | 36.5 | 42.7 | 42.9 | 41.3 |
| Forestry, fishing, mining, quarrying, oil and gas | 37.9 | 39.4 | 40.9 | 39.9 |
| Utilities | 36.3 | 35.5 | 34.9 | 35.3 |
| Construction | 35.9 | 37.0 | 36.8 | 36.8 |
| Manufacturing | 38.0 | 37.7 | 36.9 | 36.9 |
| Service-producing industries | 33.5 | 32.7 | 31.7 | 31.3 |
| Wholesale trade and retail trade | 33.5 | 32.9 | 31.5 | 31.4 |
| Transportation and warehousing | 37.7 | 37.5 | 37.3 | 36.3 |
| Finance, insurance, real estate, rental and leasing | 36.3 | 34.5 | 33.3 | 33.6 |
| Professional, scientific and technical services | 38.5 | 36.7 | 34.9 | 34.1 |
| Business, building and other support services | 31.3 | 32.0 | 31.6 | 31.3 |
| Educational services | 31.1 | 29.5 | 28.0 | 27.8 |
| Health care and social assistance | 30.8 | 29.9 | 29.8 | 29.6 |
| Information, culture and recreation | 33.3 | 32.4 | 30.5 | 30.0 |
| Accommodation and food services | 30.9 | 30.2 | 29.0 | 27.9 |
| Other services (except public administration) | 33.4 | 34.0 | 32.6 | 31.9 |
| Public administration | 34.5 | 33.6 | 32.7 | 32.3 |
| Canada | 34.6 | 34.2 | 33.1 | 32.6 |
- Source: Statistics Canada, Labour Force Survey, CANSIM table 282-0021.
1.3.3 Shifting composition of the unemployed population
Changes in the labour supply and labour demand over the last 40 years have resulted in new employment and unemployment dynamics. While the employed population is now on average older, more educated and employed in urban areas, the age, average educational attainment and work experience of the unemployed population have also evolved over time.
Similar to trends observed in the employed population, the composition of the unemployed Canadian population by educational attainment has changed significantly between FY9091 and FY1617. While 32.0% of all unemployed Canadians aged 25 years old and over held a postsecondary degree in FY9091, this proportion almost doubled in FY1617 reaching 61.2%. However, despite representing a much greater proportion of all unemployed, postsecondary graduates aged 25 years old and over still presented a lower unemployment rate in FY1617 (5.5% and 4.6% respectively for non-university postsecondary graduates and university graduates) when compared with high school graduates (6.8%) or those that have not graduated high school (10.1%). Yet, even though university graduates present the lowest unemployment rate, they are the only group for which the unemployment rate has not declined relative to the 1990s (see Chart 9).
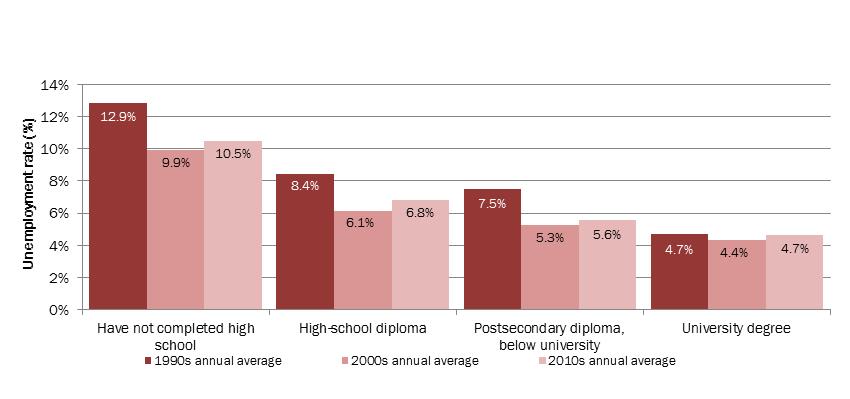
Show Data Table
| Period | Have not completed high school | High-school diploma | Postsecondary diploma, below university | University degree |
|---|---|---|---|---|
| 1990s annual average | 12.9% | 8.4% | 7.5% | 4.7% |
| 2000s annual average | 9.9% | 6.1% | 5.3% | 4.4% |
| 2010s annual average | 10.5% | 6.8% | 5.6% | 4.7% |
- Source: Statistics Canada, Labour Force Survey, Cansim table 282-0003.
The stagnant employment prospects of university graduates are partly attributable to the specialized nature of their skills and knowledge which are not always easily transferable to jobs outside their field of study. Recent analysis has shown that employment prospects of Canadian bachelor degree holders aged between 25 and 34 years old varied significantly by field of study. Men graduates in Mathematics, computers and information sciences (86.0%) and Engineering (87.2%) were associated with the greatest probability of securing full-time employment in 2010, although these were lower relative to the probabilities reported in 2005 (90.2% and 89.6% respectively). Footnote 32
Moreover, while the employment prospects of university graduates remain well above those of less-educated groups, they are more likely to be underemployed—being employed in a job which is unfit for their skills.Footnote 33 While these individuals are not unemployed, most of them are still searching for a suitable full-time job. It is estimated that in 2015, 39% of recent university graduates aged 25 to 34 years old had educational credentials above those required by their job, an increase relative to the 32% reported in 1991.Footnote 34
Difficulties in securing employment are not limited to recent postsecondary graduates. In general, young Canadians (aged 15 to 24 years old) have greater difficulties finding a job relative to older individuals (especially those aged between 25 and 54 years old). Their unemployment rate (13.0% in FY1617) has historically been well above the average for individuals aged 25 years old and over (5.8% in FY1617).Footnote 35 The inherent lack of work experience and/or educational attainment may explain why the issue is more important amongst those aged 15 to 19 years old as well as those aged 20 to 24 years old and no longer attending school.Footnote 36 This in turn makes them particularly vulnerable to economic shocks. In light of these trends, a recent OECD report suggested that tackling youth unemployment and the rising number of young people out of work and out of school should be a priority for Canada.Footnote 37, Footnote 38
While a lack of work experience among young Canadians likely hinders their employment prospects, an increasing share of unemployed Canadians overall also lacks recent work experience.Footnote 39 Over the FY0809 to FY1617 period, the share of unemployed Canadians without recent work experience increased from 29.0% to 38.3% (+9.3 percentage points). Individuals aged 15 to 24 years old recorded the largest share (44.8%) and increase (+14.5 percentage points)—see Chart 10.
Part of the increase in the share of unemployed without recent work experience is attributable to long-term unemployment—individuals that have been searching for a job for a period of at least twelve consecutive months. The evolution of this group over time sheds additional light on difficulties Canadians are facing in finding a job. While Canada’s long-term unemployment rate remained the lowest among G7 countries,Footnote 40 the 12.1% rate reported in FY1617Footnote 41 was still well above the rate recorded at the onset of the latest recession (7.1% in FY0809). Prolonged periods of unemployment may negatively affect one’s odds of finding employment as well as future employment earnings reflecting, among other things, skill and knowledge losses during long unemployment spell.
In addition, the increased proportion of unemployed with no recent work experience may have an impact on perceptions of access and coverage of EI for the unemployed. Eligibility for EI regular benefits is based on the amount of hours of insurable employment that an individual has accumulated in the previous 52 weeks. Indicators used to estimate the coverage and access to EI benefits, such as the ratio of EI regular beneficiaries to the number of unemployed, are based on all unemployed (thus including those that have no recent work experience) and are impacted by this trend. As a result, metrics based on EI premium contributors, therefore participants in the EI program, seems to be more appropriate methods of measuring coverage and access.
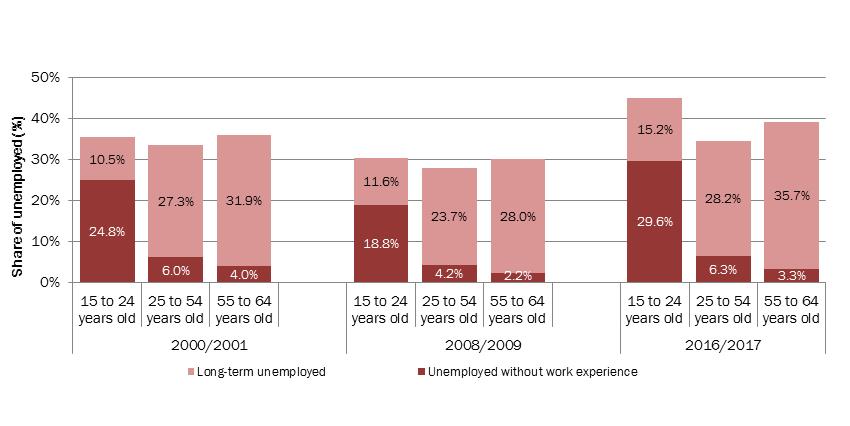
Show Data Table
| 2000/2001 | 2008/2009 | 2016/2017 | |||||||
|---|---|---|---|---|---|---|---|---|---|
| 15 to 24 years old | 25 to 54 years old | 55 to 64 years old | 15 to 24 years old | 25 to 54 years old | 55 to 64 years old | 15 to 24 years old | 25 to 54 years old | 55 to 64 years old | |
| Unemployed without work experience | 24.8% | 6.0% | 4.0% | 18.8% | 4.2% | 2.2% | 29.6% | 6.3% | 3.3% |
| Long-term unemployed | 10.5% | 27.3% | 31.9% | 11.6% | 23.7% | 28.0% | 15.2% | 28.2% | 35.7% |
- Note: Long-term unemployed corresponds to unemployed individuals with previous work experience, who have been searching for a job for at least 12 consecutive months. Unemployed without work experience correspond to unemployed individuals who have never worked.
- Source: Statistics Canada, Labour Force Survey, CANSIM table 282-0216.
1.4 Summary
Over the past few decades Canada’s labour force has undergone several structural changes. Among them, a shift to a greater share of high-skilled jobs along with a greater concentration of employment within the service industries, which is seen across most advanced economies. These changes have led to a decrease in the proportion of middle-skilled jobs and have also been accompanied by an increase in wages inequalities. Over the long term, changes in the nature of work and the makeup of the labour force could have an impact on the EI program as well.
The Canadian economy, in FY1617, was characterized with an increase in GDP growth (+1.7%)—third highest among the G7 countries. Even so, improvements in the Canadian labour market were modest relative to other G7 countries. Yet, while population ageing weigh on the aggregate labour force participation rate, that rate is still the highest among all G7 countries and Canada is better positioned than some other G7 countries to counter the effects of an ageing population with the help of higher fertility rates and immigration.
The sharp commodity price decline in recent years continues to weigh on the economy of some regions across Canada. While Saskatchewan and Alberta experienced the most acute effects of the contraction of the energy sector, British Columbia, Ontario and Quebec’s economies posted strong overall labour market performances. The impact of the changing economic situation in many of these regions on the EI program is seen in this report, but should also be expected to affect trends and results in future years.