
Chapter 3: Impact and effectiveness of Employment Benefits and Support Measures
From: Employment and Social Development Canada
Official title: Employment Insurance Monitoring and Assessment Report for the fiscal year beginning April 1, 2019 and ending March 31, 2020 - Chapter 3: Impact and effectiveness of Employment Benefits and Support Measures
In chapter 3
List of abbreviations
This is the complete list of abbreviations for the Employment Insurance Monitoring and Assessment Report for the fiscal year beginning April 1, 2019 and ending March 31, 2020.
Abbreviations
- ADR
- Alternative Dispute Resolution
- ASETS
- Aboriginal Skills and Employment Training Strategy
- B/C Ratio
- Benefits-to-Contributions ratio
- B/U Ratio
- Benefits-to-Unemployed ratio
- B/UC Ratio
- Benefits-to-Unemployed Contributor ratio
- BDM
- Benefit Delivery Modernization
- CAWS
- Citizen Access Workstation Services
- CCAJ
- Connecting Canadians with Available Jobs
- CCDA
- Canadian Council of Directors of Apprenticeship
- CCIS
- Call Centre Improvement Strategy
- CEIC
- Canada Employment Insurance Commission
- CERB
- Canada Emergency Response Benefit
- COLS
- Community Outreach and Liaison Service
- CPI
- Consumer Price Index
- CPP
- Canada Pension Plan
- CRA
- Canada Revenue Agency
- CRF
- Consolidated Revenue Fund
- CX
- Client Experience
- EBSMs
- Employment Benefits and Support Measures
- ECC
- Employment Contact Centre
- EI
- Employment Insurance
- EICS
- Employment Insurance Coverage Survey
- EIR
- Employment Insurance Regulations
- EI SQR
- Employment Insurance Service Quality Review
- eROE
- Electronic Record of Employment
- ESDC
- Employment and Social Development Canada
- FLMM
- Forum of Labour Market Ministers
- FY
- Fiscal Year
- FY *
- Fiscal Year excluding the month of March
- G7
- Group of Seven
- GDP
- Gross Domestic Product
- HCCS
- Hosted Contact Centre Solution
- HRSDC
- Human Resources and Social Development Canada
- IQF
- Individual Quality Feedback
- IQP
- Integrated Quality Platform
- ISET
- Indigenous Skills and Employment Training
- IVR
- Interactive Voice Response
- LFS
- Labour Force Survey
- LMDA
- Labour Market Development Agreements
- LMI
- Labour Market Information
- LMP
- Labour Market Partnerships
- MAEST
- Ministry of Advanced Education, Skills and Training
- MIE
- Maximum Insurable Earnings
- MSCA
- My Service Canada Account
- MTESS
- Ministère du Travail, de l'Emploi et de la Solidarité sociale
- NAICS
- North American Industry Classification System
- NESI
- National Essential Skills Initiative
- NIS
- National Investigative Services
- NOS
- National Occupational Standards
- NWS
- National Workload System
- OAS
- Old Age Security
- OECD
- Organization for Economic Co-operation and Development
- PAAR
- Payment Accuracy Review
- PPEs
- Clients who are Premiums Paid Eligible
- P/Ts
- Provinces and Territories
- PRAR
- Processing Accuracy Review
- PRP
- Premium Reduction Program
- QPIP
- Quebec Parental Insurance Plan
- R&I
- Research and Innovation
- RAIS
- Registered Apprenticeship Information System
- ROE
- Record of Employment
- RSOS
- Red Seal Occupational Standards
- SA
- Social Assistance
- SCC
- Service Canada Centres
- SDP
- Service Delivery Partner
- SEPH
- Survey of Employment, Payrolls and Hours
- SIN
- Social Insurance Number
- SIR
- Social Insurance Registry
- SLAP
- Softwood Lumber Action Plan
- SME
- Small and medium sized enterprises
- SST
- Social Security Tribunal
- STDP
- Short-term disability plan
- SUB
- Supplemental Unemployment Benefit
- TRF
- Targeting, Referral and Feedback
- UV ratio
- Unemployment-to-vacancy ratio
- VBW
- Variable Best Weeks
- VER
- Variable Entrance Requirement
- WWC
- Working While on Claim
Introduction of chapter 3
Activities conducted under Part II of the Employment Insurance (EI) Act help individuals in Canada prepare for, find and maintain employment. Under the umbrella of Employment Benefits and Support Measures (EBSMs), these activities include programs delivered by provinces and territories under Labour Market Development Agreements (LMDAs), as well as the Government of Canada's pan-Canadian programming and functions of the National Employment Service (NES).
This chapter presents program results for EBSMs achieved under Part II of the EI Act during the fiscal year beginning on April 1, 2019 and ending on March 31, 2020 (FY1920). Therefore, the impacts from the COVID-19 crisis are only slightly captured through the last 2 weeks of FY1920. Future reports will cover the impacts of Covid-19 more thoroughly.
Section 1 provides a national overview of EBSM-similar programming delivered under the LMDAs and by agreement holders under the Indigenous Skills and Employment Training (ISET) program (formerly known as the Aboriginal Skills and Employment Training Strategy). Provincial and territorial EI-funded employment programming activities are presented in Section 2, with a description of each jurisdiction's labour market and employment priorities. Section 3 has 2 sub-sections presenting:
- an overview of an Employment and Social Development Canada (ESDC) study, with national results from the Third Cycle of LMDA evaluations, and
- the economic security analysis presented in the FY1819 MAR, and explores the impacts of LMDAs on the economic security of LMDA participants by sex, as well as for Indigenous peoples and visible minorities
Section 4 discusses the results of ESDC's delivery of pan-Canadian activities, and the administration of NES functions.
Notes to readers
- The data used to analyze EBSM activities were collected from provinces, territories and ISET agreement holders. Governments continue to improve data quality and collection to ensure accurate, reliable and consistent information. While all data sets are verified before publication, systems and operational changes may affect the comparability of data from year to year.
- References to average levels of activity and to highs and lows are based on the 10-year period from FY0910 to FY1920 as a frame of reference.
- Statistics Canada's Labour Force Survey (LFS) is the main source of labour market data reported. Data for Canada and the provinces are fiscal-year averages, calculated using seasonally unadjusted monthly data, while monthly references are seasonally adjusted. Data for the Northwest Territories, Yukon and Nunavut are calculated using unadjusted 3-month moving averages of monthly data. In discussions of employment trends by industry, standard industry titles are taken from the North American Industry Classification System (NAICS).
- Real GDP data and other non-LFS macroeconomic indicators are from Statistics Canada's Economic accounts. Forecasts rely on published analyses from the Bank of Canada, Canadian charter banks, Organisation for Economic Co-operation and Development and Parliamentary Budget Office of Canada, as well as on internal analysis, using information available as of March 2021.
3.1 National overview
In this section
3.1.1 Economic and labour market context
Economic conditions
In 2019, Canada's economy expanded by 1.9%, compared to 2.4% in 2018, due in part to lower growth in domestic demand. Canadian household final consumption expenditures grew by 1.6% in 2019, a more moderate pace compared to that of 2018 (+2.5%). Nevertheless, the increase in exports (+1.3%) exceeded that of imports (+0.4%), resulting in a positive net effect on real Gross domestic product (GDP).
Economic growth was unequal across Canada's provinces and territories and marked by slower growth in many regions. In 2019, the economy in most provinces and territories grew, except for the Northwest Territories (-8.0%) and Saskatchewan (-0.7 %).Footnote 1 Nunavut, Prince Edward Island, and Newfoundland and Labrador recorded the highest annual growth rates at 6.5%, 5.1% and 4.0%, respectively. The economies of Quebec and British Columbia grew at a lower rate, 2.7%, while those of Nova Scotia and Ontario grew by 2.4% and 2.1%, respectively. In the other provinces and territories, real economic growth was 1.2% in New Brunswick, 0.8% in Yukon and 0.6% in Manitoba. Alberta's economy grew slightly by 0.1% in 2019.
Canada's economic growth in 2019 was driven mainly by services-producing industries.Footnote 2 The services-producing industries recorded growth of 2.4%, the same rate as in 2018, with the strongest growth in:
- professional, scientific and technical services
- health care and social help, and
- real estate and rental and leasing
The goods-producing industries experienced weak growth of 0.2%, compared to 3.1% in 2018, with a slowdown observed in all the industries, except the agriculture sector.
In 2020, real GDP is expected to contract by around 5.4%. This will likely be attributable to the impacts of the COVID-19 crisis on the Canadian economy.
Labour market context
In FY1920, employment in Canada increased by 1.6% over FY1819, with 303,100 jobs created on a net basis. This was the tenth consecutive annual increase and the largest increase since the 2008 to 2009 recession. The employment gains were concentrated in full-time employment opportunities and services-producing industries.
Most of the employment growth in FY1920 is attributable to full-time employment, with a 1.7% increase compared to FY1819. Part-time employment increased by 1.2% in FY1920. Employment growth was slightly higher among men (+1.7%) than for women (+1.5%). All age groups experienced an increase in employment, with the strongest growth rate for those 55 years of age and older (+3.8%). Employment for those aged 15 to 24 increased by 0.4% and, for those aged 25 to 54, by 1.2%. This reflects not only the aging of the workforce, but also the greater participation of older workers in the labour market.
Employment grew in both goods-producing (+0.4%) and services-producing industries (+2.0%) in FY1920. The goods-producing industries benefited from strong employment growth in construction (+32,800 or +2.3%). The increase in service-producing industries comes mainly from professional, scientific and technical services (+72,200 or +4.9%), as well as health care and social assistance (+85,500 or +3.5%).
The unemployment rate in Canada was 5.9% in FY1920, the same level as in FY1819. Provinces with a higher unemployment rate were Newfoundland and Labrador (12.3%), Prince Edward Island (8.4%), New Brunswick (8.0%), Nova Scotia (7.7%) and Alberta (7.3%). In the other provinces, the unemployment rates were lower than or equal to the national average in FY1920. The participation rate in Canada remained stable at 65.4%. The employment rate increased by 0.1 percentage point to 61.6%.
According to Statistics Canada's job vacancy surveyFootnote 3, there were approximately 541,500 vacancies in Canada in FY1920. This is a small increase of 3,700 (or +0.7%) compared to FY1819. The number of vacancies rose sharply in Quebec (+16,600 or +14.2%), while it dropped in Ontario (-6,500 or -3.1%), British Columbia (-6,300 or -5.9%) and Alberta (-4,200 or -7.5%).
An analysis by industry reveals that nearly 8 out of 10 job vacancies in Canada are in the services-producing industries.Footnote 4 The following industries registered the largest number of vacancies:
- accommodation and food services (69,000)
- health care and social assistance (67,300), and
- retail trade (63,600)
In the goods-producing industries, the highest numbers of vacancies were in manufacturing (46,300) and construction (37,800).
The vacancy rate, defined as the number of vacancies as a percentage of labour demand (the sum of employment and vacancies) was 3.2 in FY1920, a decrease of 0.1 percentage point compared to FY1819.Footnote 5 Yukon ranked first in Canada with a job vacancy rate of 5.4. British Columbia had the second highest vacancy rate (4.2) among the provinces and territories. In contrast, Newfoundland and Labrador had the lowest job vacancy rate at 2.3.
Table 1 — Selected Labour market indicators, Canada, FY1819 and FY1920
For accessibility reasons, the table has been simplified. Consult the PDF version for the full table.
| Indicators | FY1819 | FY1920 | Year-over-year change in % |
|---|---|---|---|
| Labour Force | 19.8 | 20.1 | 1.6% |
| Employment | 18.7 | 19.0 | 1.6% |
| Unemployment | 1.2 | 1.2 | 1.2% |
- Source: Table 14-10-0017-01 Labour force characteristics by sex and detailed age group monthly unadjusted for seasonality.
| Indicators | FY1819 | FY1920 | Year-over-year change in point of percentage |
|---|---|---|---|
| Unemployment rate | 5.9 | 5.9 | 0.0 |
| Participation rate | 65.4 | 65.4 | 0.0 |
| Employment rate | 61.5 | 61.6 | 0.1 |
- Source: Table 14-10-0017-01 Labour force characteristics by sex and detailed age group monthly unadjusted for seasonality.
3.1.2 Main results
Decline in the number of EBSM clients and interventionsFootnote 6
In FY1920, provinces and territories served 630,425 clients under the Labour Market Development Agreements (LMDAs), a decline of 6.0% compared to the previous year. The number of LMDA interventions delivered to clients decreased by 5.4% year-over-year, to a total of 968,632 interventions.
Terminology guide
A client is a person who has participated in programs or services funded by the LMDAs or by Indigenous organizations. Consult section 1.3 for details for client types.
An intervention is a discrete program or service in which a client participates. Consult section 1.4 and section 1.5 for the type of interventions available to clients.
Any reference to participants is the number of interventions, where information on designated groups is collected at the intervention level, rather than individual client.
Combined with programs and services delivered by Indigenous organizations through the Indigenous Skills and Employment Training (ISET) Program, a grand total of 652,267 EBSM clients were served (-6.2%), and 1, 010,565 EBSM interventions (-5.4%) were delivered in FY1920.
The overall intervention-to-client ratio was relatively stable at 1.55, compared to 1.54 in the previous year, as the number of interventions declined at a lower rate than the client total.
3.1.3 Client profile and participation
In FY1920, the total number of EBSM clients served declined by 6.2% year-over-year, with varying declines among the 3 traditional client groups. The number of active EI claimants declined by 8.4% year-over-year, to a total of 262,196; non-insured clients dropped by 9.0%, to a total of 218,350, while former EI claimant clients increased by 2.4%, to a total of 104,333. The number of clients served for the last group—Premiums Paid Eligible (PPE)—remained the newest group—Premiums Paid Eligible (PPE)— slightly decreased by 0.2% at 67,388 in FY1920.
As a share of all clients for FY1920, active EI claimants represented 40.2% of total clients, compared to 41.1% in FY1819, and non-insured (33.5%), compared to 34.5% in the previous year. The share of former EI claimants (16%) and PPE (10.3%) increased respectively by 1.4 and 0.6 percentage points, compared to FY1819.
Consult Table 2 for descriptions of the different client types.Footnote 7
Table 2 – Client type descriptions
For accessibility reasons, the information is presented in text format. Consult the PDF version for the table.
Active claimants are those who had an active EI Part I regular claim when they requested assistance under Part II of the Employment Insurance Act. Typically, they have stronger and more recent job attachment. They tend to be able to return to work more quickly than those with weaker ties to employment. Active claimants who are considered job-ready from an analytical point of view often seek out short-term interventions under EI Part II to find their next employment opportunity. Others require longer-term Employment Benefits to upgrade their skills, establish certification or refine their job search strategies.
Former claimants are those who completed an EI claim in the previous 5 years, or who began a parental or maternity claim in the last 5 years when they requested assistance under Part II. They are no longer in receipt of EI Part I benefits; however, they remain eligible for EI Part II under certain criteria.Footnote 8 Former claimants do not receive income support under Part I of the Employment Insurance Act while they complete an Employment Benefit intervention under EI Part II; however, they may receive Part II income support while completing training activities under their return-to-work action plan.
Premiums-paid Eligible are those who have made minimum Employment Insurance premium contributions above the premium refund threshold (that is $2,000 in earnings) in at least 5 of the last 10 years.
Non-insured clients are unemployed individuals who are neither active, former EI clients, nor PPE. Non-insured clients usually have little substantive or recent job attachment. They include new labour force participants and individuals who were formerly self-employed without paid employment earnings. While these clients are not eligible for Employment Benefits under EIPart II, they may access Employment Assistance Services.

Text description of Chart 1
| EBSM client type | FY0910 | FY1011 | FY1112 | FY1213 | FY1314 | FY1415 | FY1516 | FY1617 | FY1718 | FY1819 | FY1920 |
|---|---|---|---|---|---|---|---|---|---|---|---|
| Active claimants | 463,158 | 372,340 | 326,892 | 319,904 | 348,909 | 339,795 | 356,828 | 351,362 | 313,998 | 286,197 | 262,196 |
| Former claimants | 104,972 | 114,356 | 104,816 | 100,522 | 97,417 | 91,999 | 92,689 | 95,583 | 115,927 | 101,848 | 104,280 |
| PPE | 67,490 | 67,326 | |||||||||
| Non-insured clients | 209,020 | 269,350 | 214,587 | 241,834 | 264,716 | 257,665 | 284,607 | 304,927 | 285,733 | 240,075 | 218,316 |
Since FY0910, the number of EI active claimants under EI Part II has declined by 43.4%, while that of former EI claimants has remained somewhat stable (-0.6%), while non-insured clients increased by 4.5%. The drop in active EI claimants is largely attributable to the strong performance of Canada's labour market, resulting in an overall decline in EI program use among Canadians. In turn, provinces and territories focused on serving clients with weaker work attachment.
Age distributionFootnote 9
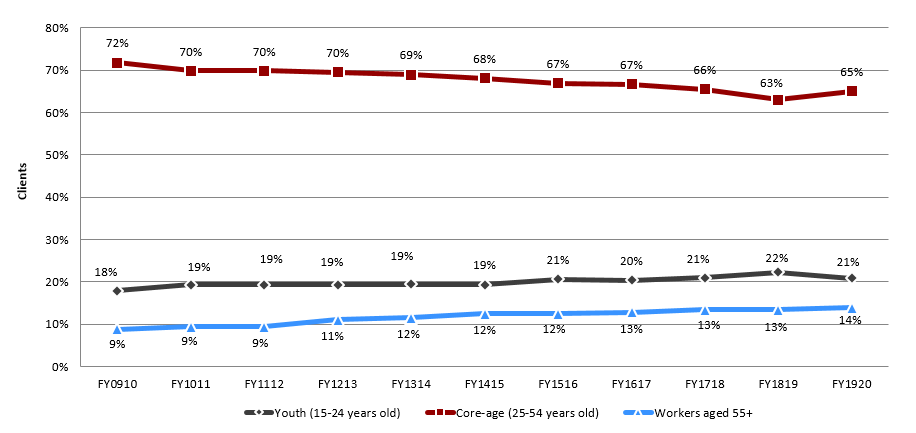
In FY1920, most EBSM clients were in their core working years (25 to 54 years old), totalling 405,644 individuals, or 65.1% of all clients. Youth – 15 to 24 years old – represented 20.9% of all clients (130,345), and clients aged 55 or older made up the remaining 13.9% (86,615 clients). Compared to FY1819, youth clients decreased significantly (-9.3%), while other categories of clients stayed relatively stable: clients aged 55 or older (+0.3%) and core-aged clients (-0.3%).
Text description of Chart 2
| FY0910 | FY1011 | FY1112 | FY1213 | FY1314 | FY1415 | FY1516 | FY1617 | FY1718 | FY1819 | FY1920 | |
|---|---|---|---|---|---|---|---|---|---|---|---|
| Youth (15-24 years old) | 18% | 19% | 19% | 19% | 19% | 19% | 21% | 20% | 21% | 22% | 21% |
| Core-age (25-54 years old) | 72% | 70% | 70% | 70% | 69% | 68% | 67% | 67% | 66% | 63% | 65% |
| Workers aged 55+ | 9% | 9% | 9% | 11% | 12% | 12% | 12% | 13% | 13% | 13% | 14% |
In the context of an aging labour force, the number of EBSM clients aged 55 or older increased by 48.3% compared to FY0910 results. Clients aged 55 or older now represent 13.9% all total clients, compared to 8.8% a decade earlier.
Despite the decline in FY1920, in the past 10 years, youth participation in active labour market programming has also increased (+10.1%), as provinces and territories prioritized serving younger people to help counter the effects of an aging population, while developing and maintaining a competitive workforce. This age cohort now represents over 20.9% of all clients, compared to 17.9% 10 years earlier.
Given the growth of both youth and clients aged 55 or older, the number of core-age clients (25-54 years old) has declined (-14.5%) over the last 10 years. Core-age workers now represent 65.1% of all clients, compared to 71.8% in FY0910.
Designated groupsFootnote 10
In support of employment equity principles, ESDC collects information on the EBSM participation of women, Indigenous peoples, members of visible minority groups and persons with disabilities. As participantsFootnote 11 voluntarily self-identify, annual fluctuations may be due to changes in self-identification rates.
- Women participated in a total of 445,356 EBSM interventions in FY1920, a 6.2% decrease year-over-year (44.5% of all interventions delivered to Canadians, compared to 45.3% in FY1819). Women accessed predominately EAS interventions (84.2%); at a higher rate than men (75.3%). Women accessed 15.1% of the Employment Benefits delivered in FY1819. Among participants who were women, most were non-insured clients (38.2%), followed by active EI claimants (30.4%) and former EI claimants (19.6%). The remainder of women participants (11.8%) were under the PPE client category
- In FY1920, a total of 137,460 participants self-identified as persons with disabilities, a decrease of 2.5% year-over-year. Persons with disabilities participated in 13.7% of all interventions delivered in FY1920, a 0.3 percentage point increase year-over-year. The vast majority (82.1%) participated in an EAS intervention, compared to 17.9% who participated in Employment Benefits
- Indigenous peoples participated in 128,462 interventions in FY1920, representing an increase of 15.2% year-over-year. As a share of all ESBM interventions delivered in Canada, Indigenous peoples participated in 12.8% of the total (up from 10.6% of interventions in FY1819), including programming delivered through ISET. The vast majority of Indigenous participants (80.3%) participated in an EAS intervention, compared to 19.7% who participated in Employment Benefits
- Members of visible minority groups participated in 97,971 interventions in FY1920, dropping by 32.8% year-over-year. Among all interventions delivered in Canada, members of visible minority groups represented 9.8% of participants, compared to 7.0% in FY1819. The majority of interventions (87%) were EAS, compared to 13% for Employment Benefits
Official languages
To foster the full recognition and use of both English and French in Canadian society, and to help ensure that labour market programs and services are delivered in both official languages, all LMDAs contain commitments by provinces and territories to have programs and services delivered in both official languages, where there is significant demand.
3.1.4 Interventions: Employment benefits
Employment Benefits are longer-term interventions focused on providing the skills or work experience required to regain employment. Under the LMDAs, provinces and territories can provide Employment Benefits similar to the following 6 benefit types outlined in the EI Act: Skills Development-Regular (SD-R); Skills Development-Apprentices (SD-A); Targeted Wage Subsidies (TWS); Self-Employment (SE); Job Creation Partnerships (JCPs); and Targeted Earnings Supplements (TES).Footnote 12
In FY1920, Employment Benefit interventions totalled 197,907, a significant increase of 20.4% compared to the previous reporting period. With relatively strong labour market conditions, the rise of Employment Benefits suggests provinces and territories focused on longer-term training and skills development investments. The average length of an Employment Benefit intervention was 97 days in FY1920, considerably shorter than the average duration of 122 days observed in the previous year.
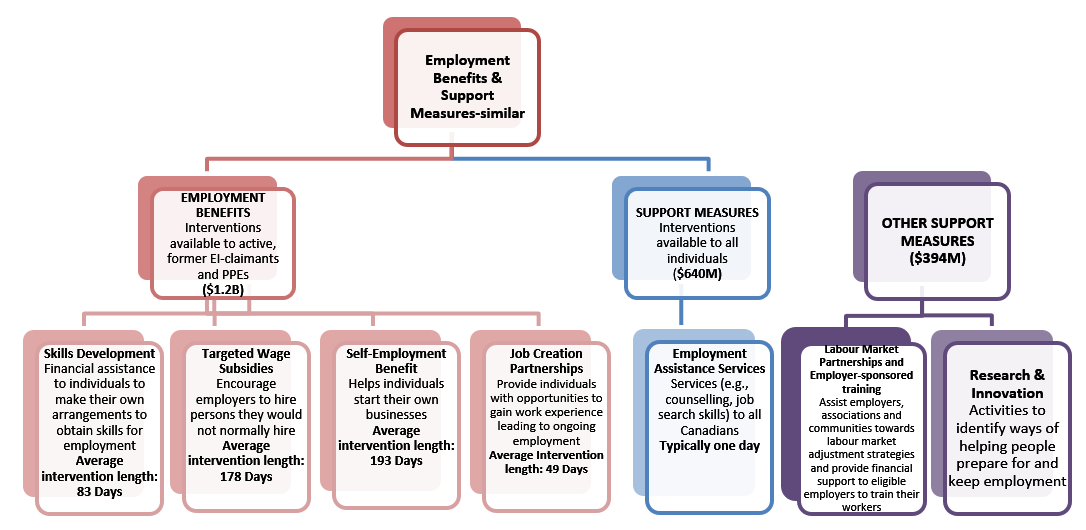
Text description of Table 3
Employment Benefits and Support Measures similar
- Employment benefits: Interventions available to active, former EI-claimants and PPEs ($1.2B):
- Skills Development: Financial assistance to individuals to make their own arrangements to obtain skills for employment. (Average intervention length: 83 Days)
- Targeted Wage Subsidies:Encourage employers to hire persons they would not normally hire (Average intervention length: 178 Days)
- Self-Employment benefit:Helps individuals start their own businesses. (Average intervention length: 193 Days)
- Job Creation Partnerships:Provide individuals with opportunities to gain work experience leading to ongoing employment. (Average Intervention length: 49 Days)
- Support measures:Interventions available to all individuals ($640M):
- Employment Assistance Services:Services (for example, counselling, job search skills) to all Canadians. (Typically one day)
- Other support measures ($0.3B): ($394M)
- Labour Market Partnershipsand Employer-sponsored training:Assist employers, associations and communities towards labour market adjustment strategies and provide financial support to eligible employers to train their workers
- Research & Innovation: Activities to identify ways of helping people prepare for and keep employment
SD-R interventions increased considerably, by 49.9%, to a total of 108,282, with the largest increases in Alberta (+192.0%), Manitoba (+195.9%) and British Columbia (+1,011.9%); while SD-A interventions decreased by 2.6%, to a total of 63,602 in FY1920. Combined, Skills Development interventions made up 86.9% of all Employment Benefits, compared to 83.6% in the previous year. Skills Development expenditures totalled $906.7 million, an increase of 3.3%, or $28.9 million, compared to FY1819.
In FY1920, TWS interventions declined by 19.5% year-over-year, to 15,137, and represented 7.6% of all Employment Benefits. Expenditures on TWS programming totalled $157.1 million, an increase of $14.8 million in spending compared to the previous fiscal year.
The number of SE interventions rose by 16.4%, to 5,792, with their shares among all Employment Benefits representing 2.9%. However, SE expenditures increased in FY1920; going from $60.6 million in FY1819, to $63.2 million in the current reporting year.
Overall, JCP interventions totalled 5,094, increasing 63.2% year-over-year, due to a significant increase in JCP programming in Manitoba (+1,046.7%). JCP expenditures jumped to $42.5 million, compared to $34.0 million in the previous year.
| Employment Benefit | Interventions | Share of Employment Benefits | Year-over-year change | Expenditures ($000s) | Estimated cost per intervention |
|---|---|---|---|---|---|
| Targeted Wage Subsidies | 15,137 | 7.6% | -19.5% | $157.1 | $10,380 |
| Self-Employment | 5,792 | 2.9% | 16.4% | $63.2 | $10,911 |
| Job Creation Partnerships | 5,094 | 2.6% | 63.2% | $42.5 | $8,347 |
| Skills Development-Regular | 108,282 | 54.7% | 49.9% | $906.7 | $5,275 |
| Skills Development-Apprentices | 63,602 | 32.1% | -2.6% | ||
| Canada | 197,907 | 100% | +20.4% | $1,169.5 | $5,910 |
3.1.5 Interventions: Support measures
Part II of the Employment Insurance Act authorizes 3 support measures: Employment Assistance Services (EAS), Labour Market Partnerships (LMPs) and Research and Innovation (R&I). Under the LMDAs, provinces and territories deliver these measures at regional and local levels, while ESDC retains responsibility for pan-Canadian delivery of LMPs and R&I (consult section 4.1: Pan-Canadian Activities and the National Employment Service). However, LMPs and R&I are generally not associated with direct client services, so counts on participants or interventions are not available. The EAS component of Support Measures provides a full range of self-help and assisted services, such as support in determining career objectives through employment counselling, improving job search techniques, completing a return-to-work action plan and accessing labour market information in support of career choices.
Employment Assistance ServicesFootnote 13
Employment Assistance Services support client to prepare for, find and keep employment, through various services (such as, career advice and employment counselling, job search assistance, or Information on the labour market and education/training opportunities). EAS interventions provide crucial support to those who have been absent from the labour market for an extensive period or who have low job attachment. They may also support new immigrants or young people who are entering the Canadian labour market for the first time. These interventions are reported in 1 of the 3 following categories: Employment Services, Group Services, or Individual Counselling.
In FY1920, a total of 770,725 EAS interventions were delivered, a decrease of 10.3% year-over-year. Total expenditures on EAS were 639.5 million, compared to $705.4 million in the previous reporting year.
Individual Counselling is particularly important when supporting clients who face barriers to employment, and often need action plans as a pathway to Employment Benefits. In FY1920, with an increase of 21.8% year-over-year to a total of 408,261 interventions, Individual Counselling was the most common EAS intervention type, accounting for 53.0% of all EAS interventions (compared to 39% in FY1819). Employment Services interventions was the second most common EAS intervention type, accounting for 45.7% of all EAS interventions in FY1920, compared to 58.8% a year earlier. A total of 352,142 Employment Services interventions were delivered, a decrease of 30.3% year-over-year, with largest decreases in Alberta (-72.4%) and Saskatchewan (-100%). Group Services dropped by 44.8%, for a total of 10,322 interventions delivered. In turn, the share of Group Services among all EAS-type interventions dropped to 1.3%, compared to 2.2% in the previous year.
Other support measures
The Labour Market Partnerships (LMPs) measure facilitates collaboration between employers, employees and employer associations, as well as community groups and communities, to develop solutions to labour force imbalances, such as persistent high unemployment or skill shortages. Under LMPs, employer-sponsored training includes assistance to employers to support approved training activities for employees in order to maintain their employment. This may include employees affected by technological or structural changes in the economy. In FY1920, LMPs expenditures totalled $276.9 million, compared to $253.4 million in the previous year.
Research and Innovation (R&I) initiatives identify better ways of helping people prepare for, return to or maintain employment and participate productively in the labour force. In FY1920, R&I expenditures totalled $117.3 million, compared to $94 million in the previous year.
Table 5 – Support measures and other support measures, Canada, FY1920
For accessibility reasons, the information is presented in text format. Consult the PDF version for the table.
| Employment Assistance Service* | Interventions | Share of employment support measures | Year-over-year change | Expenditures ($000s) | Estimated cost per intervention |
|---|---|---|---|---|---|
| Employment services | 352,139 | 45.7% | -30.3% | n/a | n/a |
| Group services | 10,322 | 1.3% | -44.8% | n/a | n/a |
| Individual counselling | 408,261 | 53.0% | 21.8% | n/a | n/a |
| Total Employment Assistance Services | 770,722 | 100.0% | -10.3% | $705.4 | $821 |
- *Expenditures for Employment Assistance Services are reported at the aggregate level by most provinces and territories.
| Other support measures | Interventions | Share of employment support measures | Year-over-year change | Expenditures ($000s) | Estimated cost per intervention |
|---|---|---|---|---|---|
| Labour Market Partnerships** | n/a | n/a | n/a | $253.4 | n/a |
| Research and innovation | n/a | n/a | n/a | $94.0 | n/a |
| Canada | 770,722 | 100% | -10.3% | $1,052.8 | n/a |
**Expenditures for Labour Market Partnerships includes employer-sponsored training.
3.1.6 Expenditures
Total expenditures under Part II of the Employment Insurance Act were $2.35 billion in FY1920, which included EBSM programming, and pan-Canadian activities. This represented an increase of 1.9% compared to the previous year, driven by additional incremental LMDA funding under Budget 2017 and new available funding under the Indigenous Skills and Employment Training program.
Under the LMDAs, Employment Benefits remained the largest investment, at $1.17 billion, representing more than half of expenditures by provinces and territories. Compared to FY1819, spending on Employment Benefits increased by nearly $55 million (+4.9%). Expenditures on Employment Assistance Services declined by nearly 66 million (-9.3%) to a total of $639.5 million.
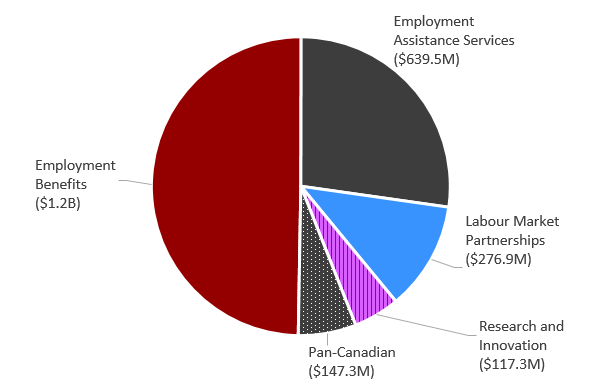
Text description of Chart 3
| Chart 5: FY 1920 spending chart | Value | Proportion |
|---|---|---|
| Employment Benefits | 1,169,631 | 50% |
| Employment Assistance Services | 639,527 | 27% |
| Labour Market Partnerships | 276,921 | 12% |
| Research and Innovation | 117,288 | 5% |
| Pan-Canadian | 147,252 | 6% |
| n/a | 2,350,620 | n/a |
Expenditures towards LMPs and R&I measures increased, going from $347.4 million in FY1819, to $394.2 million in FY1920.
Pan-Canadian expenditures increased significantly (+5.9%), increasing from $139.0 million in FY1819 to $147.3 million in FY1920. Consult Section 4 of this chapter for details on Pan-Canadian activities.
Targeted Measures under LMDAs in FY1920
In FY1920, the Government of Canada made available additional time-limited targeted funding, under the LMDAs, to support workers and communities affected by duties and tariffs imposed by the United States on steel and aluminum products. In addition, Budget 2018 announced additional funding to assist workers in seasonal industries over 2 years, which started in FY1819. For FY1920, $45.5 million was made available to provinces and territories under 2 measures: $20.5M for workers in seasonal industries and $25M for workers affected by the steel and aluminum trade dispute. Provinces and territories accessed roughly $41.8 million of the funding.
Jurisdictions invested the additional funding in existing and new programming. For example, Newfoundland and Labrador utilized the seasonal worker funding ($1.6 million) for the Impacted Fish Plant Worker Program. This targeted program focused on creating short-term employment for workers from fish plants deemed impacted by the downturn in the fishing sector.
Under the LMDA-funded Sector Council Program, the Nova Scotia Tourism Human Resource Sector Council and the Nova Scotia Fisheries Human Resource Sector Council used the targeted funding ($1.6 million) to provide support to seasonal industry sectors for recruitment, attraction, retention, and training of workers.
In FY1920, Ontario invested targeted funding in programs such as Adjustment Advisory Program, SkillsAdvance Ontario and Pre-Apprenticeship to support workers in seasonal industries and those workers affected by the steel and aluminum trade dispute. The funding involved 24 projects, assisted more than 500 employers and served over 2,000 clients.
In Quebec, the additional targeted funding for workers in seasonal industries ($8 million) supported a pilot project for extending periods of hiring seasonal workers in companies with training and income support once their EI benefits had expired.
Additional information on provincial and territorial activities is available in Section 3.2 of this chapter.
3.1.7 Key Performance IndicatorsFootnote 14
FY1920 Employment benefits and Support Measures key facts
For accessibility reasons, the table has been simplified. Consult the PDF version for the full table.
| EI Active, Former, and Premiums-Paid eligible (LMDA) | Non-Insured clients (LMDA) | Pan-Canadian1 |
|---|---|---|
| 412,075 | 218,350 | 21,842 |
| Active claimants | Former claimants | PPEs | Non-Insured | Youth clients (15–24)2 | Core age workers (25–54)2 | Clients aged 55 or older2 |
|---|---|---|---|---|---|---|
| 40.40% | 14.30% | 10.70% | 34.60% | 20.90% | 65.10% | 13.90% |
| Interventions | FY1920 | Year-over-year change |
|---|---|---|
| Employment benefits | 197,907 | 20.40% |
| Support Measures: EAS | 770,725 | 10.30% |
| Pan-Canadian | 41,933 | 5.80% |
| FY1920 | Year-over-year change (p.p.) | |
|---|---|---|
| Employment benefits | 20.40% | 4.3 |
| Support Measures: EAS | 79.60% | 4.3 |
| FY1920 ($ million) | Year-over-year change | |
|---|---|---|
| Employment Benefits | $1,169.50 | 4.90% |
| Support Measures: EAS | $639.50 | 9.30% |
| LMPs and R&I | $394.20 | 13.50% |
| Pan-Canadian | $147.30 | 5.90% |
| Total expenditures | $2,350.50 | 1.90% |
| Indicator | Total | Year-over-year change |
|---|---|---|
| Active claimants served | 262,196 | 8.40% |
| Returns to employment | 194,120 | 1.80% |
| Estimated unpaid benefits ($ Million) | $1,054.34 | 1.50% |
- 1 EI Part II Pan-Canadian services to individuals are through the ISET Program.
- 2 Age distribution does not equal 100%, as the "unknown" category is not reported here. Date of birth is not collected for clients in SD-Apprentices and Group Services.
- 3 Totals may not add up exactly due to rounding; accounting adjustments are not included.
ESDC monitors the results of EBSM-similar programming delivered by provinces and territories through 3 key performance indicators:
- the number of active EI claimants servedFootnote 15
- the number of EI clients who return to employment following an intervention,Footnote 16 and
- the amount of unpaid EI Part I benefits resulting from returns to employment
In the context of improving labour market and economic conditions in FY1920 throughout most parts of Canada, the number of active EI claimants served (262,196) dropped by 8.4% year-over-year. Returns to work increased by 1.8% year-over-year, with a total of 194,120 clients finding employment within 6 months of completing their interventions. Stemming from the decline in active EI claimants, unpaid EI Part I benefits totalled $1.054 billion, going down by 1.5% compared to the previous year.
Table 5 presents supplementary performance indicators at the national and provincial/territorial level, contextualized with labour market aggregates. Since multiple factors can influence results at the individual, jurisdictional and national level, these indicators cannot be solely attributed to the LMDAs.
At the national level, 67.8% of active EI claimants began their first LMDA-funded intervention within 12 weeks after their Benefit Commencement Period (BCP). Compared to FY1819, this is an increase of 5.2 percentage points, where 62.6% of active claimants began within 12 weeks that year. At the provincial/territorial level, most jurisdictions experienced an increase, as well, with results ranging from 79.2% in Quebec, to 35.8% in Newfoundland and Labrador. In FY1920, Quebec, Alberta and British Columbia continued refining their use of the Targeting, Referral and Feedback (TRF) tool, helping provinces and territories identify EI applicants, according to local labour market needs and available EI Part II employment programming. ESDC is working closely with the remaining 10 provinces and territories to onboard to TRF.
In FY1920, Canada's returns to work following interventions among active EI claimants, expressed as a proportion of the country's labour force, was 1.0%. Quebec, Saskatchewan and 3 Atlantic provinces (Newfoundland & Labrador, Prince Edward Island and New Brunswick) were above the national average. At the same time, unpaid EI regular benefits stemming from returns to work, expressed as a proportion of total EI regular benefits paid, was 9.5% at the national level. Quebec, Manitoba, Saskatchewan, Alberta, and British Columbia had higher proportions than the national figure. Similar to recent years, Quebec registered above the national average for both of these ratios. This suggests an effective and efficient balance between returning clients to work as soon as possible, while ensuring the necessary active employment services for employment success over a mid- to long-term horizon.
| Province / Territory | Unemployment rate | Job vacancy rate | EI Active Claimants (%) beginning EI Part II within 12 Weeks following their Part I benefit period commencement * | Returns to work among Active EI clients from EBSM Interventions, as a proportion of the labour force | Estimated unpaid EI regular benefits resulting from EBSM interventions, as a proportion of Part I Regular Benefits Paid |
|---|---|---|---|---|---|
| Newfoundland & Labrador | 12.3 | 2.3 | 35.8% | 1.2% | 2.2% |
| Prince Edward Island | 8.4 | 3.1 | 60.5% | 2.9% | 4.4% |
| Nova Scotia | 7.7 | 2.9 | 51.0% | 0.8% | 3.9% |
| New Brunswick | 8.0 | 3.1 | 58.3% | 2.3% | 3.9% |
| Quebec | 5.3 | 3.5 | 79.2% | 1.7% | 11.5% |
| Ontario | 5.7 | 3.1 | 61.6% | 0.6% | 8.3% |
| Manitoba | 5.4 | 2.6 | 44.1% | 0.9% | 11.4% |
| Saskatchewan | 5.9 | 2.4 | 46.2% | 1.3% | 11.9% |
| Alberta | 7.3 | 2.6 | 68.5% | 0.7% | 14.5% |
| British Columbia | 5.0 | 4.2 | 65.7% | 0.7% | 13.0% |
| Northwest Territories | 8.2 | 2.8 | 56.0% | 0.8% | 7.3% |
| Yukon | 3.5 | 5.4 | 55.5% | 0.5% | 6.6% |
| Nunavut | 13.7 | 3.3 | 53.4% | 0.3% | 5.2% |
| Canada | 5.9 | 3.2 | 67.8% | 1.0% | 9.5% |
- Source: Table 14-10-0287-01 Labour force characteristics, monthly, seasonally adjusted and trend-cycle, last 5 months and Table 14-10-0325-01, Job vacancies, payroll employees, job vacancy rate, and average offered hourly wage by provinces and territories, quarterly, unadjusted for seasonality and EI Administrative Data.
- *This includes a small percentage of clients who began EI Part II programming up to 2 weeks prior to their Part I Benefit Period Commencement. SD-A participants and those who were non-insured participants were excluded, if they had received EAS in the previous year.
3.2 Provincial and Territorial EBSM Activities
In this section:
- 3.2.1 Context
- 3.2.2 Newfoundland and Labrador
- 3.2.3 Prince Edward Island
- 3.2.4 Nova Scotia
- 3.2.5 New Brunswick
- 3.2.6 Québec
- 3.2.7 Ontario
- 3.2.8 Manitoba
- 3.2.9 Saskatchewan
- 3.2.10 Alberta
- 3.2.11 British Columbia
- 3.2.12 Northwest Territories
- 3.2.13 Yukon
- 3.2.14 Nunavut
This section analyzes the provincial and territorial economic environment and EBSM-similar activities in FY1920. It links trends in clients served, interventions and expenditures to local labour market conditions, as well as employment programming priorities.
3.2.1 Context
Under the LMDAs, provinces and territories receive funding to support the delivery of programs and services, similar to the EBSMs established under Part II of the Employment Insurance Act.Footnote 17 To address unique labour market challenges, provinces and territories deliver employment programming under LMDAs, which were individually negotiated with the Government of Canada. Provinces and territories design and deliver all EI-funded active employment programming, except for pan-Canadian activities, discussed in Section 4 of this chapter.
Broad-based consultations were held in FY1617 with provinces, territories and stakeholders to identify ways to improve the labour market transfer agreements and guide future investments to strengthen labour market programming. Comments received indicated a desire for agreements to be more flexible and responsive to the needs of employers and Canadians, especially underrepresented groups in the workforce.
Budget 2017 announced new measures to rationalize and expand the existing bilateral labour market transfer agreements with provinces and territories, including the LMDAs. This included amending the EI Act to expand eligibility for Employment Benefits to include unemployed individuals who have made minimum Employment Insurance premium contributions in at least 5 of the last 10 years. In addition, eligibility for Employment Assistance Services was broadened to include both the unemployed and employed. Provinces and territories were also provided with increased flexibility to support employer sponsored training under the Labour Market Partnerships Support Measure. These changes took effect on April 1, 2018 and were reflected in amending agreements signed with provinces and territories. These amendments can be found on the LMDA website.
In addition, the amended LMDAs require provinces and territories to consult with employer and employee organizations, as well as stakeholders representing Official Language Minority Communities, as part of their annual planning process. Provinces and territories are required to include information on this engagement, including related outcomes in their annual deliverables.
Budget 2017 also announced an additional $1.8 billion investment in the LMDAs over 6 years (2017-2018 to 2022-2023), to help more Canadians access EI-funded skills training and employment supports.
Overall, Canada's economy and labour market performed well in FY1920, contributing to a decline in the number of clients served and LMDA-funded interventions delivered in most provinces and territories.
Despite varying economic and labour market conditions throughout Canada, all jurisdictions prioritized improvements to the labour market attachment of underrepresented groups, such as persons with disabilities, Indigenous peoples, recent immigrants, youth, and older workers; as well as assuring employers have access to a skilled workforce. An aging workforce and out-migration remain a particular labour market challenges for Atlantic Canada, where the provinces worked with communities and regional stakeholders to ensure labour market programming responds to the demographic pressures. The Managing for Results section for each provincial and territorial summary highlights innovative approaches to improve outcomes for clients.
These include:
- better employer engagement in setting priorities and design
- improved strategies to deliver active employment supports earlier for EI claimants, and
- innovative approaches in some jurisdictions to Research and Innovation support measures
3.2.2 Newfoundland and Labrador
In 2019, Newfoundland and Labrador recorded 1 of the strongest real GDP growth rate (+4.0%) among all territories and provinces, after contracting by 3.5% in 2018. In 2020, the Province's economy is expected to have shrunk by 7.7%, as the COVID-19 crisis and the sharp drop in oil prices have led to serious setbacks across the Province's main industries.
Newfoundland and Labrador: EBSM key facts
For accessibility reasons, the table has been simplified. Consult the PDF version for the full table.
| Insured clients | Non-insured clients |
|---|---|
| 8396 |
1253 |
| Intervention type | FY1920 | Year-over-year change |
|---|---|---|
| Employment Benefits | 9,303 | 28.4% |
| Support Measures: EAS | 15,354 | 12.2% |
| Intervention type | FY1920 | Year-over-year change (pp) |
|---|---|---|
| Employment Benefits | 37.7% | 3.1 |
| Support Measures: EAS | 62.3% | 3.1 |
| Total expenditures | FY1920 ($ million) | Year-over-year change |
|---|---|---|
| Employment Benefits | $110.5 | 2.5% |
| Support Measures: EAS | $12.6 | 25.4% |
| LMP and R&I | $12.5 | 18.0% |
| Total expenditures* | $135.6 | 1.2% |
| FY1819 | FY1920 | Year-over-year change |
|---|---|---|
| $16.16 | $16.74 | 3.6% |
- * Totals may not add up due to rounding; does not include accounting adjustments.
In FY1920, the Province's labour market conditions remained stable, with employment slightly dropping, by 0.4% (-1,000). The unemployment rate was 12.3%, 0.1 percentage point lower than a year earlier, as the Province's labour force shrank by 4,200, or 1.6%. The overall labour market participate rate slid by 0.9 percentage points to 57.6%. The goods-producing industries experienced slight employment decline (-700; -1.6%) while employment in the services-producing industries remained relatively stable (-200;-0.1%). While utilities (-400; -12.2%) and construction (-500; -2.7%) were the most affected sectors in the goods-producing industries, sectors such as finance, insurance, real estate and leasing (-700; -9.9%); professional, scientific and technical services (-1,200; -11.6%); and, health care and social assistance (-1,200; -2.9%) slowed down significantly in the services-producing industries. Positive results were recorded in business, building and other support services (+1,200; +18.1%); accommodation and food services (+1,000; +6.1%); and, other services (+1,700; +17.7%).
In FY1920, prior to the COVID-19 pandemic, access to employment assistance was traditionally via a combination of online, telephone and in-person delivery structure. However, the primary engagement tool for individuals was in-person services. The pandemic shut down brought forth challenges in program and service delivery, with the suspension of in-person access for the public and working from home arrangements for staff. All program delivery models had to be reviewed and revised to accommodate an individual's ability to access a complete, alternative, on-line delivery process for both internal and external stakeholders. The transition included online forms, policy and procedural changes, and a virtual approach to case management. Notably, post-secondary training institutions in Newfoundland and Labrador were nimble to transition to online courses. This permitted many individuals to continue studies towards their employment goals during these unprecedented times. However, it also presented challenges, as businesses were not permitted to operate and employees were unable to work.
COVID-19 has affected many key industries in Newfoundland and Labrador, with significant impacts not yet fully understood. These disruptions continue to impact the oil and gas, hospitality and retail sectors. In some cases, the impacts are compounding existing drivers of change, such as the use of digital technologies, the automated creation and application of technology to monitor and control the production as well as the delivery of products and services, outsourcing and offshoring. These effects are reshaping the landscape of skills demands, with potential far-reaching consequences for workers, employers and the overall labour market. While minimal impacts to employment programming plans and priorities were observed in FY1920, future editions of this report will have more details about the effects of the COVID-19 crisis.
3.2.2.1 Managing for results
In 2019 to 2020, Newfoundland and Labrador made significant improvements in capturing data from community partners, to improve reporting and the assessment of results. The Province worked with community organizations to align the Accountability Resource Management System (ARMS) with the required fields outlined in the new performance measurement strategy developed with the Government of Canada. This has permitted a better, more regular and consistent data sharing with the federal government. As well, it has allowed the Province's community partners to demonstrate a larger reach in supporting individuals in employment as well as training programs and services.
3.2.2.2 Clients, interventions and expenditures
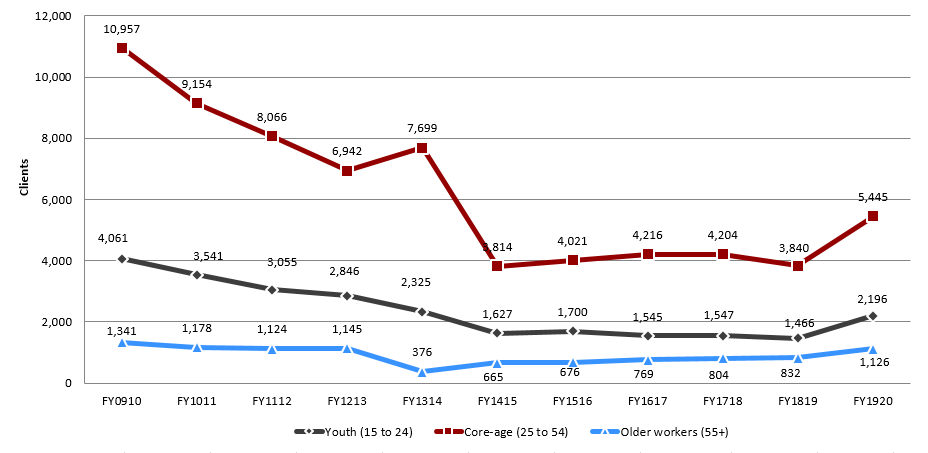
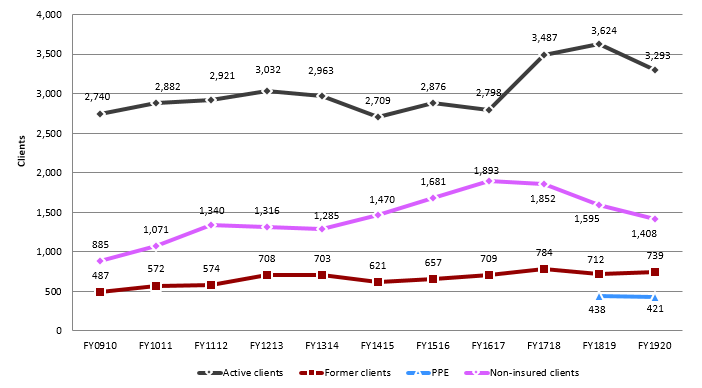
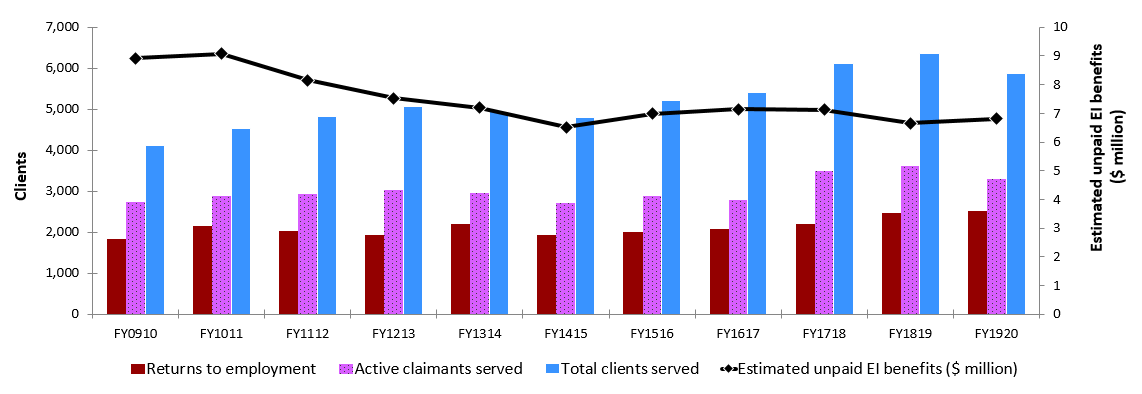
For a second consecutive year, the total number of clients served in Newfoundland and Labrador declined, reaching 9,649 (-1.1%) in FY1920. While the number of active clients dropped by 24.4% (or 1,885) to 5,831, that of former clients (2,284), PPE (281), and non-insured clients (1,253) grew up by 66.6%, 126.6%, and 131.2%, respectively.
PPE, the new client type as of FY1819, accounted for 2.9% for all clients served, representing a year-over-year increase of 1.6 percentage point. The share of active clients fell from 79.1% to 60.4 % of all clients served, that of former clients and non-insured advanced from 14.1% to 23.7%, and 5.6% to 13.0%, respectively.
In FY1920, Newfoundland and Labrador delivered 24,657 (+17.8% year over year) EBSM-similar interventions. Support Measures (62.3%) represented the most delivered interventions, and the proportion of Employment Benefits was 37.7% of all interventions. Compared to the previous year, 2,990 insured clients returned to work after participating in an EBSM-similar program, a 2.1% year-over-year decrease. Unpaid EI benefits increased by 3.6% to $16.74 million.
EBSM total expenditures advanced by 4.0% to $135.6 million, including $9.9 million from the Province's share of the additional $250.0 million LMDA investment announced in Budget 2017, as well as funding measures provided to support workers in seasonal industries ($1.6 million) and those affected by trade disputes in the steel and aluminum industries ($500,000).
Because of the additional funding provided as part of Budget 2017, Newfoundland and Labrador strategically invested funds to support individuals and employers in accessing training and employment services. Some examples of this investment include:
- to address labour market needs, the College of the North Atlantic was supported to develop new offerings of the Practical Nursing program and increase intake within existing programs. As a result, approximately 116 individuals will participate in FY2021
- to assist with government's strategic action plans to enhance the quality of the provincial Early Childhood Education (ECE) workforce and increase educational qualifications in the field, the College of the North Atlantic was supported to address the current waitlist for ECE, as well as to find ways of increasing access to ECE online. Approximately 120 individuals were supported to further develop their ECE credentials
- led by the Community Sector Council NL, the Tapping the Untapped Potential in the Community Sector project will help address the significant labour market issues relevant to community-based, non-profit supply, as well as demand regarding employment potential and growth. Funding was provided for a project to focus on planning for attraction, retention, succession and growth of the paid and unpaid labour force
- Newfoundland and Labrador, in partnership with TradesNL and the Innu Nation, established the Trades NL Indigenous Apprentice Office. This office will recruit, promote, support and advance the economic and professional growth of Indigenous populations of Newfoundland and Labrador within the skilled trades, with an emphasis on trades and Red Seal occupations
Newfoundland and Labrador utilized the seasonal worker funding to respond to circumstances such as industry closures and downsizing (fish plant closures), through the provision of LMDA programs such as skills development and wage subsidy supports, to assist those impacted in seeking meaningful employment.
- The Impacted Fish Plant Worker Program is an example. The targeted program is focused on creating short-term employment for workers, from fish plants deemed impacted by the downturn in the fishing sector. The Fish Plant Worker Program is administered by Municipal Affairs and Environment (MAE), and impacted fish plants are identified by the Department of Fisheries and Land Resources (FLR). Once a fish plant is identified by FLR, MAE will make contact with the plant to obtain a plant worker list, as well as reach out to the community in which the plant is located to secure a sponsor. If another sponsor is needed to accommodate the workers of the impacted plant, then MAE will reach out again and pursue projects in other communities tied to those impacted workers
- As part of The Way Forward, industry and the Government of Newfoundland and Labrador collaborated, through the Cabinet Committee on Jobs, to support economic growth and foster private sector job creation. As part of this work, the Government of Newfoundland and Labrador and Newfoundland Aquaculture Industry Association Inc. jointly developed the Aquaculture Sector Work Plan, which includes actions that each of the partners will take, to achieve the collective goal of growing the aquaculture industry and stimulating new private sector employment. The Province utilized seasonal funding to create awareness, understanding and interest to promote recruitment to the industry
In FY1920, Newfoundland and Labrador supported individuals who were directly or indirectly affected by the United States' decision to impose tariffs on Canadian steel and aluminum products. To provide displaced workers with the training and employment supports they need to successfully transition to new jobs, the province supported 31 wages subsidy plans for employers to hire steel and aluminum workers, as well as provided skills training to an additional 185 individuals.
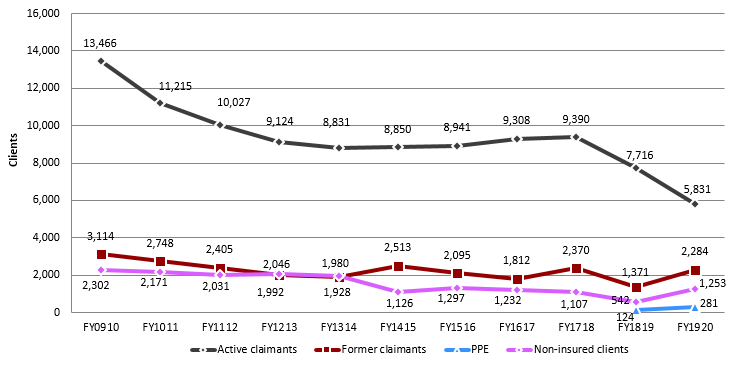
Text description of Chart 4
| FY0910 | FY1011 | FY1112 | FY1213 | FY1314 | FY1415 | FY1516 | FY1617 | FY1718 | FY1819 | FY1920 | |
|---|---|---|---|---|---|---|---|---|---|---|---|
| Active claimants | 13,466 | 11,215 | 10,027 | 9,124 | 8,831 | 8,850 | 8,941 | 9,308 | 9,390 | 7,716 | 5,831 |
| Former claimants | 3,114 | 2,748 | 2,405 | 1,992 | 1,928 | 2,513 | 2,095 | 1,812 | 2,370 | 1,371 | 2,284 |
| PPE | 124 | 281 | |||||||||
| Non-insured clients | 2,302 | 2,171 | 2,031 | 2,046 | 1,980 | 1,126 | 1,297 | 1,232 | 1,107 | 542 | 1,253 |
Text description of Chart 5
| FY0910 | FY1011 | FY1112 | FY1213 | FY1314 | FY1415 | FY1516 | FY1617 | FY1718 | FY1819 | FY1920 | |
|---|---|---|---|---|---|---|---|---|---|---|---|
| Youth (15 to 24) | 4,061 | 3,541 | 3,055 | 2,846 | 2,325 | 1,627 | 1,700 | 1,545 | 1,547 | 1,466 | 2,196 |
| Core-age (25 to 54) | 10,957 | 9,154 | 8,066 | 6,942 | 7,699 | 3,814 | 4,021 | 4,216 | 4,204 | 3,840 | 5,445 |
| Older workers (55+) | 1,341 | 1,178 | 1,124 | 1,145 | 376 | 665 | 676 | 769 | 804 | 832 | 1,126 |
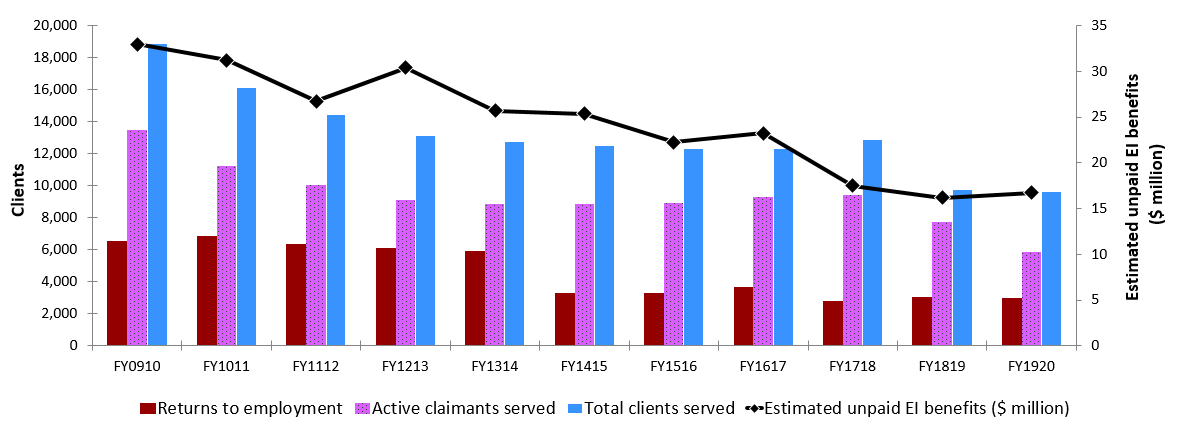
Text description of Chart 6
| FY0910 | FY1011 | FY1112 | FY1213 | FY1314 | FY1415 | FY1516 | FY1617 | FY1718 | FY1819 | FY1920 | |
|---|---|---|---|---|---|---|---|---|---|---|---|
| Returns to employment | 6,526 | 6,857 | 6,335 | 6,114 | 5,918 | 3,298 | 3,306 | 3,696 | 2,795 | 3,055 | 2,990 |
| Active claimants served | 13,466 | 11,215 | 10,027 | 9,124 | 8,831 | 8,850 | 8,941 | 9,308 | 9,390 | 7,716 | 5,831 |
| Total clients served | 18,882 | 16,134 | 14,463 | 13,162 | 12,739 | 12,489 | 12,333 | 12,352 | 12,867 | 9,753 | 9,649 |
| Estimated unpaid EI benefits ($ million) | $32.94 | $31.20 | $26.71 | $30.42 | $25.69 | $25.35 | $22.25 | $23.23 | $17.47 | $16.16 | $16.74 |
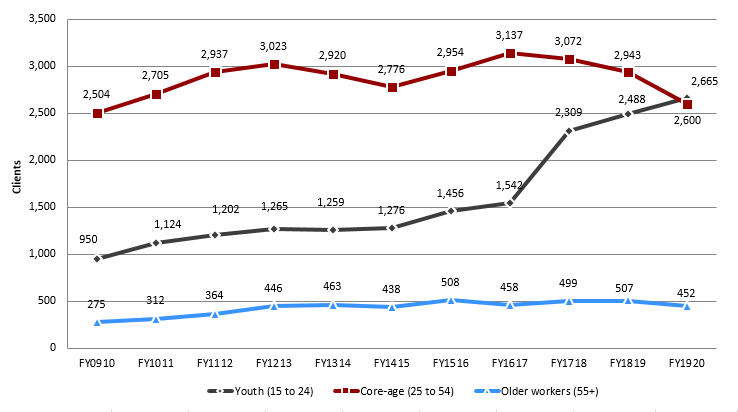
Table 7 – Newfoundland and Labrador: EBSM-similar programming, FY1920
For accessibility reasons, the table has been simplified. Consult the PDF version for the full table.
| Employment Benefits | Program name | Interventions | Year-over-year change | Expenditures ($ 000s) |
|---|---|---|---|---|
| SD-R | Newfoundland and Labrador Skills Development | 5,064 | 56.10% | 83,908 |
| SD-A | Newfoundland and Labrador Skills Development | 1,355 | -12.40% | |
| TWS | Newfoundland and Labrador Wage Subsidies | 926 | 15.50% | 7,746 |
| SE | Newfoundland and Labrador Self-Employment Assistance | 402 | 50.60% | 7,451 |
| JCP | Newfoundland and Labrador Job Creation Partnerships | 1,556 | 12.30% | 11,390 |
| Support Measures | Program name | Interventions | Year-over-year change | Expenditures ($ 000s) |
|---|---|---|---|---|
| EAS | Newfoundland and Labrador Employment Assistance Services | 15,354 | 12.20% | 12,612 |
| LMP | Newfoundland and Labrador Labour Market Partnerships | n/a | n/a | 8,447 |
| R&I | Research and Innovation | n/a | n/a | 4,030 |
3.2.2.3 Employment benefits
In FY1920, total number of Employment Benefit interventions in Newfoundland and Labrador jumped by 28.4%, to 9,303. While TWS (+124; +15.5%), SE (+135; +50.6%), JCP (+170; +12.3%) and SD-R (+1,820; +56.1%) increased, SD-A decreased by 12.4% (-192). Total expenditures towards Employment Benefits ($110.5 million) dropped by 2.5%.
Highlights of the Skills Development Employment Benefit
Client Profile: "Susan"
Susan was 56 years old when she requested assistance with job search and career planning. Upon assessment, it was determined that she had multiple barriers to employment. Susan had a grade 8 education and was unable to secure full-time sustainable employment. She began the employment planning process and enrolled in an Adult Basic Education (ABE) program, with a goal to obtain a career in the medical profession. Although the ABE program presented many challenges for this adult learner, she progressed and successfully graduated.
In January of 2020, at the age of 61, Susan successfully completed the Fast Track Acupuncture Diploma Program at the Canadian College of Acupuncture and Traditional Chinese Medicine, in Bedford Nova Scotia. She graduated with Honours and has had several job offers upon graduation. Susan started her own practice in January 2020.
In a follow up note to her Case Manager, she wrote:
Thank you so much for everything you have done for me. I am going to have an amazing career and love helping others on their journey to wellness. You know you are doing well in this field when you receive referrals from other patients. Thank you again for believing in me and giving me this fabulous opportunity to learn and succeed in a whole new career.
Client Profile: "Carol"
Carol was 45 years old when she requested assistance in securing employment. She had a history of low paying positions and found it difficult to compete for jobs in today's labour market. Carol had a learning disability, had not graduated high school, and reported that she faced many challenges in the regular school system and had dropped out. Her short-term goal was to successfully complete her high school education, and later complete a Personal Care Attendant or Practical Nursing program.
Carol's Case Manager worked collaboratively with her to get an educational assessment completed. This assessment recommended supportive services, such as tutoring, to assist her to be successful in completing her ABE program - in less weeks than recommended by the educational institution!
Carol went on to complete a Personal Care Attendant program, which resulted in full-time employment with Western Health.
3.2.2.4 Support measures: EAS
EAS interventions in Newfoundland and Labrador rose from 13,687, in FY1819, to 15,354 in FY1920, a 12.2% year-over-year growth. While Employment services (+870; +17.1%) and Individual Counselling (+4,399; +88.1%) interventions increased, Group Services (-3,602; -100.0%) declined compared to the previous fiscal year. Total EAS expenditures advanced by 25.4% to $12.6 million.
3.2.2.5 Other support measures: LMP and R&I
In FY1920, Newfoundland and Labrador's total funding for LMP and R&I reached $12.5 million (+18.0%). While funding towards LMP ($8.4 million) increased by 13.4%, R&I funding ($4.0 million) increased by 29.0%.
Activities offered under the Employer-Sponsored Training component of Labour Market Partnerships
As part of the expanded eligibility included in the amendment to the Canada-Newfoundland and Labrador LMDA signed in 2018, the province has increased flexibility to support employer-sponsored training under Labour Market Partnerships. In FY1920, 2 employers availed of this programming:
- Labrador Gem Seafood Incorporated had 40 fish plant workers in Ramea, trained in sea urchin processing, with the assistance of a consultant from Japan. Employees received an introduction to the process flow for this specialized production, followed by the provision of various tools used to generate the best quality product and actual processing. Employees were given work assignments and the instructors monitored, to determine their effectiveness in each role. A daily performance sheet was used to evaluate progress in the position. At the end of the training, a report was issued for each employee, and management decided on the most effective positioning for each person in the process flow. This training will help extend the operating season for this seafood processing facility, thereby decreasing the employee's reliance on EI benefits
- Dallas Mercer Consulting Inc. (DMC) supports hundreds of employers across Canada, by managing workers' compensation and sick leave claims. Due to a skills shortage in the field of expertise, DMC is implementing a coaching and shadowing program. DMC anticipates it will take 12 months for an inexperienced new employee to be fully trained and productive, as a DMC Disability Manager, with continued coaching as needed
During this training process, trainees will be exposed to different approaches to manage sick leave and WorkplaceNL cases, as well as collaborating on unique or challenging cases through reviews. Classroom time will be required, to learn and study all provincial legislation as it relates to workers' compensation, policies, procedures, as well as case studies to understand application.
Each trainee will get experiential learning to:
- review Workers' Compensation Monthly Cost Statements
- understand how to develop relationships with and the value of client interaction
- learn how to interact with workers and obtain answers to questions, and,
- understand what to look for when doing a case review, and where to focus attention to obtain desired outcome
This training began January 2020 and ended in December 2020.
Results/lessons learned for any research and innovation projects that concluded in FY1920.
Although most of the projects funded through the Workforce Innovation Centre were still ongoing at the time this report was made public, it is anticipated the findings from research projects will inform innovative models and best practices for labour market programs and services. Examples of promising practices include:
- evidence for Community Employment Services – Collective Interchange Cooperative (CIC) and Canadian Career Development Foundation (CCDF); $314,732
- led by CIC, in partnership with CCDF, this 3-year project is being implemented across employment support agencies within the Avalon Region of Newfoundland and Labrador. This project aims to answer 2 research questions:
- What employment support interventions will produce the best results given clients existing strengths and weaknesses?
- How can the data collected be used to create system efficiencies and ensure that services meet the client's needs, which would result in outcomes that are beneficial to clients and funders?
Through a survey of career practitioners, it was determined that an enhancement of the Performance Recording Instrument for Meaningful Evaluation (PRIME) interactive software will give employment service providers a mapping of tailored interventions and outcomes. The PRIME 2.0 system will enable meaningful recording and reporting of progress in vital client centered characteristics, which will support the evaluation of client progress and interventions.
The enhancement of PRIME 2.0 is currently being piloted by community agencies in the Avalon Region. This learning may be applied to various career and employment services contexts from community services, post-secondary, to government service delivery. Because of the research completed to date, many of the agencies will continue to use the PRIME 2.0 after the project is completed. It is anticipated the software will be expanded to other jurisdictions.
Improving Psychological Health and Safety in Health Care Workers through Technology Based Support: Project Plan – Eastern Health; $443,000
Eastern Health, in partnership with IBM, is undertaking a pilot project to test ways to improve mental health and safety through technology-based support. The project will help determine if technology based support increases employee knowledge and uptake of psychological support services. It is anticipated that this will also improve employee wellness factors and organizational healthy workplace indicators. This 3-year project will involve the development, implementation and evaluation of application based technology. This will incorporate internal and external supports to the organization, as well as a built in peer "chat" function, that will allow employees to gain timely and appropriate support, as well as information about services and supports available to them.
To date, the Employee Virtual Assistant (EVA) software was developed and launched prior to the COVID pandemic. As a first test, EVA assessed the impacts of the virus on Eastern Health workers. There is significant interest in early adoption of the tool beyond Eastern Heath, to other Health Boards in the province.
3.2.3 Prince Edward Island
In 2019, Prince Edward Island registered, for a second consecutive year, the highest real GDP growth rate among all provinces, with 5.1%, which exceeded the national growth rate (+1.9%). According to Canadian major banks forecasts, the Province's real GDP growth has contracted by 4.8% in 2020.
Prince Edward Island: EBSM key facts
For accessibility reasons, the table has been simplified. Consult the PDF version for the full table.
| Insured clients | Non-insured clients |
|---|---|
| 4,453 |
1,408 |
Total interventions: 10,387
| Intervention type | FY1920 | Year-over-year change |
|---|---|---|
| Employment Benefits | 3,525 | 0.014 |
| Support Measures: EAS | 6,862 | 0.004 |
| Intervention type | FY1920 | Year-over-year change (pp) |
|---|---|---|
| Employment Benefits | 33.9% | 0.4 |
| Support Measures: EAS | 66.1% | 0.4 |
| Intervention type | FY1920 | Year-over-year change (pp) |
|---|---|---|
| Employment Benefits | 33.9% | 0.4 |
| Support Measures: EAS | 66.1% | 0.4 |
| FY1819 | FY1920 | Year-over-year change |
|---|---|---|
| $6.66 | $6.82 | 2% |
- * Prince Edward Island invested $160,464 of its total allocation towards administration costs, representing almost 6.6% of the Budget 2017 additional funding the Province received in FY1920.
- ** Totals may not add up due to rounding; does not include accounting adjustments.
Similar to FY1819, labour market conditions in Prince Edward Island remained solid in FY1920. On a net basis, employment increased by 3,000 (+3.9%) year-over-year, almost entirely in full-time positions, which advanced from 65,100 to 67,700, while part-time positions advanced from 11,900 to 12,300. The Province's unemployment rate fell to 8.4%, representing the lowest rate since comparable data became available in FY7677. Services-producing sector (+2,500; +4.3%) provided the most new employment positions on a net basis, with major gains in public administration (+1,100; +15.4%); professional, scientific and technical services (+200; +5.2%); business, building and other support services (+200; 8.0%); educational services (+200; +4.5%); other services (+300; +10.1%); and, health care and social assistance (+800; +8.1%). Information, culture and recreation (-400; -16.3%); transportation and warehousing (-100; -3.2%); and, accommodation and food services (-100; -1.2%) were the only industries on the services side that experienced net losses. Employment in the goods-producing sector (+500; +2.6%) occurred mainly in construction (+900; +14.9%) and agriculture (+400; +8.8%). This was somewhat counterbalanced by losses in forestry, fishing, mining, oil and gas (-500; -17.9%) as well as in manufacturing (-200; -3.5%).
In FY1920, a shortage of workers in numerous industries represented the main challenge facing Prince Edward Island's labour market. In particular, rural areas experienced an acute demographic decline, affecting local economies. For FY1920, the Province developed key priorities to:
- help individuals develop the necessary skills to prepare for, find and keep employment
- assist persons with disabilities to obtain sustainable employment
- facilitate employers access to a skilled and diverse workforce, and
- ensure communities in Prince Edward Island are able to respond effectively to labour market opportunities and challenges
Besides this, in order to stimulate population growth, the government has committed to increase investments in rural settlement supports to help newcomers better integrate into smaller communities.
3.2.3.1 Managing for Results
In FY1920, PEI invested in substantial IT system updates, to improve the quantity and quality of data collected from clients, programs and outcomes from its LMDA-funded programs.
As part of the new performance measurement strategy developed with the Government of Canada, Prince Edward Island redesigned the Action Plan screens in its client management system. Beginning with the needs assessment, PEI replaced free text collection of skills, employment barriers and personal barriers with extensive pre-defined lists. The Province designed robust reports to support this data collection, allowing for better analysis and understanding of the barriers affecting clients, as well as the barriers leading to specific programming decisions.
3.2.3.2 Clients, Interventions and Expenditures
After 4 consecutive years of growth, the number of clients served in Prince Edward Island in FY1920 dropped by 8.0%, to 5,861. With the exception of former claimants, which increased by 3.8% (+27), all other client types decreased significantly: active claimants (-331; -9.1%), PPE (-17; -3.9%) and non-insured clients (-187; -11.7%). In terms of their shares relative to the total number of clients, former claimants (12.6%) increased by 1.4 percentage points while non-insured clients (24.0%) decreased by 1.0 percentage point. Other client-types shares relative to the total number of clients showed relative year-over-year stability – active claimants (56.2%; -0.7 percentage points) and PPE (7.2%; +0.3 percentage points).
The total number of interventions delivered in Prince Edward Island (10,387) remained relatively stable (+0.2%) in FY1920. With 66.1% (-0.4 percentage point) of all interventions, EAS was the most delivered intervention, whereas Employment Benefits represented 33.9% of all interventions. In total, 2,508 (+1.5%) individuals were employed after participating in an EBSM-similar intervention. Unpaid EI benefits advanced by 2.4% to $6.82 million. EBSM total expenditures reached $27.2 million (-1.8%). In addition to the Province's share of the ongoing 1.95 billion dollars in LMDA program funding ($23.9 million), expenditures included its share of the additional $250.0 million envelope announced in Budget 2017 ($2.4 million). Expenditures also included the additional targeted funding provided to support workers in seasonal industries ($525,000), as well as those affected by the trade dispute with the US in the steel and aluminum industries ($500,000).
In FY1920, Prince Edward Island increased its funding to support group-based training initiatives, to support key sectors in the Province requiring more workers. The Province has placed an increased emphasis on providing sector specific short-term training, to transition unemployed individuals back to work. Short-term training was provided to job seekers, and included a classroom component, as well as the short duration training certificates/courses (for example, first aid certifications, food safety) needed to meet specific job or industry requirements. In addition, group-based training initiatives provided job seekers with essential skills training, which included a classroom component that focused on upskilling of essential skills (literacy, numeracy, document use, writing, oral communications, thinking, digital technology, working with others or continuous learning).
Investments in targeted funding supported workers directly and indirectly affected by the lumber and steel-aluminum trade disputes, in order to support their transition to sustainable employment, through wage subsidies and training.
Text description of Chart 7
| FY0910 | FY1011 | FY1112 | FY1213 | FY1314 | FY1415 | FY1516 | FY1617 | FY1718 | FY1819 | FY1920 | |
|---|---|---|---|---|---|---|---|---|---|---|---|
| Active clients | 2,740 | 2,882 | 2,921 | 3,032 | 2,963 | 2,709 | 2,876 | 2,798 | 3,487 | 3,624 | 3,293 |
| Former clients | 487 | 572 | 574 | 708 | 703 | 621 | 657 | 709 | 784 | 712 | 739 |
| PPE | 438 | 421 | |||||||||
| Non-insured clients | 885 | 1,071 | 1,340 | 1,316 | 1,285 | 1,470 | 1,681 | 1,893 | 1,852 | 1,595 | 1,408 |
Text description of Chart 8
| Category | FY0910 | FY1011 | FY1112 | FY1213 | FY1314 | FY1415 | FY1516 | FY1617 | FY1718 | FY1819 | FY1920 |
|---|---|---|---|---|---|---|---|---|---|---|---|
| Youth (15 to 24) | 950 | 1,124 | 1,202 | 1,265 | 1,259 | 1,276 | 1,456 | 1,542 | 2,309 | 2,488 | 2,665 |
| Core-age (25 to 54) | 2,504 | 2,705 | 2,937 | 3,023 | 2,920 | 2,776 | 2,954 | 3,137 | 3,072 | 2,943 | 2,600 |
| Older workers (55+) | 275 | 312 | 364 | 446 | 463 | 438 | 508 | 458 | 499 | 507 | 452 |
Text description of Chart 9
| FY0910 | FY1011 | FY1112 | FY1213 | FY1314 | FY1415 | FY1516 | FY1617 | FY1718 | FY1819 | FY1920 | |
|---|---|---|---|---|---|---|---|---|---|---|---|
| Returns to employment | 1,839 | 2,159 | 2,034 | 1,939 | 2,194 | 1,934 | 1,997 | 2,081 | 2,202 | 2,470 | 2,508 |
| Active claimants served | 2,740 | 2,882 | 2,921 | 3,032 | 2,963 | 2,709 | 2,876 | 2,798 | 3,487 | 3,624 | 3,293 |
| Total clients served | 4,112 | 4,525 | 4,835 | 5,056 | 4,951 | 4,800 | 5,214 | 5,400 | 6,123 | 6,369 | 5,861 |
| Estimated unpaid EI benefits ($ million) | $8.92 | $9.07 | $8.16 | $7.53 | $7.19 | $6.52 | $6.99 | $7.14 | $7.13 | $6.66 | $6.82 |
Table 8 – Prince Edward Island: EBSM-similar programming, FY1920
For accessibility reasons, the table has been simplified. Consult the PDF version for the full table.
| Employment Benefits | Program name | Interventions | Year-over-year change | Expenditures ($ 000s) |
|---|---|---|---|---|
| SD-R | Training PEI—Individual | 2,538 | 5.80% | 14,394 |
| SD-A | Training PEI—Apprentice | 297 | -2.60% | |
| TWS | Employ PEI | 510 | -9.30% | 4,191 |
| SE | Self‑Employ PEI | 121 | -19.90% | 2,202 |
| JCP | Work Experience PEI | 59 | 0.00% | 779 |
| Support Measures | Program name | Interventions | Year-over-year change | Expenditures ($ 000s) |
|---|---|---|---|---|
| EAS | Employment Assistance Services | 6862 | -0.004 | 4,321 |
| LMP | Labour Market Partnerships | n/a | n/a | 1,332 |
| R&I | Research & Innovation | n/a | n/a | 0 |
3.2.3.3 Employment benefits
In FY1920, for a fifth consecutive year, Employment Benefits in Prince Edward Island increased, totalling 3,525 (+1.4%). This growth relied solely on SD-R (+140; +5.8%), which increased for a third consecutive year; whereas TWS (-52; -9.3%), SE (-30; -19.9%) and SD-A (-8; -2.6%) contracted. With 59 interventions, JCP remained unchanged year-over-year. Expenditures on Employment Benefits increased from $21.3 million to $21.6 million, a 1.1% rise over FY1819.
3.2.3.4 Support measures: EAS
In FY1920, Prince Edward Island delivered 26 fewer EAS interventions than in FY1819. The EAS intervention types moved in opposite directions, with Employment Services increasing by +1.4% (+61), to 4,563, and Individual Counselling declining by 3.6% (-87), to 2,299. Expenditures on EAS decreased by $330, 000 (-7.1%) to $4.3 million.
3.2.3.5 Other support measures: LMP and R&I
Expenditures on LMP ($1.3 million) decreased in FY1920 compared to FY1819 (-23.1%). There were no reported expenditures under R&I in FY1920.
EBSM in action
Momentum HR
Background
The Momentum HR project formerly known as the HR Specialist project was expanded in 2020 and continues to support employment and training needs of Prince Edward Island's labour market. While many SMEs are knowledgeable in the industries in which they operate, they do not have a full-time dedicated HR professional within their organization. Recruitment and retention of skilled workers in rural communities in the Province can be challenging for local employers. Human resource planning activities will ensure employers have access to a skilled and job ready workforce and increase the participation of Islanders in the labour market.
Description
Momentum HR is in its fifth year and continues to provide targeted and specialized HR supports and services to a number of small businesses in rural Prince Edward Island. The HR Specialist also works on a one-to-one basis with local businesses seeking HR advice or group training in HR practices. The scope of the project was expanded in 2020 to include a targeted training and coaching component. HR staff working in local SMEs can participate in training activities created in partnership with a local post-secondary institution to ensure they have the necessary HR skills required for their organization. Following the training, coaching is also provided to support HR staff dealing with workplace related issues.
Target Clientele
The project targets small employers in rural eastern Prince Edward Island who are seeking to build or increase HR capacity within their business.
Service Delivery
Through the Labour Market Partnership program, the Province and other funding partners provided support to a community-based organization to deliver the project.
Success Stories
The project has been very successful, a number of businesses in eastern Prince Edward Island have completed the program and more are currently enrolled. Many other businesses in the area have received assistance as it relates to HR issues relevant to their business. In addition, general HR training sessions have been available to local businesses in the area for the past 5 years.
3.2.4 Nova Scotia
In 2019, Nova Scotia's GDP rose by 2.4%, exceeding the national growth rate of 1.9%. For 2020, major Canadian banks have forecasted an average GDP contraction of 5.9%, mainly due to the COVID-19 impacts on the Province's economy. However, a relatively weak economic growth rate was expected in 2020 even before the COVID-19 crisis struck. This may be attributable to the closure of the Northern Pulp mill in January 2020, a major manufacturer that produced each year 280,000 tonnes of Kraft pulp, destined principally for export. It would generate over $200 million annually in the Province. Since many other industries were linked to the mill's supply chain, this closure has significantly affected the economy of Nova Scotia.
Nova Scotia: EBSM key facts
For accessibility reasons, the table has been simplified. Consult the PDF version for the full table.
| EI clients | Non-insured clients |
|---|---|
| 9,700 |
2,858 |
| Intervention type | FY1920 | Year-over-year change |
|---|---|---|
| Employment Benefits | 5,349 | 25.00% |
| Support Measures: EAS | 19,925 | 1.50% |
| Intervention type | FY1920 | Year-over-year change (pp) |
|---|---|---|
| Employment Benefits | 21.2% | 4.9 |
| Support Measures: EAS | 78.8% | 4.9 |
| Total expenditures | FY1920 ($ million) | Year-over-year change |
|---|---|---|
| Employment Benefits | $45.9 | 5.0% |
| Support Measures: EAS | $27.2 | 18.4% |
| LMP and R&I | $15.3 | 206.4% |
| Total expenditures** | $88.5 | 2.0% |
| FY1819 | FY1920 | Year-over-year change |
|---|---|---|
| $26.43 | $22.95 | 13.20% |
- * Nova Scotia invested $915,000 of its total allocation towards administration costs, representing 8.8% of the Budget 2017 additional funding the Province received in FY1920.
- ** Totals may not add up due to rounding; does not include accounting adjustments.
In FY1920, employment grew in Nova Scotia, totalling 460,500 (+6,800; +1.5%), mostly in part-time positions (+3,900; +4.8%), with full-time employment only growing slightly (+2,900; +0.8%), year-over-year. The unemployment rate edged up to 7.7%, compared to 7.3% in the previous year. Net employment growth in the goods-producing industries (+2,000; +2.4%) occurred mainly in construction (+500; +1.6%) and in forestry, fishing, mining, oil and gas (+1,500; +16.0%). On a net basis, services-producing industries (+4,800; +1.3%) created jobs in public administration (+1,200; +4.1%); wholesale and retail trade (+1,400; +1.8%); and, health care and social assistance (+5,200; +7.7%). Employment losses were recorded in sectors such as educational service (-1,300; -3.6%) and other services (-2,200; -11.9%).
3.2.4.1 Managing for results
Nova Scotia made significant strategic investments in the implementation of the national Target, Referral, and Feedback (TRF) system, that allows the province to reach out to new EI applicants, in order to promote programs and services that will facilitate returns to work. After a year in development, Nova Scotia TRF was launched in February 2020 as an integrated component of the provincial Labour Market Programs Support System (LaMPSS). The new system will automate the import of new EI Claimant referral contact files from the Government of Canada, create new client records or append existing records and manage the disbursement of automated contact correspondence to referral clients. The Province is able to track the response rate from clients as they register for services at Nova Scotia's Works sites, and report referral outcomes back to the Government of Canada.
Generally, the Province anticipates quicker returns to employment for the TRF clients and reduced dependence on EI. The system also allows Nova Scotia to get better precision in terms of target and reach out to those in at-risk occupations, under-represented groups, low education or low wage earners in different areas of the Province. The impacts of TRF will be monitored and assessed in more details in future editions of this report.
In addition to the TRF release, for the purpose of continuous improvement, Nova Scotia implemented 2 other releases of the LaMPSS system platform, to allow users to better document program sponsor and participant administrative information. This includes enhancements to the FAI Payment Calculator, the Multi-Year Review process and changes to help reduce the need for agreement amendments. A number of improvements have also been made to the LaMPSS Data Warehouse environment, in order to make adhoc reporting much faster, easier and more robust.
Nova Scotia completed a Lean Six Sigma review of the Self-Employment Benefit (SEB) program. The intent of the review was to uncover and understand the delivery of the SEB program. Although SEB service providers are responsible for the delivery of the program content (training, workshops, one-on-one support), it was not clear what training and / or workshops were offered, when these are offered and by whom, as well as what is the level of support provided to each participant. Therefore, it was unclear if the SEB program was running efficiently and effectively to meet program outcomes. It is the intent that the findings of the SEB program review will assist Employment Nova Scotia (ENS) in future program planning.
The SEB review consisted of in-person interviews, with 15 SEB Service Providers, conference calls, with a selection of 8 Employment Assistance Service Providers, 4 regional in-person Lean sessions with ENS staff, an analysis of administrative and contractual data, as well as the analysis of survey data collected from current and past SEB applicants to the program, from April 1, 2013 to March 31, 2018 (regardless of whether they had their applications approved or not). Activities of the review began in September 2018 and concluded in June 2019.
Through this review, it was determined that the programming offered by the SEB Service Providers varied across the Province, and the level of support provided to each participant was inconsistent and dependent on the capacity of the SEB Coordinator. The referral and intake process of the SEB program creates a lot of confusion and places a significant burden on the applicant, due to its "back and forth" nature. However, it was determined that the SEB program does provide education and training that is expanding business development opportunities, creating a community of entrepreneurship, as well as offering networking possibilities to grow the economy of Nova Scotia.
In total, 13 recommendations were presented to ENS in order to improve the delivery of the SEB program. As a next step, the Planning and Excellence Team is working in partnership with Employment Nova Scotia in the scope development, procurement and recruitment of the parties necessary to implement a number of the recommendations. This is anticipated to take place in early 2021.
Nova Scotia also completed a Lean Six Sigma review of the START Program (Targeted Wage Subsidy). The review began in 2018 and was completed in FY1920. It included stakeholder consultation and evaluation, as well as Lean assessment of program delivery.
- Key findings:
- START is offering valued employment attachment and work experience for job seekers, while aiding employers in adding capacity to their business
- Recommendation highlights:
- develop approach to increased wrap-around supports (for example, pre-employment preparations and soft skills training for job seekers) to improve retention
- increase program promotion
- solidify roles and responsibilities within the program regarding government administration, service provider role and the employer's role
- develop ways to support diverse hiring (for example, hiring bonuses and wrap-around supports for employers, to prepare for hiring diverse candidates)
Nova Scotia Works (NSW) Program (Employment Assistance Services Program):
- a new funding model was instituted in January 2020. It includes an accountability framework for socio economic impacts and performance incentives for achievement of outcomes for our NSW delivery partners
Skills Development Program:
- implemented the Skills Development Program Labour Force Attachment pilot for underrepresented groups in the labour market
- improved accessibility supports for clients − a more streamlined approval process to support participants, of the province's Skills Development Program, who require disability related services and equipment was implemented in Fall of 2019
START (Targeted Wage Subsidy) and Job Creation Partnership (JCP) Programs:
- implemented a Family Hiring Policy (Fall 2019) for START and JCP to encourage a fair and transparent hiring and selection process for job placements. The policy also supports the employment of individuals from certain groups that are underrepresented in the labour market
3.2.4.2 Clients, interventions and expenditures
In FY1920, the total number of clients served in Nova Scotia decreased, reaching 12,558 (-18.7%). While PPE (1,045) remained stable year-over-year, former claimants (2,119) increased by 11.5%; while active claimants (6,536) and non-insured clients (2,858) dropped by 31.0% and 6.0%, respectively. The decline in active claimants can largely be attributed to the Labour Force Attachment (LFA) policy change that tightened eligibility for the Feepayer program. This program allows laid off workers to invest in their own training and continue to receive their regular EI benefits while in training. There was a drop of 1,611 Feepayer program applicants in FY1920, which accounts for 17% of the 31% decline in active claimants served. The number of non-insured clients decreased for a third consecutive year.
As for their shares of the total number of clients, active claimants declined by 9.3 percentage points to 52.0%, while former claimants (16.9%), PPE (8.3%) and non-insured clients (22.8%) advanced by 4.6, 1.6, and 3.1 percentage points, respectively. The total number of interventions delivered in Nova Scotia declined for a third consecutive year, totalling 25,274 in FY1920, decreasing by 7.7% year-over-year. The province is also undertaking a review of how interventions are documented and tracked, to improve the activity measurement process. At 78.8% (+4.9 percentage points) of all interventions, EAS-interventions remained the most used intervention type in Nova Scotia.
A total number of 3,834 insured clients returned to work after participating in an EBSM-similar program, which is 1,241 (-24.5%) less than in FY1819. The decrease in insured clients employed is largely due to administrative and system issues that are being investigated by Nova Scotia and the Government of Canada. An estimated 1,850 employed results were incorrectly deducted from the total, which would bring the count to 5,684; which would be 609 more than in FY1819 (+12%). Unpaid EI benefits fell from $26.43 million to $22.95 million, representing a 13.2% year-over-year decline.
In addition to the Province's share of the ongoing $1.95 billion dollars in LMDA program funding ($77.5 million), some expenditures were also drawn from the additional $250 million LMDA envelope announced in Budget 2017 ($10.3 million, of which $915,000 was used towards administration costs). The Province also fully invested the additional targeted funding made available to support workers in seasonal industries, which was $1.6 million. Nova Scotia did not access the $500,000 additional funding to help workers in steel and aluminum industries affected by the U.S. trade dispute.
In recent years, the Government of Nova Scotia has been working closely with seasonal industries including tourism, fisheries and agriculture, to better support their need to address workforce challenges. Through recent workforce studies and available labour market information, it has been determined the tourism, fisheries and agricultural sectors all have workers who experience unique challenges due to the cyclical nature of their work. Ongoing work with these sectors and discussions with Tourism Nova Scotia, the Department of Agriculture and the Department of Fisheries and Aquaculture, have determined training to be a need.
Under the LMDA-funded Sector Council Program, the Nova Scotia Tourism Human Resource Sector Council and the Nova Scotia Fisheries Human Resource Sector Council used the targeted funding to provide support to seasonal industry sectors for recruitment, attraction, retention, and training of workers.
The additional targeted funding will also allow for the provision of skills training to those most in need in these sectors and allow these individuals to increase their employability skills, essential skills, as well as their technical skills. This work will continue into FY2021 to fully assess the impact of the COVID-19 crisis on these seasonal industries and to deliver customized solutions, where appropriate.
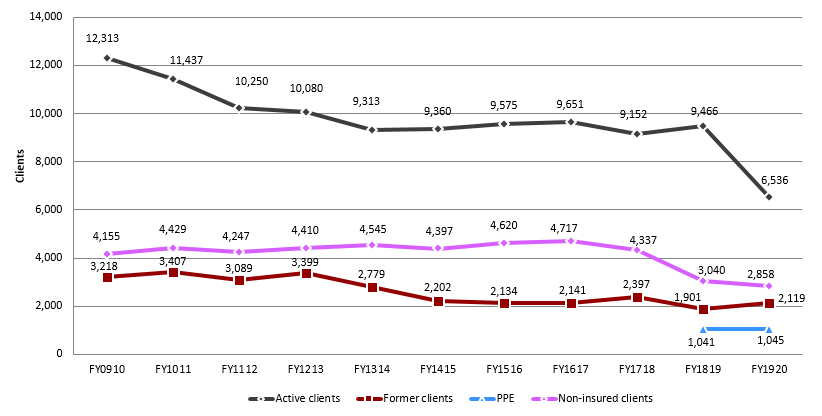
Text description of Chart 10
| FY0910 | FY1011 | FY1112 | FY1213 | FY1314 | FY1415 | FY1516 | FY1617 | FY1718 | FY1819 | FY1920 | |
|---|---|---|---|---|---|---|---|---|---|---|---|
| Active clients | 12,313 | 11,437 | 10,250 | 10,080 | 9,313 | 9,360 | 9,575 | 9,651 | 9,152 | 9,466 | 6,536 |
| Former clients | 3,218 | 3,407 | 3,089 | 3,399 | 2,779 | 2,202 | 2,134 | 2,141 | 2,397 | 1,901 | 2,119 |
| PPE | 1,041 | 1,045 | |||||||||
| Non-insured clients | 4,155 | 4,429 | 4,247 | 4,410 | 4,545 | 4,397 | 4,620 | 4,717 | 4,337 | 3,040 | 2,858 |
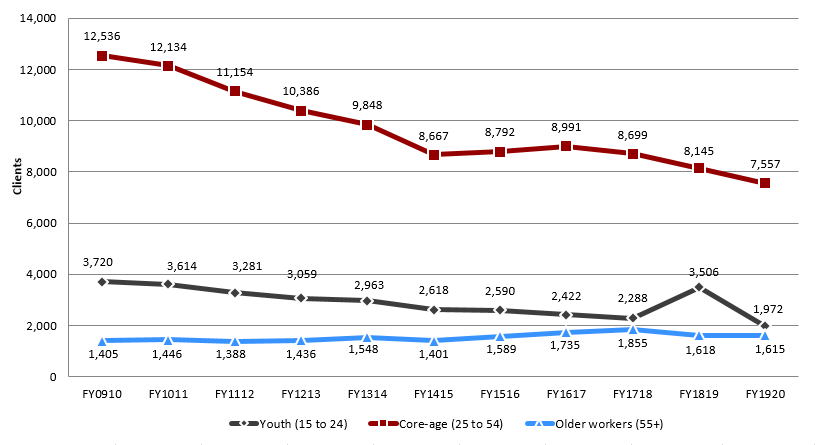
Text description of Chart 11
| FY0910 | FY1011 | FY1112 | FY1213 | FY1314 | FY1415 | FY1516 | FY1617 | FY1718 | FY1819 | FY1920 | |
|---|---|---|---|---|---|---|---|---|---|---|---|
| Youth (15 to 24) | 3,720 | 3,614 | 3,281 | 3,059 | 2,963 | 2,618 | 2,590 | 2,422 | 2,288 | 3,506 | 1,972 |
| Core-age (25 to 54) | 12,536 | 12,134 | 11,154 | 10,386 | 9,848 | 8,667 | 8,792 | 8,991 | 8,699 | 8,145 | 7,557 |
| Older workers (55+) | 1,405 | 1,446 | 1,388 | 1,436 | 1,548 | 1,401 | 1,589 | 1,735 | 1,855 | 1,618 | 1,615 |
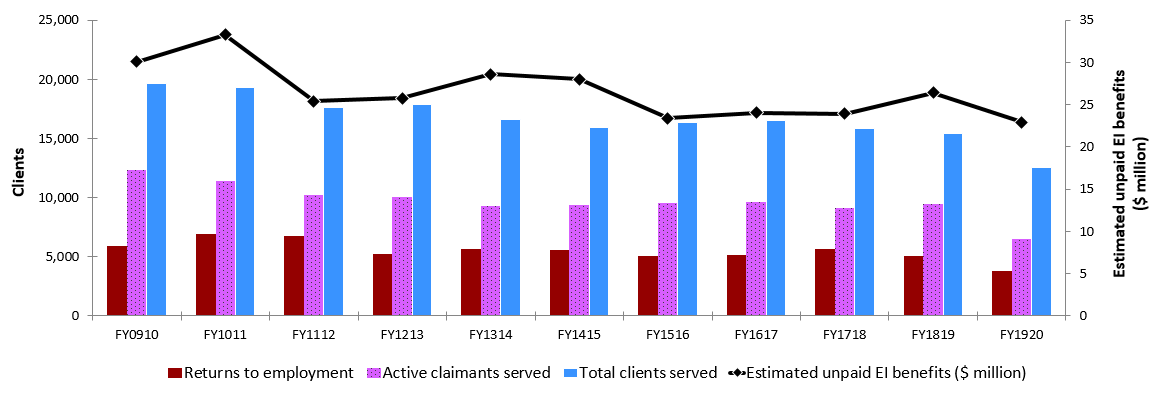
Text description of Chart 12
| FY0910 | FY1011 | FY1112 | FY1213 | FY1314 | FY1415 | FY1516 | FY1617 | FY1718 | FY1819 | FY1920 | |
|---|---|---|---|---|---|---|---|---|---|---|---|
| Returns to employment | 5,908 | 6,942 | 6,734 | 5,259 | 5,680 | 5,608 | 5,100 | 5,153 | 5,624 | 5,075 | 3,834 |
| Active claimants served | 12,313 | 11,437 | 10,250 | 10,080 | 9,313 | 9,360 | 9,575 | 9,651 | 9,152 | 9,466 | 6,536 |
| Total clients served | 19,686 | 19,273 | 17,586 | 17,889 | 16,637 | 15,959 | 16,329 | 16,509 | 15,886 | 15,448 | 12,558 |
| Estimated unpaid EI benefits ($ million) | $30.09 | $33.28 | $25.38 | $25.75 | $28.60 | $28.00 | $22.95 | $22.95 | $22.95 | $22.95 | $22.95 |
Table 9 – Nova Scotia: EBSM-similar programming, FY1920
For accessibility reasons, the table has been simplified. Consult the PDF version for the full table.
| Employment Benefits | Program name | Interventions | Year-over-year change | Expenditures ($ 000s) |
|---|---|---|---|---|
| SD-R | Nova Scotia Skills Development | 1,710 | -51.30% | 34,346 |
| SD-A | Nova Scotia Skills Development | 1,725 | -14.10% | |
| TWS | START | 1192 | 28.40% | 4,123 |
| SE | Nova Scotia Self-Employment Benefit | 570 | 2.20% | 6,191 |
| JCP | Nova Scotia Job Creation Partnerships | 152 | 14.30% | 1,280 |
| Support Measures | Program name | Interventions | Year-over-year change | Expenditures ($ 000s) |
|---|---|---|---|---|
| EAS | Nova Scotia Employment Assistance Services | 19,925 | -1.50% | 27,249 |
| LMP | Nova Scotia Labour Market Partnerships | n/a | n/a | 11,479 |
| R&I | Research and Innovation | n/a | n/a | 3,822 |
3.2.4.3 Employment benefits
In FY1920, Nova Scotia delivered a total of 5,349 (-25.0%) Employment Benefits compared to 7,136 in FY1819. A policy change around client eligibility for the Feepayer program (SD-R) impacted this decline the most (-1,800; -51.3%), followed by SD-A (-282; -14.1%); whereas TWS (264; +28.4%), SE(12; +2.2%) and JCP (19; +14.3%) advanced. Expenditures on Employment Benefit interventions declined by $2.4 million (-5.0%) year-over-year, to $45.9 million in FY1920.
Skills Development Program provides successful training to a single parent
In February 2018, a single parent of 2 small children was referred to our Nova Scotia Works (NSW) office by the Department of Community Services. He wanted to explore funding options to return to school to study a trade. While he had some education and work experience, it was not enough to make him marketable to new employers, particularly after moving to rural Nova Scotia.
Through career decision making the client decided he wanted to study the two-year Welding program at the Burridge campus of the Nova Scotia Community College. He worked with his Case Manager to submit an application for Skills Development funding and was successful in securing funds to study this program.
Both prior to and during his schooling the client faced many unexpected barriers/life situational challenges, including unexpectedly having to find new housing, losing childcare, having his vehicle break down, along with other situations that left him scrambling many times. Fortunately, he did not let these incidents defeat him, and he kept pushing to stay in the Welding program and complete his educational goal.
In May 2020, the client graduated from the Welding program and has started his career as a professional Welder. No longer a student, he now keeps busy working full-time, caring for his 2 boys, and most recently has begun volunteering as a Fire Fighter. He has also begun living his best life as an openly queer trans man and is engaged. Not only does he continue to be an invaluable member of his family but is also an important member of his local economy and community.
3.2.4.4 Support measures: EAS
Nova Scotia delivered a total number of 19,925 EAS interventions in FY1920, 307 (-1.5%) fewer interventions than in FY1819. This drop is mainly attributed to Group Services (-808; -100%) as Employment Service and Individual Counselling increased by 375 (+2.1%) and 126 (+6.8%), respectively. Overall expenditures on EAS decreased by $6.1 million year-over-year, to $27.2 million in FY1920.
EAS program helps a newcomer obtain full-time employment
Suvarna Hyma Phani Sarvepalli is an internationally trained accountant with over 10 years work experience in India. In October 2018, she immigrated to Canada with her husband and children with the hopes of continuing to work in her profession in Nova Scotia. To help her during her job search journey she contacted the Immigrant Services Association of Nova Scotia (ISANS) and started participating in various employment interventions and working with an Employment Specialist about 2 months after she arrived.
Suvarna's largest employment barrier was her interview skills. She had difficulty providing enough detail in her examples due to nerves and lack of interview practice. At the beginning of her job search, she got many interviews for accounting relating jobs but none of those interviews turned into real job offers. To help her pass these interviews we referred her to multiple mock/practice interview sessions with volunteer HR professionals at ISANS but nothing seemed to stick.
By spring 2019, her confidence levels in finding a job had decreased to the point where finding a job seemed almost impossible. This is when she started to commit to participating in more employment interventions. First, she took our online Job Search Strategies workshop, which is a 6-module workshop that teaches clients about resume writing, cover letter writing, interview preparation, networking, and Canadian workplace culture. As she took this workshop, she continued to work one-on-one with her Employment Specialist to improve these skills.
To help connect her to employers in her field she was referred to our Skills Match online recruitment tool and to an in-person recruitment session with MUFG Fund Services Ltd. She was also referred to our Professional Placement Program where she was eventually connected and placed in a 6-week voluntary work experience as a Bookkeeper with Templeton Properties on September 2019. Her manager was so impressed with her work during the placement that they wanted to hire her as a paid full-time employee, however, because they were a small company they did not have the financial means to do so.
To help alleviate this problem Suvarna and the company applied for funding under the NS START program. The funding was approved and after almost 1 year after immigrating to Canada Suvarna started her paid 8-month placement with Templeton Properties as a Bookkeeper on October 2019. After the contract ended in June 2020 she was hired on as a full-time employee and has been happily working there ever since.
Without the NS START program and various ISANS employment interventions, Suvarna would have continued to struggle to get her first Canadian job in her field. She plans to continue to grow in her field and after her maternity leave next year, she will start her journey to gain CPA licensure with financial support through the Atlantic Immigrant Career Loan Fund to complete the certification process, and she hopes to attend ISANS financial services bridging program to help her on this path.
3.2.4.5 Other support measures: LMP and R&I
Expenditures on LMP more than doubled in FY1920 ($11.5 million) compared to FY1819 ($4.7 million), while funding of R&I initiatives declined by 23.4% year-over-year, to $0.3 million in FY1819.
Nova Scotia funded 4 projects under the Research and Innovation support measure in FY1920. Although none concluded during the year, here is how they have progressed so far:
- development continues on the Digital Nova Scotia platform, which will significantly enhance the Province's on-line presence for employment and training information and assisted service capacity
- an agreement with Mount St. Vincent University in Halifax will help develop a Centre for Digital Learning, which will be a resource and provide on-line learning best practice support for a number of universities and Nova Scotia Community College campuses in the region
- Nova Scotia has invested in the Programme for the International Assessment of Adult Competencies (PIAAC), an international initiative to survey adults in areas such as literacy, numeracy and problem solving skills. The investment will fund the entire sampling needs for Nova Scotia in the next PIAAC cycle
- Nova Scotia continues to partner with Phoenix Youth Programs, to fund a pilot workplace attachment program for under-represented groups, and the project will work in collaboration with the Centre for Employment Innovation at St. Francis Xavier University. The project will run until Oct 2020
3.2.5 New Brunswick
In 2019, New Brunswick's real GDP increased by 1.2%, which was below the national growth rate (+1.9%). In 2020, New Brunswick's real GDP is forecast to have dropped by about 4.3%, with the Province's resource industries significantly affected by the impacts of the COVID-19 crisis and an already struggling export sector prior to the pandemic.
New Brunswick: EBSM key facts
For accessibility reasons, the table has been simplified. Consult the PDF version for the full table.
| Insured clients | Non-insured clients |
|---|---|
| 14,711 |
7,286 |
| Intervention type | FY1920 | Year-over-year change |
|---|---|---|
| Employment Benefits | 13,346 | 4.60% |
| Support Measures: EAS | 31,395 | 10.80% |
| Intervention type | FY1920 | Year-over-year change (pp) |
|---|---|---|
| Employment Benefits | 29.80% | 1.3 |
| Support Measures: EAS | 70.20% | 1.3 |
| Total expenditures | FY1920 ($ million) | Year-over-year change |
|---|---|---|
| Employment Benefits | $73.30 | 6.20% |
| Support Measures: EAS | $8.50 | 10.60% |
| LMP and R&I | $17.50 | 41.10% |
| Total expenditures* | $99.20 | 1.10% |
| FY1819 | FY1920 | Year-over-year change |
|---|---|---|
| $25.00 | $26.37 | 5.50% |
- * Totals may not add up due to rounding; does not include accounting adjustments.
Leading up to the pandemic, labour market conditions had been relatively stable in New Brunswick. Employment (+1,300; +0.4%) edged up slightly year-over-year between FY1819 and FY1920, with the unemployment rate unchanged at 8.0%. On a net basis, employment increases occurred almost entirely in the goods-producing sector, mainly in construction (+1,800; +7.6%), with a drop in manufacturing (-900;-2.8%). In the services-producing sector, net gains recorded in professional, scientific and technical services (+1,200; +7.4%); health care and social assistance (+900; +1.4%); and public administration (+1,000; +4.1%) were somewhat offset by net job losses in accommodation and food services (-2,000; -8.7%).
New Brunswick's economy and labour force continued to face on-going challenges such as slow population growth, an aging population and net out-migration of youth and skilled workers. The Province also continued to experience a high unemployment rate relative to the rest of Canada. Although relatively poor economic and workforce growth is expected over the short-term, many job openings will still be in demand as a result of high replacement demand (for example, retirements). New Brunswick continues to focus on attracting, retaining and educating a highly skilled workforce. To ensure New Brunswick can be responsive to labour market challenges and opportunities, the Province plans to continue to:
- collaborate with employers and workers to respond and support them in addressing their workforce as well as training needs
- promote and increase adult literacy, essential skills and continuous learning
- increase participation in post-secondary education
- increase the size, skill level and productivity of New Brunswick's work force
- improve access to and dissemination of relevant labour market information, and
- invest in innovative programs and services including workplace learning, upskilling employees and experiential learning as well as on the job training
3.2.5.1 Managing for results
FY1920 saw further implementation of Human Resource Support Services (HRSS). As an employer case management process, HRSS assists employers in assessing their human resource needs, recommends options and supports their implementation. HRSS also helps employers in management of the people within their business, which includes attracting and retaining the right workers to meet operational needs. A new system was contracted to gather and track the case management of employers being served under HRSS. This in turn will provide a source of local labour market information, supporting current and future evidence-based decision making as it concerns employer initiatives.
During FY1920, the implementation of the Workplace Connections (WPC) service started. This new tool is a client focused wage subsidy service. A placement under WPC is initiated because of a client's employment action plan. Whether career exploration, skills enhancement or experiential in nature, such a need can be fulfilled by contracting an appropriate employer to act as a mentor, while providing a work placement to the client.
As a result of the COVID-19 pandemic, the Province's initiative to offer New Brunswick employers and job seekers a virtual environment to attend job fairs was thrust into implementation at the end of FY1920. The Virtual Job Fair platform has allowed the Province to put on Job Fairs during the pandemic, while easily abiding by physical distancing restrictions. The events have become in high demand by New Brunswick's partner departments and other jurisdictions. Not only does the platform allow for such activity to continue during the COVID-19 crisis, it also allows Job Seekers from across the nation and beyond to attend the job fair, if desired. This represents an additional tool to facilitate recruitment activities with and for the employers of New Brunswick.
3.2.5.2 Clients, interventions and expenditures
In FY1920, the total number of clients served in New Brunswick grew by 2.2% (+470) to 21,997. While non-insured clients (7,286) dropped by 3.5% year-over-year, active claimants (10,716), former claimants (2,595) and PPE (1,400) increased by 3.2%, 14.7% and 5.5%, respectively. With respect to their shares of the total number of clients served, non-insured clients (33.1%) decreased by 2.0 percentage points, as active claimants (48.7%), former claimants (11.8%) and PPE (6.4%) rose by 0.4, 1.3 and 0.2 percentage points, respectively.
In FY1920, New Brunswick delivered 3,643 more interventions (+8.9%) than in FY1819, for a total of 44,741. At 70.2% of all interventions, EAS remained the most used intervention type in the Province. In total, 8,848 individuals (+10.2%) were employed after participating in an EBSM-similar intervention. Unpaid EI benefits advanced from $25.00 million to $26.37 million, a year-over-year increase of 5.5%. Total expenditures on EBSMs ($99.2 million) rose by 1.1% year-over-year. These expenditures include the Province's shares of the ongoing $1.95 billion in LMDA program funding ($88.9 million) and the $10.0 million as part of the total $250.0 million envelope in additional funding announced in Budget 2017.
New Brunswick only requested $1.1 million to support workers in seasonal industries in FY1920, of the $2.2 million made available.
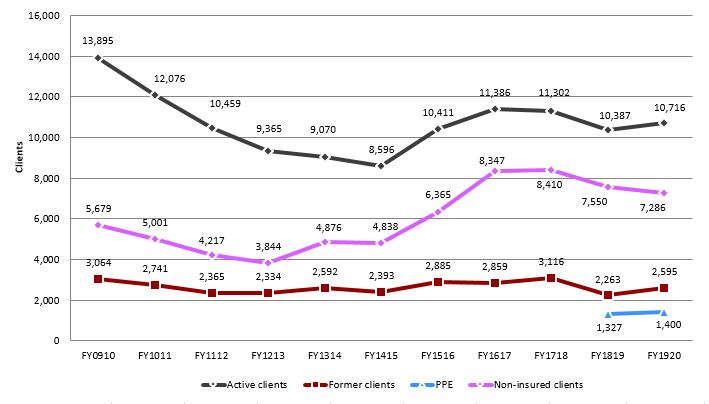
Text description of Chart 13
| FY0910 | FY1011 | FY1112 | FY1213 | FY1314 | FY1415 | FY1516 | FY1617 | FY1718 | FY1819 | FY1920 | |
|---|---|---|---|---|---|---|---|---|---|---|---|
| Active clients | 13,895 | 12,076 | 10,459 | 9,365 | 9,070 | 8,596 | 10,411 | 11,386 | 11,302 | 10,387 | 10,716 |
| Former clients | 3,064 | 2,741 | 2,365 | 2,334 | 2,592 | 2,393 | 2,885 | 2,859 | 3,116 | 2,263 | 2,595 |
| PPE | 1,327 | 1,400 | |||||||||
| Non-insured clients | 5,679 | 5,001 | 4,217 | 3,844 | 4,876 | 4,838 | 6,365 | 8,347 | 8,410 | 7,550 | 7,286 |
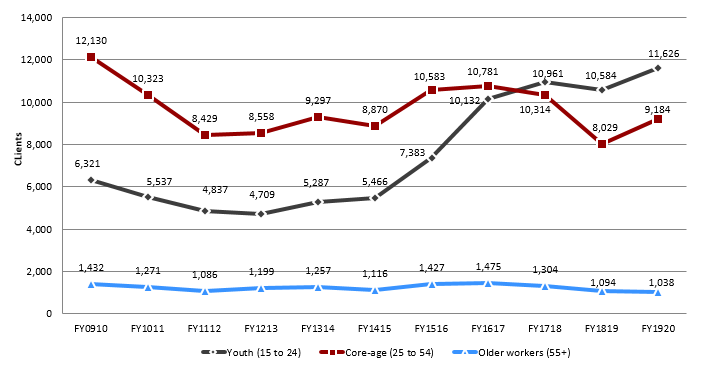
Text description of Chart 14
| FY0910 | FY1011 | FY1112 | FY1213 | FY1314 | FY1415 | FY1516 | FY1617 | FY1718 | FY1819 | FY1920 | |
|---|---|---|---|---|---|---|---|---|---|---|---|
| Youth (15 to 24) | 6,321 | 5,537 | 4,837 | 4,709 | 5,287 | 5,466 | 7,383 | 10,132 | 10,961 | 10,584 | 11,626 |
| Core-age (25 to 54) | 12,130 | 10,323 | 8,429 | 8,558 | 9,297 | 8,870 | 10,583 | 10,781 | 10,314 | 8,029 | 9,184 |
| Older workers (55+) | 1,432 | 1,271 | 1,086 | 1,199 | 1,257 | 1,116 | 1,427 | 1,475 | 1,304 | 1,094 | 1,038 |
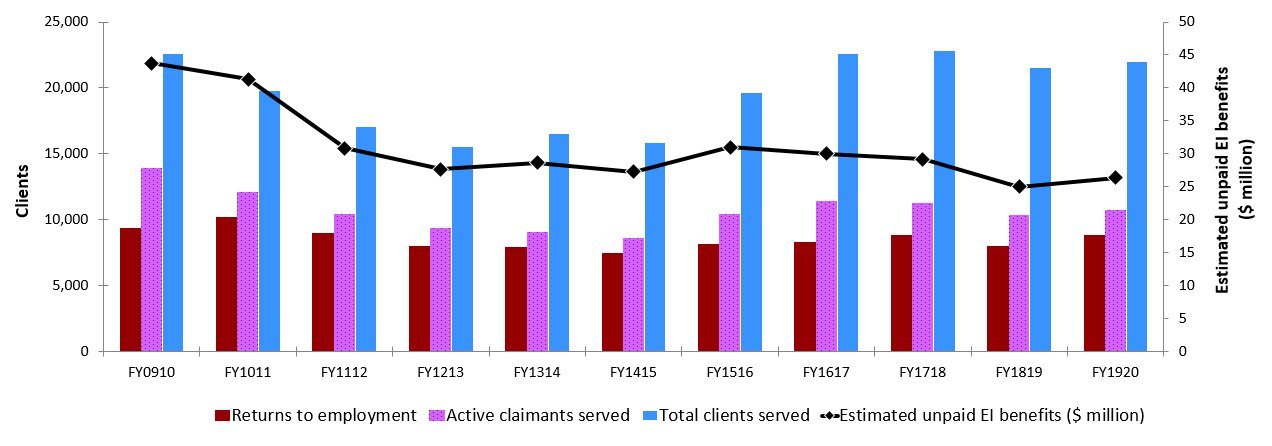
Text description of Chart 15
| FY0910 | FY1011 | FY1112 | FY1213 | FY1314 | FY1415 | FY1516 | FY1617 | FY1718 | FY1819 | FY1920 | |
|---|---|---|---|---|---|---|---|---|---|---|---|
| Returns to employment | 9,367 | 10,193 | 9,017 | 8,015 | 7,927 | 7,471 | 8,179 | 8,300 | 8,800 | 8,031 | 8,848 |
| Active claimants served | 13,895 | 12,076 | 10,459 | 9,365 | 9,070 | 8,596 | 10,411 | 11,386 | 11,302 | 10,387 | 10,716 |
| Total clients served | 22,638 | 19,818 | 17,041 | 15,543 | 16,538 | 15,827 | 19,661 | 22,592 | 22,828 | 21,527 | 21,997 |
| Estimated unpaid EI benefits ($ million) | $43.73 | $41.33 | $30.85 | $27.65 | $28.67 | $27.25 | $31.02 | $30.01 | $29.14 | $25.00 | $26.37 |
Table 10 – New Brunswick: EBSM-similar programming, FY1920
For accessibility reasons, the table has been simplified. Consult the PDF version for the full table.
| Employment Benefits | Program name | Interventions | Year-over-year change | Expenditures ($ 000s) |
|---|---|---|---|---|
| SD-R | Training and Skills Development Program | 8,148 | 13.0% | 54,116 |
| SD-A | Training and Skills Development Program | 2,096 | 2.0% | |
| TWS | Workforce Expansion—Employer Wage Subsidy | 2842 | -12.7% | 14,135 |
| SE | Workforce Expansion—Self-Employment Benefit | 260 | 4.8% | 5,071 |
| Support Measures | Program name | Interventions | Year-over-year change | Expenditures ($ 000s) |
|---|---|---|---|---|
| EAS | Employment Assistance Services | 31,395 | 10.8% | 8,470 |
| LMP | Adjustment Services | n/a | n/a | 17,348 |
| R&I | Research and Innovation | n/a | n/a | 105 |
3.2.5.3 Employment benefits
For a sixth consecutive year, New Brunswick delivered a growing number of Employment Benefit interventions, totaling 13,346 (+4.6%) in FY1920. With the exception of TWS (-412; -12.7%), all other benefit types increased: SE (+12; +4.8%), SD-R (+940; +13.0%) and SD-A (+42; +2.0%). Expenditures towards Employment benefits dropped by $4.8 million (-6.2%) to $73.3 million, mainly due to 16% decrease on spending toward Targeted Wage Subsidies.
3.2.5.4 Support measures: EAS
In FY1920, New Brunswick delivered 3,061 additional EAS interventions (+10.8%) over the previous fiscal year, for a total of 31,395. Both Employment Services (9,148) and Individual Counselling (22,247) advanced by 1.8% and 15.0%, respectively. The province's expenditures on EAS ($8.5 million) increased by about $800,000 (+10.6%).
In FY1920, New Brunswick spent $412,764 of the $1.1 million of additional targeted funding received in supports of workers in seasonal industries. The spending was divided between $277,064 under the Employment Assistance Services (EAS) program and $135,700 under Labour Market Partnerships for projects/strategies in support of human resource planning and dealing with labour market adjustments.
3.2.5.5 Other support measures: LMP and R&I
For a fourth consecutive year, expenditures on other support measures rose in New Brunswick, reaching $17.5 million (+41.1%) in FY1920. While expenditures on LMP continued to grow for the fourth consecutive year, those on R&I declined over the same period. In FY1920, New Brunswick spent $17.3 million (+43.7%) for LMP and about $100,000 (-64.3%) for R&I.
EBSMs-in-Action
"When clients enter our office, the real struggles don't always present themselves, however with this client she was always self-aware and upfront with her barriers. Prior to coming to a Working NB office, this client had been referred for Employment Counselling services with an EAS contract by her Social Development (SD) Case Manager. She had worked off and on with this service for 10 years wanting to improve her life, she just was not in a position to realize those goals yet, she was a single mother and providing for her child was her priority. She came with great challenges at times because she is a vocal person and her opinions, comments or view points weren't always welcomed or heard. She battled financial hardship, past mistakes and a tainted reputation for someone trying to remake her life in rural NB. She would go on to get her GED through the Community Adult Learning Program (CALP). This client is very intelligent but life's circumstances and this client's past decisions impeded her from graduating from high school in the traditional way. Her biggest turning point was during her time in the Experiential Learning and Employment class. She was a leader, she found her stride, and she made connections and completed this program with flying colours. You could see the confidence building and the critical thinking begin as she navigated her own path to the next steps. Her goal was always to show her son to work hard and you will have more opportunities. She did not want him to have the same hardships she had, she did not want him to have too much pride to ask for help. She often claims to tell friends, neighbours and anyone who needs it about our services and the help that is available.
After overcoming one of her biggest barriers to employment, this client was selected for sponsorship to receive a pardon. This client does not hide the fact that she made bad decisions previously in her life and that has caused many struggles. She put in the work and built the networks to finally overcome this major hurdle preventing her from moving forward with her path to employment. Her story is one of many layers and was featured in the NB magazine AgelessNB.
She was ready for the next phase. She applied and was accepted to a program at New Brunswick Community College (NBCC). Despite COVID-19, this client continued to excel in her education and graduated. The client spent the next few months job searching and found a few hours each week doing book work for small businesses. This client had applied for several jobs and worked with her employment counsellor to discuss potential employers, review her resumé, and discuss the interview process to secure full-time employment. This client had come full circle and was ready for work. With her determination and some creativity from our office we found a fit directly related to her field of study. When the client found out about this opportunity from the employer she contacted our office and was elated. She said "my son is going to be so proud" to which I said "yes he will and you also should be proud of yourself" and she said "I am".
The impact we have had on this client is life changing but in turn the impact this client has had on us is equally rewarding. Our services both internally and externally contributed to this client's ability to succeed and also provide the skills to be self-sufficient."
3.2.6 Québec
In 2019, Quebec's real GDP grew by 2.7%, outpacing the 1.9% growth recorded nationally. For 2020, estimates point to a contraction in the economy of around 6.0%. This sharp decline in growth is due primarily to the impacts of COVID-19 on the Province's economy.
Quebec: EBSM Key Facts
For accessibility reasons, the table has been simplified. Consult the PDF version for the full table.
| EI clients | Non-insured clients |
|---|---|
| 147,844 |
51,110 |
| Interventions type | FY1920 | Year-over-year change |
|---|---|---|
| Employment Benefits | 32,485 | 2.2% |
| Support Measures: EAS | 214,314 | 9.7% |
| Interventions type | FY1920 | Year-over-year change (pp) |
|---|---|---|
| Employment Benefits | 13.2% | 0.9 |
| Support Measures: EAS | 86.8% | 0.9 |
| Total expenditures | FY1920 ($ million) | Year-over-year change |
|---|---|---|
| Employment Benefits | $356.00 | 6.6% |
| Support Measures: EAS | $141.80 | 3.2% |
| LMP and R&I | $139.50 | 18.4% |
| Total expenditures** | $637.40 | 6.5% |
| FY1819 | FY1920 | Year-over-year change |
|---|---|---|
| $293.92 | $302.81 | 3.0% |
- * Quebec invested $6.6 million of its total allocation towards administration costs, representing 10% of the Budget 2017 additional funding the Province received in FY1920.
- ** Totals may not add up due to rounding; does not include accounting adjustments.
In FY1920, Quebec's labour force grew to 4,542,500 (+1.4%). Consistent with previous fiscal years, employment increased (+67,700; +1.6%), from 4,236,200 to 4,303,800, primarily in full-time positions (+64,800; +1.9%). For a fourth consecutive year, the unemployment rate declined to 5.3% in FY1920, a marginal decrease of 0.2 percentage points.
Both the goods-producing sector (+28,700; +3.3%) and the services-producing sector (+39,000; +1.2%) contributed significantly to the increase in employment. Within the goods-producing sector, employment increased in construction (+22,200; +8.9%) and manufacturing (+10,500; +2.2%), while it contracted in utilities (-2,500; -9.2%). The services sector saw net gains in the transportation and warehousing (+19,500; +8.8%); finance, insurance, real estate, rental, and leasing (+8,700; +3.7%); professional, scientific, and technical services (+12,400; +3.7%); education (+7,700; +2.6%); public administration (+5,400; +2. 2 percent); and, health care and social assistance (+17,000; +2.9%). However, this increase was partially offset by significant net losses in business, building and other support services (-20,300; -10.7%); and accommodation and food services (-17,600; -6.6%).
In its strategic plan for the 2019 to 2023 period, the Ministère du Travail, de l'Emploi et de la Solidarité sociale (MTESS) has identified the challenges facing the labour market. As in previous fiscal years, the Quebec labour market faced the following main challenges in FY1920:
- an aging population
- increased labour shortages, and
- a shift in the economy towards automation, digitization and information technology
To address these challenges, the Government of Quebec developed a set of priorities for FY1920 based on 4 strategic directions:
- support more businesses in adapting their human resource management practices to current labour market conditions
- integrate and maintain in employment the greatest possible number of people, notably through skills development, particularly for people from groups under-represented in the labour market, as well as social assistance clients, and
- ensure a good link between public employment services and their labour market partners, and between interventions with individuals and those with businesses
In January 2019, MTESS launched the La Grande Corvée initiative, which aims to proactively support businesses experiencing difficulties in filling job vacancies, to help them find a suitable solution, regardless of their economic sector. Through this, Quebec plans to support an increased number of businesses, in the context of labour shortages. One year after its launch, the ministry has had a positive assessment of the actions implemented to counter the labour shortages. The initiative reached more than 20,000 businesses, and more than 15,000 businesses have started an intervention, an increase of 30.8% from 1 year to the next. In addition, MTESS provided more than $170 million in investments to businesses, a 40.0% year-over-year increase.
MTESS has also continued to move towards more structural interventions aimed at under-represented groups. For example, providing experienced workers with a wage subsidy to maintain their labour market participation. These interventions are part of the La Grande Corvée 2.0 framework.
3.2.6.1 Managing for results
To ensure that it responds adequately and quickly to labour market needs, Quebec has a partnership structure that is unique in Canada. In terms of planning, la Commission des partenaires du marché du travail (CPMT), which brings together representatives of employers, unions, the educational sector and community organizations, works with the MTEES to guide public employment services to meet the needs of all partners. This collaboration takes the form of the development of a labour force and employment annual action plan. The management and delivery of public employment services are planned in a decentralized manner, for greater adaptation to the needs of regional labour markets and local clienteles. Thus, while respecting the major orientations of the Quebec action plan, the regional branches of Services Québec are autonomous in the use of employment services, the implementation of strategies and the management of their intervention budget. Consequently, their use may differ from one region to another, depending on the priorities and characteristics of the region. Throughout the Province, employment services are carried out according to a results-based management approach, that is, the Quebec action plan provides for annual targets for targeted results indicators, and the regional branches identify their contribution in their regional employment and labour force action plan. This management method makes it possible to carry out effective interventions and to assess the achievement of concrete results, particularly with regard to the return to employment after program participation.
Through MTESS, Quebec continues to build on its system of targeting, referral and feedback (TRF), which allows the Province to proactively reach out to EI applicants. Implemented jointly with the Government of Canada, and in use since 1999, the TRF system has proven so effective, that it is being implemented across all other provinces and territories.
Employment programming is carried out in partnership with organizations specialized in employability development and with organizations with an economic interest, to complement the activities of the Province's employment services, as well as to offer businesses and the population a variety of services according to their needs. Agreements with service provider partners include outcome targets. These organizations are also important in developing innovation to labour market programming in their service delivery.
3.2.6.2 Clients, interventions and expenditures
For the fourth consecutive year, the total number of clients served in Quebec decreased to 198,954 (-7.4%) in FY1920. With the exception of the number of PPE, which increased by 1.6% to 17,524, the number of active EI claimants (107,330) and non-insured clients (51,110) decreased by 7.7% and 12.2%, respectively. The number of former EI claimants (22,990) remained almost unchanged (-0.1%). In terms of their proportion among all clients, only the shares of non-insured clients (25.7%) declined by 1.4 percentage points, while the proportion of other types of clients remained roughly stable from one year to the next. This result reflects the economic situation that prevailed in Quebec at the time, with a historically low unemployment rate and a very high number of job vacancies.
The total number of interventions delivered in Quebec fell for the third consecutive year, reaching 246,799 (-8.8%) in FY1920. At 86.8% of all interventions, EAS interventions remain the most commonly used type of intervention. The number of individuals returning to employment after participating in programming increased for the seventh consecutive year, totaling 75,735 (+3,200; +4.4%) in FY1920. This represents 144.8% of the provincial target (52,300). Unpaid benefits from the EI Operating Account increased by 3.0% year-over-year to $302.81 million.
In total, expenditures reached $643.9 million in FY1920, including $65.6 million in additional funding provided by Government of Canada, announced in Budget 2017. This also includes $14.6 million in additional targeted funding to Quebec to support workers in seasonal industries ($8.0 million), as well as those affected by U.S. tariffs in the steel and aluminum industries ($6.6 million).
The additional targeting funding towards workers in seasonal industries allowed for the implementation of a pilot project, which extends the hiring periods of seasonal workers in businesses through training; and provides income support to unemployed workers entering training for whom EI benefits had expired. These additional funds were also invested in existing measures through services publics d'emploi (SPE) du Québec.

Text description of Chart 16
| FY0910 | FY1011 | FY1112 | FY1213 | FY1314 | FY1415 | FY1516 | FY1617 | FY1718 | FY1819 | FY1920 | |
|---|---|---|---|---|---|---|---|---|---|---|---|
| Active clients | 138,274 | 130,782 | 121,089 | 119,771 | 147,396 | 140,026 | 146,359 | 138,682 | 127,614 | 116,261 | 107,330 |
| Former clients | 24,970 | 23,288 | 25,099 | 25,081 | 26,779 | 24,986 | 26,946 | 26,945 | 32,965 | 23,005 | 22,990 |
| PPE | 17,248 | 17,524 | |||||||||
| Non-insured clients | 42,167 | 37,859 | 47,049 | 54,519 | 63,162 | 64,769 | 79,814 | 84,716 | 79,764 | 58,228 | 51,110 |

Text description of Chart 17
| FY0910 | FY1011 | FY1112 | FY1213 | FY1314 | FY1415 | FY1516 | FY1617 | FY1718 | FY1819 | FY1920 | |
|---|---|---|---|---|---|---|---|---|---|---|---|
| Youth (15 to 24) | 26,342 | 22,385 | 25,408 | 28,285 | 31,409 | 32,259 | 45,785 | 45,401 | 41,586 | 36,203 | 32,443 |
| Core-age (25 to 54) | 119,448 | 102,720 | 109,185 | 117,427 | 133,491 | 134,939 | 146,872 | 150,680 | 145,805 | 129,383 | 121,304 |
| Older workers (55+) | 16,728 | 16,279 | 18,669 | 20,752 | 26,454 | 30,334 | 32,370 | 35,539 | 36,706 | 37,886 | 37,259 |
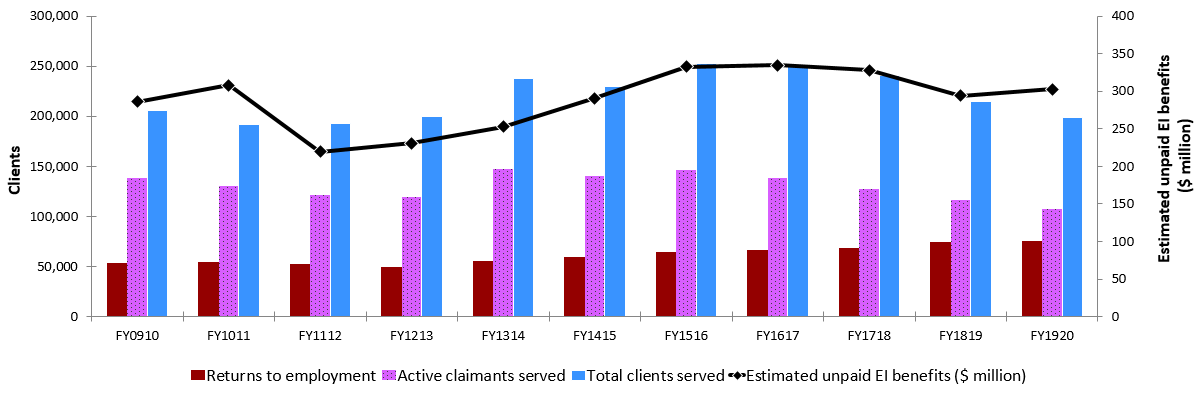
Text description of Chart 18
| FY0910 | FY1011 | FY1112 | FY1213 | FY1314 | FY1415 | FY1516 | FY1617 | FY1718 | FY1819 | FY1920 | |
|---|---|---|---|---|---|---|---|---|---|---|---|
| Returns to employment | 53,081 | 54,239 | 52,872 | 49,757 | 55,043 | 59,949 | 64,697 | 66,502 | 68,794 | 74,535 | 75,735 |
| Active claimants served | 138,274 | 130,782 | 121,089 | 119,771 | 147,396 | 140,026 | 146,359 | 138,682 | 127,614 | 116,261 | 107,330 |
| Total clients served | 205,411 | 191,929 | 193,237 | 199,371 | 237,337 | 229,781 | 253,119 | 250,343 | 240,343 | 214,742 | 198,954 |
| Estimated unpaid EI benefits ($ million) | $285.80 | $307.80 | $219.42 | $230.49 | $252.38 | $290.84 | $332.31 | $334.28 | $327.62 | $293.92 | $302.81 |
Table 11 – Québec – EBSM-similar programming, FY1920
For accessibility reasons, the table has been simplified. Consult the PDF version for the full table.
| Employment Benefits | Program name | Interventions | Year-over-year change | Expenditures ($ 000s) |
|---|---|---|---|---|
| SD-R | Manpower Training Measure Job Readiness | 22,138 | -5.30% | 223,100 |
| TWS | Wage Subsides | 8,632 | 5.30% | 109,809 |
| SE | Self-Employment | 1715 | 4.70% | 23,101 |
| TES | Return to Work Supplement | 0 | 0.00% | 0 |
| Support Measures | Program name | Interventions | Year-over-year change | Expenditures ($ 000s) |
|---|---|---|---|---|
| EAS | Labour Market Information; Job Placement; Job Research and Assistance Services | 214,314 | -9.70% | 141,836 |
| LMPs | Job Cooperation Services; Manpower Training Measure for Enterprises | n/a | n/a | 134,503 |
| R & I | Research and Innovation Strategy | n/a | n/a | 5,042 |
3.2.6.3 Employment Benefits
In Quebec, the number of Employment Benefit interventions declined by 2.2% (-725) year-over-year to 32,485 in FY1920. With the exception of SD-R (-1,238; -5.3%), all other types of interventions increased: TWS (+436; +5.3%), and Self-Employment (+77; +4.7%). In total, Quebec invested $356.0 million (+6.6%) in Employment Benefits.
In FY1920, Quebec received an additional $14.6 million to support workers in the steel and aluminum industries affected by the trade dispute and for workers and businesses in seasonal industries. Funding for workforce training initiatives ($7.2 million) has enabled targeted workers to acquire relevant skills and thus meet the constantly changing needs of their employers. In addition, human resource management support initiatives for businesses helped them address workforce challenges ($3.2 million). Finally, by encouraging employers to hire people at risk of long-term unemployment, the wage subsidy investment ($2.2 million) helped stimulate employment and work experience.
3.2.6.4 Support measures: EAS
For the third consecutive year, the total number of EAS interventions contracted, totaling 214,314 in FY1920, a 9.7% (-23,059) year-over-year reduction. As in the previous fiscal year, all types of EAS interventions declined. Employment Services (177,382), Group Services (10,314), and Individual Counseling (26,618) declined by 3.9% (-7,226), 26.0% (-3,615), and 31.5% (-12,218), respectively. EAS expenditures of $141.8 million decreased by 3.2%. One of the reasons for expenditure decline is the increasing use of costlier Employment Benefits to support clients who are further away from employment and the labour market.
3.2.6.5 Other support measures: LMP and R&I
Quebec's total expenditures on LMP and R&I increased by 18.4% to $139.5 million in FY1920. LMP ($134.5 million) and R&I ($5.0 million) increased by 18.7% and 11.2%, respectively. These increases are attributable to the fact that Quebec has paid particular attention to supporting businesses in a context of labour shortages. The Grande Corvée is a concrete illustration of this. As part of this initiative, training measures allow employers to support their workers who do not have all the necessary skills to hold their position. A portion of certain costs are reimbursed, whether for the purchase of training or for the workers' salary, for example. With this measure, Quebec is encouraging companies to increase their productivity through training. Under R&I, Quebec has also launched innovation projects to evolve its labour market programming to reflect the needs of the current labour market.
3.2.7 Ontario
In 2019, Ontario's real gross domestic product (GDP) rose by 2.1%, exceeding the national growth rate of 1.9%. As reported in Ontario's 2020 Budget, the Province's real GDP is projected to decline by 6.5% in 2020, largely due to the impacts of the COVID-19 pandemic. However, it was also noted that an extraordinary degree of uncertainty prevails regarding the economic outlook, due to the uncertainty linked to the COVID-19 pandemic.
Ontario: EBSM key facts
For accessibility reasons, the table has been simplified. Consult the PDF version for the full table.
| Insured clients | Non-insured clients |
|---|---|
| 103,401 |
94,111 |
| Intervention type | FY1920 | Year-over-year change |
|---|---|---|
| Employment Benefits | 27,492 | 13.20% |
| Support Measures: EAS | 193,757 | 3.30% |
| Intervention type | FY1920 | Year-over-year change (pp) |
|---|---|---|
| Employment Benefits | 12.40% | 1.3 |
| Support Measures: EAS | 87.60% | 1.3 |
| Total expenditures | FY1920 ($ million) | Year-over-year change |
|---|---|---|
| Employment Benefits | $166.10 | 7.40% |
| Support Measures: EAS | $315.60 | 2.30% |
| LMP and R&I | $176.20 | 10.40% |
| Total expenditures* | $657.90 | 0.60% |
| FY1819 | FY1920 | Year-over-year change |
|---|---|---|
| $265.22 | $250.51 | 5.50% |
- * Ontario invested $8,107,201 of its total allocation towards administration costs, representing 10% of the Budget 2017 additional funding the Province received in FY1920.
- ** Totals may not add up due to rounding; does not include accounting adjustments.
Continuing a decade long trend, employment in Ontario increased by 176,100 (+2.4%), to 7,392,300, in FY1920. Both full-time (+148,600; +2.5%) and part-time (+27,400; +2.1%) positions contributed to this expansion. The unemployment rate remained relatively stable, at 5.7%, compared to 5.8% a year earlier. About 97% of the net employment growth in Ontario was in the services-producing sector, which increased by 171,300 (3.0%) to 5,924,400. Within the services sector, employment grew in wholesale and retail trade (+19,400; +1.8%); transportation and warehousing (+13,000; +3.4%); finance, insurance, real estate and leasing (+22,100; +3.8%); professional, scientific and technical services (+42,500; 6.7%); educational services (+13,500; +2.6%), health care and social assistance (+50,300; 5.9%); other services except public administration (+10,000; +3.4%); and public administration (+20,000; +5.6%). However, business, building and other support services (-2,000; -0.6%); information, culture and recreation (-1,500; -0.5%); as well as accommodation and food services (-15,900; -3.5%) experienced net losses. In the goods-producing sector (+4,700; +0.3%), net employment gains were recorded in agriculture (+3,200; +4.4%) and construction (+15,500; +2.9%). They were partially offset by net losses in forestry, fishing, mining, oil and gas (-1,400;-4.0%); utilities (-4,200; -7.1%); and manufacturing (-8,400; -1.1%).
In FY1920, Ontario was facing tight labour market conditions, with low unemployment rates by historical standards and many employers reporting recruitment challenges, particularly related to finding workers with specific skills and experience. Under-represented groups including youth, Indigenous peoples, persons with disabilities, recent immigrants and other vulnerable workers continued to face several barriers in the labour market. To address these issues, the Province worked with key stakeholders, with the goal to continue to inform the design, development and implementation of ongoing and new initiatives in FY1920. The Government of Ontario hosted pre-budget consultations, from late 2018 to early 2019, inviting individuals and organisations to attend consultations and submit feedback to identify the main labour market issues. Stakeholder engagement remains essential for Ontario to streamline the Province's efforts, through training and other services, to help Ontarians develop their skills, and gain sustainable jobs that are in demand, ensuring the workplace transformation from automation and new technologies, as well as accelerating underrepresented groups' integration.
Workforce Development Action Plan
Following commitments made in the 2019 Ontario Budget, the 2019 Fall Economic Statement confirmed that the government would continue its review of current training support programs to better match unemployed or underemployed people with available jobs. This would include making changes to Second Career and other skills training programs, to ensure they are helping job seekers get the skills they need to find work.
On March 9, 2020, before the COVID-19 pandemic forced the closure of many workplaces, Ontario announced its intention to develop a Workforce Development Action Plan, as part of its commitment to prepare people for jobs.
Ontario has committed to reviewing the current workforce development and training system, as well as to developing an Action Plan to modernize workforce development and training levers. This should improve outcomes for workers, businesses and, ultimately, Ontario's economy, contributing to the broader economic recovery and longer-term competitiveness of the Province.
3.2.7.1 Managing for results
Employment Service Transformation
Ontario continues to move forward with a transformation of its employment and training services, with the goal of creating 1 efficient, and outcomes-based system, to meet the needs of businesses, communities and all job seekers, including those on social assistance or with a disability. As part of the transformation, the government is integrating employment services from the Ontario Ministry of Children, Community and Social Services' Ontario Disability Support Program and Ontario Works program into the Ministry of Labour, Training and Skills Development's Employment Ontario.
In the transformed system, newly created Service System Managers will plan, design and deliver core employment service functions (for example, job search and placement services, etc.) and specialized services for people with higher or more complex employment needs. Implementation of the new employment services system is being phased, starting with 3 prototype regions. The prototype phase began in January 2020 and will generate learnings to support a province-wide roll-out of the model, starting in 2022.
3.2.7.2 Clients, interventions and expenditures
After 4 consecutive years of growth, the total number of clients served in Ontario declined in FY1920, totalling 197,512 (-8,194; -4.0%). While active claimants (51,739), PPE (24,302) and non-insured clients (94,111) contracted by 2.8%, 3.7%, and 6.5%, respectively, former claimants (27,360) advanced by 2.8% (+734). Compared to FY1819, the proportion of former claimants edged up by 1.0 percentage point to 13.9%, whereas that of non-insured dropped by 1.3 percentage point to 47.6%. The shares of other client types remained somewhat stable.
Compared to the previous fiscal year, the Province delivered 10,829 fewer interventions, for a total of 221,249 (-4.7%) in FY1920. Consistent with FY1819, EAS remained the most used intervention type, with a share of 87.6% (+1.3%) of all interventions. A total number of 46,864 (-536; -1.1%) insured clients returned to employment after participating in an EBSM-similar intervention, surpassing Ontario's fiscal year target of 40,000 individuals returning to work. Unpaid EI benefits dropped by 5.5% to $250.5 million.
Ontario's total expenditures amounted to $666.0 million (+0.6%). This sum includes $81.1 million received by the Province from the $250.0 million in additional LMDA funding announced in Budget 2017, of which 10% was used for administration costs per flexibility in the LMDA for FY1920, to support Information and Information Technology (I&IT) costs related to the implementation of the new Performance Measurement Strategy developed with the Government of Canada. The Province also received additional targeted funding to support workers in seasonal industries ($3.5 million), as well as those affected by the U.S. trade dispute in the steel and aluminium industries ($12.0 million).
The use of the additional funding provided under Budget 2017
Ontario continued to use the additional funding to deliver its existing suite of programming through Employment Ontario.
Ontario made significant investments in Ontario Labour Market Partnerships (OLMP) in FY1920. OLMP provides financial assistance to local communities, sector groups, employee/employer associations and employers to develop and implement strategies that address and respond to local economic development, labour force adjustment and human resource planning issues.
The number of projects expanded in FY1920, with a total of 43 new projects started. This was due to an increased focus on understanding the local labour markets as well as enhancing community development and partnership building to support local solutions. Some examples of the innovative new projects that were undertaken with a start date in FY1920 include, but are not limited to:
- human resource planning to support the recruitment and retention of qualified French language teachers and education workers across the Province
- the development of a skills inventory of First Nations communities, serviced by the North Shore Tribal Council, also looking at labour market demands and challenges for members of those communities to participate in employment
- an analysis of labour force commuting patterns in Eastern Ontario by the Eastern Ontario Wardens' Association, to support the design and operation of potential group transportation services
- the development, facilitation and dissemination of "toolkits" for employers and jobseekers within the technology sector, to support sector growth and sustainability led by Talent X Charity (Formerly known as MARS Talent Development)
- supporting the transition of Ontario military Veterans and Reservists to employment opportunities within the construction industry, to the occupation most relevant to their transferable skills and military experience
In FY1920, Ontario also funded Skills Ontario (the provincial chapter of Skills Canada) under the Labour Market Partnership component of the LMDA. Skills Ontario is a province-wide, charitable, non-profit organization that aims to prepare Ontario's youth for the highly-skilled economy of the future, through promotion of apprenticeships, the skilled trades and technology careers.
Ontario continued to expand Research and Innovation activities directed at identifying better ways to help jobseekers prepare for and keep employment, as well as to participate productively in the labour force. This includes the delivery of SkillsAdvance Ontario (SAO) under the LMDA. SAO supported 38 projects in FY1920. SAO is a sector-focused workforce development pilot initially launched in fall of 2016. The pilot supports partnerships that bring together sector-based employers and employment and training providers, to develop a pool of job-ready, skilled workers that meet employers' workforce development needs. The SAO pilot helps job seekers and workers build the sector-specific soft skills and hard skills they need to obtain, succeed and advance in both entry-level positions and higher-level jobs in participating sectors. At the same time, it helps employers fill identified vacancies to meet workforce needs, by providing sector-focused employment services, including job matching and placement, as well as post-employment retention services.
Additionally, the Government of Ontario is transforming the employment services system in the Province by seeking innovative and efficient approaches to better connect individuals, including those in receipt of Social Assistance, people with disabilities, Indigenous people, Francophones and those who have unique needs to achieve sustainable employment. The transformed system is intended to work more effectively to meet employers' needs and better match job seekers to employers. This transformation will integrate employment support services for Ontario Works and the Ontario Disability Support Program (ODSP) into a transformed Employment Ontario (EO), to create 1 system.
This transformation is intended to support the government's vision of building an employment services system that is locally responsive and community based, outcomes-focused, client-centered, and provides simplified and effective pathways to finding sustainable employment for individuals as well as businesses, based on their needs. Through the transformation of employment services, the ministry proposes to achieve the following outcomes:
- clients find and sustain good jobs
- clients have access to the services they need when they need them
- clients decrease dependence on income assistance
- employers find the right workers with the right skills
- the system is sustainable and serves clients more efficiently
To achieve these outcomes, the ministry contracted with the following organizations to become Service System Managers (SSMs) during the prototype phase in the Catchment Areas of Peel, Hamilton-Niagara and Muskoka-Kawarthas:
- international APM Group Pty Ltd and WCG International Consultants Ltd – Peel
- Fedcap Canada in Hamilton-Niagara, and
- the Sir Sandford Fleming College of Applied Arts and Technology - Muskoka-Kawarthas
Transfers as per the LMDAs in FY1920 provided planning funding to the above Service System Managers. During the Planning phase, planning funding was provided to Service System Managers, to undertake activities required to establish the capacity necessary to exercise the appropriate oversight over the network within the Catchment Area. These activities included building capacity and developing knowledge of the current local service delivery network (for example, orientation, onboarding, training). They also included establishing operations including, but not limited to: leasing space, establishing a presence in the community (for example, marketing, building stakeholder relationships, etc.), hiring of key staff and developing an interactive web presence. In addition, these activities included developing formal issues identification and resolution processes for referral organizations, service partners and clients (at the individual and system level); and establishing Transition Agreements for the Transition Period (April to December 2020).
Additionally, Ontario applied the flexibility to use up to 10% of the additional funding announced in Budget 2017 to support additional administration costs (up to $8.1M). This includes approximately $4.8M to support I&IT costs related to the implementation of a new performance measurement strategy and the Targeting, Referral and Feedback System.
The use of the additional targeted funding
In FY1920, Ontario invested over $15.5 million of LMDA funding in programs such as Adjustment Advisory Program, SkillsAdvance Ontario and Pre-Apprenticeship, to support workers in seasonal industries and those workers affected by the steel and aluminum trade dispute. The funding involved 24 projects, assisted more than 500 employers, and served over 2,000 clients.
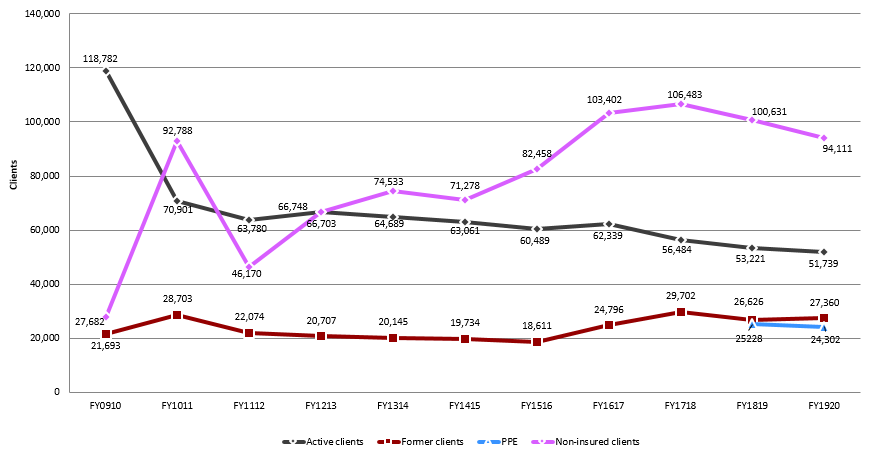
Text description of Chart 19
| FY0910 | FY1011 | FY1112 | FY1213 | FY1314 | FY1415 | FY1516 | FY1617 | FY1718 | FY1819 | FY1920 | |
|---|---|---|---|---|---|---|---|---|---|---|---|
| Active clients | 118,782 | 70,901 | 63,780 | 66,748 | 64,689 | 63,061 | 60,489 | 62,339 | 56,484 | 53,221 | 51,739 |
| Former clients | 21,693 | 28,703 | 22,074 | 20,707 | 20,145 | 19,734 | 18,611 | 24,796 | 29,702 | 26,626 | 27,360 |
| PPE | 25228 | 24,302 | |||||||||
| Non-insured clients | 27,682 | 92,788 | 46,170 | 66,703 | 74,533 | 71,278 | 82,458 | 103,402 | 106,483 | 100,631 | 94,111 |
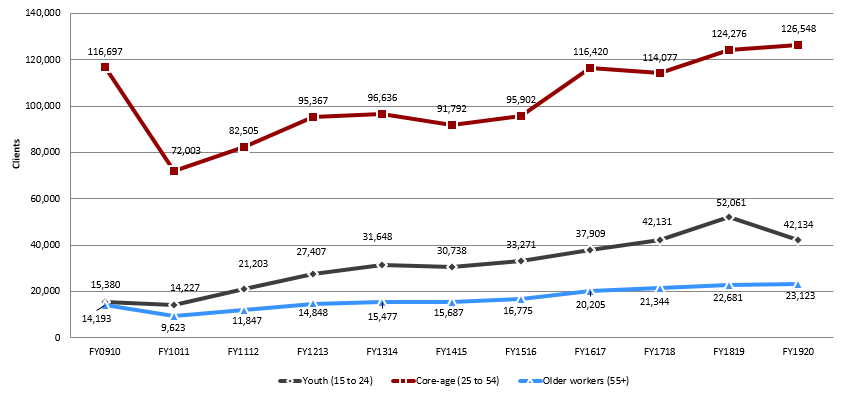
Text description of Chart 20
| FY0910 | FY1011 | FY1112 | FY1213 | FY1314 | FY1415 | FY1516 | FY1617 | FY1718 | FY1819 | FY1920 | |
|---|---|---|---|---|---|---|---|---|---|---|---|
| Youth (15 to 24) | 15,380 | 14,227 | 21,203 | 27,407 | 31,648 | 30,738 | 33,271 | 37,909 | 42,131 | 52,061 | 42,134 |
| Core-age (25 to 54) | 116,697 | 72,003 | 82,505 | 95,367 | 96,636 | 91,792 | 95,902 | 116,420 | 114,077 | 124,276 | 126,548 |
| Older workers (55+) | 14,193 | 9,623 | 11,847 | 14,848 | 15,477 | 15,687 | 16,775 | 20,205 | 21,344 | 22,681 | 23,123 |
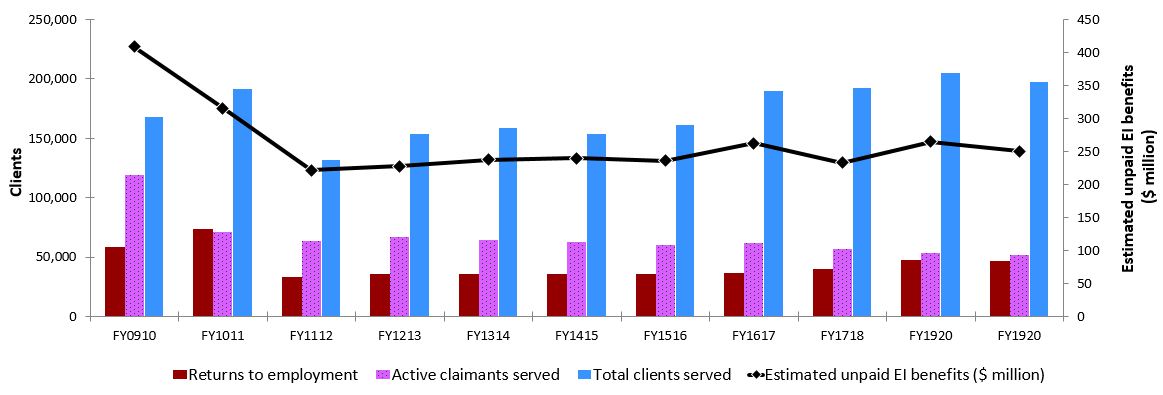
Text description of Chart 21
| FY0910 | FY1011 | FY1112 | FY1213 | FY1314 | FY1415 | FY1516 | FY1617 | FY1718 | FY1920 | FY1920 | |
|---|---|---|---|---|---|---|---|---|---|---|---|
| Returns to employment | 58,333 | 73,855 | 33,347 | 36,111 | 36,018 | 36,166 | 35,625 | 37,044 | 39,678 | 47,400 | 46,864 |
| Active claimants served | 118,782 | 70,901 | 63,780 | 66,748 | 64,689 | 63,061 | 60,489 | 62,339 | 56,484 | 53,221 | 51,739 |
| Total clients served | 168,157 | 192,392 | 132,024 | 154,158 | 159,367 | 154,073 | 161,558 | 190,537 | 192,669 | 205,706 | 197,512 |
| Estimated unpaid EI benefits ($ million) | $408.52 | $315.75 | $221.48 | $227.71 | $237.59 | $240.22 | $236.05 | $262.66 | $233.15 | $265.22 | $250.51 |
Table 12 – Ontario: EBSM-similar programming, FY1920
For accessibility reasons, the table has been simplified. Consult the PDF version for the full table.
| Employment Benefits | Program name | Interventions | Year-over-year change | Expenditures ($ 000s) |
|---|---|---|---|---|
| SD-R | Second Career, Literacy and Basic Skills | 8,932 | -6.10% | 164,418 |
| SD-A | Skills Development–Apprenticeship | 18,396 | -1.60% | |
| TWS | Job Placement with Incentive | 0 | -100.00% | 0 |
| SE | Ontario Self-Employment Benefit | 0 | n/a | 0 |
| JCP | Ontario Job Creation Partnerships | 114 | 0.90% | 1,642 |
| Support Measures | Program name | Interventions | Year-over-year change | Expenditures ($ 000s) |
|---|---|---|---|---|
| EAS | Ontario Employment Assistance Services/ Employment Service | 193,757 | -3.30% | 315,611 |
| LMP | Ontario Labour Market Partnerships | n/a | n/a | 80,350 |
| R&I | Research and Innovation | n/a | n/a | 95,858 |
3.2.7.3 Employment benefits
In FY1920, Ontario delivered 27,492 Employment Benefits, which was 4,199 (-13.2%) fewer interventions than in FY1819, mainly due to TWS no longer being delivered. Declines occurred in TWS (-3,322; -100.0%), SD-R (-582; -6.1%), and SD-A (-296; -1.6%), while JCP (+1; +0.9%) remained stable. For a fourth consecutive year, SE was not delivered in the Province. Expenditures towards Employment Benefits amounted to $166.1 million (-7.4%).
Success story: Literacy and basic skills
JP is 31 years old and was an inmate at the Toronto East Detention Centre, when he enrolled in the Corrections Literacy Initiative, an extension of the Literacy and Basic Skills program. Through the program, he was able to narrow down his passions and interests, namely a career in broadcasting (film and television).
Prior to receiving parole in March 2020, JP enrolled in a broadcasting program at Centennial College. Upon his release from the correctional facility, and in between starting school, JP could not work due to COVID-19 pandemic restrictions, so he reached out to the LBS service provider's coordinator from the Corrections Literacy Initiative pilot. They helped him register for the Academic and Career Entrance program (ACE) English Communication course at Centennial College, which was a pre-requisite for the broadcasting program. JP successfully completed the course, and now, after being out of high school for more than 10 years, he is a student enrolled in a 3 year college course.
3.2.7.4 Support measures: EAS
After 4 consecutives years of growth, EAS interventions in FY1920 dropped by 3.3% (-6,630) to 193,757. As was the case in previous fiscal years, Individual Counselling remained the only type of interventions delivered under EAS. The Province spent a total of $315.6 million (-2.3%) on EAS.
3.2.7.5 Other support measures
In FY1920, total funding towards LMP and R&I amounted to $176.2 million, a 10.4% increase year-over-year. This represents a sixth consecutive year of growth. Expenditures on LMP totalled $80.4 million (-11.5%), R&I's funding increased by 39.3%, to $95.9 million.
In FY1920, Ontario continued to provide the Canada-Ontario Job Grant as Employer-Sponsored Training, under the Labour Market Partnerships component.
Aggregate employer information (employers by size):
- Employers:
- Small (50 0r fewer)
- Medium (51 to 499)
- Large (500 or more)
- Organizations: 22
There were no R&I projects concluding in FY1920. However, the following R&I projects funded in FY1920 will be continuing into FY2021 and FY2122, with funding accrued from FY1920:
- Career Ready Fund, and
- Skills Catalyst Fund
These projects were scheduled to end during the fiscal year. However, due to the impacts of the COVID-19 pandemic, activities have been extended. Ontario will provide the results/lessons learned from these projects in future editions of this report.
Ontario previously funded LinkedIn Learning (formerly known as Lynda.com) under the LMDA in FY1718 and FY1819. In FY1920, the last year of the project, it was funded under the Workforce Development Agreement.
Success story: SkillsAdvance Ontario
James came to the Employment + Education Centre in December 2019 as he had heard about the program Pathways to Production. James was working as a Masonry in BC – where he was facing some health concerns and returned to his hometown Johnstown, ON, to be closer to his family for support. James knew he could no longer continue to do hard physical labour and needed to transition into a different sector. Only having his Grade 12 education, he was concerned with what employment opportunities might be available to him as his whole experience for over 20 years was in Masonry.
James was enrolled into the Pathways to Production program in January 2020. He knew this program would be a starting point for him and help him get connected to a Manufacturing/Production organization in his local hometown.
Pathways to Production started as a pilot project funded by SkillsAdvance Ontario consisting of Economic Development offices from Brockville, Gananoque, Prescott and the United Counties of Leeds and Grenville along with the Employment + Education Centre, CSE Consulting, KEYS and St Lawrence College. It started as a 6 week program to help local manufacturers who expressed a skills gap in their sector to help fill their current and future needs.
After the curriculum was completed, James undertook his two-week Job Trial Placement with a company in Johnstown. The two-week job trial was a chance for the employer to review the participant and see if the participant was a good fit for the organization.
James was successfully hired as a permanent employee and earning above the living wage for Leeds and Grenville. As this was a new skill set that James had to learn, he was determined and became a dedicated and reliable team player. Within a year, James was promoted to a Lead Supervisor at his organization.
Success story: SkillsAdvance Ontario
On November 19, The Hospitality Workers Training Centre (HWTC) celebrated its 2019 Q2 graduation. The graduation was a celebration of the success of the participants.
Between July 1 to September 30th, 71 individuals graduated from Hospitality Workers Training Centre programs. Of the 71 graduates, 41 were funded through our SAO project; 22 males and 19 females. This included 9 youth (19- 29), while 10 were aged 30–39 and the remaining 22 were over 40. These job seekers experienced multiple barriers to employment and represented vulnerable groups including: racialized black youth, mature workers, refugees and persons with disabilities.
Michael, oneof the SAO participants who identifies as having a disability, was proud to have completed the culinary training program and secured employment at restaurant in downtown Toronto.
The valedictorian, Merve, a refugee claimant who fled Turkey for safety shared her story of settlement, integration and success. She described how upon arrival she struggled with isolation, precarious employment, inadequate housing and fear. She was accepted in HWTC's Housekeeping Program. While she excelled in training and was hired right out of the placement, she found work culturally challenging, and integration into Canadian life to be difficult. She went on to describe that there were days she did not think she was going to make it, but, with encouragement from her employer, support from HWTC and from friends she had made during training, she succeeded. She shared her pride and amazement that she is now independent, economically stable and no longer afraid.
3.2.8 Manitoba
Manitoba's real GDP growth slowed down from 1.5% in 2018 to 0.6% in 2019. This was below the national growth rate of 1.9%. In 2020, a GDP contraction of 5.0% is expected to have occurred due to the impact of the COVID-19 crisis on the Province's economy.
Manitoba: EBSM Key Facts
For accessibility reasons, the table has been simplified. Consult the PDF version for the full table.
| Insured clients | Non-insured clients |
|---|---|
| 14,166 |
10,990 |
| Intervention type | FY1920 | Year-over-year change |
|---|---|---|
| Employment Benefits | 14,923 | 117.30% |
| Support Measures: EAS | 90,834 | 68.10% |
| Intervention type | FY1920 | Year-over-year change (pp) |
|---|---|---|
| Employment Benefits | 14.10% | 2.8 |
| Support Measures: EAS | 85.90% | 2.8 |
| Total expenditures | FY1920 ($ million) | Year-over-year change |
|---|---|---|
| Employment Benefits | $34.30 | 4.80% |
| Support Measures: EAS | $10.10 | 0.50% |
| LMP and R&I | $7.30 | 4.50% |
| Total expenditures* | $51.70 | 3.90% |
| FY1819 | FY1920 | Year-over-year change |
|---|---|---|
| $42.17 | $42.25 | 0.20% |
- * Totals may not add up due to rounding; does not include accounting adjustments.
In FY1920, employment (654,700) in Manitoba remained relatively stable (+1,900; +0.3%), while the unemployment rate dropped, from 5.8% to 5.4%, year-over-year. In the goods-producing sector (+800; +0.5%), net gains in construction (+1,800; +3.8%), and in manufacturing (+500; +0.7%) were partly counterbalanced by net losses in forestry, fishing, mining, oil and gas (-1,100; -16.2%); utilities (-200; -3.4%); and, agriculture (-100; -0.5%). On the other hand, the services-producing sector (502,300) created 1,100 (+0.2%) net jobs year-over-year. Most jobs occurred in following industries: trade (+2,200; +2.5%); transportation and warehousing (+600; +1.6%); professional, scientific and technical services (+400; +1.4%); business, building and other support services (+400; +1.9%); educational services (+800; +1.6%); and public administration (+800; +2.3%). However, significant jobs losses on a net basis were recorded in information, culture and recreation (-1,100; -4.7%); finance, insurance, real estate and leasing (-800; -2.4%); other services (-1,700; -5.7%); and accommodation and food services (-700; -1.6%).
Manitoba's labour market context continued to focus on engaging those who are not participating in the labour force, increasing the skills of the current and future workforce, improving outcomes for those who continue to face barriers to participation, through targeted and innovative approaches, and assisting individuals to effectively transition to employment. During consultations, employers identified the need for more workers across a broad range of skills sets.
3.2.8.1 Managing for results
In FY1920, the Province continued to deliver programs and services to clients in urban, rural and northern communities that support labour market integration and advancement, as well as individuals to pursue post-secondary and labour market training leading to employment.
Manitoba engages with community stakeholders such as employers, business organizations, service providers, educational institutions and individuals to develop programs and services that address local labour market needs.
Manitoba has made enhancements to reporting and data collection processes to improve the breadth and detail of data collected, in order to get better information about programs and services.
3.2.8.2 Clients, interventions and expenditures
After 4 consecutive years of decline, the total number of clients served in Manitoba increased to 25,156 (+4.5%) in FY1920. With the exception of the active claimant count (7,801), which dropped by 7.7%, all other client-types advanced, with former claimants (3,352), PPE (3,013), and non-insured clients (10,990) rising by 8.7%, 19.7% and 9.7%, respectively. As for their shares of LMDA clients, active claimants (31.0%) decreased by 4.1 percentage points, while former claimants (13.3%), PPE (12.0%) and non-insured clients (43.7%) expanded, respectively, by 0.5, 1.5 and 2.1 percentage points.
In FY1920, Manitoba's total number of intervention rose by 73.6% (+44,848) to 105,757. At 85.9%, EAS remained the most used intervention-type. The number of insured clients who returned to work after participating in an EBSM-similar program rose by 40.5% to 6,279. Unpaid EI benefits ($42.25 million) remained relatively stable (+0.2%) year-over-year.
Manitoba's total expenditures on EBSMs increased by about $2.0 million (+3.9%) to $51.7 million in FY1920. These expenditures comprised the Province's shares of the ongoing $1.95 billion LMDA program funding ($43.1 million) and of the $250.0 million in additional funding announced in Budget 2017 ($7.7 million). On top of these expenditures, $0.9 million was made available to the Province under the additional targeted funding measures to support workers in seasonal industries and those affected by trade disputes in the steel and aluminum industries, which the Province did not access.
In FY1920, the additional funding provided under Budget 2017 supported a new program focused on addressing the language and employment needs of immigrants and newcomers in Manitoba. The program provides access for Manitobans to language training that supports labour market integration or advancement and/or training, leading to meaningful employment.
An expansion of the Futures Forward program increased support and access to employment services and resources designed to address the needs of youth currently in or transitioning out of care and into training opportunities, as well as sustainable employment. The project aims to improve labour market participation rates of youth currently or previously involved in the child welfare system.
Manitoba provided additional targeted funding to the Communities Economic Development Fund, to support workers in seasonal industries through the following 4 program areas: non-timber forest product training in northern communities, Wilderness Safety Training, Community Based Experiential Tourism Training and Fisher Helpers Training. The seasonal worker programs were impacted by the COVID-19 pandemic and, as a result, programs had to be put on hold or amended.
Manitoba provided funding to the Canadian Manufacturers and Exporters (CME), to deliver training tailored to address specific needs of the Steel and Aluminum sub-sector. CME exceeded its targets and were able to support organizations to receive training, improving critical skills and capacity for leaders in the industry.
In addition, Manitoba supported Manitoba Construction Sector Council, to build on the Steel Fitters training program and to target displaced employees, as well as to move them into employment by upgrading their skills. The project also engaged companies in a needs assessment.

Text description of Chart 22
| FY0910 | FY1011 | FY1112 | FY1213 | FY1314 | FY1415 | FY1516 | FY1617 | FY1718 | FY1819 | FY1920 | |
|---|---|---|---|---|---|---|---|---|---|---|---|
| Active clients | 16,204 | 15,110 | 11,834 | 11,744 | 10,988 | 9,996 | 10,132 | 9,941 | 8,792 | 8,453 | 7,801 |
| Former clients | 3,496 | 3,875 | 3,775 | 3,844 | 3,579 | 3,672 | 3,292 | 3,011 | 3,729 | 3,085 | 3,352 |
| PPE | 2,518 | 3,013 | |||||||||
| Non-insured clients | 12,546 | 14,153 | 13,704 | 13,369 | 13,540 | 15,174 | 14,056 | 12,963 | 12,279 | 10,022 | 10,990 |
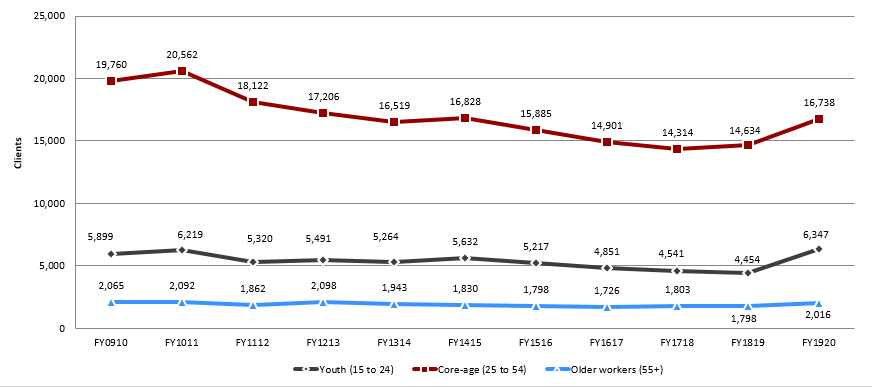
Text description of Chart 23
| FY0910 | FY1011 | FY1112 | FY1213 | FY1314 | FY1415 | FY1516 | FY1617 | FY1718 | FY1819 | FY1920 | |
|---|---|---|---|---|---|---|---|---|---|---|---|
| Youth (15 to 24) | 5,899 | 6,219 | 5,320 | 5,491 | 5,264 | 5,632 | 5,217 | 4,851 | 4,541 | 4,454 | 6,347 |
| Core-age (25 to 54) | 19,760 | 20,562 | 18,122 | 17,206 | 16,519 | 16,828 | 15,885 | 14,901 | 14,314 | 14,634 | 16,738 |
| Older workers (55+) | 2,065 | 2,092 | 1,862 | 2,098 | 1,943 | 1,830 | 1,798 | 1,726 | 1,803 | 1,798 | 2,016 |
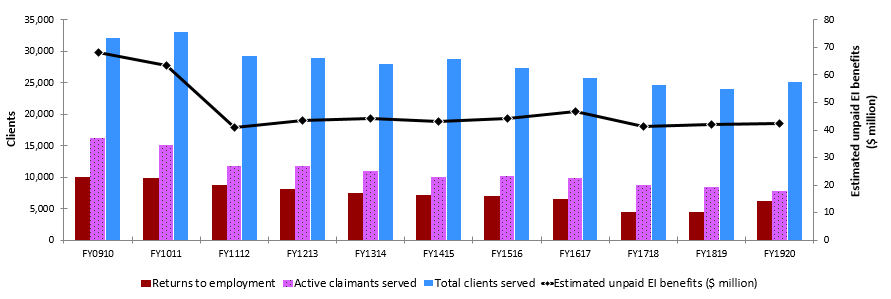
Text description of Chart 24
| FY0910 | FY1011 | FY1112 | FY1213 | FY1314 | FY1415 | FY1516 | FY1617 | FY1718 | FY1819 | FY1920 | |
|---|---|---|---|---|---|---|---|---|---|---|---|
| Returns to employment | 10,043 | 9,950 | 8,714 | 8,056 | 7,526 | 7,156 | 6,957 | 6,565 | 4,505 | 4,470 | 6,279 |
| Active claimants served | 16,204 | 15,110 | 11,834 | 11,744 | 10,988 | 9,996 | 10,132 | 9,941 | 8,792 | 8,453 | 7,801 |
| Total clients served | 32,246 | 33,138 | 29,313 | 28,957 | 28,107 | 28,842 | 27,480 | 25,915 | 24,800 | 24,078 | 25,156 |
| Estimated unpaid EI benefits ($ million) | $68.03 | $63.38 | $40.97 | $43.51 | $44.28 | $43.09 | $44.14 | $46.59 | $41.31 | $42.17 | $42.25 |
Table 13 – Manitoba: EBSM-similar programming, FY1920
For accessibility reasons, the table has been simplified. Consult the PDF version for the full table.
| Employment Benefits | Program name | Interventions | Year-over-year change | Expenditures ($ 000s) |
|---|---|---|---|---|
| SD-R | Skills Development | 7,442 | 195.90% | 31,583 |
| SD-A | Skills Development-Apprenticeship | 3,839 | -4.00% | |
| TWS | Wage Subsidies | 38 | 22.60% | 204 |
| SE | Self-Employment | 852 | 926.50% | 1,130 |
| JCP | Employment Partnerships | 2,752 | 1046.70% | 1,338 |
| Support Measures | Program name | Interventions | Year-over-year change | Expenditures ($ 000s) |
|---|---|---|---|---|
| EAS | Employment Assistance Services | 90,834 | 68.10% | 10,143 |
| LMP | Labour Market Partnerships | n/a | n/a | 6,234 |
| R&I | Research and Innovation | n/a | n/a | 1,048 |
3.2.8.3 Employment benefits
Employment Benefit interventions rose significantly, from 6,866 in FY1819 to 14,923 in FY1920, representing an increase of 117.3% (+8,057) year-over-year. While SD-A (-158; -4.0%) dropped, all other intervention types advanced: TWS (+7; 22.6%), SE (+769; +926.5%), JCP (+2,512; +1,046.7%) and SD-R (+4,927; 195.9%). Expenditures on Employment Benefits increased by $1.6 million (+4.8%) in FY1920 over FY1819, reaching $34.3 million.
Skills Development training helps a single dad secure employment
Richard, a single dad with 2 young children, was laid off from his labourer position with a mining company. After exploring his career options, he choose to take the Electrical Trades Fundamentals program. It is a one-year program which would get him employed quickly once he completed training. Richard graduated from the Electrical Trades Fundamentals program in June 2019 on the President's Achievement List with a 4.45 GPA. He is currently employed as a Level 2 Electrician. His caseworker spoke with him recently and he is doing great and loves what he is doing.
3.2.8.4 Support measures: EAS
In FY1920, EAS interventions in Manitoba increased by 68.1% to 90,834. Both Employment Services (54,173) and Individual Counselling (36,661) expanded by 54.8% (+19,179) and 92.5% (+17,612), respectively. Manitoba spent $10.1 million on EAS, an increase of 0.5% over FY1819.
Employment Assistance Services leads Jenessa to Self-Employment
Jenessa came in seeking Career Counselling and during the assessment/discussion, the Self Employment Program was brought up as an option for her. She mentioned she always wanted to be her own employer. Her caseworker discussed the program in detail and what would be expected of Jenessa while she participated. She participated in the Self Employment Program and successfully launched her business. Today her business is still successful and going strong.
3.2.8.5 Other support measures: LMP and R&I
Expenditures on R&I ($1.0 million) were $0.2 million lower (-19.1%) than in FY1819, while spending on LMP ($6.2 million) increased by about $565K (+10%).
Below are the results/lessons learned for any research and innovation projects that concluded in FY1920.
- Blueprint Analytics Design and Evaluation − Blueprint was contracted to help develop complex components of Manitoba's employment services transformation, to improve service access for Manitoba job seekers, improve labour market outcomes for job seekers & employers, and increase effectiveness as well as efficiency in service delivery
- Canadian Mental Health Association − The Wellness Skills Support pilot program focused on improving readiness of Employment and Income Assistance (EIA) clients prior to program start, as well as to support wellness of learners as they progress towards achieving their academic and employability goals. The project worked with clients to improve resilience, by identifying as well as addressing individual client needs and barriers in their education and/or employment pursuits
- Manitoba Institute of Trades and Technology – This pilot project was developed to provide on-site support, develop learning activities, counselling and guidance, provide teachings to students outside of regular classroom hours, as well as to offer further opportunities to connect with Indigenous culture and knowledge. The program created a holistic learning environment for learner's success
- Skills Canada Manitoba − Promoted apprenticeship training options, careers in the skilled trades and participation in skills competitions. The project also recognized outstanding employers and apprentices. It also enhanced knowledge of skilled trades in Manitoba
3.2.9 Saskatchewan
Saskatchewan's real GDP contracted in 2019 by 0.7%. As for 2020, Saskatchewan real GDP is forecast to have decreased by 5.5%, as the province was facing some challenges resulting from the COVID-19 crisis. In addition, the provincial economy suffered from the collapse in the world oil prices and the resulting investment's drop in this sector.
Saskatchewan: EBSM Key Facts
For accessibility reasons, the table has been simplified. Consult the PDF version for the full table.
| Insured clients | Non-insured clients |
|---|---|
| 20,586 |
1,423 |
| Intervention type | FY1920 | Year-over-year change |
|---|---|---|
| Employment Benefits | 21,418 | 6.80% |
| Support Measures: EAS | 10,852 | 15.20% |
| Intervention type | FY1920 | Year-over-year change (pp) |
|---|---|---|
| Employment Benefits | 66.40% | 2.2 |
| Support Measures: EAS | 33.60% | 2.2 |
| Total expenditures | FY1920 ($ million) | Year-over-year change |
|---|---|---|
| Employment Benefits | $31.50 | 3.90% |
| Support Measures: EAS | $10.50 | 3.80% |
| LMP and R&I | $4.30 | 133.40% |
| Total expenditures* | $46.30 | 7.60% |
| FY1819 | FY1920 | Year-over-year change |
|---|---|---|
| $49.07 | $48.25 | 1.70% |
- * Totals may not add up due to rounding; does not include accounting adjustments.
In FY1920, Saskatchewan created 8,000 (+1.4%) more jobs than in the previous fiscal year on a net basis. Employment in both full-time (+4,500; +1.0%) and part-time (+3,500; +3.4%) positions contributed to this performance. The unemployment rate (5.9%) slightly dropped (-0.2 percentage point).
Most positions were created in the services-producing sector (+9,100; +2.2%), mainly in health care and social assistance (+1,000; +1.3%); public administration (+1,400; +4.8%); professional, scientific and technical services (+1,400; +5.3%); educational services (+2,100; +4.8%); information, culture and recreation (+2,000; +10.3%); accommodation and food services (+2,200; +5.8%); and in other services (+2,700; +10.7%). However, trade (-2,500; -2.9%), as well as transportation and warehousing (-2,000; -7.1%), contracted.
Saskatchewan's goods-producing sector (-1,100; -0.8%) weakened year-over-year, mainly in forestry, fishing, mining, quarrying, and oil and gas (-1,200; -5.0%); utilities (-1,100; -15.2%); and in construction (-3,200; -6.7%). Gains were registered in agriculture (+900; +2.4%) and manufacturing (+3,400; +12.4%).
Saskatchewan through the Ministry of Immigration and Career Training (ICT) delivers a range of programs and services supported by the Canada-Saskatchewan Labour Market Development Agreement. ICT helps individuals prepare for, obtain and maintain employment, and leads activities required to assist employers with the development, recruitment and retention of workers. ICT has 3 overarching labour market priorities: align skills training investments with economic needs to support the development of a skilled workforce; attract skilled workers to Saskatchewan's workforce; and retain skilled workers in the Province.
More specifically, Saskatchewan focused on the following initiatives to address labour market challenges, including:
- investing in skills training opportunities that are responsive to the needs of employers
- increasing employer-sponsored training to support the retention of workers as well as their career growth and productivity
- working with employers and community partners to improve the employment rate of groups who are under-represented in the workforce
- investing in programs and services to prepare entrepreneurs and workers for the Saskatchewan economy, as well as for the changing nature of work
- working with provincial public service and third party delivery partners, to develop supports and resources for transitions between education, training and employment, and,
- attracting skilled workers to Saskatchewan, through national and international recruitment activities
3.2.9.1 Managing for results
Saskatchewan regularly engages and consults with clients, stakeholders and government partners to determine priorities, and consider program design and service delivery improvements.
In FY1920, ICT facilitated 53 employer outreach sessions with 1,061 participants to promote labour market programs and services. ICT also held 20 labour market service sessions that engaged over 260 people and 143 stakeholder organizations. These sessions helped ICT to better identify provincial labour market needs.
ICT delivers labour market services through a regional system, which helps build relationships throughout the Province and in communities. This model helps staff stay informed on regional layoffs, recruitment challenges, and specific education and employment barriers. Staff hold regular meetings with employers and training sector representatives to identify and address workforce needs. This ongoing engagement is part of a shared commitment to build an agile and responsive training system that anticipates current and future labour demand.
Through these partnerships, ICT continued the delivery of several recently started projects:
- Targeted Initiatives for Older Workers, to increase the employability of older workers. In FY1920, ICT worked with 7 service providers and signed 6 agreements
- Career Bridging program, to help unemployed individuals connect to the labour force. Most participants are from under-represented groups
- The Training Voucher Pilot, which provide funding assistance to support participation in skills training for laid off workers
Saskatchewan is also focusing on ensuring up-to-date information technology infrastructure to enhance services to residents and businesses. The Modernization Agreements, Programs and Services (MAPS) is aimed to improve the delivery of programs and services across the ministry, by updating technology, data and legislation.
In FY1920, ICT continued implementation of the Targeting, Referral and Feedback (TRF) Pilot. In the course of TRF implementation, ICT determined criteria data sets to engage specific Employment Insurance (EI) applicants (NOC and regions). Individuals who met the criteria when applying for EI were then referred to ICT. Ministry staff engaged with these applicants in career planning, guiding them to relevant job opportunities or provincially-delivered programs and services. ICT fully implemented the TRF system in April 2020.
3.2.9.2 Clients, interventions and expenditures
In FY1920, Saskatchewan served a total number of 22,009 clients (-3,198; -12.7%), which reflected a slight drop compared to FY1819, while demonstrating higher numbers in comparison to the previous 5 consecutive years. While former claimants (6,187) increased by 2.1% (+129), all other client type counts dropped: active claimants (7,799), PPE (6,600) and non-insured clients (1,423) all fell, by 11.9% (-1,051), 15.1% (-1,172), and 43.7% (-1,104), respectively. With respect to their proportion relative to the total number of clients, former claimants (28.1%) advanced by 4.1 percentage points; non-insured clients (6.5%) dropped by 3.5 percentage points; whereas active claimants (35.4%) and PPE (30.0%) have both remained somewhat stable.
After 4 consecutive years of growth, the total number of interventions dropped in FY1920, by 9.8% (-3,496) to 32,270. Despite the drop in total number of interventions compared to FY 1819, the results still demonstrate a higher number of interventions in comparison to those of the 3 years before FY1819. In FY1920, due to a change in categorization, Saskatchewan reported aggregate Canada Saskatchewan Job Grant (CSJG) program data under the Labour Market Partnership sub-category. Saskatchewan issued 1,011 job grants to 693 unique employers, and served 2,200 individual clients.
Employment Benefits remained the most used intervention type, with a share of 66.4%, a year-over-year increase of 2.2 percentage points. After participating in an EBSM-similar program, a total of 8,127 (+57.9%) individuals obtained employment. Unpaid EI benefit ($48.25) decreased by 1.7% year-over-year. Expenditures for EBSM-similar programming expanded from $43.0 million to $46.3 million, representing a year-over-year increase of 7.6%. This included $7.2 million received by the Province in FY1920, as part of the $250.0 million in additional LMDA funding from Budget 2017. This also included the Province's shares of the additional targeted funding to help workers in seasonal industries ($400,000), and to support workers affected by trade disputes with the US in the steel and aluminium industries ($700,000).
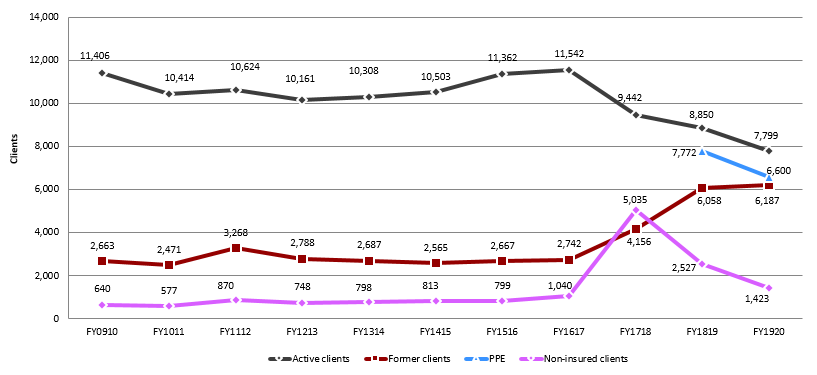
Text description of Chart 25
| FY0910 | FY1011 | FY1112 | FY1213 | FY1314 | FY1415 | FY1516 | FY1617 | FY1718 | FY1819 | FY1920 | |
|---|---|---|---|---|---|---|---|---|---|---|---|
| Active clients | 11,406 | 10,414 | 10,624 | 10,161 | 10,308 | 10,503 | 11,362 | 11,542 | 9,442 | 8,850 | 7,799 |
| Former clients | 2,663 | 2,471 | 3,268 | 2,788 | 2,687 | 2,565 | 2,667 | 2,742 | 4,156 | 6,058 | 6,187 |
| PPE | 7,772 | 6,600 | |||||||||
| Non-insured clients | 640 | 577 | 870 | 748 | 798 | 813 | 799 | 1,040 | 5,035 | 2,527 | 1,423 |
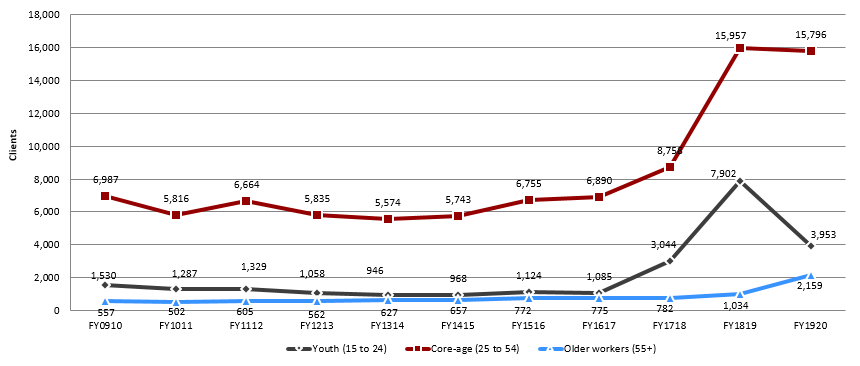
Text description of Chart 26
| FY0910 | FY1011 | FY1112 | FY1213 | FY1314 | FY1415 | FY1516 | FY1617 | FY1718 | FY1819 | FY1920 | |
|---|---|---|---|---|---|---|---|---|---|---|---|
| Youth (15 to 24) | 1,530 | 1,287 | 1,329 | 1,058 | 946 | 968 | 1,124 | 1,085 | 3,044 | 7,902 | 3,953 |
| Core-age (25 to 54) | 6,987 | 5,816 | 6,664 | 5,835 | 5,574 | 5,743 | 6,755 | 6,890 | 8,758 | 15,957 | 15,796 |
| Older workers (55+) | 557 | 502 | 605 | 562 | 627 | 657 | 772 | 775 | 782 | 1,034 | 2,159 |
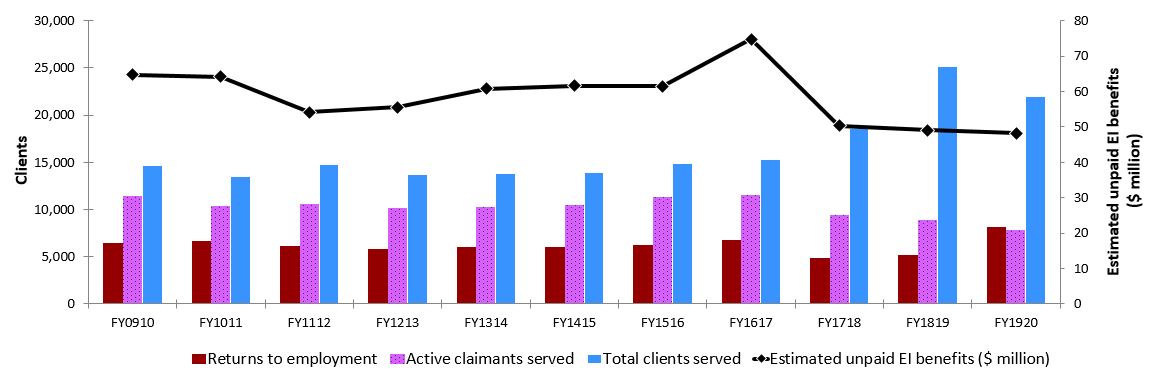
Text description of Chart 27
| FY0910 | FY1011 | FY1112 | FY1213 | FY1314 | FY1415 | FY1516 | FY1617 | FY1718 | FY1819 | FY1920 | |
|---|---|---|---|---|---|---|---|---|---|---|---|
| Returns to employment | 6,432 | 6,692 | 6,083 | 5,784 | 6,038 | 6,038 | 6,204 | 6,716 | 4,879 | 5,148 | 8,127 |
| Active claimants served | 11,406 | 10,414 | 10,624 | 10,161 | 10,308 | 10,503 | 11,362 | 11,542 | 9,442 | 8,850 | 7,799 |
| Total clients served | 14,709 | 13,462 | 14,762 | 13,697 | 13,793 | 13,881 | 14,828 | 15,324 | 18,633 | 25,207 | 22,009 |
| Estimated unpaid EI benefits ($ million) | $64.70 | $64.15 | $54.13 | $55.56 | $60.81 | $61.60 | $61.55 | $74.73 | $50.38 | $49.07 | $48.25 |
Table 14 – Saskatchewan: EBSM-Similar programming, FY1920
For accessibility reasons, the table has been simplified. Consult the PDF version for the full table.
| Employment Benefits | Program name | Interventions | Year-over-year change | Expenditures ($ 000s) |
|---|---|---|---|---|
| SD-R | Skills Training | Provincial Training Allowance | 15,431 | -2.20% | 31,485 |
| SD-A | Apprenticeship Training | 5,987 | -16.00% | |
| TWS | Skills Training Allocation | 0 | n/a | 0 |
| SE | Self-Employment Program | 0 | -100.00% | 0 |
| JCP | Employment Programs | 0 | N/A | 0 |
| Support Measures | Program name | Interventions | Year-over-year change | Expenditures ($ 000s) |
|---|---|---|---|---|
| EAS | Workforce Development | 10,852 | -15.20% | 10,467 |
| LMP | Regional Planning and Employer Partnerships | n/a | n/a | 4,194 |
| R&I | Research and Innovation | n/a | n/a | 138 |
3.2.9.3 Employment benefits
In FY1920, Saskatchewan delivered 1,557 (-6.8%) fewer interventions than in the previous fiscal year, for a total of 21,418. Declines in SE (-67; -100.0%), SD-R (-352; -2.2%) and SD-A (-1,138; -16.0%) resulted in this contraction. In FY1920, Saskatchewan re-categorized Self-Employment Services under the Support Measures category. This change in categorization caused a 100% decrease of SE interventions in the Employment Benefits category, and contributed to 192% increase in Counselling Services that falls within the Support Measures Category. In addition, a combination of collateral factors, such as changes to income support programming and Provincial Training Allowance (PTA) program underutilization might have contributed to a 2.2% decrease in SD-R interventions. The provincial apprenticeship system closely follows the economic and labour market cycles in Saskatchewan. Slowdown in the provincial construction market potentially contributed to lower demand for skills training programming, that is reflected in a 16% decrease in SD-A interventions. Employment Benefit expenditures increased by 3.9%, to a total of $31.5 million.
EBSMs in action
How Saskatoon Trades and Skills Centre (STSC) Helped to Make my Dreams Come True
When Tena was growing up as a young child in small town Bruno, Saskatchewan, she dreamed about a career working with children. In 2016, she was hit in a parking lot by a moving vehicle. It was only after being hit by a car that I thought "I got that wake-up call to do something meaningful with my life." During her rehabilitation, she had time to think and decided that her dream of working with children was worth pursuing. She used this goal to muster on through physiotherapy and medical appointments. In August 2019, she completed the Early Childhood Education (ECE) Level 1.
The ECE, Level 1 Certification is delivered as a partnership between STSC and Saskatchewan Polytechnic. Students complete 3 of the required courses over 3 months. "The program was tough but the instructors were fabulous. Cass and Jack from STSC are more than a coach and instructor. They became like family to me. Jack's regular classroom visits with jokes and stories about his students showed he genuinely cared about us. Cass was a one-of-a-kind instructor who supported me through the heavy coursework. She taught me how to write and think for myself. Brandene talked me through my anxieties."
Tena finished the course with marks in the 80s. "I exceeded my own expectations and could see my dreams come true." Within a week of finishing the course, Tena had 2 job offers. Today, she is an educator at the Central Saskatchewan Military Family Resource Centre (CSMFRC) Child Care in their pre-Kindergarten and Kindergarten room. Pinching herself every day that this is her new reality, she is loving it.
"What would I say to those considering the ECE? Go after your dreams. Never give up hope."
3.2.9.4 Support measures (EAS)
In Saskatchewan, total EAS interventions shrank from 12,791 (FY1819) to 10,852 (FY1920), a decline of 15.2% year-over-year. This decrease resulted from the change in Saskatchewan's program categorization process, as part of an alignment with the new Canada-Saskatchewan performance measurement strategy. Individual Counselling interventions experienced a 94.9% (+5,282) jump year-over-year, while Group Services (-293; -97.7%) dropped. Compared to FY1819, EAS expenditures dropped from $10.9 million to $10.5 million (-3.8%).
3.2.9.5 Other support measures: LMP and R&I
In FY1920, Saskatchewan's total LMP and R&I expenditures ($4.3 million) jumped by 133.4%. While LMP expenditures ($4.2 million) advanced by 198.5%, those of R&I ($138,000) contracted by 69.4%. Saskatchewan's R&I activities included a follow-up survey of clients in labour market programs, predictive analytics to inform policy and program improvements, labour market intelligence projects, career development training, as well as innovative approaches to client outreach and service delivery. Additionally, ICT conducted a follow-up survey of labour market program clients to obtain a fulsome picture of program outcomes. For the survey, Saskatchewan contracted a third party to contact program participants at 3 and twelve months following program completion or program exit.
Saskatchewan is in the process of implementing an enhanced Client Service Delivery model that is aimed to strengthen career development and build durable employment, as well as career pathways for clients. In particular, this new model helps clients develop detailed career plans that build on their individual strengths, goals and employment readiness.
3.2.10 Alberta
After increasing by 1.9% in 2018, Alberta's real GDP edged down slightly by 0.1% in 2019. For 2020, Alberta Treasury Board and Finance is expecting Alberta's economy to have contracted by 8.8%. The primary drivers of this contraction are expected to be a slow rebound of consumer and business confidence, low energy prices, the COVID-19 pandemic, and reduced global demand for oil.
Alberta: EBSM Key Facts
For accessibility reasons, the table has been simplified. Consult the PDF version for the full table.
| Insured clients | Non-insured clients |
|---|---|
| 49,024 |
27,886 |
| Intervention type | FY1920 | Year-over-year change |
|---|---|---|
| Employment Benefits | 20,226 | 11.50% |
| Support Measures: EAS | 99,272 | 29.40% |
| Intervention type | FY1920 | Year-over-year change (pp) |
|---|---|---|
| Employment Benefits | 16.90% | 5.5 |
| Support Measures: EAS | 83.10% | 5.5 |
| Total expenditures | FY1920 ($ million) | Year-over-year change |
|---|---|---|
| Employment Benefits | $106.30 | 15.10% |
| Support Measures: EAS | $55.00 | 2.90% |
| LMP and R&I | $3.30 | 34.30% |
| Total expenditures* | $164.60 | 6.90% |
| FY1819 | FY1920 | Year-over-year change |
|---|---|---|
| $205.88 | $195.73 | 4.90% |
* Totals may not add up due to rounding and does not include accounting adjustments.
Despite the downturn in Alberta's economy in 2019, the provincial employment (2,268,500) remained relatively stable (+900; +0.04%) in FY1920. Gains in part-time positions (+3,200; +0.8%) were somewhat compensated by losses in full-time positions (-2,300; -0.1%). The unemployment rate increased from 6.8% to 7.3%, as a result of a larger number of unemployed workers (+8.1% increase compared to FY1819) in the Province.
Weak employment resulted from the decline in the goods-producing sector (-11,600; -2.0%), namely in forestry, fishing, mining, quarrying, oil and gas (-11,200; -7.5%); and in construction (-7,900; -3.3%). However, utilities (+600; +2.7%), agriculture (+2,000; +4.3%) and manufacturing (+4,900; +3.7%) expanded significantly. As for the services-producing sector (+12,600; +0.7%), it increased from 1,679,400 to 1,692,000, mostly in finance, insurance, real estate and leasing (+600; +0.6%); professional, scientific and technical services (+5,900; +3.4%); educational services (+3,700; +2.4%); and health care and social assistance (+16,000; +5.9%). However, some industries in the services sector have weakened: transportation and warehousing (-1,600; -1.2%); business, building and other support services (-7,700; -9.1%); accommodation and food services (-1,500; -1.0%); and other services (-5,400; -4.8%).
In FY1920, Alberta worked closely with key stakeholders (Indigenous communities and organizations, Francophone communities, immigrants and persons with disabilities) to identify regional needs for programs and services, and to exchange information about the labour market. As a result, Alberta's labour market priorities were focussed on training for highly multi-barriered individuals, improving skills development, particularly in the growing information and communications technology sector, increasing Indigenous labour market participation, serving other under-represented groups such as persons with disabilities and newcomers. Furthermore, Alberta continued to expand the Targeting, Referral and Feedback (TRF) system, by on-boarding service providers in new and existing regions, to connect more EI applicants to services and programs and supported their return to work.
3.2.10.1 Managing for results
The public health order in response to the COVID-19 crisis, on March 16, 2020, shut down all face-to-face training and employment services in Alberta. Most of the training providers and service delivery agents in all ministries moved quickly to alternative delivery formats. Some programs were postponed or were unable to transition because of technology, internet access or clients' personal learning styles. The effectiveness of on-line delivery for some programs, such a, English as a Second Language, is still uncertain. COVID-19 did not impact learner enrollments in FY1920 since most programs were already underway. The full impact of COVID-19 is expected to have occurred in FY2021. As of October 30, 2020, Advanced Education (AE) saw enrolment drop by 23% compared to the same time last year.
In the 2019/2020 academic year, there were 25,241 apprentices registered in the post-secondary system. The cancellation of classroom instruction and new intakes in March 2020 affected 8,500 apprentices. Those who started before March 2, 2020 worked with their institutions to complete programs and assessments through distance learning options. Those who completed their program with good academic results were not required to take provincial examinations (theory or practical).
The Apprentice Training Award, a financial award for registered apprentices who are unemployed but attending classroom education, invested $1.8 million for over 1,600 recipients in 2019/2020. With increasing EI claimant numbers expected in FY2021, AE increased the award to $1,500, to support up to 3,300 students.
In July 2019, the apprenticeship funding per intervention was increased, from $3,000 to $5,000. The increase acknowledges inflationary cost increases for the program.
Career and employment information, assessments, service plan development, work experience placements and group workshops, provided by Community and Social Services (CSS), were paused or moved to online, mail and telephone delivery options where possible, in response to the pandemic.
Some contractors found creative ways of providing services, such as delivering job search packages to clients' doorsteps, arranging virtual interviews with employers, holding outdoor workshops or offering employment services through online meeting platforms.
Demand for employment services dropped off because referrals for job placements, career workshops and programs for persons with disabilities decreased, and many unemployed people were not seeking employment because they were home with children or accessing EI or CERB benefits.
Labour and Immigration (L&I) introduced targeted training and employment services for workers aged 55 and older, immigrants and women in non-traditional occupations (trades), as well as sector-targeted services, including technology and supply chain training. Transition to Employment Services (TES) expanded self-employment training, to increase rural participation through on-line delivery. L&I collaborated with CSS on a pilot project to get Albertans on Income Support into employment, through a Workplace Training/Career and Employment Information Services hybrid program.
Use of the Targeting, Referral and Feedback (TRF) application is steadily growing. It allows contracted service providers to contact EI applicants early in their claim to help them return to work. Service providers sort EI applicants by specific criteria (for example, last occupation, number of months tenure at the most recent job, level of education and/or age), in order to match them to available Transition to Employment Services, Workplace Training (Targeted Wage Subsidy) programs and some Integrated Training and Self Employment training programs.
In FY1920, TRF received 12,412 client files (of EI applicants), a 90% increase over FY1819; service providers made 12,501 attempts to contact clients (a 113% increase over FY1819), and had 5,025 interactions with clients to connect them to a suitable program or service (a 174% increase over FY1819).
3.2.10.2 Clients, interventions and expenditures
For a fourth consecutive year, the total number of clients served in Alberta decreased, amounting to 76,910, a year-over-year decline of 7.6%. With the exception of former claimants (13,704) which advanced by 5.1%, all other client types declined, with active claimants (27,561), premiums paid eligible (PPE) clients (7,759), and non-insured clients (27,886) dropping by 9.2%, 7.5%, and 11.4%, respectively. Compared to the previous fiscal year, the shares of former claimants (17.8%) increased by 2.1 percentage points, whereas that of non-insured clients (36.3%) dropped by 1.5 percentage points. The shares of active claimants (35.8%) and PPEs (10.1%) remained somewhat stable.
In FY1920, Alberta delivered a total of 119,498 interventions, a 24.8% decline year-over-year, and the fourth consecutive year where interventions dropped in the Province. EAS interventions represented 83.1% (-5.5 percentage points) of all interventions, and Employment Benefits made up 16.9% (+5.5 percentage points) of the total. The number of individuals employed after participating in EBSM-similar programming fell by 3.1% to 18,094, and unpaid EI benefits declined 4.9% year-over-year, reaching $195.73 million dollars. Total LMDA expenditures grew by 6.9% to $164.6 million. This included $29.7 million as part of a $250.0 million envelope in additional LMDA funding, announced in Budget 2017.
Apart from Alberta's annual expenditures, the Province did not access any of the $2.2 million made available by the Government of Canada, under the additional targeted funding measures to support workers in seasonal industries and those affected by trade disputes in the steel and aluminum industries.
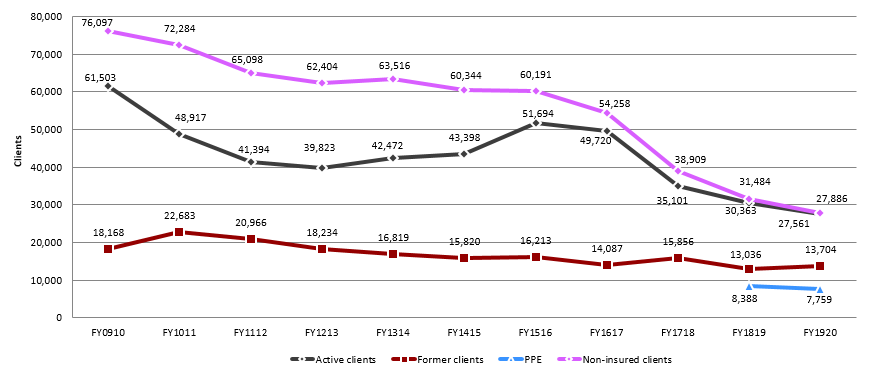
Text description of Chart 28
| FY0910 | FY1011 | FY1112 | FY1213 | FY1314 | FY1415 | FY1516 | FY1617 | FY1718 | FY1819 | FY1920 | |
|---|---|---|---|---|---|---|---|---|---|---|---|
| Active clients | 61,503 | 48,917 | 41,394 | 39,823 | 42,472 | 43,398 | 51,694 | 49,720 | 35,101 | 30,363 | 27,561 |
| Former clients | 18,168 | 22,683 | 20,966 | 18,234 | 16,819 | 15,820 | 16,213 | 14,087 | 15,856 | 13,036 | 13,704 |
| PPE | 8,388 | 7,759 | |||||||||
| Non-insured clients | 76,097 | 72,284 | 65,098 | 62,404 | 63,516 | 60,344 | 60,191 | 54,258 | 38,909 | 31,484 | 27,886 |
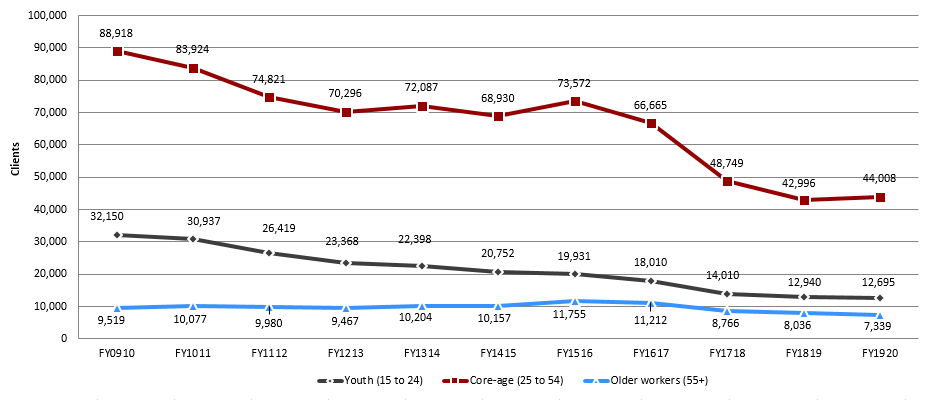
Text description of Chart 29
| FY0910 | FY1011 | FY1112 | FY1213 | FY1314 | FY1415 | FY1516 | FY1617 | FY1718 | FY1819 | FY1920 | |
|---|---|---|---|---|---|---|---|---|---|---|---|
| Youth (15 to 24) | 32,150 | 30,937 | 26,419 | 23,368 | 22,398 | 20,752 | 19,931 | 18,010 | 14,010 | 12,940 | 12,695 |
| Core-age (25 to 54) | 88,918 | 83,924 | 74,821 | 70,296 | 72,087 | 68,930 | 73,572 | 66,665 | 48,749 | 42,996 | 44,008 |
| Older workers (55+) | 9,519 | 10,077 | 9,980 | 9,467 | 10,204 | 10,157 | 11,755 | 11,212 | 8,766 | 8,036 | 7,339 |
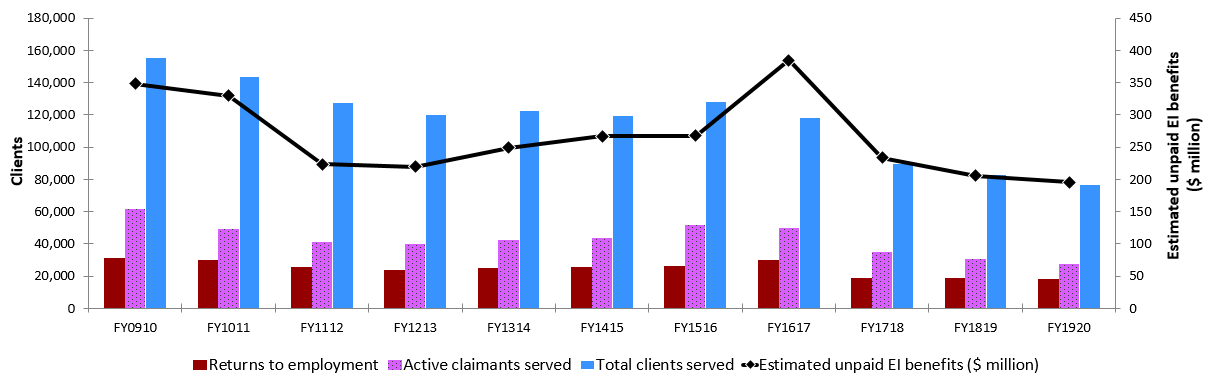
Text description of chart 30
| FY0910 | FY1011 | FY1112 | FY1213 | FY1314 | FY1415 | FY1516 | FY1617 | FY1718 | FY1819 | FY1920 | |
|---|---|---|---|---|---|---|---|---|---|---|---|
| Returns to employment | 31,341 | 29,890 | 25,776 | 23,686 | 25,092 | 25,745 | 26,525 | 29,671 | 18,726 | 18,669 | 18,094 |
| Active claimants served | 61,503 | 48,917 | 41,394 | 39,823 | 42,472 | 43,398 | 51,694 | 49,720 | 35,101 | 30,363 | 27,561 |
| Total clients served | 155,768 | 143,884 | 127,458 | 120,461 | 122,807 | 119,562 | 128,098 | 118,065 | 89,866 | 83,271 | 76,910 |
| Estimated unpaid EI benefits ($ million) | $347.95 | $329.59 | $223.61 | $219.63 | $249.34 | $266.98 | $267.88 | $384.91 | $233.42 | $205.88 | $195.73 |
Table 15 – Alberta: EBSM-Similar programming, FY1920
For accessibility reasons, the table has been simplified. Consult the PDF version for the full table.
| Employment Benefits | Program name | Interventions | Year-over-year change | Expenditures ($ 000s) |
|---|---|---|---|---|
| SD-R | Occupational Training Work Foundations | 3,749 | 192.00% | 87,828 |
| SD-A | Skills Development-Apprenticeship | 15,800 | 2.50% | |
| TWS | Workplace Training | 48 | -73.20% | 1,299 |
| SE | Self‑Employment | 379 | 45.80% | 1,946 |
| JCP | Integrated Training | 250 | -74.70% | 15,274 |
| Support Measures | Program name | Interventions | Year-over-year change | Expenditures ($ 000s) |
|---|---|---|---|---|
| EAS | Career Information | 99,272 | -29.40% | 55,003 |
| LMP | Workforce Partnerships | n/a | n/a | 3,282 |
3.2.10.3 Employment benefits
After 3 consecutive years of decline, the total number of Employment Benefit interventions increased in FY1920, reaching 20,226 (+2,094; +11.5%). While TWS (-131; -73.2%), and JCP (-737; -74.7%) contracted, SE (+119; +45.8%), SD-R (+2,465; +192.0%) and SD-A (+378; +2.5%) all expanded. The Province spent $106.3 million on Employment Benefits (+15.1%).
The greatest increases in Employment Benefits was in the Skills Development − Regular programs. Reasons for the increase include:
- the addition of Apprentice Training Award that supported 1,600 individuals in FY1920
- the reclassification of Job Creation Partnership programs to the Skills Development- Regular category, and
- increases in Training For Work (TFW) programs, which served increased numbers of recently unemployed, EI-eligible Albertans, providing increased services in rural Alberta communities (such as, new self-employment and Integrated Training programs) and an increase in Albertans accessing Transition to Employment Services
EBSMs in Action: Job Creation Partnerships
Integrated Training programs offer competency-based, occupation-related training opportunities for Albertans preparing for employment in the trades. These programs include Trades for Immigrants and Professionals, which focus on specific trades such as Plumbing, Carpentry, Heavy Duty Tech and Pipefitting, as well as Apprenticeship Preparation and Journeywomen Start, a program that supports women entering careers in the trades.
A Transition to Employment/Workplace Training Program hybrid in Calgary provides Transition to Employment Services and Workplace Training (WT) to unemployed Albertans impacted by the oil and gas decline. This program is designed to serve 125 clients per year.
A Workplace Training Program in Edmonton provides Youth-focused occupational training or work experience to enable Youth to acquire the skills and qualifications needed to find and maintain employment. The intent is also to provide a progression of training and work experience that would not otherwise occur that will lead to sustainable employment. This program is designed to serve 30 youth per year.
In response to the drop in oil prices and the impacts on Alberta's energy sector, we have:
- increased Supply Chain training, including new micro-credentials to increase knowledge and skills in technology use
- technology sector training for unemployed Albertans, including skilled professionals such as engineers, to help them pivot their skill sets to new occupations through training
- targeted programs for Immigrants and Youth
EBSMs in Action: Skills Development
Oteenow Employment and Training Society: Information Technology (IT) Essentials
This program demonstrates support for Indigenous Skills and Employment Training (ISET) agreement holders to prepare for workforce demands.
Twelve Indigenous community members will develop the skills needed to provide IT support through the Northern Alberta Institute of Technology (NAIT) Network Infrastructure Analyst Certificate Program.
The 8-course program offered by NAIT will prepare participants to provide critical network and information technology skills in communities and urban settings in Alberta at a time where connectivity and virtual work is becoming a critical need.
3.2.10.4 Support measures: Employment Assistance Services (EAS)
For a fourth consecutive year, EAS interventions fell in Alberta, reaching 99,272 (-41,415; -29.4%). In FY1920 under EAS, Alberta began reporting Individual Counselling (60,421 interventions) for the first time, while Employment Services dropped by 72.4% (-101,836), to 38,851. EAS total expenditures fell from $56.7 million to $55.0 million, a 2.9% year-over-year decrease.
The significant decrease in the total number of support measures interventions in Alberta, observed in FY1920, was due to changes in reporting under the new Labour Market Transfer Agreement Performance Measurement Plan (PMP) that took effect in FY1920.
EBSMs in Action: Employment Assistance Services
Alberta works to get Albertan's working.
Contracted service providers use the Targeting, Referral and Feedback (TRF) application to contact EI applicants and match them to support measures, such as the Transition to Employment Services (TES), or employment opportunities that are available.
TES helps all unemployed Albertans as well as targeted groups, for example, older workers, foreign-trained engineers, immigrants, and skilled professionals experiencing high unemployment (for example: geologists, engineers, human resources professionals) transition to new occupations. The program includes assessing previous skill sets to determine transferability into new or emerging sectors and occupations, arranging job placements and providing work experience support.
There are 35 TES centres in the Province that served 2,600 unemployed individuals in FY1920, 10% more than the previous year. Results included a 24% increase in job placements and a 29% increase in successful 90-day outcomes (that is, remained employed). 81% of the TES program participants were EI-eligible. 69% had successful outcomes and gained employment, which is slightly higher than last year's results.
3.2.10.5 Other support measures: LMP
Compared to FY1819, total funding for LMP fell by 34.3% to $3.3 million. In total, 47 organizations participated in LMP in FY1920. In order to address high unemployment in Alberta, these funds were shifted to programming for the recently unemployed. There were no reported expenditures under Research and Innovation in FY1920.
The LMP program supports workplace human resources development, labour market research, workforce adjustments and labour market strategies through partnerships with industry and community-based organizations. Several LMP projects focus on underrepresented groups such as youth, immigrants, women, Indigenous persons and visible minorities. These industry and community led projects ensure that Albertans are prepared to participate in Alberta's dynamic labour market. Working with specific industries and communities on labour market partnerships helps address distinct and emerging needs.
Of the 47 organizations that participated in LMP funded projects in Alberta in FY1920, 13 LMP grants were provided to Indigenous communities and stakeholders in the Province. The projects, which included job and career fairs, labour market surveys, Indigenous occupational and cultural awareness, reached 2,195 Indigenous stakeholders, job seekers and employers. They have improved Indigenous participation in the workforce.
3.2.11 British Columbia
In 2019, British Columbia's real GDP rose by 2.7%, exceeding the national growth (+1.9%). For 2020, forecasters expect the Province's economy to have contracted by approximately 6.7%, with many of the Province's industries impacted by COVID-19.
British Columbia: EBSM key facts
For accessibility reasons, the table has been simplified. Consult the PDF version for the full table.
| Insured clients | Non-insured clients |
|---|---|
| 38,985 |
19,677 |
| Intervention type | FY1920 | Year-over-year change |
|---|---|---|
| Employment Benefits | 49,018 | 142.90% |
| Support Measures: EAS | 87,181 | 38.30% |
| Intervention type | FY1920 | Year-over-year change (pp) |
|---|---|---|
| Employment Benefits | 36.00% | 23.5 |
| Support Measures: EAS | 64.00% | 23.5 |
| Total Expenditures | FY1920 ($ million) | Year-over-year change |
|---|---|---|
| Employment Benefits | $217.80 | 21.30% |
| Support Measures: EAS | $51.30 | 48.60% |
| LMP and R&I | $16.00 | 38.40% |
| Total Expenditures* | $285.10 | 6.60% |
| FY1819 | FY1920 | Year-over-year change |
|---|---|---|
| $136.81 | $138.74 | 1.40% |
- * Totals may not add up due to rounding; does not include accounting adjustments.
In FY1920, British Columbia's employment increased by 38,400 (+1.5%). Employment growth was concentrated mainly in full-time positions (+35,200; +1.7%), whereas the number of part-time positions (+3,200; +0.6%) remained relatively stable. The unemployment rate grew by 0.3 percentage points to 5.0%.
British Columbia's employment was driven entirely by the services-producing sector (+48,000; +2.3%). Major job creation occurred in industries such as trade (+15,800; +4.1%); finance, insurance, real estate and leasing (+12,800; +8.3%); professional, scientific and technical services (+8,900; +4.1%); business, building and other support services (+6,500; +6.1%); educational services (+6,900; +3.9%); and public administration (+8,800; +7.9%). However, other industries in the services sector contracted significantly: health care and social assistance (-4,700; -1.4%); information, culture and recreation (-1,800; -1.4%); accommodation and food services (-4,000; -2.0%); and other services (-1,600; -1.3%). On the other hand, the goods-producing sector (-9,700; -1.9%) weakened. More precisely, losses in forestry, fishing, mining, oil and gas (-6,200; -11.8%); manufacturing (-7,200; -4.1%); and, utilities (-1,000; -7.0%) were partially offset by gains in agriculture (+3,100; +12.1%) and construction (+1,700; +0.7%).
In FY1920, British Columbia's priorities focused on 4 areas to help people gain the skills and training needed to get good lasting jobs in their communities, and to help communities build a strong workforce and economy:
- providing flexible, reliable and accountable employment services that make it easier for British Columbians to get and keep good paying jobs
- supporting all British Columbians to reach their full potential for better jobs, better lives
- building an efficient labour market to support communities in a way that works for everyone, and
- creating stronger programs and services for people and communities by using evidence, best practices and innovation
British Columbia remains flexible and adaptable to an ever-changing environment, emerging labour market events and unexpected crises such as COVID-19. The Province is committed to timely and responsive actions to protect the safety of British Columbians and front-line service providers and staff, as well as to support service continuity and assist employers and communities facing hardship in the global pandemic.
3.2.11.1 Managing for results
Launch of WorkBC Employment Services
With the launch of the WorkBC program on April 1, 2019, British Columbia took the opportunity to update its employment services model to be more outcomes focused. The changes were designed to offer better support to people looking to re-enter the workforce and find employment and access training opportunities. The WorkBC launch also included the implementation of 2 dedicated, Province-wide contracts. They include the Assistive Technology Services program that provides persons with disabilities access to assistive technology services they require to achieve or maintain sustainable employment. They also include the Apprentice Services program that provides services and supports to help apprentices access the technical training portion of their apprenticeship.
Targeting, Referral and Feedback Initiative
In the fall of 2016, British Columbia launched the Targeting, Referral and Feedback (TRF) initiative across the Province to assist EI applicants return to employment more quickly, by identifying and connecting these individuals with their local WorkBC Centre.
For FY1920, TRF smoothly transitioned into the new WorkBC program. Within the first 2 months of program launch, all 45 catchments in British Columbia had re-assessed referral criteria and completed selection to identify EI applicants of interest in the local communities.
In FY1920, more than 3,300 EI applicants referred through TRF began working with a WorkBC Case Manager, and about 2,600 referred clients had achieved and sustained employment (including those who began services in previous years). Clients achieved employment in a wide range of occupations, including high-demand jobs in construction, transportation, administration, and retail.
Connected with stakeholders and employers
British Columbia's partnerships and collaboration help drive opportunities, respond to labour market trends and meet the employment needs of job seekers and employers. The Province has been:
- holding engagement sessions throughout the Province to hear experiences and to seek input to improve employment programs and services. B.C. engaged representatives from over 100 organizations, including organizations serving Indigenous peoples, persons with disabilities and other underrepresented groups
- increasing focus on employer outreach throughout the Province to promote WorkBC Centres as a source of talent, while supporting priority sectors and shifting labour market trends, particularly as a result of the COVID-19 pandemic
- working with the Ministry of Advanced Education, Skills and Training (MAEST), as well as Community Living BC, to ensure WorkBC and other community programs are complementary, client referral processes between programs are streamlined and marketing materials are up to date
- promoting WorkBC services and Community and Employer Partnership (CEP) funding opportunities to communities impacted by employer closures, downturns in specific sectors, as well as impacts from events such as wildfires
- promoting the Employer Sponsored Training program, under the Labour Market Partnerships (LMP) Support Measure, to eligible employers, by offering financial assistance to support training activities for employees who would otherwise lose their jobs, and
- working with MAEST, the Ministry of Forest, Lands and Natural Resource Operations and Rural Development, as well as the Ministry of Indigenous Relations and Reconciliation, to ensure coordinated responses and complementary programming between Community and Employer Partnership (CEP) and other programs
Improved Program Assessment and Monitoring
The British Columbia Behavioural Insights Group (BC BIG) is a unit, in the British Columbia Public Service Agency, that applies behavioural science knowledge and methods to design better programs and services for British Columbians. In FY1920, British Columbia partnered with BC BIG to improve the client experience during the online WorkBC application process. This project culminated in valuable knowledge from a team of analytics, computer science and behavioural specialists, to develop innovative improvements to the client experience.
British Columbia also explored the use of technology to automate WorkBC client eligibility screening and approvals.
3.2.11.2 Clients, interventions and expenditures
For a sixth consecutive year, British Columbia served a decreasing total number of clients, dropping by 4.9% year-over-year, to 58,662 clients. Active claimants (25,584) and non-insured clients (19,677) declined by 9.9% and 15.7%, respectively. Former claimants (8,607) and PPE clients (4,794) advanced by 22.0% and 65.1%, respectively. As for their shares relative to the total number of clients, active claimants (43.6%) and non-insured clients (33.5%) dropped by 2.4 and 4.3 percentage points, respectively; while former claimants (14.7%) and PPE clients (8.2%) rose by 3.3 and 3.5 percentage points, respectively.
Change in reporting methodology
As a result of changes to the LMDA Benefits and Measures, alongside the launch of the WorkBC program, multiple intervention types were reclassified into different reporting categories in FY1920. Therefore, year-over-year comparison should be made with caution.
In FY1920, the Province delivered 25,272 fewer interventions (-15.7%) than in the previous fiscal year, for a total of 136,199. EAS interventions represented 64.0% (-23.5 percentage points) of all interventions. A total number of 20,491 (-1,024; -4.8%) individuals were employed after participating in an EBSM-similar intervention, and unpaid EI benefits rose by 1.4% to $138.74 million. Total EBSM expenditures reached $285.1 million (-6.6%) in FY1920, including $25.2 million of the $250 million in additional LMDA funding announced in Budget 2017. British Columbia also received additional targeted LMDA funding through the following special measures: $1.6 million to support workers affected by the steel and aluminum industries' trade dispute, as well as close to $1.0 million to support workers in seasonal industries.
This year, the additional LMDA funding provided to British Columbia under Budget 2017 was used to assist the smooth transition to the newly launched WorkBC Employment Services, and to help clients better access skills training and supports. Activities included:
- transitioning active clients from the previous employment program to WorkBC
- supporting 6 communities affected by job loss due to mill closures
- providing additional client support funding where needed, and
- enhancing the WorkBC financial model to ensure contractors and clients receive the right funding and supports to secure long-term sustainable employment
The Province also leveraged some of the additional targeted funding to support workers and communities through CEP projects. As a direct result of CEPs focus on impacted Forestry Communities in Transition, participants gained work experience and skills development in 7 Job Creation Partnerships (JCP) projects and via Project Based Labour Market Training (PBLMT) projects that received over $3.3 million, including:
- carpentry and milling constructing 5 guest cabins in Clearwater, using a combination of post-and-beam timber framing, panel frame construction and finish carpentry
- food security: food waste reduction, including food sourcing, safe food handling, food preservation, preparation and meal planning to support food insecure residents of Fort St. John
- residential building maintenance: training for general handyman, apartment building maintenance worker, work camp maintenance worker and construction worker positions in the Mackenzie area
- wildfire risk assessment and mitigation: assessing over 250 properties in the Thompson-Cariboo regions
- adventure resort work: training for resort worker, campground worker, tourist guide, ski hill worker, ski lift attendant, ranch hand positions in 100 Mile House and Quesnel areas
- roadbuilding: training for road building and heavy construction in the South Cariboo, and
- transportation: training for long haul and bus drivers in the Cariboo region
In addition, LMP funding has provided over $1.5 million to support Communities in Transition that:
- developed recommendations on the overall financial and labour market impact of the current Forestry downturn relating to harvesting, trucking, roadbuilding, silviculture, forestry consulting, and other affected miscellaneous businesses in BC's Interior, and
- updated the curriculum and conducted a pilot cohort of the Working in Natural Gas (WiNG) entry level training program, which was created at the direction of the natural gas industry, to recruit and develop potential workers from around the Province
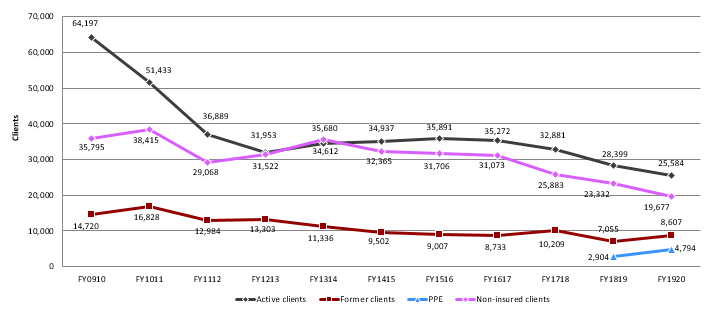
Text description of chart 31
| FY0910 | FY1011 | FY1112 | FY1213 | FY1314 | FY1415 | FY1516 | FY1617 | FY1718 | FY1819 | FY1920 | |
|---|---|---|---|---|---|---|---|---|---|---|---|
| Active clients | 64,197 | 51,433 | 36,889 | 31,953 | 34,612 | 34,937 | 35,891 | 35,272 | 32,881 | 28,399 | 25,584 |
| Former clients | 14,720 | 16,828 | 12,984 | 13,303 | 11,336 | 9,502 | 9,007 | 8,733 | 10,209 | 7,055 | 8,607 |
| PPE | 2,904 | 4,794 | |||||||||
| Non-insured clients | 35,795 | 38,415 | 29,068 | 31,522 | 35,680 | 32,365 | 31,706 | 31,073 | 25,883 | 23,332 | 19,677 |
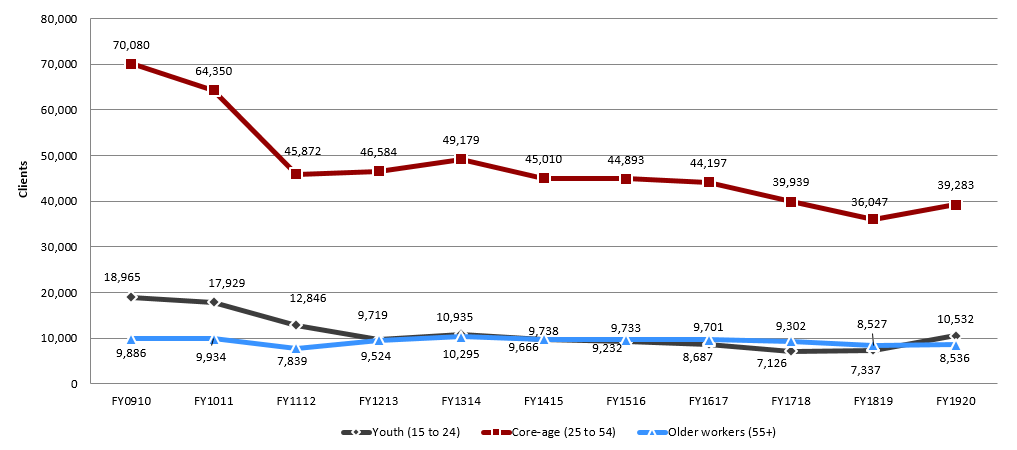
Text description of chart 32
| FY0910 | FY1011 | FY1112 | FY1213 | FY1314 | FY1415 | FY1516 | FY1617 | FY1718 | FY1819 | FY1920 | |
|---|---|---|---|---|---|---|---|---|---|---|---|
| Youth (15 to 24) | 18,965 | 17,929 | 12,846 | 9,719 | 10,935 | 9,666 | 9,232 | 8,687 | 7,126 | 7,337 | 10,532 |
| Core-age (25 to 54) | 70,080 | 64,350 | 45,872 | 46,584 | 49,179 | 45,010 | 44,893 | 44,197 | 39,939 | 36,047 | 39,283 |
| Older workers (55+) | 9,886 | 9,934 | 7,839 | 9,524 | 10,295 | 9,738 | 9,733 | 9,701 | 9,302 | 8,527 | 8,536 |
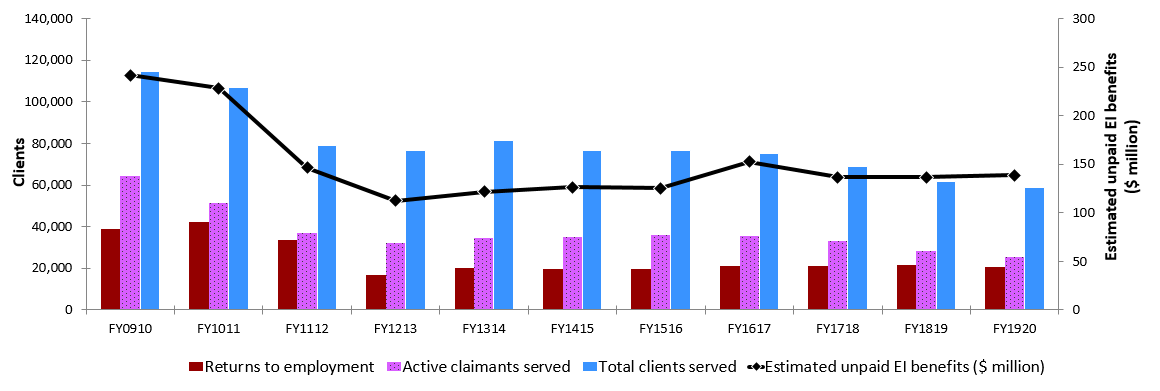
Text description of chart 32
| FY0910 | FY1011 | FY1112 | FY1213 | FY1314 | FY1415 | FY1516 | FY1617 | FY1718 | FY1819 | FY1920 | |
|---|---|---|---|---|---|---|---|---|---|---|---|
| Returns to employment | 38,931 | 42,082 | 33,580 | 16,777 | 20,040 | 19,818 | 19,552 | 21,050 | 20,997 | 21,515 | 20,491 |
| Active claimants served | 64,197 | 51,433 | 36,889 | 31,953 | 34,612 | 34,937 | 35,891 | 35,272 | 32,881 | 28,399 | 25,584 |
| Total clients served | 114,712 | 106,676 | 78,941 | 76,778 | 81,628 | 76,804 | 76,604 | 75,078 | 68,973 | 61,690 | 58,662 |
| Estimated unpaid EI benefits ($ million) | $241.66 | $228.44 | $146.43 | $112.51 | $121.85 | $126.47 | $125.29 | $152.70 | $136.56 | $136.81 | $138.74 |
Table 16 – British Columbia: EBSM-similar programming, FY1920
For accessibility reasons, the table has been simplified. Consult the PDF version for the full table.
| Employment Benefits | Program name | Interventions | Year-over-year change | Expenditures ($ 000s) |
|---|---|---|---|---|
| SD-R | Skills Development Employment Benefit | 32,734 | 1011.90% | 177,294 |
| SD-A | Skills Development Employment Benefit – Apprenticeship | 13,710 | -1.00% | |
| TWS | Wage Subsidies | 876 | -41.60% | 13,954 |
| SE | Self-Employment | 1487 | -12.00% | 15,792 |
| JCP | Job Creation Partnerships | 211 | 3.40% | 10,796 |
| Support Measures | Program name | Interventions | Year-over-year change | Expenditures ($ 000s) |
|---|---|---|---|---|
| EAS | Employment Assistance Services | 87,181 | -38.30% | 51,279 |
| LMP | Labour Market Partnerships Employer | n/a | n/a | 8,860 |
| Sponsored Training | ||||
| R&I | Research and Innovation | n/a | n/a | 7,176 |
3.2.11.3 Employment benefits
Compared to the previous fiscal year, British Columbia delivered 28,836 (+142.9%) more Employment Benefit interventions in FY1920. While declines were recorded in TWS (-625; -41.6%), SE (-203; -12.0%) and SD-A (-133; -1.0%), JCP (+7; +3.4%) and SD-R totals (+29,790; +1,011.9%) both increased. The Province spent $217.8 million (+21.3%) on Employment Benefits.
3.2.11.4 Employment Assistance Services
For a sixth consecutive year, EAS interventions dropped in British Columbia, reaching 87,181 (-54,108; -38.3%) in FY1920. Employment Services (-56,685; -56.6%) contracted significantly, while Individual Counselling (+2,635; +6.4%) increased. For the first time since FY1314, Group Services were not delivered by British Columbia. EAS expenditures fell from last fiscal year's total of $99.7 million, to $51.3 million in FY1920.
3.2.11.5 Other support measures: LMP and R&I
LMP and R&I funding in British Columbia decreased by 38.4%, to $16.0 million in FY1920. LMP ($8.9 million) and R&I ($7.2 million) dropped by 19.1% and 52.4%, respectively.
In addition to providing direct services and supports to help British Columbians participate productively in the labour force, the province continued to leverage funding from CEP (through LMP and R&I). This was undertaken to understand unique local labour market issues and trends, and collaborate with employers communities to address labour force imbalances and assist with their human resource challenges, as well as to identify innovative approaches to help people find and keep good jobs. This year, these key activities include:
- a study to test whether Cognitive Remediation Therapy, in conjunction with current Individualized Placement and Supports, improve employment outcomes for individuals with severe mental illness
- piloting an innovative approach, using Individual Placement Support and Peer Support, to help at-risk individuals accessing primary care services in the Vancouver Downtown Eastside, in order to gain meaningful employment
- the development of a technical Occupational Framework/Matrix of 20 technical occupations, through the testing of occupational alignment, to support the hiring of persons with disabilities in the technical and other sectors, and
- Research to identify, implement, evaluate and measure the resulting changes of an untested, culturally rich approach to removing the systemic barriers to employment faced by Indigenous youth
Spotlight: Social Innovation: Supportive Employer Guidebook – Labour Market Partnerships
British Columbia invested almost $187,000 in the Supportive Employer Guidebook, a socially innovative LMP project with the Mission Possible Compassionate Ministries Society.
This project identified the unique human resource policies and training frameworks needed to operate as a supportive employer to hire people residing in the Vancouver Downtown Eastside (DTES) whose persistent barriers to traditional employment exclude them from the workforce. With the information gathered, a supportive employer guidebook was produced titled 'Untapped Talent B2BFootnote 18 Guide to Innovative Hiring and Retention' which outlined specific policies and implementation strategies (best practices) for employers. Success stories within the guidebook will inspire and enable employers to consider using this supportive employment model.
Building an efficient labour market to support communities in a way that works for everyone is a priority of the Province. The B2B Guide will address labour market shortages experienced in entry-level positions by sharing information in developing innovative, inclusive and supportive hiring and retention practices that will enable employers to access an untapped talent pool. As a result, it will also benefit the community as a whole, by enabling more people to live above the poverty line and gain economic independence.
Spotlight: Nourish - Job Creation Partnerships
The Northern Environmental Action Team (NEAT) received $85,000 in Job Creation Partnership (JCP) funding to support multi-barriered unemployed job seekers gain the skills needed to become employed in the food service industry. Some participants had been experiencing significant challenges maintaining employment for more than a few weeks.
The NOURISH project recovers food waste from local grocery outlets, market garden producers, and kitchens at the Site C work project, processes it in partnership with Salvation Army commercial kitchens, and redistributes it to assist community members with food needs such as low-income families and seniors. Project participants receive skills training, achieve Food Safe certification, and gain work experience in several fields: research and data analysis, community engagement, partnership development, food preservation, meal planning, budgeting, marketing, and food preparation.
This social innovation project addresses local food waste issues and supports poverty reduction by providing individuals living in poverty or low-income situations with sustainable and reclaimed food. It addresses local challenges beyond unemployment, a lasting difference on both the participants and the community.
Spotlight: Skills Development and Career Transformation
John had been working at a local mill that provided a closure notice in early spring. John immediately started searching for another job until his last day of work in late summer. He applied for over 20 jobs in his community, but found that there were limited options for people without post-secondary education. Despite his efforts, John only received 1 job interview. Fortunately, he was encouraged by his previous employer to reach out to WorkBC.
At WorkBC, John benefited from a whole suite of services from job search workshops to career planning. With the help of WorkBC, John decided to pursue an Education Assistant Certificate Program. At the end of a fast-paced year of online instruction, John graduated from the program and, 2 months later, was hired by the school district and has been working there ever since.
John is very grateful for the support he received from WorkBC for his journey over the past 14 months. As a result of the help he received, he expanded his education, redesigned his future and began a new career path that he finds both enjoyable and fulfilling.
3.2.12 Northwest Territories
Northwest Territories' real GDP declined by 8.0% in 2019, the largest decline since 2011, following a growth rate of 0.8% in 2018.
Northwest Territories: EBSM Key Facts
For accessibility reasons, the table has been simplified. Consult the PDF version for the full table.
| Insured clients | Non-insured clients |
|---|---|
| 280 |
19 |
| Intervention type | FY1920 | Year-over-year change |
|---|---|---|
| Employment Benefits | 300 | 26.10% |
| Support Measures: EAS | 418 | 76.30% |
| Intervention type | FY1920 | Year-over-year change (pp) |
|---|---|---|
| Employment Benefits | 41.80% | 29.9 |
| Support Measures: EAS | 58.20% | 29.9 |
| Total expenditures | FY1920 ($ million) | Year-over-year change |
|---|---|---|
| Employment Benefits | $2.20 | 24.60% |
| Support Measures: EAS | $0.80 | 14.30% |
| LMP and R&I | $0.08 | 50.50% |
| Total expenditures* | $3.10 | 7.60% |
| FY1819 | FY1920 | Year-over-year change |
|---|---|---|
| $1.64 | $1.43 | 12.80% |
- * Totals may not add up due to rounding; does not include accounting adjustments.
Employment in the Northwest Territories declined (-400; -1.9%) in FY1920 with drops in both full-time (-250; -1.2%) and part-time (-150; -5.9%) employment. The number of unemployed workers increased by 350 (+21.2%) year-over-year, going from 1,650 to 2,000. As a result, the Territory's unemployment rate increased by 1.5 percentage points, from 6.7% to 8.2% year-over-year.
In FY1920, the Northwest Territories continued to implement the Skills 4 Success Four-Year Action Plan 2016 to 2020. The latest key strategy of this action plan, released in May 2018, was the Northwest Territories Small Communities Employment Strategy, to enhance employment and training opportunities and outcomes in the small communities of the territory. In addition, Apprenticeship, Trades and Occupational Certification Strategy 2017 to 2022 was released in June 2017, to improve training, apprenticeship, certification and opportunities in the skilled trades, as well as industrial occupations, in the territory. Consistent with the overall objectives of the Skills 4 Success Four-Year Action Plan 2016 to 2020, the territory's priorities of the Labour Market Development Agreement were to:
- provide access to programs for EI clients, in order to enhance their skills and increase their likelihood of returning to work quickly
- develop the tools to identify EI clients earlier in their claim, in order to offer them more relevant and better adapted programming, and
- continue to provide quality career development resources and services through Regional Education, Culture and Employment (ECE) Service Centres
The Northwest Territories had to adapt its program delivery and offer more flexibilities to clients, because of the impact of COVID-19 at the end of FY1920. The Territory's approach was to not penalize any client impacted by COVID-19, and to continue to provide the pre-approved funding, even if the training was cancelled or postponed. Future editions of this report will present more details about the impacts of the COVID-19 crisis.
3.2.12.1 Managing for results
The Government of the Northwest Territories (GNWT) took a multi-pronged approach to stakeholder engagement. This included ongoing engagement at the regional and community level, through Regional ECE Service Centres, working with regional training committees, education and training providers, Indigenous Governments, community organizations, as well as businesses in the communities, to serve the career development needs of individuals and communities. The GNWT also, over the course of the past 4 years, has undertaken larger scale engagements, as part of Skills 4 Success and the development of complementary strategies. In addition, the territory is currently implementing the Targeting, Referral and Feedback (TRF) system.
3.2.12.2 Clients, interventions and expenditures
Compared to FY1920, the Northwest Territories served a total of 299 clients, a decline of 71.7% year-over-year. All client types contracted significantly, with active claimants (134), former claimants (61), PPE clients (85), and non-insured clients (19) decreasing by 49.6%, 70.2%, 62.9%, and 94.6%, respectively. In terms of their shares of the total number of clients, active claimants (44.8%), former claimants (20.4%), and PPE clients (28.4%) advanced by 19.6, 1.0, and 6.7 percentage points, whereas non-insured clients (6.4%) decreased by 27.2 percentage points.
In FY1920, the Northwest Territories delivered 1,282 (-64.1%) fewer interventions than in FY1819, for a total of 718. The proportion of Employment Benefits jumped from 11.9% to 41.8% (+29.9 percentage points year-over-year), with EAS interventions making up the majority (58.2%) of all interventions. The number of individuals returning to work after participating in an EBSM-similar intervention rose by 2.2% to 185, and unpaid EI benefits fell (-12.8%) to $1.43 million. In total, 185 individuals (+2.2%) returned to employment after participating in EBSM-similar programming. EBSM expenditures totalled $3.1 million (+7.6%), including $340,000 representing Northwest Territories' portion of the $250.0 million in additional LMDA funding announced in Budget 2017. While no new programs were created as a result of this additional LMDA funding, the enhanced contribution helped support more individuals, employers and organizations.
In addition to these expenditures, $250,000 in additional targeted funding was made available to support workers in seasonal industries, which the Territory did not access.

Text description of chart 34
| FY0910 | FY1011 | FY1112 | FY1213 | FY1314 | FY1415 | FY1516 | FY1617 | FY1718 | FY1819 | FY1920 | |
|---|---|---|---|---|---|---|---|---|---|---|---|
| Active clients | 478 | 413 | 327 | 314 | 347 | 294 | 325 | 306 | 333 | 266 | 134 |
| Former clients | 130 | 134 | 153 | 144 | 151 | 138 | 195 | 156 | 343 | 205 | 61 |
| PPE | 229 | 85 | |||||||||
| Non-insured clients | 368 | 388 | 437 | 460 | 532 | 500 | 849 | 573 | 793 | 355 | 19 |
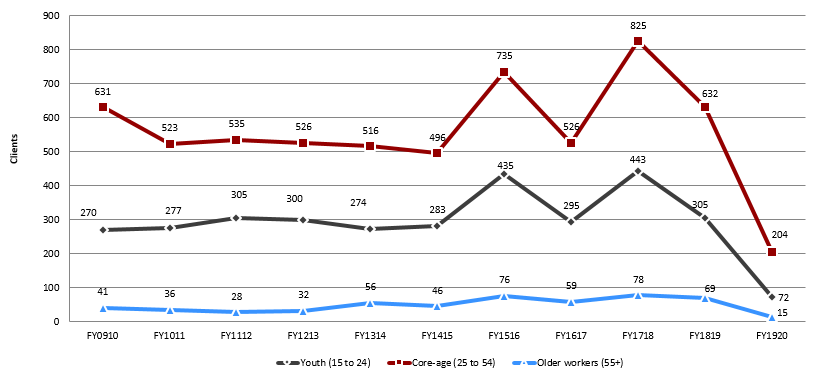
Text description of chart 35
| FY0910 | FY1011 | FY1112 | FY1213 | FY1314 | FY1415 | FY1516 | FY1617 | FY1718 | FY1819 | FY1920 | |
|---|---|---|---|---|---|---|---|---|---|---|---|
| Youth (15 to 24) | 270 | 277 | 305 | 300 | 274 | 283 | 435 | 295 | 443 | 305 | 72 |
| Core-age (25 to 54) | 631 | 523 | 535 | 526 | 516 | 496 | 735 | 526 | 825 | 632 | 204 |
| Older workers (55+) | 41 | 36 | 28 | 32 | 56 | 46 | 76 | 59 | 78 | 69 | 15 |
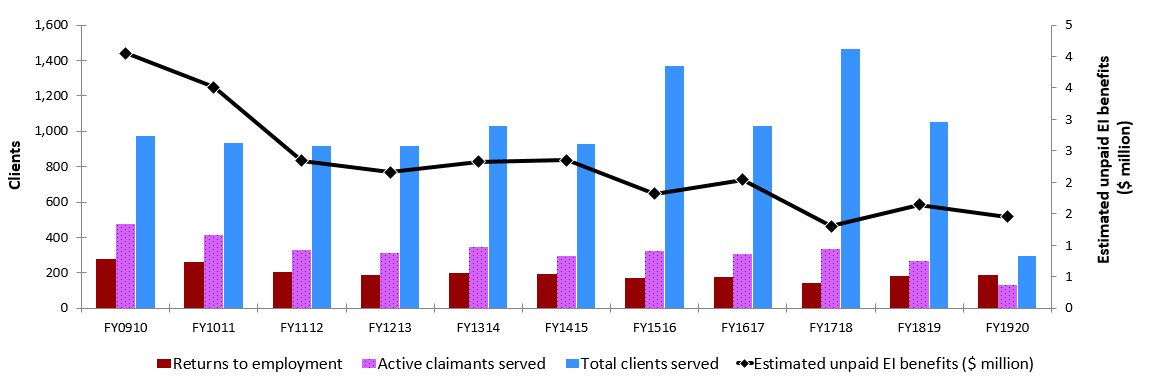
Text description of chart 36
| FY0910 | FY1011 | FY1112 | FY1213 | FY1314 | FY1415 | FY1516 | FY1617 | FY1718 | FY1819 | FY1920 | |
|---|---|---|---|---|---|---|---|---|---|---|---|
| Returns to employment | 278 | 263 | 202 | 185 | 200 | 193 | 173 | 177 | 142 | 181 | 185 |
| Active claimants served | 478 | 413 | 327 | 314 | 347 | 294 | 325 | 306 | 333 | 266 | 134 |
| Total clients served | 976 | 935 | 917 | 918 | 1,030 | 932 | 1,369 | 1,035 | 1,469 | 1,055 | 299 |
| Estimated unpaid EI benefits ($ million) | $4.05 | $3.51 | $2.34 | $2.16 | $2.33 | $2.35 | $1.82 | $2.04 | $1.30 | $1.64 | $1.45 |
Table 17 – Northwest Territories: EBSM-similar programming, FY1920
For accessibility reasons, the table has been simplified. Consult the PDF version for the full table.
| Employment Benefits | Program name | Interventions | Year-over-year change | Expenditures ($ 000s) |
|---|---|---|---|---|
| SD-R | Skills Development - Regular | 131 | 50.60% | 778 |
| SD-A | Skills Development - Apprenticeship | 137 | 8.70% | |
| TWS | Wage Subsidies | 26 | 85.70% | 1,074 |
| SE | Self-Employment | 6 | -45.50% | 315 |
| JCP | Job Creation Partnerships | 0 | n/a | 21 |
| Support Measures | Program name | Interventions | Year-over-year change | Expenditures ($ 000s) |
|---|---|---|---|---|
| EAS | Employment Assistance Services | 418 | -76.30% | 821 |
| LMP | Labour Market Partnerships (Strategic Workforce Initiatives) | n/a | n/a | 75 |
| R&I | Research and Innovation | n/a | n/a | 0 |
3.2.12.3 Employment benefits
Compared to FY1819, the Northwest Territories delivered more Employment Benefit interventions (300) in FY1920, representing a 26.1% year-over-year increase. SD-R (+44; +50.6%), SD-A (+11; +8.7%) and TWS (+12; +85.7%) contributed to the overall growth. On the other hand, SE dropped by 45.5% (-5). Employment Benefit expenditures grew by 24.6%, to $2.2 million.
3.2.12.4 Support measures: EAS
EAS interventions (418) in the Northwest Territories dropped by 76.3% in FY1920. This decline is mainly attributed to Individual Counselling (-1,351; -76.7%). The Territory invested $821,000 (-14.3%) in EAS.
3.2.12.5 Other support measures: LMP and R&I
For a fourth consecutive year, total funding for other support measures dropped, amounting to $75,000 (-50.5%) in FY1920. The other support measures were funded solely through LMP, which remained stable year-over-year.
Employer-Sponsored Training component of Labour Market Partnerships
Wage Subsidy Program (WSP): The Wage Subsidy Program provided support to an employer to hire and train Northwest Territories' residents while on the job. This program is intended to provide work experience and training that will better enable clients to obtain meaningful, long-term employment. The WSP projects were supported under the LMDA or Workforce Development Agreements funding.
Employee Training Program (ETP): The Employee Training Program assisted employers, who have proactively hired employees in anticipation of their workforce needs, to offset the cost of training for new employees. The ETP assisted employers who require employee up-skilling due to economic, technological and/or organizational change. It may be used to support employees who are under-employed or employed and in need of training, to maintain their current job and/or advance, progress or move to a different and/or better job. The ETP was accessed in conjunction with the Wage Subsidy Program (WSP), to offset the costs of training employees.
Results/lessons learned for any research and innovation projects that concluded in FY1920
Although it did not conclude in FY1920, the implementation of the Career and Education Advisor positions is a model that is new to the Territory: these positions have provided valuable information and services to the youth of the Northwest Territories, by preparing these individuals for in-demand job opportunities. The 4 priorities of this initiative are:
- improving career and academic educational counseling support to high school students and youth to promote the Northwest Territories' jobs in demand
- providing outreach services to the Northwest Territories postsecondary students receiving Student Financial Assistance (SFA), to connect with in-demand employers
- promoting the Northwest Territories' apprenticeship in skilled trades and certified occupations as first choice careers, to increase the number of the Northwest Territories' students and youth pursuing these in-demand careers, and
- supporting evidence-based and informed educational, career and business decisions, with a new interactive Northwest Territories Labour Market Information Portal
EBSMs in action – Labour Market Programs
In the Beaufort-Delta region, the daycare has been using the Labour Market Programs for several years to train staff from entry level positions, to skilled positions. Their staff mostly use online training, as there are no local training providers and the living allowance support contributes to the success of the training as they are not rushing to train while working full-time. Their Outreach Program Coordinator received training through the wage subsidy program after developing her career action plan with our Career Development Officer and the employer. It helped her general sense of confidence in building relationships with organizations in the community. The funding is also helping strengthen the organization's employee base and giving their staff skills in their profession.
3.2.13 YukonFootnote 19
In 2019, Yukon's real GDP growth dropped to 0.8% from 3.8% in 2018. The national average was (+1.9%).
Yukon: EBSM key facts
For accessibility reasons, the table has been simplified. Consult the PDF version for the full table.
| Insured clients | Non-insured clients |
|---|---|
| 207 |
24 |
| Intervention type | FY1920 | Year-over-year change |
|---|---|---|
| Employment Benefits | 183 | 7.10% |
| Support Measures: EAS | 79 | 61.80% |
| FY1920 | Year-over-year change (pp) | |
|---|---|---|
| Employment Benefits | 69.80% | 21 |
| Support Measures: EAS | 30.20% | 21 |
| Total expenditures | FY1920 ($ million) | Year-over-year change |
|---|---|---|
| Employment Benefits | $1.80 | 20.40% |
| Support Measures: EAS | $1.70 | 11.10% |
| LMP and R&I | $0.08 | 57.50% |
| Total expenditures | $3.60 | 16.40% |
| FY1819 | FY1920 | Year-over-year change |
|---|---|---|
| $1.07 | $1.12 | 4.50% |
Yukon's overall employment level improved in FY1920 (+500; +2.1%) compared to FY1819, mainly due to an increase in part-time positions (+400; +10.9%). Meanwhile, employment in full-time positions remained relatively stable (+100; +0.4%). Yukon's unemployment rate edged up to 3.5%, compared to 3.4% in the previous year.
Yukon priorities for FY1920 included:
- establishing improved, government-to-government consultation processes with Yukon's First Nation governments
- providing relevant, quality and timely labour market information for users
- facilitating Yukon employers' ability to recruit suitable employees
- enhancing Yukon employers' ability to retain skilled employees
- ensuring training opportunities are available for all Yukon people
- facilitating and improving learning and employment transitions, and
- increasing participation in the labour market for current under-represented groups in Yukon: Yukon First Nations' peoples, youth, older workers, persons with disabilities, women in trades and technology, as well as newcomers to Canada
3.2.13.1 Managing for results
Yukon is working with the Government of Canada to simplify and automate reporting where possible, while improving reporting turn-around times. The Territory is also implementing a new system, by which it will be able to share LMDA data with the Government of Canada on a monthly basis. In addition, Yukon is working with ESDC to implement the Targeting, Referral and Feedback (TRF) system.
3.2.13.2 Clients, interventions and expenditures
The total number of clients served in Yukon decreased to 231 (-31.7%) in FY1920. All 4 client types experienced drops: active claimants (-34; -18.0%), former claimants (-12; -34.3%), PPE clients (-10; -25.6%) and non-insured clients (-51; -68.0%). In terms of the shares relative to the total number of clients, active claimants were the largest client group, representing 67.1% of all clients served in Yukon, up by 11.2 percentage points from the previous year. Compared to FY1819, the share of PPE clients (12.6%) increased by 1.0 percentage points, while non-insured clients' share (10.4%) decreased by 11.8 percentage points and former claimants share (10.0%) remained stable (-0.4 percentage points).
Compared to FY1819, Yukon delivered fewer EBSM-similar interventions in FY1920 (262), a 35.1% year‑over‑year decline. The share of Employment Benefits relative to all interventions increased, from 48.8% to 69.8% (+21.0 percentage points year‑over‑year), while that of EAS interventions dropped, from 51.2% to 30.2%. In total, unpaid EI benefits jumped by 4.5% to $1.12 million, and 123 individuals (+2.5%) returned to employment after participating in EBSM-similar programming.
Total expenditures for EBSMs rose from $3.1 million in FY1819 to $3.6 million in FY1920, a 16.4% year-over-year increase. This amount included the $227,000 envelope the Territory received in FY1920 as part of the $250.0 million in additional LMDA funding announced in Budget 2017.
On top of these expenditures, $250,000 was made available to Yukon under the additional targeted funding measures to support workers in seasonal industries, which the Territory did not access.
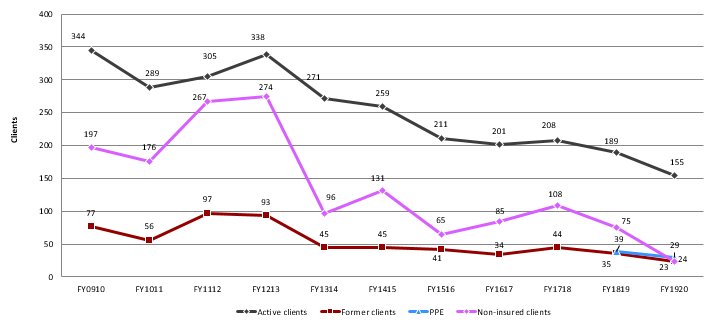
Text description of chart 37
| FY0910 | FY1011 | FY1112 | FY1213 | FY1314 | FY1415 | FY1516 | FY1617 | FY1718 | FY1819 | FY1920 | |
|---|---|---|---|---|---|---|---|---|---|---|---|
| Active clients | 344 | 289 | 305 | 338 | 271 | 259 | 211 | 201 | 208 | 189 | 155 |
| Former clients | 77 | 56 | 97 | 93 | 45 | 45 | 41 | 34 | 44 | 35 | 23 |
| PPE | 39 | 29 | |||||||||
| Non-insured clients | 197 | 176 | 267 | 274 | 96 | 131 | 65 | 85 | 108 | 75 | 24 |
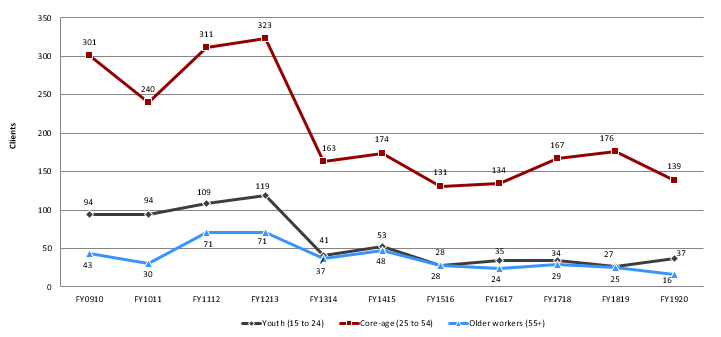
Text description of chart 38
| FY0910 | FY1011 | FY1112 | FY1213 | FY1314 | FY1415 | FY1516 | FY1617 | FY1718 | FY1819 | FY1920 | |
|---|---|---|---|---|---|---|---|---|---|---|---|
| Youth (15 to 24) | 94 | 94 | 109 | 119 | 41 | 53 | 28 | 35 | 34 | 27 | 37 |
| Core-age (25 to 54) | 301 | 240 | 311 | 323 | 163 | 174 | 131 | 134 | 167 | 176 | 139 |
| Older workers (55+) | 43 | 30 | 71 | 71 | 37 | 48 | 28 | 24 | 29 | 25 | 16 |
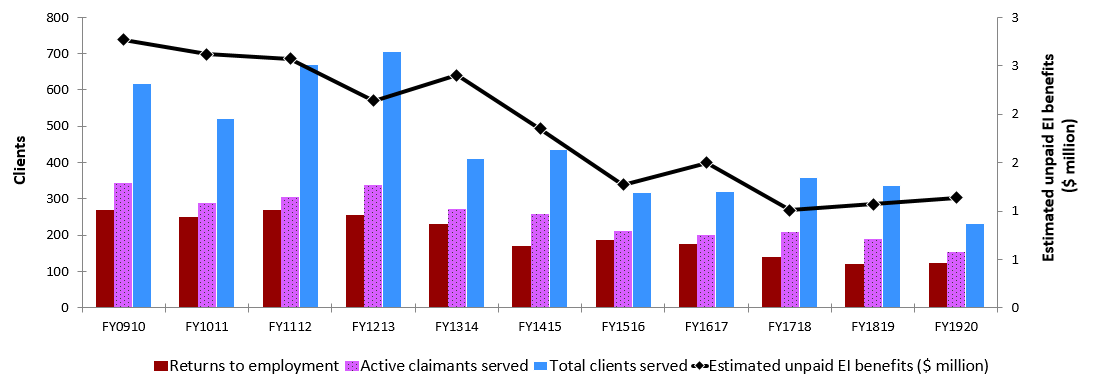
Text description of chart 39
| FY0910 | FY1011 | FY1112 | FY1213 | FY1314 | FY1415 | FY1516 | FY1617 | FY1718 | FY1819 | FY1920 | |
|---|---|---|---|---|---|---|---|---|---|---|---|
| Youth (15 to 24) | 94 | 94 | 109 | 119 | 41 | 53 | 28 | 35 | 34 | 27 | 37 |
| Core-age (25 to 54) | 301 | 240 | 311 | 323 | 163 | 174 | 131 | 134 | 167 | 176 | 139 |
| Older workers (55+) | 43 | 30 | 71 | 71 | 37 | 48 | 28 | 24 | 29 | 25 | 16 |
Table 18 – Yukon: EBSM-similar programming, FY1920
For accessibility reasons, the table has been simplified. Consult the PDF version for the full table.
| Employment Benefits | Program name | Interventions | Year-over-year change | Expenditures ($ 000s) |
|---|---|---|---|---|
| SD-R | Skills Development Employment Benefit | 29 | 0.00% | 1,784 |
| SD-A | Skills Development Employment Benefit - Apprenticeship | 152 | -7.30% | |
| TWS | Targeted Wage Subsidies | 2 | -50.00% | 32 |
| SE | Self‑Employment | 0 | n/a | 0 |
| JCP | Employment Programs | 0 | N/A | 0 |
| Support Measures | Program name | Interventions | Year-over-year change | Expenditures ($ 000s) |
|---|---|---|---|---|
| EAS | Employment Assistance Services | 79 | -61.80% | 1,715 |
| LMP | Labour Market Partnerships Employer; Sponsored Training | n/a | n/a | 12 |
| R&I | Research and Innovation | n/a | n/a | 69 |
3.2.13.3 Employment benefits
In FY1920, the number of Employment Benefit interventions in Yukon dropped by 7.1% to 183. This drop is mainly attributable to the decline in SD-A (-12; -7.3%), which represented 83.1% of all Employment Benefits in Yukon. The Territory spent $1.8 million (+20.4%) on Employment Benefits.
3.2.13.4 Support measures: EAS
Compared to the previous fiscal year, Yukon delivered fewer EAS interventions in FY1920, a large decline of 61.8%, for a total of 79. EAS expenditures increased by 11.1% to $1.7 million.
3.2.13.5 Other support measures: LMP and R&I
Yukon's total funding for other support measures advanced, from $51,000 in FY1819 to $80,000 in FY1920, a 57.5% year-over-year increase. From this amount, LMP and R & I represented $12,000 and $69,000, respectively.
Employer-Sponsored Training component of Labour Market Partnerships
Many activities are offered under the Employer-Sponsored Training component of LMPs. Due to a new flexible Working Up Program Suite, when employers approach the Territory with their unique labour market challenges and goals, Yukon can develop a funding solution for them. Some of the activities involve hiring and training new staff for hard to fill positions. Other activities involve training current staff for promotional opportunities within their employer's organization. Yukon has a number of employers who have developed annual essential skills development programs for their employees.
Results/lessons learned for any research and innovation projects that concluded in FY1920
The research and innovation projects that concluded in FY1920 were composed of 2 surveys conducted by Yukon Bureau of Statistics: The Yukon Employment and Skills Survey and the Yukon Business Survey. The results from these surveys allowed the Territory to determine areas where further services and supports were required. For example, it clearly identified the lack of resources and employment opportunities in remote communities, as well as various gaps between the experience and skills required by employers, as well as the experience and skills held by available applicants and/or current employees.
EBSMs-in-Action examples
Working Up / Staffing Up Program
Andrew was a new Canadian with English as a second language and was having difficulties obtaining regular employment due to a lack of certification and employers lack of confidence in his language skills. After taking an English class at the local college, we funded him under our Working Up Program to obtain a one-year Office Administration Certificate. He was extremely successful in school and quickly obtained a position as an Administrator for a local employer. Less than a year later, his employer had seen great potential in him and contacted us to apply for funding under our Staffing Up Program to train him as a Business Analyst. After he completed his training, he is now in permanent employment as a Business Analyst for this local employer.
Building Up Program
As a result of the flexibility and diversity in our Building Up Program and our commitment to Truth and Reconciliation and developing labour market programming with First Nations, Kwanlin Dün First Nation; House of Learning has delivered employment programming through traditional ways of knowing and doing. Whether on the land or through traditional knowledge circles, we have noted that participation in this programming has resulting in progression toward citizen's employment goals.
3.2.14 Nunavut
Nunavut's real GDP increased by 6.5% in 2019, following a growth rate of 5.2% in 2018.
Nunavut: EBSM Key Facts
For accessibility reasons, the table has been simplified. Consult the PDF version for the full table.
| Insured clients | Non-insured clients |
|---|---|
| 322 |
305 |
| Intervention type | FY1920 | Year-over-year change |
|---|---|---|
| Employment Benefits | 339 | 2.70% |
| Support Measures: EAS | 482 | 64.80% |
| Intervention type | FY1920 | Year-over-year change (pp) |
|---|---|---|
| Employment Benefits | 41.30% | 21.9 |
| Support Measures: EAS | 58.70% | 21.9 |
| Total expenditures | FY1920 ($ million) | Year-over-year change |
|---|---|---|
| Employment Benefits | $2.20 | 15.00% |
| Support Measures: EAS | $0.00 | 100% |
| LMP and R&I | $0.80 | 367% |
| Total expenditures* | $3.00 | 34% |
| FY1819 | FY1920 | Year-over-year change |
|---|---|---|
| $0.64 | $0.63 | -2.20% |
*Expenditures are estimates provided by Nunavut at time of writing. Totals may not add up due to rounding; does not include accounting adjustments.
Nunavut's overall employment level increased by 100 (+0.8%) in FY1920 to a total of 13,100. Full-time employment grew by 400 (+3.3%), while part-time employment declined by 300 (-17.4%). The number of unemployed workers edged down from 2,200 in FY1819, to 2,100 in FY1920. In this context, the Territory's unemployment rate dropped from 14.6% to 13.7%, year-over-year.
Translating the Territory's fast economic growth into job opportunities represented Nunavut's main labour market challenge. This applied particularly to the Inuit population, which was employed in a much lower proportion than the non-Inuit population. The territory's labour market priorities in FY1920 were:
- preparing the labour force to meet the needs of a growing and transitioning economy
- developing programs to improve the participation of youth and persons with disabilities in the labour market
- encouraging greater employer involvement in training, to ensure that skills are aligned with current and future job opportunities
- helping Nunavummiut to develop the essential skills to succeed in finding and keeping employment;
- connecting Nunavummiut job seekers with job opportunities through accurate, timely and comprehensive labour market information, and
- engaging with community leaders, community organizations, municipalities, Inuit organizations and other levels of government, to leverage partnership opportunities
3.2.14.1 Managing for results
To increase client participation in its EBSM-similar programming, Nunavut improves client service by monitoring and adjusting its service delivery model on a regular basis. To ensure all clients receive the best results from EAS, the Territory is developing an ongoing professional development program for its front-line staff. As well, the case management system is being evaluated, in order to identify measures that better meet client needs. These improvements are driving the creation of new information sources as well as tools to inform practice and policy.
3.2.14.2 Clients, interventions and expenditures
Nunavut served a smaller number of clients, totaling 627 (-49.7%) in FY1920. All client groups dropped by varying degrees: active claimants (-47.9%), former claimants (-36.2%), PPE clients (-42.3%) and non-insured clients (-56.1%).
In FY1920, Nunavut delivered 821 interventions (-51.7%), with Employment Benefits increasing slowly (+2.7%) and EAS interventions dropping (-64.8%). Returns to employment in the Territory dropped by 12.5% to 42, while unpaid EI benefits totaled $0.63 million (-2.2% year-over-year).
Total expenditures towards EBSM-similar programming grew by $0.7 million to 3.0 million (+34%). These included $303K that the Territory received in FY1920 as part of the $250.0 million additional LMDA funding from Budget 2017.
On top of these expenditures, $250,000 were also made available to Yukon under the additional targeted funding measures to support workers in seasonal industries, which the Territory did not access.
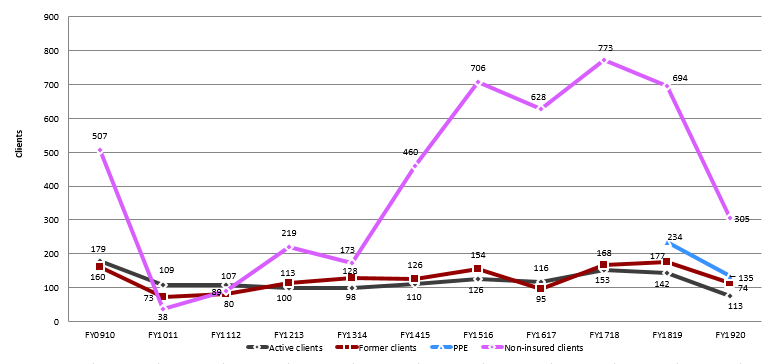
Text description of chart 40
| FY0910 | FY1011 | FY1112 | FY1213 | FY1314 | FY1415 | FY1516 | FY1617 | FY1718 | FY1819 | FY1920 | |
|---|---|---|---|---|---|---|---|---|---|---|---|
| Active clients | 179 | 109 | 107 | 100 | 98 | 110 | 126 | 116 | 153 | 142 | 74 |
| Former clients | 160 | 73 | 80 | 113 | 128 | 126 | 154 | 95 | 168 | 177 | 113 |
| PPE | 234 | 135 | |||||||||
| Non-insured clients | 507 | 38 | 89 | 219 | 173 | 460 | 706 | 628 | 773 | 694 | 305 |
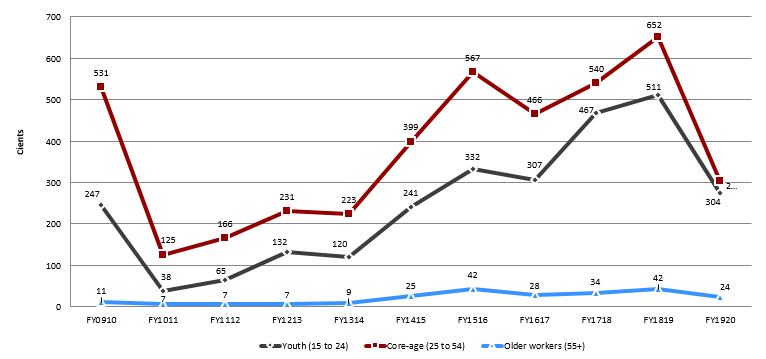
Text description of chart 41
| FY0910 | FY1011 | FY1112 | FY1213 | FY1314 | FY1415 | FY1516 | FY1617 | FY1718 | FY1819 | FY1920 | |
|---|---|---|---|---|---|---|---|---|---|---|---|
| Youth (15 to 24) | 247 | 38 | 65 | 132 | 120 | 241 | 332 | 307 | 467 | 511 | 276 |
| Core-age (25 to 54) | 531 | 125 | 166 | 231 | 223 | 399 | 567 | 466 | 540 | 652 | 304 |
| Older workers (55+) | 11 | 7 | 7 | 7 | 9 | 25 | 42 | 28 | 34 | 42 | 24 |
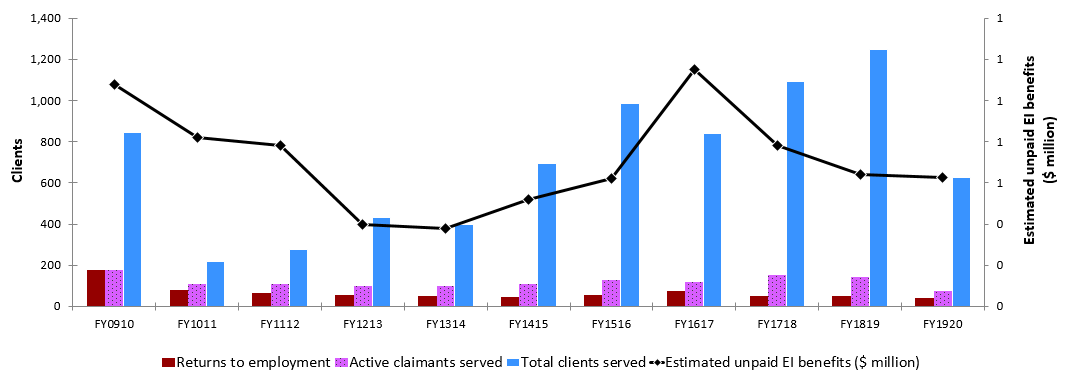
Text description of chart 42
| FY0910 | FY1011 | FY1112 | FY1213 | FY1314 | FY1415 | FY1516 | FY1617 | FY1718 | FY1819 | FY1920 | |
|---|---|---|---|---|---|---|---|---|---|---|---|
| Returns to employment | 175 | 80 | 65 | 53 | 50 | 47 | 53 | 75 | 52 | 48 | 42 |
| Active claimants served | 179 | 109 | 107 | 100 | 98 | 110 | 126 | 116 | 153 | 142 | 74 |
| Total clients served | 846 | 220 | 276 | 432 | 399 | 696 | 986 | 839 | 1,094 | 1,247 | 627 |
| Estimated unpaid EI benefits ($ million) | $1.08 | $0.82 | $0.78 | $0.40 | $0.38 | $0.52 | $0.62 | $1.15 | $0.78 | $0.64 | $0.63 |
Table 19 – Nunavut: EBSM-similar programming, FY1920
For accessibility reasons, the table has been simplified. Consult the PDF version for the full table.
| Employment Benefits | Program name | Interventions | Year-over-year change | Expenditures ($ 000s) |
|---|---|---|---|---|
| SD-R | Adult Learning and Training Supports | 186 | -34.50% | 1,651 |
| SD-A | Adult Learning and Training Supports: Apprenticeship | 108 | 163.40% | |
| TWS | Training on the Job | 45 | n/a | 555 |
| SE | Nunavut Entrepreneurship Incentive | 0 | -100.00% | 0 |
| Support Measures | Program name | Interventions | Year-over-year change | Expenditures ($ 000s) |
|---|---|---|---|---|
| EAS | Employment Assistance Services | 482 | -64.80% | 0 |
| LMP | Target Training Initiatives | n/a | n/a | 806 |
| R&I | Research and Innovation | n/a | n/a | n/a |
3.2.14.3 Employment benefits
In FY1920, Nunavut delivered 339 Employment Benefit interventions (+2.7%), with SD-A (108; +163.4%) increasing and SD-R (186; -34.5%) dropping. While in FY1819 no TWS interventions were delivered, 45 were issued in FY1920. SE were not delivered in FY1920. The Territory spent $2.2 million (+15%) on Employment Benefits.
3.2.14.4 Support measures: EAS
Under EAS, Nunavut delivered Employment Services, with these interventions dropping by 64.8% year-over-year; going from 1,371 in FY1819 to 482 in the most recent reporting period. The Territory did not report any EAS expenditures.
3.2.14.5 Other support measures: LMP and R&I
LMP total expenditures grew from $176,000 in FY1819 to $806,000 in FY1920, representing a year-over-year increase of $634,000. No R&I expenditures were recorded in FY1920.
3.3 Evaluation of Employment Benefits and Support Measures (EBSMs) and economic security analysis
In this section:
- 3.3.1 Design and Delivery of the Self-Employment Program
- 3.3.2 Analysis of Employment Benefits and Support Measures (EBSMs) Profile and Medium-Term Incremental Impacts from 2010 to 2017
- 3.3.3 Participation in LMDAs and economic security, by designated groups
This section contains 2 components. The first part presents findings from the ongoing third cycle of LMDA evaluations (2018 to 2023). Employment and Social Development Canada (ESDC) worked jointly with twelve provinces and territories (P/Ts) to undertake the 2012-2017 second cycle for the Labour Market Development Agreement (LMDA) evaluations. Under the second cycle, the evaluation work consisted of conducting 2 to 3 studies per year on the Employment Benefits and Support Measures (EBSMs) similar programming delivered under these agreements. The studies aimed to generate evaluation evidence on the effectiveness, efficiency and design/delivery of programs and services for Canada overall and for the twelve P/Ts that opted for a joint evaluation process with the Government of Canada. Quebec is responsible for its own evaluation but data from Quebec were included in the national level analyses.
The Third LMDA Evaluation Cycle builds on the success of the second cycle, with the aim of filling in knowledge gaps about the effectiveness, efficiency and design/delivery of EBSMs. This evaluation cycle will have 100% coverage of LMDA spending. Many conclusions and recommendations from Cycle III will be based on incremental impacts of LMDAs. The third cycle of evaluation covers LMDA participants prior to Covid-19.
The first part of this section summarizes key findings of the National Study of the Design and Delivery of the Self-Employment Program. The first part also presents an analysis of EBSMs' profile and medium-term Incremental Impacts from 2010 to 2017. These studies were carried out prior to COVID-19. Future evaluations will seek to address the pandemic's impact on LMDA participants' outcomes. The incremental impacts methodology compares LMDA participants' results to the results of a comparison group with similar observable characteristics to learn about what would have happened in the absence of the program.
The second part of this section, which is not a component of the Third LMDA Evaluation Cycle, expands on previous LMDA outcomes and impacts on economic security analyses started in the FY1617 MAR. This second part uses general outcomes, through the lens of the designated groups, as input for an analysis that gauges how the program affects groups who may be more vulnerable to the economic cycle or more likely to experience labour market barriers. This year's analysis will focus on outcomes for women, visible minorities, as well as for the Indigenous people of Canada. General outcomes, the input for this analysis, compare the situation of participants before, during and after LMDA interventions.
At the Forum of Labour Market Ministers (FLMM) table, the federal government and provinces/territories highlighted the importance of inclusive and outcome-focused labour market transfer agreements. To support this, ESDC is committed to measuring results of LMDA participants for the 4 designated groups under the Employment Equity Act: women, Indigenous peoples, persons with disabilities and members of visible minorities.
3.3.1 Design and Delivery of the Self-Employment Program
The self-employment program aims to assist participants in creating employment for themselves by providing them with a range of services including:
- assistance with business plan development
- counselling, coaching and mentoring
- entrepreneurial training and workshops
Provinces and territories have the flexibility to design and deliver the program to meet their labour market needs. Currently, the program is delivered through third-party organizations in 7 jurisdictions. In 1 jurisdiction, the program is delivered by government staff and, in another one, the program is delivered by government staff and third-party organizations.
Program officials reported that the amount allocated by the jurisdiction to the self-employment program is influenced by regional allocations, demand for the program and local labour market conditions. Three P/Ts have decided not to deliver the program because other entrepreneurial programs are offered, high costs relative to the demonstrated results, low demand and labour market conditions.
The application process is structured and aimed to ensure that participants are suited for self-employment, have a viable business idea and the financial resources to launch a business.
Objectives of the study
- Develop an understanding of the design, delivery and success of the self-employment program
- Define the outcomes of success that can be attributed to program participation
- Fill in knowledge gaps about factors influencing the success or failure of self-employment businesses
- Determine lessons learned, best practices and key challenges related to program design and delivery
Evaluation methodology
This study used a mix of qualitative and quantitative methods to address the evaluation questions:
- document review
- Canadian self-employment literature and statistics
- key informant interviews with program managers, and front-line third-party service providers and case workers
- statistical analysis of administrative data
- survey of self-employment participants across 9 provinces and territories
Participants' employment outcomes
Self-employment participants increased their employment level by 15 percentage points from 59% in the year before participating to 74% at the time of survey (that is 2 to 4 years after program participation).
Type of businesses created, survival rates and success factors
Nearly 50% of survey respondents launched a self-employment business and it was still in operation in winter 2020 (2 to 4 years following program participation). Among the 1,365 respondents who started a business, 68% of them were still operating their business at 2 to 4 years post-program. Another 4% had sold their business, but it was still operational. Twenty-four percent (24%) of respondents were unable to maintain the operation of the business they had started as part of the program.
The business survival rate is consistent with a 2018 Statistics Canada studyFootnote 20 that found that less than half of unincorporated self-employed individuals continued operations for more than 2 years.
Half of self-employment businesses were launched in other servicesFootnote 21; professional, scientific and technical services; as well as in construction and retail trade.
Regarding factors influencing the success or failure of self-employment businesses, participants:
- who started a business under the self-employment program and were still in operation at the time of survey attributed their business success to: their dedication, hard work and positive attitude; the high demand for their services or products; the quality of service provided; their own abilities, experience, knowledge and skills; their network; and, business contacts
- who started a business but were forced to close it attributed the closure to: poor sales and low revenues; small market; workload; and, finding another job
- who did not launch a business during program participation attributed this to: lack of funding; the level of uncertainty and risk involved; workload, worklife balance; and, underestimating the required commitment
Key considerations for program and policy development
- The self-employment program can benefit from an updated objective specifying that it is dedicated to eligible participants who have a viable business idea, the financial and/or in-kind resources to launch a business, and the required level of dedication.
- The data collection for self-employed participants should include only participants who have been deemed suitable for self-employment and accepted into the program.
- Indicator of program success can include: Increase in employment and/or self-employment levels; medium-term increase in earnings; business survival rate similar to the local economy and/or the sector; and acquisition of transferable skills.
- Provinces and territories may wish to consult with their service delivery network on the extent to which identified challenges are applicable to their unique context, and how best to address them along with integrating lessons learned that can benefit program delivery.
Earning outcomes and reliance on income support
Survey respondents were not comfortable answering questions that related to their earnings. This situation made it difficult to compare the pre- and post-earnings of self-employment participants. Overall, there appears to be an increase in the number of participants reporting less than $10,000 in earnings annually. However, survey respondents who were able to maintain the operation of their business, were more likely than respondents, whose business had closed, to report earning more or the same as before participating in the program.
As a complement to the earnings questions, survey respondents were asked to provide an assessment of their financial well-being. When taking their entire financial situation into consideration, 73% of respondents said that they were financially about the same or better off after the program when compared to before they started the self-employment program. As well, 70% of respondents said that their household net worth was about the same or higher when compared to before they started the self-employment program.
In line with survey findings, 14 P/T program managers stated that immediate increases in earnings are not necessarily an expected outcome of the program.
Regarding the reliance on government income support, participants reduced reliance on the use of EI and social assistance following program participation.
Satisfaction with services received and current employment
A high percentage of respondents who started a self-employment business reported that they were equally or more satisfied with their job situation compared to their pre-program participation. Those who were able to maintain the operation of their business were 29 percentage points more likely to report being more satisfied, compared to those whose business had closed (76% compared to 47%).
Regarding the contribution of the program to the success of self-employment businesses, at least 81% of survey respondents who launched a self-employment business rated the following services and training as very or somewhat important to the business launch, operation and success:
- assistance with business plan development
- one-on-one mentoring / advice or counselling supports
- discussion on risks and challenges of self-employment
- assessment of entrepreneurial readiness
- living allowance during participation and financial assistance with business start-up costs
- information about and assistance to access capital
- training on budgeting, financial management, marketing, business operation and sales
Complementarity between the self-employment program and other similar programs
Key informants in 8 provinces and territories confirmed that other programs are available to help new entrepreneurs; however, they believed that the self-employment program does not duplicate these programs. Examples included:
- financial support is the distinguishing feature of the self-employment program
- other programs are not as comprehensive in terms of training and supports compared to the self-employment program
- some programs are dedicated to specific demographics such as women, youth, Indigenous peoples and immigrants. By comparison, all demographic groups can participate in the self-employment program
Challenges and lessons learned related to program design and delivery
Key informants identified challenges related to program design and delivery. These included:
- the lack of clear communication between service providers and the provincial or territorial department and/or Service Canada regarding the confirmation of eligibility for EI
- the restrictive contract provisions for service providers
- the complex assessment process of candidates
- the difficulty to serve remote and rural areas
Best practices related to program design and delivery included:
- using local and specialized organizations to deliver the program
- using standardized tools for business plan development
- relying on local expertise to assess business viability
- providing ongoing mentorship, advice and counselling
- using specialists to deliver tailored training
- providing participants with opportunity to network and facilitating their knowledge of and access to funding
The report for The National Study of the Design and Delivery of the Self-Employment Program is available upon request.
3.3.2 Analysis of Employment Benefits and Support Measures (EBSMs) Profile and Medium-Term Incremental Impacts from 2010 to 2017
This study presents the medium-term (that is, up to 5 years after participation) incremental impacts for active and former EI claimants who began participating in Employment Benefits and Support Measures (EBSMs) delivered under Labour Market Development Agreements (LMDAs) across Canada between April 1, 2010 and December 31, 2012. Incremental impacts were estimated between the years 2010 and 2017.
The study covered the entire population of EI claimants who began participating in Skills Development (SD), Job Creation Partnerships (JCP), Targeted Wage Subsidies (TWS), and Employment Assistance Services (EAS) during the 2010 to 2012 reference period. These programs and services aim to assist the unemployed to obtain employment and reduce EI use.
Incremental impacts were examined for active and former EI claimants:
- for active EI claimantsFootnote 22, the incremental impacts from participating in EBSMs were measured relative to non-participants or, in other words, a comparison group of active claimants who had no EBSM participation during the 2010-2012 reference period
- for former EI claimantsFootnote 23, the impacts from participating in Employment Benefits (that is, SD, TWS and JCP) were measured relative to participants who received minimal employment services only (that is, EAS only)
Considering that 2 different counterfactuals were used to estimate the incremental impacts for active and former EI claimants, their results are not directly comparable.
The unit of analysis used in examining the incremental impacts was the Action Plan Equivalent (APE), which regroups all EBSM interventions taken by a participant within an interval of 6 months of each other (that is, gap of 6 months or less between the end of 1 intervention and the beginning of the following one).
Incremental impacts were estimated based on propensity score matching. The main estimator used was Kernel Matching combined with Difference-in-Differences. The Nearest Neighbour, Inverse Probability Weighting and Cross-sectional matching methods were used to assess the sensitivity of the estimates to the choice of matching method. This triangulation exercise confirmed that the net impacts were not sensitive to the estimation method. As well, greedy matching and machine-learning methods were used to improve the selection of comparison group members.
Incremental impacts were measured for the following 7 indicators:
- employment earnings
- incidence of employment
- amount of EI benefits collected
- number of weeks in receipt of EI benefits
- incidence of Social Assistance (SA) use
- amount of SA benefits collected
- level of dependence on income support (that is, ratio of EI benefits plus SA benefits collected divided by EI plus SA benefits collected plus employment/self-employment earnings)
Incremental Impact Findings
Key findings
Consistent with previous incremental impact studies, incremental impacts for the 2010 to 2012 cohort demonstrate that active and former EI claimants who participated in SD, TWS and JCP (active participants only) improved their labour market attachment (employment and earnings) and reduced their dependence on government income support (EI and SA use) compared to similar non-participants.
- Former claimants who participated in JCP experienced an increase in their incidence of employment but a decrease in their employment earnings. Similar negative impacts on earnings were observed for the 2007-2008 cohort and the program was not cost-effective for the 2002-2005 cohort. These participants represent 1% of all participants and account for less than 1% of program expenditures
Active EI claimants who participated in EAS services alone had small positive impacts on earnings and on incidence of employment (non-statistically significant). However:
- EAS improved the labour market attachment for female, Indigenous and recent immigrant participantsFootnote 24, and decreased their dependence on income support compared to similar non-participants
Overall, SD and TWS improved the labour market attachment and reduced the dependence on income support for most sub-groups of participants. With some exceptions, TWS had the most consistent positive impacts across all sub-groups.
Detailed Findings for Active and Former EI Claimants by Type of Intervention
Incidence of employment
Chart 43 presents the incremental impacts on the incidence of employment for active and former EI claimants by type of program. The estimates can be interpreted as a change in the probability of being employed following participation. Active EI claimants who participated in SD, TWS and JCP increased their incidence of employment relative to similar non- participants. Former EI claimants who participated in SD, TWS and JCP increased their incidence of employment relative to similar participants who received only EAS services.Footnote 25
Active EI claimants who received EAS services experienced a small positive, but not statistically significant, impact on the incidence of employment. EAS services are relatively modest activities such as counselling, job search assistance and case management. By themselves, these services are not expected to increase the skills of participants or influence their employment level to a large extent, and are often provided in conjunction with longer interventions such as SD.
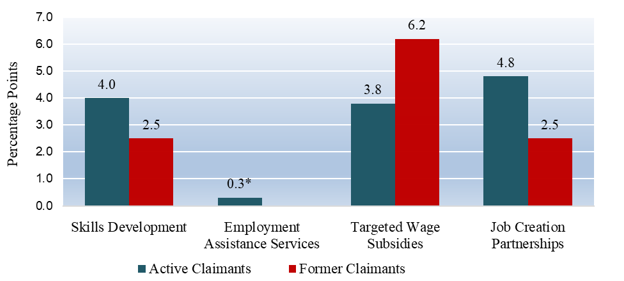
Text description of chart 43
| Skills Development | Employment Assistance Services | Targeted Wage Subsidies | Job Creation Partnerships | |
|---|---|---|---|---|
| Active Claimants | 4 | 0.3 | 3.8 | 4.8 |
| Former Claimants | 2.5 | 6.2 | 2.5 |
To complement the incremental impact analysis, the labour market outcomesFootnote 26 for all EAS participants in the 2010-2012 period were observed. Table 19 shows that these participants maintained an employment level of 86% and 85%, respectively, in the first 2 years that followed their participation.
| Percentage of EAS participants | EAS start year | 1 year post | 2 years post |
|---|---|---|---|
| Percentage employed | 94% | 86% | 85% |
| Percentage on EI | 98% | 30% | 29% |
| Percentage on SA | 8% | 10% | 9% |
| Percentage on Canada Pension Plan | 6% | 8% | 10% |
| Percentage on Canada Pension Plan – Disability | 0% | 1% | 1% |
| Percentage on Old Age Security | 2% | 2% | 3% |
- N= 272,813. Participants can collect multiple source of benefits while employed or unemployed.
Employment earnings
Chart 44 presents the average annual increase in employment earnings for active and former claimants over the 4 years post-participation:Footnote 27
- active EI claimants who participated in SD, TWS and JCP increased their employment earnings relative to similar non-participants
- active EI claimants who participated in only EAS services increased their employment earning relative to similar non-participants, however, as noted above, these services are relatively modest activities and, by themselves, are not expected to lead to greatly influence labour market outcomes. In addition, these services do not aim to upgrade participants' level of education and/or skills and are therefore not necessarily expected to assist them in securing higher paying jobs. Securing higher paying jobs is more dependent on participants' prior levels of education and skills
- former EI claimants who participated in SD and TWS increased their employment earnings relative to similar participants who received only EAS services. Former EI claimants who participated in JCP experienced decreases in their employment earnings relative to similar participants who received only EAS services
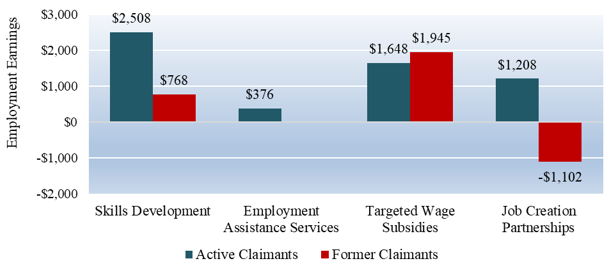
Text description of chart 44
| Skills Development | Employment Assistance Services | Targeted Wage Subsidies | Job Creation Partnerships | |
|---|---|---|---|---|
| Active Claimants | $2,508 | $376 | $1,648 | $1,208 |
| Former Claimants | $768 | $1,945 | -$1,102 |
Use of EI benefits
As shown in Chart 45, active EI claimants who participated in EBSMs reduced the use of EI benefits in the post-program period compared to similar non-participants. Former EI claimants who participated in SD, TWS and JCP increased their use of EI benefits in the post-program period relative to similar participants who received EAS services only.
- In the case of SD and TWS, the increase in the use of EI by former claimant participants is consistent with previous evaluations and is not necessarily a negative impact. Following their participation in these interventions, former EI claimants are more likely to be eligible for EI benefits due to their stronger labour market attachment demonstrated by increases in employment and earnings
- The increase in the use of EI for former claimants who participated in JCP is a negative impact given the decrease in employment earnings. This intervention will not pass the cost-benefit test
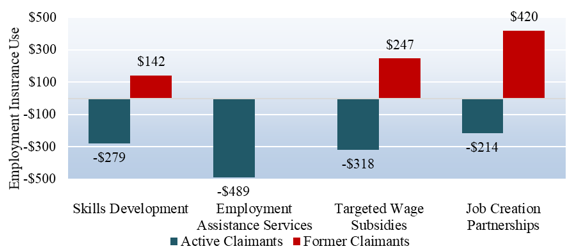
Text description of chart 45
| Skills Development | Employment Assistance Services | Targeted Wage Subsidies | Job Creation Partnerships | |
|---|---|---|---|---|
| Active Claimants | -$279 | -$489 | -$318 | -$214 |
| Former Claimants | $142 | $247 | $420 |
Use of SA benefits
As shown in Chart 46, most active and former EI claimant participants decreased the use of their SA benefits in the post-program period:
- active EI claimants who participated in SD and TWS decreased the use of SA benefits in the post-program period compared to similar non-participants. The estimate for active claimants who participated in JCP was not statistically significant
- active EI claimants who participated in EAS services only had a small increase in the use of SA benefits compared to similar non-participants
- former EI claimants who participated in SD, TWS and JCP decreased their use of SA benefits compared to similar participants who received only EAS services
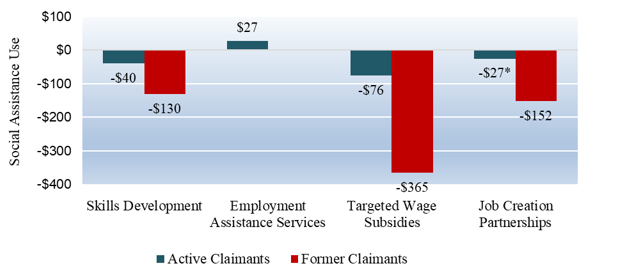
Text description of chart 46
| Skills Development | Employment Assistance Services | Targeted Wage Subsidies | Job Creation Partnerships | |
|---|---|---|---|---|
| Active Claimants | -$40 | $27 | -$76 | -$27 |
| Former Claimants | -$130 | -$365 | -$152 |
- *The incremental impact is not statistically significant.
Dependence on Income Support
As shown in Chart 47, active and former EI claimants who participated in EBSMs reduced their overall level of dependence on income support (combined EI and SA benefits).
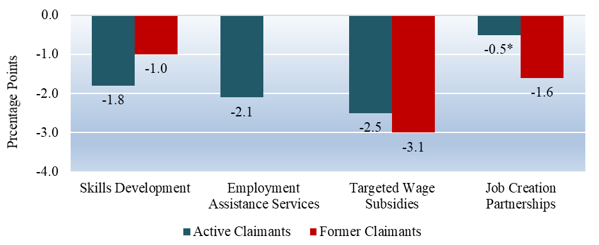
Text description of chart 47
| Skills Development | Employment Assistance Services | Targeted Wage Subsidies | Job Creation Partnerships | |
|---|---|---|---|---|
| Active Claimants | -1.8 | -2.1 | -2.5 | -0.5 |
| Former Claimants | -1.0 | -3.1 | -1.6 |
- *The incremental impact is not statistically significant.
The report for the Analysis of Employment Benefits and Support Measures (EBSM) Profile and Medium-Term Incremental Impacts from 2010 to 2017 is available upon request.
3.3.3 Participation in LMDAs and economic security, by designated groups
Overview of LMDAs and the effect on economic security using poverty measures and national median wages as proxies
The Labour Market Development Agreements (LMDAs) fund effective programs that help unemployed and employed workers return to work, and also aim to increase their income, and provide skills, training and employment networks to help weather economic changes. However, LMDAs are not one-size fits all labour market programs. This year's economic security section reports on the employment experiences of women, visible minorities and Indigenous peoples, after participating in Employment Benefit and Support Measures (EBSMs).
General outcomes are examined through the lens of the designated groups, to see how the programs affect groups who are more vulnerable to the business cycle and barriers in the labour market. The labour market barriers faced by these groups are complex and multi-layered. This will require further analysis to understand the social and policy implications. While outcomes-based analysis does not allow measured impacts to be unequivocally attributed to LMDAs, the trends observed in this analysis likely demonstrate the effects of labour market programming on poverty and economic security.
Methodology
General outcomes for active claimants who participated in programs funded through Labour Market Development Agreements (LMDAs) between January 1, 2012 to March 31, 2013 show that EBSMs, overall, are valuable investments in skills and employment and address some dimensions of poverty. To assess how LMDAs improve economic security, employment outcomes were examined against national median wages and low-income measures (LIM). This year's analysis focusses on the effects of LMDA-funded programs on women, visible minorities and Indigenous peoples. It reports the results of program participation in Employment Benefits and Support Measures (EBSMs) for women and men, visible minorities, and for Indigenous peoples.
This analysis only consists of active EI claimants. This allows for the use of larger sample sizes. Cohorts of former EI claimants were excluded. Income for this report comes from Line 236 - Net income, from T1 tax forms (2007 to 2017). The data used in this analysis represents national aggregates and limits annual income to $75,000 or less. Few individuals in EBSMs earn more than $75,000, and since this analysis uses mean income, it would inflate the average.
General outcomes analyses report on changes to participants' key variables after a set of EBSM interventions, relative these same variables before participation. Such analyses follows, for example, income flows over time for active claimants, to see how active labour market programming has altered them. The time period for this analysis is 10 years: 5 years before the set of interventions, the time it takes complete it (up to 5 quarters), and the 3 years after the interventions. Unlike Section 3.3.1 and 3.3.2, this section limits its focus to income changes for active claimants following LMDA programs. It does not do comparisons with groups of non-participants, nor does it report on former claimants.
Analysis of LMDA Impacts on economic security
General outcomes for women, visible minorities and Indigenous peoples were compared to thresholds derived from low‑income measures (LIM). National median wages from the Labour Force Survey (LFS) was indexed as a reference line, to measure the growth rate of income pre- and post- LMDA interventions. Median wages for males and females from the LFS were used for outcomes by sex. Median wages by total sex were used for general outcomes, and outcomes for First Nations and Indigenous peoples, and visible minorities.
The LIM is included as a proxy for economic security at a macro level. This is the most commonly used low‑income measure for international comparisons. It was used previously to approximate the economic security of active claimants who participated in LMDAs in the FY1617 EI Monitoring and Assessment Report. The LIM provides a national overview of economic securityFootnote 28 .
To control for inflation, all dollar amounts were converted to 2018 constant dollars. To match the program periods, indicators used for the 2012 to 2013 cohort were adjusted to 5 quarter moving averages (January 1, 2012 to March 31, 2013), where possible. This is the amount of time necessary to complete all LMDA programs, as some programs require more time than others. Indicators were then indexed to inflation in order to examine real growth rates. Otherwise, time periods were matched as closely as possible to those of the general outcomes.
The model for wage gap analysis for LMDAs follows the approach of gender-pay gap models used in New ZealandFootnote 29, AustraliaFootnote 30, and New BrunswickFootnote 31. The wage gap is the difference between national median wages and those of LMDA participants (expressed as "LMDA" in the equation below), expressed as a percentage of national earnings.
LMDA wage gap = [(median wage – LMDA)/median wage] * 100.
Caveats
- The program period for claimants who only received EAS interventions is shorter than for claimants who participated in other LMDA-funded programs
- Outcomes can be due to many factors. While there could be a correlation between program participation and outcomes, the methodology in this section does not allow outcomes to be unequivocally attributed to LMDAs
- The general outcomes in this section report on short-term changes to participants' incomes immediately following LMDA funded interventions:
- these results differ from the incremental impacts in section 3.3.1 and section 3.3.2, that report on broader, longer-term changes that can happen as a result of the outcome
Definitions
Low-income measures (LIM)
Developed by Statistics Canada, LIM is a comparison of individual income relative to society. As LIM does not depend on country-specific consumption, it is used for international comparisons. The OECD uses a version of a LIM methodology to report on international low income. It is a fixed percentage (50%) of median adjusted householdFootnote 32 income, accounting for household needs. LIM are calculated annuallyFootnote 33 on the Canadian Income Survey. Therefore, they do not require updating with an inflation index. As defined by Statistics Canada (2018), "the concept underlying the LIM is that all persons in a household have low income if their adjusted household income falls below half of the median adjusted income. The household income is adjusted by an equivalence scale to take economies of scale into account. This adjustment for different household sizes reflects the fact that a household's needs increase, but at a decreasing rate, as the number of members increases. The adjustment factor, also known as the equivalence scale, is the square root of the number of persons in the household."
Designated groups
Three out of 4 designated groups are represented in this year's analysis. Within the parameters of our methodology, not enough counts were generated to report on the general outcomes for persons with disabilities who participated in LMDA programming.
Indigenous peoples of Canada
Individuals who self-declared as First Nations, Métis or Inuit, and who participated in LMDA funded labour market programming are included in this report.
Members of visible minorities
Visible minorities in this report are self-declared active claimants who are non-white in colour or race, and not Indigenous peoples. Birthplace is disregarded.
Women
Women are under-represented in certain employment fields, and face barriers to the labour market that affect the effectiveness of labour market programming.
LMDAs, income, economic security and poverty
LMDAs help participants leave low-income and poverty by providing skills, training and supports to increase income and return to work. However, outcomes vary for members of equity groups.
Table 21: Profile of active claimants who started Employment Benefits and Support Measures between January 1, 2012 to March 31, 2013
For accessibility reasons, the table has been simplified. Consult the PDF version for the full table.
| Profile | SD-R | TWS | SE | JCP | EAS-only |
|---|---|---|---|---|---|
| Percentage of claimants by program | 19.5% | 4.6% | 2.7% | 0.7% | 72.5% |
- *Source: Labour Market Program Data Platform, Employment and Social Development Canada
| Sex | SD-R | TWS | SE | JCP | EAS-only |
|---|---|---|---|---|---|
| Male | 58.2% | 54.2% | 53.1% | 50.0% | 55.1% |
| Female | 41.8% | 45.8% | 46.9% | 50.0% | 44.9% |
- *Source: Labour Market Program Data Platform, Employment and Social Development Canada
| Age | SD-R | TWS | SE | JCP | EAS-only |
|---|---|---|---|---|---|
| 24 years and younger | 16.9% | 8.5% | 2.8% | 10.0% | 8.3% |
| 25 to 34 years | 32.8% | 25.1% | 28.7% | 28.0% | 25.3% |
| 35 to 44 years | 24.5% | 22.5% | 30.5% | 18.6% | 23.7% |
| 45 to 54 years | 21.0% | 29.1% | 26.1% | 23.5% | 26.5% |
| 55 years and older | 8.2% | 16.9% | 12.9% | 22.7% | 18.0% |
- *Source: Labour Market Program Data Platform, Employment and Social Development Canada
| Marital status | SD-R | TWS | SE | JCP | EAS-only |
|---|---|---|---|---|---|
| Married | 34.7% | 34.1% | 45.0% | 36.6% | 35.8% |
| Divorced | 9.1% | 12.0% | 10.3% | 10.3% | 11.0% |
| Single | 37.7% | 33.3% | 23.7% | 34.7% | 32.5% |
| Missing values | 18.5% | 20.6% | 20.9% | 18.4% | 20.6% |
- *Source: Labour Market Program Data Platform, Employment and Social Development Canada
| Designated groups | SD-R | TWS | SE | JCP | EAS-only |
|---|---|---|---|---|---|
| Indigenous peoples of Canada | 3.2% | 3.0% | 3.2% | 5.6% | 4.3% |
| People with disabilities | 0.2% | 0.4% | 0.3% | 0.5% | 0.3% |
| Visible minorities | 3.0% | 3.5% | 3.3% | 6.2% | 4.0% |
| Immigrants within the last 5 years | 2.6% | 1.9% | 2.0% | 2.7% | 2.4% |
- *Source: Labour Market Program Data Platform, Employment and Social Development Canada
| National Occupational Classification (NOC) skill level** | SD-R | TWS | SE | JCP | EAS-only |
|---|---|---|---|---|---|
| Skill Type 0: Managerial level | 4.5% | 7.1% | 13.3% | 5.1% | 6.1% |
| Skill level A: Professional jobs (requires university degree) | 3.4% | 6.3% | 14.9% | 6.5% | 6.4% |
| Skill level B: Technical jobs / skilled trades (requires college diploma or apprenticeship) | 29.0% | 27.1% | 38.7% | 23.9% | 28.3% |
| Skill level C: Intermediate jobs (requires high school and/or job specific training) | 37.2% | 37.1% | 26.0% | 30.3% | 37.9% |
| Skill level D: Labour jobs | 26.4% | 23.5% | 9.1% | 35.2% | 22.2% |
- *Source: Labour Market Program Data Platform, Employment and Social Development Canada
- ** Find your NOC - Canada.ca
| Key Labour Market Indicators In the Year Preceding the Start of Participation | SD-R | TWS | SE | JCP | EAS-only |
|---|---|---|---|---|---|
| Earnings (2018 constant dollars) | $27,407 | $25,595 | $32,719 | $20,832 | $28,621 |
| Incidence of Earnings | 97.9% | 96.6% | 97.8% | 95.4% | 96.7% |
| SA benefit (2018 constant dollars) | $185 | $251 | $95 | $227 | $212 |
| Percentage SA recipients | 5.1% | 6.9% | 2.7% | 7.0% | 5.7% |
- *Source: Labour Market Program Data Platform, Employment and Social Development Canada
Table 22: Profile of active male claimants who started Employment Benefits and Support Measures between January 1, 2012 to March 31, 2013
For accessibility reasons, the table has been simplified. Consult the PDF version for the full table.
| Profile Males | SD-R | TWS | SE | JCP | EAS-only |
|---|---|---|---|---|---|
| Percentage of claimants by program | 20.4% | 4.5% | 2.6% | 0.6% | 71.9% |
- *Source: Labour Market Program Data Platform, Employment and Social Development Canada
| Age | SD-R | TWS | SE | JCP | EAS-only |
|---|---|---|---|---|---|
| 24 years and younger | 19.6% | 11.0% | 3.2% | 12.7% | 9.8% |
| 25 to 34 years | 35.8% | 27.6% | 30.0% | 29.6% | 26.6% |
| 35 to 44 years | 23.1% | 21.8% | 30.9% | 18.2% | 23.5% |
| 45 to 54 years | 17.7% | 25.5% | 25.1% | 20.4% | 24.7% |
| 55 years and older | 7.6% | 16.7% | 11.9% | 21.9% | 17.6% |
- *Source: Labour Market Program Data Platform, Employment and Social Development Canada
| Marital status | SD-R | TWS | SE | JCP | EAS-only |
|---|---|---|---|---|---|
| Married | 34.6% | 34.4% | 47.9% | 33.6% | 35.0% |
| Divorced | 5.7% | 8.2% | 7.5% | 6.6% | 8.0% |
| Single | 40.6% | 36.4% | 22.6% | 39.9% | 35.1% |
| Missing values | 19.1% | 21.1% | 22.0% | 19.8% | 21.9% |
- *Source: Labour Market Program Data Platform, Employment and Social Development Canada
| Designated groups | SD-R | TWS | SE | JCP | EAS-only |
|---|---|---|---|---|---|
| Indigenous peoples of Canada | 3.4% | 3.3% | 3.3% | 7.4% | 4.4% |
| People with disabilities | 0.2% | 0.4% | 0.3% | 0.6% | 0.3% |
| Visible minorities | 2.8% | 3.7% | 3.3% | 9.9% | 4.0% |
| Immigrants within the last 5 years | 2.5% | 2.0% | 2.5% | 4.4% | 2.6% |
- *Source: Labour Market Program Data Platform, Employment and Social Development Canada
| National Occupational Classification (NOC) skill level** | SD-R | TWS | SE | JCP | EAS-only |
|---|---|---|---|---|---|
| Skill Type 0: Managerial level | 2.9% | 5.9% | 12.6% | 4.6% | 5.2% |
| Skill level A: Professional jobs (requires university degree) | 2.7% | 5.3% | 11.4% | 2.7% | 5.1% |
| Skill level B: Technical jobs / skilled trades (requires college diploma or apprenticeship) | 34.0% | 28.6% | 43.5% | 25.9% | 30.9% |
| Skill level C: Intermediate jobs (requires high school and/or job specific training) | 30.1% | 31.4% | 22.3% | 23.6% | 33.1% |
| Skill level D: Labour jobs | 30.5% | 29.5% | 11.3% | 43.6% | 26.2% |
- *Source: Labour Market Program Data Platform, Employment and Social Development Canada
- ** Find your NOC - Canada.ca
| Key Labour Market Indicators In the Year Preceding the Start of Participation | SD-R | TWS | SE | JCP | EAS-only |
|---|---|---|---|---|---|
| Earnings (2018 constant dollars) | $30,509 | $26,710 | $35,417 | $22,479 | $30,741 |
| Incidence of Earnings | 97.7% | 96.0% | 97.2% | 94.3% | 95.8% |
| SA benefit (2018 constant dollars) | $175 | $271 | $89 | $321 | $212 |
| Percentage SA recipients | 4.9% | 7.8% | 2.5% | 9.5% | 5.9% |
- *Source: Labour Market Program Data Platform, Employment and Social Development Canada
Table 23: Profile of active female claimants who started Employment Benefits and Support Measures between January 1, 2012 to March 31, 2013
For accessibility reasons, the table has been simplified. Consult the PDF version for the full table.
| Profile Females | SD-R | TWS | SE | JCP | EAS-only |
|---|---|---|---|---|---|
| Percentage of claimants by program | 18.4% | 4.8% | 2.8% | 0.8% | 73.2% |
- *Source: Labour Market Program Data Platform, Employment and Social Development Canada
| Age | SD-R | TWS | SE | JCP | EAS-only |
|---|---|---|---|---|---|
| 24 years and younger | 13.1% | 5.4% | 2.4% | 7.2% | 6.5% |
| 25 to 34 years | 28.5% | 22.2% | 27.1% | 26.5% | 23.6% |
| 35 to 44 years | 26.5% | 23.4% | 30.1% | 19.1% | 24.1% |
| 45 to 54 years | 25.6% | 33.3% | 27.3% | 26.6% | 28.7% |
| 55 years and older | 9.0% | 17.3% | 14.0% | 23.6% | 18.6% |
- *Source: Labour Market Program Data Platform, Employment and Social Development Canada
| Marital status | SD-R | TWS | SE | JCP | EAS-only |
|---|---|---|---|---|---|
| Married | 34.8% | 33.9% | 41.8% | 39.5% | 36.9% |
| Divorced | 13.9% | 16.5% | 13.6% | 14.0% | 14.8% |
| Single | 33.7% | 29.7% | 24.9% | 29.4% | 29.3% |
| Missing values | 17.6% | 20.0% | 19.7% | 17.0% | 19.0% |
- *Source: Labour Market Program Data Platform, Employment and Social Development Canada
| Designated groups | SD-R | TWS | SE | JCP | EAS-only |
|---|---|---|---|---|---|
| Indigenous peoples of Canada | 3.0% | 2.6% | 3.0% | 3.8% | 4.2% |
| People with disabilities | 0.2% | 0.4% | 0.3% | 0.3% | 0.3% |
| Visible minorities | 3.3% | 3.2% | 3.2% | 2.5% | 4.1% |
| Immigrants within the last 5 years | 2.7% | 1.8% | 1.4% | 0.9% | 2.2% |
- *Source: Labour Market Program Data Platform, Employment and Social Development Canada
| National Occupational Classification (NOC) skill level** | SD-R | TWS | SE | JCP | EAS-only |
|---|---|---|---|---|---|
| Skill Type 0: Managerial level | 6.7% | 8.4% | 14.0% | 5.7% | 7.3% |
| Skill level A: Professional jobs (requires university degree) | 4.4% | 7.6% | 18.8% | 10.2% | 7.9% |
| Skill level B: Technical jobs / skilled trades (requires college diploma or apprenticeship) | 22.1% | 25.3% | 33.2% | 21.9% | 25.0% |
| Skill level C: Intermediate jobs (requires high school and/or job specific training) | 47.0% | 43.8% | 30.1% | 37.0% | 43.7% |
| Skill level D: Labour jobs | 20.7% | 16.5% | 6.6% | 26.9% | 17.3% |
- *Source: Labour Market Program Data Platform, Employment and Social Development Canada
| Key Labour Market Indicators In the Year Preceding the Start of Participation | SD-R | TWS | SE | JCP | EAS-only |
|---|---|---|---|---|---|
| Earnings (2018 constant dollars) | $23,138 | $24,265 | $29,693 | $19,231 | $26,046 |
| Incidence of Earnings | 98.2% | 97.3% | 98.3% | 96.5% | 97.7% |
| SA benefit (2018 constant dollars) | $199 | $228 | $102 | $136 | $212 |
| Percentage SA recipients | 5.4% | 5.9% | 2.8% | 4.6% | 5.4% |
- * Source: Labour Market Program Data Platform, Employment and Social Development Canada
General outcomes by sex
Women have lower average income than men, and face additional barriers that affect their return to work after job loss. Literature states that women disproportionately shoulder family responsibilities, which limits their ability for economic advancement. In our ageing society, this may also entail caring for elderly family members, as well as for children. According to the World Bank, "women undertake 3 times more unpaid work than men and spend about half as much time in paid work."Footnote 34 Moreover, "women tend to be concentrated in less productive jobs, run enterprises in less productive sectors, and are more likely to do part‑time and temporary jobs with fewer avenues for advancement, than men."Footnote 35Three main barriers were identified by research conducted by the Word Bank to impact women's economic security. These were safe transportation, discrimination, and caregiving.Footnote 36
Access to safe transportation plays a role in women's ability to work outside the home.Footnote 37 Finally, discrimination can play a role in women's access to jobs and job interviews. Studies have found that women with caregiving responsibilities are disadvantaged in the labour force. This can take the form of discriminatory hiring practices from employers who do not hire women who might have children,Footnote 38 or from women who may self-select to work in lower-wage, part-time, or precarious jobs due to a lack of caregiving supports.Footnote 39 "Women as a group often have greater difficulty than men finding suitable alternate employment once they have lost their jobs. They tend to stay unemployed longer and, when new jobs are found, often work at replacement wages which are significantly lower than those of their male counterparts."Footnote 40
Overall, Chart 51 the gap with national median wages. On average, indexed income for active claimants who participated in an EBSM rose faster than LIM and national median wages. While close to 3-quarters of participants only had light-touch/gateway interventions through EAS, 1 in 5 participants benefitted from more intensive SD-R program in FY1213. More men than women participated in an EBSM during this period (55.7% and 44.3%, respectively).
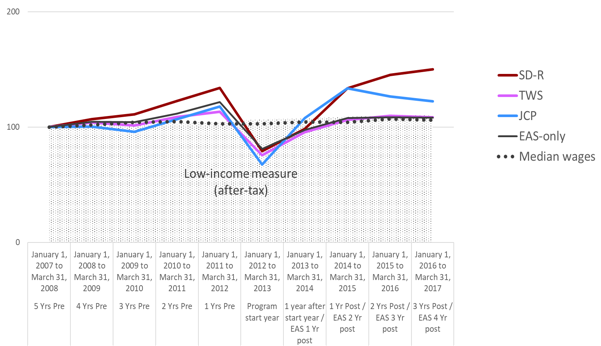
Text description of chart 48
| Pre-program period | Program Period | Post-program period | ||||||||
|---|---|---|---|---|---|---|---|---|---|---|
| 5 Yrs Pre | 4 Yrs Pre | 3 Yrs Pre | 2 Yrs Pre | 1 Yrs Pre | Program start year | 1 year after start year / EAS 1 Yr post | 1 Yr Post / EAS 2 Yr post | 2 Yrs Post / EAS 3 Yr post | 3 Yrs Post / EAS 4 Yr post | |
| January 1, 2007 to March 31, 2008 | January 1, 2008 to March 31, 2009 | January 1, 2009 to March 31, 2010 | January 1, 2010 to March 31, 2011 | January 1, 2011 to March 31, 2012 | January 1, 2012 to March 31, 2013 | January 1, 2013 to March 31, 2014 | January 1, 2014 to March 31, 2015 | January 1, 2015 to March 31, 2016 | January 1, 2016 to March 31, 2017 | |
| SD-R | 100 | 107 | 111 | 123 | 134 | 79 | 98 | 134 | 145 | 150 |
| TWS | 100 | 104 | 101 | 109 | 113 | 76 | 96 | 106 | 110 | 109 |
| JCP | 100 | 100 | 96 | 107 | 118 | 68 | 108 | 134 | 127 | 122 |
| EAS-only | 100 | 105 | 104 | 112 | 122 | 81 | 98 | 108 | 109 | 108 |
| Median wages | 100 | 102 | 104 | 105 | 103 | 103 | 105 | 104 | 107 | 106 |
| Low-income (after-tax) | 100 | 103 | 103 | 103 | 105 | 107 | 107 | 109 | 110 | 111 |
- Notes Low income measures (LIM) after tax are set at 50% of adjusted median household income, for an individual person
- EAS-only does not have an extended program period. One-year post start period is outside of the program period
- Sources Employment and Social Development Canada. Labour Market Program Data Platform
- Statistics Canada. Table 11-10-0232-01 Low income measure (LIM) thresholds by income source and household size
- Statistics Canada. Table 18-10-0005-01 Consumer Price Index, annual average, not seasonally adjusted
- Statistics Canada. Table 14-10-0340-01 Employee wages by occupation, annual
Indexed income for total participants from SD‑R had the highest overall growth rate (50%), from 5 years before job loss, to 3 years after program participation (Chart 48). Income for JCP participants had the next highest growth rate, a 22% increase over the ten‑year period. While the growth rate for incomes from the TWS and EAS‑only groups were weaker than the other programs, they still grew faster than LIM and median wages, at 9% and 6%, respectively.
Average income for total participants from SD-R increased by 50.3%, from $20,448, 5 years before job loss to $30,731, 3‑years after program participation (Table 23). Participants' income surpassed the low-income threshold (LIM) and returned to their highest income level prior to job loss within the first year after leaving the program. Their income continued to climb over the 3 post-participation years. Average income for SD-R participants closed the gap with national median wages by 20.2 percentage points over the 10‑year period.
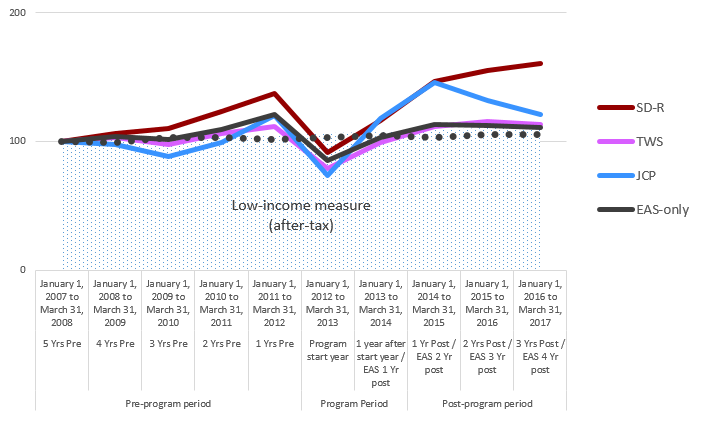
Text description of chart 49
| Pre-program period | Program Period | Post-program period | ||||||||
|---|---|---|---|---|---|---|---|---|---|---|
| 5 Yrs Pre | 4 Yrs Pre | 3 Yrs Pre | 2 Yrs Pre | 1 Yrs Pre | Program start year | 1 year after start year / EAS 1 Yr post | 1 Yr Post / EAS 2 Yr post | 2 Yrs Post / EAS 3 Yr post | 3 Yrs Post / EAS 4 Yr post | |
| January 1, 2007 to March 31, 2008 | January 1, 2008 to March 31, 2009 | January 1, 2009 to March 31, 2010 | January 1, 2010 to March 31, 2011 | January 1, 2011 to March 31, 2012 | January 1, 2012 to March 31, 2013 | January 1, 2013 to March 31, 2014 | January 1, 2014 to March 31, 2015 | January 1, 2015 to March 31, 2016 | January 1, 2016 to March 31, 2017 | |
| SD-R | 100 | 106 | 111 | 123 | 137 | 91 | 116 | 147 | 155 | 160 |
| TWS | 100 | 103 | 98 | 106 | 112 | 79 | 100 | 111 | 115 | 113 |
| JCP | 100 | 98 | 89 | 99 | 120 | 74 | 118 | 146 | 132 | 121 |
| EAS-only | 100 | 104 | 102 | 110 | 121 | 85 | 103 | 113 | 113 | 111 |
| Median wages - male | 100 | 100 | 103 | 103 | 102 | 103 | 104 | 103 | 106 | 105 |
| Low-income measure (after-tax) | 100 | 103 | 103 | 103 | 105 | 107 | 107 | 109 | 110 | 111 |
- Notes Low income measures (LIM) after tax are set at 50% of adjusted median household income, for an individual person
- EAS-only does not have an extended program period. One-year post start period is outside of the program period
- Sources Employment and Social Development Canada. Labour Market Program Data Platform
- Statistics Canada. Table 11-10-0232-01 Low income measure (LIM) thresholds by income source and household size
- Statistics Canada. Table 18-10-0005-01 Consumer Price Index, annual average, not seasonally adjusted
- Statistics Canada. Table 14-10-0340-01 Employee wages by occupation, annual
This strong growth was driven by male participants, whose indexed growth rate was 60% from FY0708 to FY1617 (Chart 49). The growth rate for their female counterparts was 33%, over the same period. Average income for men surpassed their highest pre-job loss income in the first year post-program. Income rose 6.9% from $30,509, the year before job loss, to $32,623, the year after program participation. Income continued to climb for the 3 years after participation to $35,591. Incomes for male SD-R participants closed the gap with national median wages by 24.9 percentage points, shrinking from 52.5% 5 years before job loss to 27.6%, 3 years after program participation.
Median wages for women in SD‑R also increased after program participation, but at a slower rate than for men and resulting in a lower income level. Income for females returned to their highest pre-job loss levels two-years after program participation from $23,138 to $23,134 (Chart 53). Income rose slowly in the third year to $24,042, a 3.9% increase from the year before program participation. Average income for women closed the gap with national median wages by 10.6 percentage points, from 53.1% in FY0708 to 42.5% in FY1617.
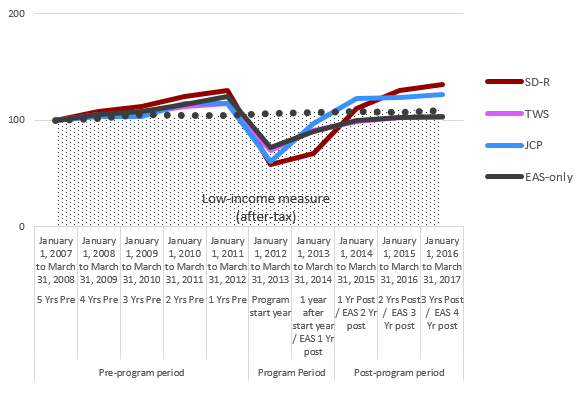
Text description of chart 50
| Pre-program period | Program Period | Post-program period | ||||||||
|---|---|---|---|---|---|---|---|---|---|---|
| 5 Yrs Pre | 4 Yrs Pre | 3 Yrs Pre | 2 Yrs Pre | 1 Yrs Pre | Program start year | 1 year after start year / EAS 1 Yr post | 1 Yr Post / EAS 2 Yr post | 2 Yrs Post / EAS 3 Yr post | 3 Yrs Post / EAS 4 Yr post | |
| January 1, 2007 to March 31, 2008 | January 1, 2008 to March 31, 2009 | January 1, 2009 to March 31, 2010 | January 1, 2010 to March 31, 2011 | January 1, 2011 to March 31, 2012 | January 1, 2012 to March 31, 2013 | January 1, 2013 to March 31, 2014 | January 1, 2014 to March 31, 2015 | January 1, 2015 to March 31, 2016 | January 1, 2016 to March 31, 2017 | |
| SD-R | 100 | 108 | 113 | 122 | 128 | 59 | 69 | 111 | 128 | 133 |
| TWS | 100 | 105 | 106 | 113 | 116 | 71 | 90 | 99 | 102 | 103 |
| JCP | 100 | 103 | 104 | 116 | 115 | 61 | 97 | 120 | 121 | 124 |
| EAS-only | 100 | 106 | 108 | 115 | 122 | 75 | 89 | 100 | 103 | 104 |
| Median wages - female | 100 | 102 | 105 | 105 | 104 | 106 | 107 | 108 | 108 | 109 |
| Low-income (after-tax) | 100 | 103 | 103 | 103 | 105 | 107 | 107 | 109 | 110 | 111 |
- Notes Low income measures (LIM) after tax are set at 50% of adjusted median household income, for an individual person
- EAS-only does not have an extended program period. One-year post start period is outside of the program period
- Sources Employment and Social Development Canada. Labour Market Program Data Platform
- Statistics Canada. Table 11-10-0232-01 Low income measure (LIM) thresholds by income source and household size
- Statistics Canada. Table 18-10-0005-01 Consumer Price Index, annual average, not seasonally adjusted
- Statistics Canada. Table 14-10-0340-01 Employee wages by occupation, annual
Of those who participated in SD-R, 58.2% were men and 41.8% were women (Table 20). The majority of men were between 25 to 34 years of age, and tended to hold prior jobs in NOC skill level B. These are technical jobs or skilled trades that usually require a college diploma or apprenticeship, such as electricians, computer network technicians or fire fighters. The female cohort was mostly aged 25 to 34 years, and close to half of the group had NOC skill level C jobs. These "intermediate jobs require high school and/or job-specific training, such as factory workers, long-haul truck drivers or food and beverage servers."Footnote 41
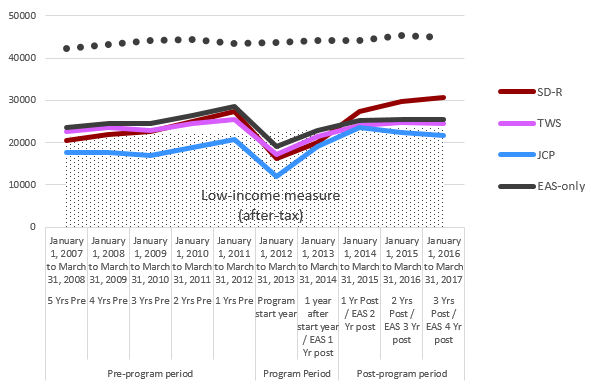
Text description of chart 51
| Pre-program period | Program Period | Post-program period | ||||||||
|---|---|---|---|---|---|---|---|---|---|---|
| 5 Yrs Pre | 4 Yrs Pre | 3 Yrs Pre | 2 Yrs Pre | 1 Yrs Pre | Program start year | 1 year after start year / EAS 1 Yr post | 1 Yr Post / EAS 2 Yr post | 2 Yrs Post / EAS 3 Yr post | 3 Yrs Post / EAS 4 Yr post | |
| January 1, 2007 to March 31, 2008 | January 1, 2008 to March 31, 2009 | January 1, 2009 to March 31, 2010 | January 1, 2010 to March 31, 2011 | January 1, 2011 to March 31, 2012 | January 1, 2012 to March 31, 2013 | January 1, 2013 to March 31, 2014 | January 1, 2014 to March 31, 2015 | January 1, 2015 to March 31, 2016 | January 1, 2016 to March 31, 2017 | |
| SD-R | 20,448 | 21,878 | 22,753 | 25,125 | 27,407 | 16,216 | 20,119 | 27,331 | 29,698 | 30,731 |
| TWS | 22,580 | 23,478 | 22,883 | 24,568 | 25,595 | 17,087 | 21,579 | 23,979 | 24,825 | 24,542 |
| JCP | 17,667 | 17,730 | 16,944 | 18,891 | 20,832 | 11,938 | 19,053 | 23,602 | 22,377 | 21,615 |
| EAS-only | 23,533 | 24,593 | 24,545 | 26,319 | 28,621 | 19,069 | 22,956 | 25,355 | 25,569 | 25,434 |
| Median wages | 42,369 | 43,172 | 44,097 | 44,444 | 43,575 | 43,585 | 44,278 | 44,181 | 45,318 | 44,920 |
| Low-income measure (after-tax) | 21,344 | 21,921 | 22,015 | 22,080 | 22,382 | 22,793 | 22,906 | 23,270 | 23,550 | 23,619 |
- Notes Low income measures (LIM) after tax are set at 50% of adjusted median household income, for an individual person
- EAS-only does not have an extended program period. One-year post start period is outside of the program period
- Sources Employment and Social Development Canada. Labour Market Program Data Platform
- Statistics Canada. Table 11-10-0232-01 Low income measure (LIM) thresholds by income source and household size
- Statistics Canada. Table 18-10-0005-01 Consumer Price Index, annual average, not seasonally adjusted
- Statistics Canada. Table 14-10-0340-01 Employee wages by occupation, annual
The next program with a strong growth rate is JCP. The indexed income growth rate for participants from JCP increased 22% over the ten-year period (Chart 48). Aggregate indexed income rose 34%, faster than LIM and median wages for the post-participation period, however, indexed income started to fall after the first year. Male participants also drove this trend. Indexed income for men increased by 21% over ten-years, with an increase of 46% the year after program participation (Chart 49). Indexed income fell steadily over the next 2 years. While indexed income for women also increased, but at a slower rate than their male counterparts. The overall growth rate was 24% over ten-years. Income rose slowly yet steadily for the 3 years after program participation (Chart 50).
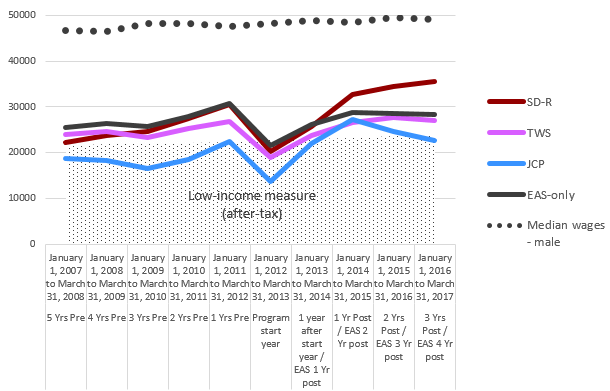
Text description of chart 52
| Pre-program period | Program Period | Post-program period | ||||||||
|---|---|---|---|---|---|---|---|---|---|---|
| 5 Yrs Pre | 4 Yrs Pre | 3 Yrs Pre | 2 Yrs Pre | 1 Yrs Pre | Program start year | 1 year after start year / EAS 1 Yr post | 1 Yr Post / EAS 2 Yr post | 2 Yrs Post / EAS 3 Yr post | 3 Yrs Post / EAS 4 Yr post | |
| January 1, 2007 to March 31, 2008 | January 1, 2008 to March 31, 2009 | January 1, 2009 to March 31, 2010 | January 1, 2010 to March 31, 2011 | January 1, 2011 to March 31, 2012 | January 1, 2012 to March 31, 2013 | January 1, 2013 to March 31, 2014 | January 1, 2014 to March 31, 2015 | January 1, 2015 to March 31, 2016 | January 1, 2016 to March 31, 2017 | |
| SD-R | 22,195 | 23,625 | 24,528 | 27,385 | 30,509 | 20,278 | 25,746 | 32,623 | 34,468 | 35,591 |
| TWS | 23,913 | 24,622 | 23,386 | 25,354 | 26,710 | 18,834 | 23,800 | 26,646 | 27,615 | 27,054 |
| JCP | 18,691 | 18,259 | 16,586 | 18,510 | 22,479 | 13,745 | 22,036 | 27,302 | 24,619 | 22,590 |
| EAS-only | 25,365 | 26,277 | 25,777 | 27,831 | 30,741 | 21,640 | 26,184 | 28,719 | 28,621 | 28,216 |
| Median wages - male | 46,764 | 46,548 | 48,102 | 48,265 | 47,509 | 48,235 | 48,793 | 48,349 | 49,454 | 49,162 |
| Low-income (after-tax) | 21,344 | 21,921 | 22,015 | 22,080 | 22,382 | 22,793 | 22,906 | 23,270 | 23,550 | 23,619 |
- Notes Low income measures (LIM) after tax are set at 50% of adjusted median household income, for an individual person
- EAS-only does not have an extended program period. One-year post start period is outside of the program period
- Sources Employment and Social Development Canada. Labour Market Program Data Platform
- Statistics Canada. Table 11-10-0232-01 Low income measure (LIM) thresholds by income source and household size
- Statistics Canada. Table 18-10-0005-01 Consumer Price Index, annual average, not seasonally adjusted
- Statistics Canada. Table 14-10-0340-01 Employee wages by occupation, annual
Overall, average income for total JCP participants surpassed the highest level of income prior to job loss by 13.3% in the first year after program participation, from $20,832 to $23,602 (Chart 51). Income followed the trend from the male cohort and fell slightly in the second and third year. While average total income remained below the low-income threshold for the ten-year period, they narrowed the wage gap with national median wages by 6.4 percentage points, from 58.3% 5 year before the start of programs, to 51.9% 3 years after programs.
Average income for male JCP participants was higher than the low-income threshold the year before job loss and 2 years after program participation. Income the year after program participation surpassed the previous highest income level by 21.5%, from $22,479 to $27,302 (Chart 52). Income for male JCP participants closed the gap with national median wages by 6.0% over 10 years, from 60.0% in FY0708 to 54.1% in FY1617.

Text description of chart 53
| Pre-program period | Program Period | Post-program period | ||||||||
|---|---|---|---|---|---|---|---|---|---|---|
| 5 Yrs Pre | 4 Yrs Pre | 3 Yrs Pre | 2 Yrs Pre | 1 Yrs Pre | Program start year | 1 year after start year / EAS 1 Yr post | 1 Yr Post / EAS 2 Yr post | 2 Yrs Post / EAS 3 Yr post | 3 Yrs Post / EAS 4 Yr post | |
| January 1, 2007 to March 31, 2008 | January 1, 2008 to March 31, 2009 | January 1, 2009 to March 31, 2010 | January 1, 2010 to March 31, 2011 | January 1, 2011 to March 31, 2012 | January 1, 2012 to March 31, 2013 | January 1, 2013 to March 31, 2014 | January 1, 2014 to March 31, 2015 | January 1, 2015 to March 31, 2016 | January 1, 2016 to March 31, 2017 | |
| SD-R | 18,043 | 19,474 | 20,311 | 22,014 | 23,138 | 10,627 | 12,377 | 20,048 | 23,134 | 24,042 |
| TWS | 20,991 | 22,115 | 22,283 | 23,632 | 24,265 | 15,005 | 18,931 | 20,800 | 21,498 | 21,547 |
| JCP | 16,671 | 17,217 | 17,292 | 19,262 | 19,231 | 10,184 | 16,158 | 20,011 | 20,202 | 20,669 |
| EAS-only | 21,308 | 22,547 | 23,050 | 24,483 | 26,046 | 15,946 | 19,036 | 21,270 | 21,863 | 22,055 |
| Median wages - female | 38,471 | 39,264 | 40,451 | 40,321 | 40,150 | 40,853 | 41,117 | 41,684 | 41,406 | 41,842 |
| Low-income (after-tax) | 21,344 | 21,921 | 22,015 | 22,080 | 22,382 | 22,793 | 22,906 | 23,270 | 23,550 | 23,619 |
- Notes Low income measures (LIM) after tax are set at 50% of adjusted median household income, for an individual person
- EAS-only does not have an extended program period. One-year post start period is outside of the program period
- Sources Employment and Social Development Canada. Labour Market Program Data Platform
- Statistics Canada. Table 11-10-0232-01 Low income measure (LIM) thresholds by income source and household size
- Statistics Canada. Table 18-10-0005-01 Consumer Price Index, annual average, not seasonally adjusted
- Statistics Canada. Table 14-10-0340-01 Employee wages by occupation, annual
While income for female JCP participants remained below the low-income threshold for the ten-year period, income improved after program participation. In the first year after program participation, income exceeded the highest previous level by 7.3%, from $19,262 to $20,669 (Chart 53). Income for females from JCP narrowed the wage gap with national median wages by 6.1 percentage points over the ten-year period, from 56.7% 5 years before job loss, to 50.6% 3 years after participation.
Participation in JCP was evenly split between males and females at 50.0% each (Table 20). Close to one-third of male JCP participants were young workers, aged 25 to 34 years. Almost half of this group had NOC skill level D jobs. These are low-skilled jobs that did not require high school graduation, such as cleaning staff, cashiers, or gas station attendants. Over a quarter of female JCP participants were aged 45 to 54. Over one-third previously had NOC skill level C occupations, such as office support staff, court clerks, or teaching assistants.
Unlike SD-R and JCP, the indexed growth rate for aggregate income from TWS participants (9%) grew at a similar rate to low-income (11%) and national median wages (6%), and slowed after job loss (Chart 48). While overall income for TWS participants fell 3.0% below their highest level pre‑job loss, ($25,595 the year before participation to $24,542,3 years after participation), the wage gap over 10 years narrowed with national median wages by 1.3percentage points, from 46.7% 5 years before participation, to 45.4% 3 years after participation (Table 23).
Breaking this group down by sex, indexed income for males grew faster than median wages and low-income, and their income left the low-income threshold. This was not the case for females, whose indexed incomes grew slower than median wages and low-income, and stayed in low-income after intervention. Average income for males in TWS returned to their highest pre-job loss level the year after program participation ($26,710 the year before job loss to $26,646, the year after participation), and continued to rise 3.4% to $27,615 in the second year after participation (Table 24). Over 10 years, income for males in TWS rose 13.1% from $23,913 to $27,054. Income for males closed the wage gap by 3.9 percentage points from 48.9% in FY0708 to 45.0% in FY1617. Income for males was above low-income before job loss, and returned above left low-income within the program period (one-year after start year), and continued to rise further away from low-income after intervention.
The income trajectory for females did not follow the same pattern as their males counterparts. Income for females prior to job loss was below, or hovering around the low-income threshold, and remained below the low-income threshold after intervention. Over 10 years, income growth followed inflation at 2.6%, from $20,991 to $21,547 (Table 25). Poverty deepened for this group after job loss, and the wage gap widened with national median wages, by 3.1 percentage points, from 45.4% in FY0708, to 48.5% FY1617.
According to Table 20, there were more males than females participating in TWS (54.2% to 45.8%). Both cohorts were predominantly aged 45 to 54 years, and both groups previously had from NOC skill level C jobs, such as shippers and receivers, food and beverage servers, or home support workers. According to RBC Economics, "Canadian women were more likely to work in customer-facing positions and in industries, like accommodation and food services. Where women worked, along with their greater tendency to work part-time, explains roughly two-thirds of women's job losses."Footnote 42
Unlike the other interventions, Employment Assistance Services (EAS) is a low-cost investment that helps active claimants overcome the challenges from job loss. This intervention is not designed to handle structural impediments that cause job loss. It is the gateway for claimants to enter full, or short-term/light-touch interventions. Active claimants in the EAS-only group did not receive any other interventions; those individuals were filtered out of this group. For EAS-only participants, its focus is on reintegrating workers back into employment as soon as possible. EAS-only interventions are not medium-term investments on human capital, and do not necessarily contribute to improved income in the long run. Therefore, it is treated as a comparison group in this analysis.
After job loss, indexed aggregate income for EAS-only claimants grew at a similar rate (8%) to national median wages (6%) and low-income (11%) (Chart 48). Income for EAS-only claimants did not return to their highest income prior to job loss. Instead it dropped 10.7%, from $28,621, 1 year before job loss, to $25,569, two-years after job loss (Chart 51). Aggregate income left low-income threshold in the second year after program participation, and remained above low-income for post-program period.
Neither male nor female EAS-only participants recovered their previous earning levels. However, male income grew faster than income for their female counterparts. Indexed male income equalized with low-income and national median wages the years after an intervention, and rose past low-income and national median wages in the years following. Over 10 years, indexed income for males grew 11% (Chart 49). Average income for males who left low-income in the year following the intervention grew by 14.3% and participants tended to remain out of low-income every year after participation. Over 10 years, average male income narrowed the gap with national median wages (male) by 3.2percentage points, from 45.8% in FY0708 to 42.6% in FY1617 (Table 24).
However, females who only had EAS interventions fell deeper into poverty after job loss. Indexed income for females (Chart 50) who only had EAS interventions grew at a slower rate (4% over 10 years) than national median wages (9%) and LIM (11%). Females in EAS had lower income than their male counterparts throughout the entire ten-year period. Before job loss, female income hovered just above the low-income threshold. After job loss, income did not recover and remained below low‑income after interventions (Chart 53). Income fell 15.3% from $26,046 (one year before job loss) to $22,055 (3 years after intervention). Income was 0.2% below the low-income threshold in FY0708 ($21,308 income to $21,344 low-income threshold), but fell to 6.6% below low-income in FY1617. The wage gap with national median wages for females widened by 2.7percentage points from 44.6% in FY 0708 to 47.3% in FY1617 ((Table 25).
From Table 20, the EAS-only group had a larger proportion of males than females (55.1% to 44.9%). Both groups were predominantly from NOC skill level C occupations, intermediate jobs that require high school education or training specific to the job, such as food and beverage servers, retail salespersons, or airline ticket and service agents. The male cohort was mostly made up of younger workers aged 25 to 34 years. The female cohort mostly included mid-aged workers 45 to 54 years old.
As EAS is a gateway intervention, and a proxy for no intervention, female income falling into poverty after losing their jobs is likely less attributed to any program shortcomings, and more indicative of structural issues in the labour market and society that require policy intervention. While both male and females had similar NOCs prior to interventions, the male cohorts were mostly younger workers.
With the exception of SD-R, the majority of females receiving an EBSM lost jobs in mid-career range, this may indicate additional structural issues related to aging and older workers. "In Western countries, the loss of a job at this stage in life can be synonymous with long‑term economic precariousness that can end in definitive exclusion from the labour market".Footnote 43 According to Fournier et al., workers aged 45 and over face more challenges returning to work. They have fewer chances of being re-employed within the year, compared to workers aged 25 to 34, and the jobs they find are often precarious and are "occupational downgrades".Footnote 44 Mid-aged and older workers face "prejudicial factors such as advanced age, low-education, and poor health." Footnote 45 They may experience skills mismatch, "the gap between the abilities required in the job market and those older workers actually have."Footnote 46 Workers may also face ageism, a "systematic stereotyping where workers are seen to be less flexible and less productive to have obsolete skill sets, and to be too expensive for the company."Footnote 47 The combination of unemployment in mid-life, having low skills and low education, and being female presents multiple vulnerabilities for these workers to shifts in the business cycle. These workers may experience more disadvantage transitioning their skills to a changing labour market more focused on the knowledge economy.Footnote 48
"Despite an increased focus on women's economic empowerment, women continue to see poorer economic outcomes than men."Footnote 49 Participation in EBSMs did not produce the same outcomes for males and females. Income started at a lower rate for females than for males who participated in the same programs. In contrast to male income, which surpassed previous highest levels after program participation, overall average income for females did not recover after job loss and they remained below the low‑income threshold post-program.
Table 24: Income for active claimants in Employment Benefits and Support Measures, January 1, 2012 to March 31, 2013, with median wages and low-income measures, 15 years and older, total sex, Canada, 2018 constant dollars
For accessibility reasons, the table has been simplified. Consult the PDF version for the full table.
| LMDAs | 5 Yrs Pre (January 1, 2007 to March 31, 2008) | 4 Yrs Pre (January 1, 2008 to March 31, 2009) | 3 Yrs Pre (January 1, 2009 to March 31, 2010) | 2 Yrs Pre (January 1, 2010 to March 31, 2011) | 1 Yr Pre (January 1, 2011 to March 31, 2012) |
|---|---|---|---|---|---|
| SD-R | $20,448 | $21,878 | $22,753 | $25,125 | $27,407 |
| TWS | $22,580 | $23,478 | $22,883 | $24,568 | $25,595 |
| JCP | $17,667 | $17,730 | $16,944 | $18,891 | $20,832 |
| EAS-only | $23,533 | $24,593 | $24,545 | $26,319 | $28,621 |
| Median wages | $42,369 | $43,172 | $44,097 | $44,444 | $43,575 |
| Low-income measure (after-tax) | $21,344 | $21,921 | $22,015 | $22,080 | $22,382 |
- Notes Low income measures (LIM) after tax are set at 50% of adjusted median household income, for an individual person
- EAS-only does not have an extended program period. One-year post start period is outside of the program period
- Sources Employment and Social Development Canada. Labour Market Program Data Platform
- Statistics Canada. Table 11-10-0232-01 Low income measure (LIM) thresholds by income source and household size
- Statistics Canada. Table 18-10-0005-01 Consumer Price Index, annual average, not seasonally adjusted
- Statistics Canada. Table 14-10-0340-01 Employee wages by occupation, annual
| LMDAs | Program start year (January 1, 2012 to March 31, 2013) | 1 year after start year / EAS 1 Yr post (January 1, 2013 to March 31, 2014) |
|---|---|---|
| SD-R | $16,216 | $20,119 |
| TWS | $17,087 | $21,579 |
| JCP | $11,938 | $19,053 |
| EAS-only | $19,069 | $22,956 |
| Median wages | $43,585 | $44,278 |
| Low-income measure (after-tax) | $22,793 | $22,906 |
- Notes Low income measures (LIM) after tax are set at 50% of adjusted median household income, for an individual person
- EAS-only does not have an extended program period. One-year post start period is outside of the program period
- Sources Employment and Social Development Canada. Labour Market Program Data Platform
- Statistics Canada. Table 11-10-0232-01 Low income measure (LIM) thresholds by income source and household size
- Statistics Canada. Table 18-10-0005-01 Consumer Price Index, annual average, not seasonally adjusted
- Statistics Canada. Table 14-10-0340-01 Employee wages by occupation, annual
| LMDAs | 1 Yr Post / EAS 2 Yr post (January 1, 2014 to March 31, 2015) | 2 Yrs Post / EAS 3 Yr post (January 1, 2015 to March 31, 2016) | 3 Yrs Post / EAS 4 Yr post (January 1, 2016 to March 31, 2017) |
|---|---|---|---|
| SD-R | $27,331 | $29,698 | $30,731 |
| TWS | $23,979 | $24,825 | $24,542 |
| JCP | $23,602 | $22,377 | $21,615 |
| EAS-only | $25,355 | $25,569 | $25,434 |
| Median wages | $44,181 | $45,318 | $44,920 |
| Low-income measure (after-tax) | $23,270 | $23,550 | $23,619 |
- Notes Low income measures (LIM) after tax are set at 50% of adjusted median household income, for an individual person
- EAS-only does not have an extended program period. One-year post start period is outside of the program period
- Sources Employment and Social Development Canada. Labour Market Program Data Platform
- Statistics Canada. Table 11-10-0232-01 Low income measure (LIM) thresholds by income source and household size
- Statistics Canada. Table 18-10-0005-01 Consumer Price Index, annual average, not seasonally adjusted
- Statistics Canada. Table 14-10-0340-01 Employee wages by occupation, annual
Table 25: Income for active claimants in Employment Benefits and Support Measures, January 1, 2012 to March 31, 2013, with median wages and low-income measures, 15 years and older, males, Canada, 2018 constant dollars
For accessibility reasons, the table has been simplified. Consult the PDF version for the full table.
| LMDAs | 5 Yrs Pre (January 1, 2007 to March 31, 2008) | 4 Yrs Pre (January 1, 2008 to March 31, 2009) | 3 Yrs Pre (January 1, 2009 to March 31, 2010) | 2 Yrs Pre (January 1, 2010 to March 31, 2011) | 1 Yrs Pre (January 1, 2011 to March 31, 2012) |
|---|---|---|---|---|---|
| SD-R | $22,195 | $23,625 | $24,528 | $27,385 | $30,509 |
| TWS | $23,913 | $24,622 | $23,386 | $25,354 | $26,710 |
| JCP | $18,691 | $18,259 | $16,586 | $18,510 | $22,479 |
| EAS-only | $25,365 | $26,277 | $25,777 | $27,831 | $30,741 |
| Median wages - male | $46,764 | $46,548 | $48,102 | $48,265 | $47,509 |
| Low-income measure (after-tax) | $21,344 | $21,921 | $22,015 | $22,080 | $22,382 |
- Notes Low income measures (LIM) after tax are set at 50% of adjusted median household income, for an individual person
- EAS-only does not have an extended program period. One-year post start period is outside of the program period
- Sources Employment and Social Development Canada. Labour Market Program Data Platform
- Statistics Canada. Table 11-10-0232-01 Low income measure (LIM) thresholds by income source and household size
- Statistics Canada. Table 18-10-0005-01 Consumer Price Index, annual average, not seasonally adjusted
- Statistics Canada. Table 14-10-0340-01 Employee wages by occupation, annual
| LMDAs | Program start year (January 1, 2012 to March 31, 2013) | 1 year after start year / EAS 1 Yr post (January 1, 2013 to March 31, 2014) |
|---|---|---|
| SD-R | $20,278 | $25,746 |
| TWS | $18,834 | $23,800 |
| JCP | $13,745 | $22,036 |
| EAS-only | $21,640 | $26,184 |
| Median wages - male | $48,235 | $48,793 |
| Low-income measure (after-tax) | $22,793 | $22,906 |
- Notes Low income measures (LIM) after tax are set at 50% of adjusted median household income, for an individual person
- EAS-only does not have an extended program period. One-year post start period is outside of the program period
- Sources Employment and Social Development Canada. Labour Market Program Data Platform
- Statistics Canada. Table 11-10-0232-01 Low income measure (LIM) thresholds by income source and household size
- Statistics Canada. Table 18-10-0005-01 Consumer Price Index, annual average, not seasonally adjusted
- Statistics Canada. Table 14-10-0340-01 Employee wages by occupation, annual
| LMDAs | 1 Yr Post / EAS 2 Yr post (January 1, 2014 to March 31, 2015) | 2 Yrs Post / EAS 3 Yr post (January 1, 2015 to March 31, 2016) | 3 Yrs Post / EAS 4 Yr post (January 1, 2016 to March 31, 2017) |
|---|---|---|---|
| SD-R | $32,623 | $34,468 | $35,591 |
| TWS | $26,646 | $27,615 | $27,054 |
| JCP | $27,302 | $24,619 | $22,590 |
| EAS-only | $28,719 | $28,621 | $28,216 |
| Median wages - male | $48,349 | $49,454 | $49,162 |
| Low-income measure (after-tax) | $23,270 | $23,550 | $23,619 |
- Notes Low income measures (LIM) after tax are set at 50% of adjusted median household income, for an individual person
- EAS-only does not have an extended program period. One-year post start period is outside of the program period
- Sources Employment and Social Development Canada. Labour Market Program Data Platform
- Statistics Canada. Table 11-10-0232-01 Low income measure (LIM) thresholds by income source and household size
- Statistics Canada. Table 18-10-0005-01 Consumer Price Index, annual average, not seasonally adjusted
- Statistics Canada. Table 14-10-0340-01 Employee wages by occupation, annual
Table 26: Income for active claimants in Employment Benefits and Support Measures, January 1, 2012 to March 31, 2013, with median wages and low-income measures, 15 years and older, females, Canada, 2018 constant dollars
For accessibility reasons, the table has been simplified. Consult the PDF version for the full table.
| LMDAs | 5 Yrs Pre (January 1, 2007 to March 31, 2008) | 4 Yrs Pre (January 1, 2008 to March 31, 2009) | 3 Yrs Pre (January 1, 2009 to March 31, 2010) | 2 Yrs Pre (January 1, 2010 to March 31, 2011) | 1 Yrs Pre (January 1, 2011 to March 31, 2012) |
|---|---|---|---|---|---|
| SD-R | $18,043 | $19,474 | $20,311 | $22,014 | $23,138 |
| TWS | $20,991 | $22,115 | $22,283 | $23,632 | $24,265 |
| JCP | $16,671 | $17,217 | $17,292 | $19,262 | $19,231 |
| EAS-only | $21,308 | $22,547 | $23,050 | $24,483 | $26,046 |
| Median wages - female | $38,471 | $39,264 | $40,451 | $40,321 | $40,150 |
| Low-income measure (after-tax) | $21,344 | $21,921 | $22,015 | $22,080 | $22,382 |
- Notes Low income measures (LIM) after tax are set at 50% of adjusted median household income, for an individual person
- EAS-only does not have an extended program period. One-year post start period is outside of the program period
- Sources Employment and Social Development Canada. Labour Market Program Data Platform
- Statistics Canada. Table 11-10-0232-01 Low income measure (LIM) thresholds by income source and household size
- Statistics Canada. Table 18-10-0005-01 Consumer Price Index, annual average, not seasonally adjusted
- Statistics Canada. Table 14-10-0340-01 Employee wages by occupation, annual
| LMDAs | Program start year (January 1, 2012 to March 31, 2013) | 1 year after start year / EAS 1 Yr post (January 1, 2013 to March 31, 2014) |
|---|---|---|
| SD-R | $10,627 | $12,377 |
| TWS | $15,005 | $18,931 |
| JCP | $10,184 | $16,158 |
| EAS-only | $15,946 | $19,036 |
| Median wages - female | $40,853 | $41,117 |
| Low-income measure (after-tax) | $22,793 | $22,906 |
- Notes Low income measures (LIM) after tax are set at 50% of adjusted median household income, for an individual person
- EAS-only does not have an extended program period. One-year post start period is outside of the program period
- Sources Employment and Social Development Canada. Labour Market Program Data Platform
- Statistics Canada. Table 11-10-0232-01 Low income measure (LIM) thresholds by income source and household size
- Statistics Canada. Table 18-10-0005-01 Consumer Price Index, annual average, not seasonally adjusted
- Statistics Canada. Table 14-10-0340-01 Employee wages by occupation, annual
| LMDAs | 1 Yr Post / EAS 2 Yr post (January 1, 2014 to March 31, 2015) | 2 Yrs Post / EAS 3 Yr post (January 1, 2015 to March 31, 2016) | 3 Yrs Post / EAS 4 Yr post (January 1, 2016 to March 31, 2017) |
|---|---|---|---|
| SD-R | $20,048 | $23,134 | $24,042 |
| TWS | $20,800 | $21,498 | $21,547 |
| JCP | $20,011 | $20,202 | $20,669 |
| EAS-only | $21,270 | $21,863 | $22,055 |
| Median wages - female | $41,684 | $41,406 | $41,842 |
| Low-income measure (after-tax) | $23,270 | $23,550 | $23,619 |
- Notes Low income measures (LIM) after tax are set at 50% of adjusted median household income, for an individual person
- EAS-only does not have an extended program period. One-year post start period is outside of the program period
- Sources Employment and Social Development Canada. Labour Market Program Data Platform
- Statistics Canada. Table 11-10-0232-01 Low income measure (LIM) thresholds by income source and household size
- Statistics Canada. Table 18-10-0005-01 Consumer Price Index, annual average, not seasonally adjusted
- Statistics Canada. Table 14-10-0340-01 Employee wages by occupation, annual
General outcomes for racialized Canadians
Racial discrimination in the hiring and employment process has been well studied and documented over the years. Ng and Gagnon (2020) report that conscious and unconscious biases by employers' results in a lower likelihood of visible minorities getting job interviews, and a higher likelihood of being underemployed in lower wage jobs, that lack responsibilities, and under utilize their skill sets.Footnote 50 "Barriers to employment and advancement continue to adversely affect Canada's racialized populations. Full economic participation by racialized Canadians continues to lag behind that of their non‑racialized counterparts. Racialized minorities and immigrants experience greater unemployment and underemployment, with racialized and immigrant women especially affected."Footnote 51 Research indicates that a greater proportion of visible minorities are participating in the labour market than their counterparts, yet they experience higher unemployment.Footnote 52 This study also finds that visible minorities are less likely to be in management positions, and earn less than their non-racialized counterparts. Ng and Gagnon found that "immigrants are overrepresented in lower-paying sectors and occupations [with] an especially negative impact on immigrants who are racialized."Footnote 53 It is necessary to note that not all racialized Canadians are immigrants, and not all immigrants are visible minorities. However, racialized Canadians are frequently stereotyped as immigrants and marginalized in the labour market.
A study by Philip Orepoulos (2011), sent thousands of resumes to employers in Toronto and Montreal, and found that "employers discriminate substantially by name."Footnote 54 It was found that "resumes with English sounding names are 39% more likely to receive callbacks." Footnote 55 In follow-ups, employers used language barriers as the basis of their hiring decisions, however, none of the employers called the candidates to verify their language abilities.Footnote 56 Betrand and Mullainathan (2003) reported similar results in the U.S. where the same resumes with Anglicized names had 50% more call-backs for interviews than African‑American names. They also found that better quality resumes, with improved skills and credentials, had less effect for African-American names.Footnote 57 Discrimination existed in all occupations and industries, including Federal contractors and "Equal Opportunity Employers".Footnote 58
Participants in EBSMs identified as visible minorities made up 3.8% of the cohort who started programs between 2012 to 2013. The majority of people of colour in EBSMs were male, and previously held NOC level C jobs. This trend follows the larger cohort who are not visible minorities where most were males with NOC level C occupations. An exception is observed for non-visible minority participants in the JCP, who were predominantly female with NOC level D jobs. It is necessary to note that visible minorities and immigrants are not interchangeable; not all people who are visible minorities are immigrants, and not all immigrants are visible minorities. The majority of visible minorities who participated in interventions are not new immigrants to Canada. Visible minorities who are also new immigrants made up 10.9% of SD-R, and 20.3% in JCP. Apart from the EAS-only group, the program with the highest proportion of participation for both cohorts is SD-R.
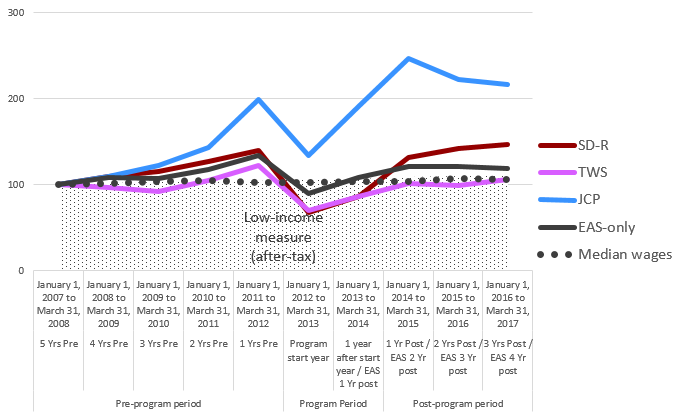
Text description of chart 54
| Pre-program period | Program Period | Post-program period | ||||||||
|---|---|---|---|---|---|---|---|---|---|---|
| 5 Yrs Pre | 4 Yrs Pre | 3 Yrs Pre | 2 Yrs Pre | 1 Yrs Pre | Program start year | 1 year after start year / EAS 1 Yr post | 1 Yr Post / EAS 2 Yr post | 2 Yrs Post / EAS 3 Yr post | 3 Yrs Post / EAS 4 Yr post | |
| January 1, 2007 to March 31, 2008 | January 1, 2008 to March 31, 2009 | January 1, 2009 to March 31, 2010 | January 1, 2010 to March 31, 2011 | January 1, 2011 to March 31, 2012 | January 1, 2012 to March 31, 2013 | January 1, 2013 to March 31, 2014 | January 1, 2014 to March 31, 2015 | January 1, 2015 to March 31, 2016 | January 1, 2016 to March 31, 2017 | |
| SD-R | 100 | 109 | 116 | 127 | 140 | 68 | 87 | 131 | 142 | 147 |
| TWS | 100 | 97 | 93 | 105 | 122 | 70 | 87 | 102 | 99 | 106 |
| JCP | 100 | 110 | 122 | 143 | 199 | 135 | 191 | 247 | 223 | 216 |
| EAS-only | 100 | 108 | 108 | 118 | 134 | 90 | 109 | 121 | 121 | 119 |
| Median wages | 100 | 102 | 104 | 105 | 103 | 103 | 105 | 104 | 107 | 106 |
| Low-income (after-tax) | 100 | 103 | 103 | 103 | 105 | 107 | 107 | 109 | 110 | 111 |
- Notes Low income measures (LIM) after tax are set at 50% of adjusted median household income, for an individual person
- EAS-only does not have an extended program period. One-year post start period is outside of the program period
- Sources Employment and Social Development Canada. Labour Market Program Data Platform
- Statistics Canada. Table 11-10-0232-01 Low income measure (LIM) thresholds by income source and household size
- Statistics Canada. Table 18-10-0005-01 Consumer Price Index, annual average, not seasonally adjusted
- Statistics Canada. Table 14-10-0340-01 Employee wages by occupation, annual
LMDA participation had positive effects for people of colour (Chart 54). Total average income for people of colour over the ten‑year period, was 3.1% higher than those who were not visible minorities, after participating in EBSMs. Before interventions, people of colour had lower incomes (-1.1%) than their counterparts, $22,573 for visible minorities compared to $22,819 for non-visible minorities (Tables 26 & 27). After participation, income for visible minorities was 8.3% higher than for non-visible minorities, $27,353 to $25,257. This trend was fueled by participants in JCP, with an indexed growth rate of 116% over 10 years, whose income rose from $14,494 (FY0708) to $31,343 (FY1617).
Over 10 years, indexed income for visible minorities who participated in JCP interventions grew at twice the rate of national median wages and low-income. Average income for visible minorities who participated in JCP interventions increased 146.5%, from 5 years before job loss ($14,494), to their first year post-participation ($35,732), and surpassed their highest income before job loss by 23.6%, $28,898 to $35,732 (Table 26). For the 3 years after intervention, income remained above the highest level of income before job loss. JCP participants who are persons of colour closed the wage gap with national median wages by 35.6 percentage points, from 65.8% 5 years before job loss to 30.2% 3 years after program participation. Before intervention, participants tended to earn income below the low-income threshold, up until the year before job loss (Chart 56).
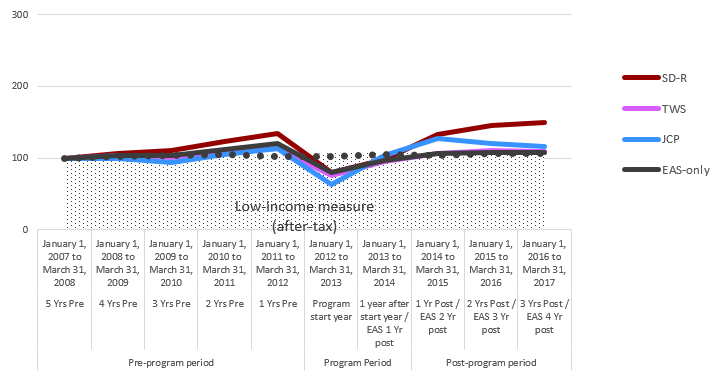
Text description of chart 55
| Pre-program period | Program Period | Post-program period | ||||||||
|---|---|---|---|---|---|---|---|---|---|---|
| 5 Yrs Pre | 4 Yrs Pre | 3 Yrs Pre | 2 Yrs Pre | 1 Yrs Pre | Program start year | 1 year after start year / EAS 1 Yr post | 1 Yr Post / EAS 2 Yr post | 2 Yrs Post / EAS 3 Yr post | 3 Yrs Post / EAS 4 Yr post | |
| January 1, 2007 to March 31, 2008 | January 1, 2008 to March 31, 2009 | January 1, 2009 to March 31, 2010 | January 1, 2010 to March 31, 2011 | January 1, 2011 to March 31, 2012 | January 1, 2012 to March 31, 2013 | January 1, 2013 to March 31, 2014 | January 1, 2014 to March 31, 2015 | January 1, 2015 to March 31, 2016 | January 1, 2016 to March 31, 2017 | |
| SD-R | 100 | 107 | 111 | 123 | 134 | 80 | 99 | 134 | 145 | 150 |
| TWS | 100 | 104 | 102 | 109 | 113 | 76 | 96 | 106 | 110 | 109 |
| JCP | 100 | 100 | 94 | 105 | 113 | 64 | 103 | 127 | 121 | 117 |
| EAS-only | 100 | 104 | 104 | 112 | 121 | 81 | 97 | 107 | 108 | 108 |
| Median wages | 100 | 102 | 104 | 105 | 103 | 103 | 105 | 104 | 107 | 106 |
| Low-income (after-tax) | 100 | 103 | 103 | 103 | 105 | 107 | 107 | 109 | 110 | 111 |
- Notes Low income measures (LIM) after tax are set at 50% of adjusted median household income, for an individual person
- EAS-only does not have an extended program period. One-year post start period is outside of the program period
- Sources Employment and Social Development Canada. Labour Market Program Data Platform
- Statistics Canada. Table 11-10-0232-01 Low income measure (LIM) thresholds by income source and household size
- Statistics Canada. Table 18-10-0005-01 Consumer Price Index, annual average, not seasonally adjusted
- Statistics Canada. Table 14-10-0340-01 Employee wages by occupation, annual
Participants surpassed the low-income threshold during the program period, and income continued to rise above poverty throughout the post-program period. The gap with low-income widened by 64.8 percentage points over 10 years, from 32.1% below the low income threshold 5 years before intervention, to 32.7% above low-income 3 years after participation.
The indexed growth rate for income for JCP participants who are not visible minorities increased 17% over 10 years ((Chart 54). This grew faster than national median wages (6%) and low-income (11%). Unlike outcomes for participants who were visible minorities, average income for this cohort remained below the low-income threshold during the ten-year period. However, income after intervention surpassed previous highest levels by 12.3% from $20,265, the highest income level before job loss to $22,748, 1 year after program participation (Chart 56). The gap with national median wages narrowed 4.4 percentage points, from 57.8% in FY0708 to 53.4% in FY1617. Average income slowly closed the gap with low-income by 4.8 percentage points over 10 years, from 16.2% below low‑income to 11.4% below low‑income.
JCP participants are mostly younger workers in both visible and non-visible minority groups (25 to 34 years). Visible minority participants are mostly male with NOC level C occupations (examples include general office support workers, banking, insurance and financial clerks, or dispatchers). The group that are not visible minorities are mostly female with NOC level D occupations (such as cashiers, food counter attendants, or other support occupations).
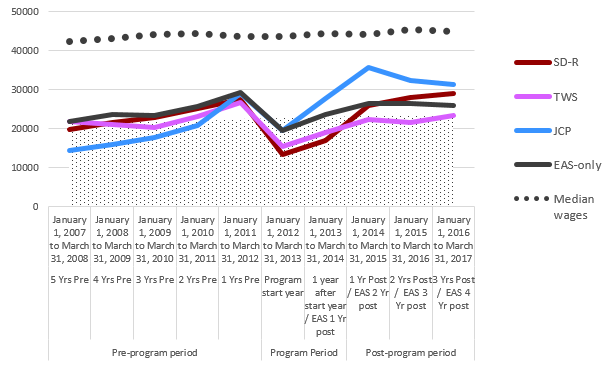
Text description of chart 56
| Pre-program period | Program Period | Post-program period | ||||||||
|---|---|---|---|---|---|---|---|---|---|---|
| 5 Yrs Pre | 4 Yrs Pre | 3 Yrs Pre | 2 Yrs Pre | 1 Yrs Pre | Program start year | 1 year after start year / EAS 1 Yr post | 1 Yr Post / EAS 2 Yr post | 2 Yrs Post / EAS 3 Yr post | 3 Yrs Post / EAS 4 Yr post | |
| January 1, 2007 to March 31, 2008 | January 1, 2008 to March 31, 2009 | January 1, 2009 to March 31, 2010 | January 1, 2010 to March 31, 2011 | January 1, 2011 to March 31, 2012 | January 1, 2012 to March 31, 2013 | January 1, 2013 to March 31, 2014 | January 1, 2014 to March 31, 2015 | January 1, 2015 to March 31, 2016 | January 1, 2016 to March 31, 2017 | |
| SD-R | 19,686 | 21,520 | 22,841 | 25,045 | 27,593 | 13,368 | 17,074 | 25,848 | 28,002 | 28,988 |
| TWS | 21,914 | 21,165 | 20,300 | 23,104 | 26,791 | 15,287 | 19,057 | 22,375 | 21,650 | 23,327 |
| JCP | 14,494 | 15,944 | 17,719 | 20,722 | 28,898 | 19,500 | 27,682 | 35,732 | 32,318 | 31,343 |
| EAS-only | 21,763 | 23,576 | 23,406 | 25,788 | 29,193 | 19,515 | 23,636 | 26,378 | 26,342 | 25,937 |
| Median wages | 42,369 | 43,172 | 44,097 | 44,444 | 43,575 | 43,585 | 44,278 | 44,181 | 45,318 | 44,920 |
| Low-income measure (after-tax) | 21,344 | 21,921 | 22,015 | 22,080 | 22,382 | 22,793 | 22,906 | 23,270 | 23,550 | 23,619 |
- Notes Low income measures (LIM) after tax are set at 50% of adjusted median household income, for an individual person
- EAS-only does not have an extended program period. One-year post start period is outside of the program period
- Sources Employment and Social Development Canada. Labour Market Program Data Platform
- Statistics Canada. Table 11-10-0232-01 Low income measure (LIM) thresholds by income source and household size
- Statistics Canada. Table 18-10-0005-01 Consumer Price Index, annual average, not seasonally adjusted
- Statistics Canada. Table 14-10-0340-01 Employee wages by occupation, annual
The indexed income growth rate for SD-R participants was strong for both cohorts. The growth rate over 10 years for income for visible minorities was 47% (Chart 54), while the growth rate for their counterparts was 50% (Chart 55). Average income for visible minorities, after SD-R intervention surpassed their highest pre-program levels by 1.5%, two-years after interventions, from $27,593 to $28,002, and continues growing to $28,988 (3 years post), surpassing previous pre-program income by 5.1% (Table 26). This follows a similar trend for those who are not visible minorities, where post-participation income reached the same level as highest previous income one-year after participation, and surpassed highest income levels in year-2 by 8.6%, from $27,401 to $29,751 (Table 27). Income continued their upward trajectory in year-3, reaching $30,786.
Income for visible minorities who participated in SD-R closed the gap with national median wages by 18.1percentagepoints, from 53.5% in FY0708 to 35.5% in FY1617 (Chart 56). The gap with low-income widened by 30.5percentagepoints over 10 years, from -7.8% in FY0708 to +22.7% in FY1617. The wage gap also narrowed for non‑visible minorities by 20.2 percentage points, from 51.7% in FY0708 to 31.5% in FY1617, and the low-income gap widened by 34.4 percentage points, from -4.1% in FY0708 to +30.3% in FY1617 (Chart 57).
Visible minorities who participated in SD-R were mostly males aged 35 to 44 with NOC level C occupations. Non-visible minorities in SD-R were also mostly males with NOC level C occupations, but were younger workers aged 25 to 34.
While incomes for TWS participants remained at, or below, low‑income, income for visible minorities grew at a slower rate and remained further below low-income, than their counterparts who are not visible minorities. Indexed income for visible minorities who participated in TWS remained below low-income and national median wages. Indexed income grew 6%, compared to 11% for low‑income and 6% for national median wages (Chart 54). While overall income increased by 6.4% in 10 years, from $21,914 in FY0708 to $23,327 in FY1617, they did not return to previous income levels. The highest income after intervention was 12.9% below previous levels, from $26,791 in FY1112 to $23,327 in FY1617 (Table 26). The wage gap remained relatively unchanged over 10 years, with a 0.2 percentage point difference from 48.3% (FY0708) to 48.1% (FY1617). Visible minorities fell further into poverty, the low‑income gap narrowed by 3.9 percentage points, from 2.7% above low‑income 5 years before job loss to 1.2% below low‑income 3 years after program participation.
Indexed income for TWS participants who are non-visible minorities also grew below low‑income (9% to 11%), but growth was higher than national median wages (6%) (Chart 55). Income the first year after participation left low‑income (+3.3%), and remained higher than the low‑income threshold for the 3 years post-participation. Over the ten‑year period, income grew 8.8%, from $22,603 (FY0708) to $24,584 (FY1617) (Table 27). Post-participation income fell 2.4% from previous levels, from $25,553 (FY1112) to $24,934 (FY1617). The wage gap with national median wages narrowed by 1.4 percentage points, from 46.7% in FY0708 to 45.3% in FY1617 (Chart 57). While income remained above the low‑income threshold, they edged closer to poverty over 10 years (1.8 percentage points). TWS participants in both cohorts were predominantly males who lost their jobs in mid-career (ages 45 to 54). Both groups were predominantly from NOC level C occupations.
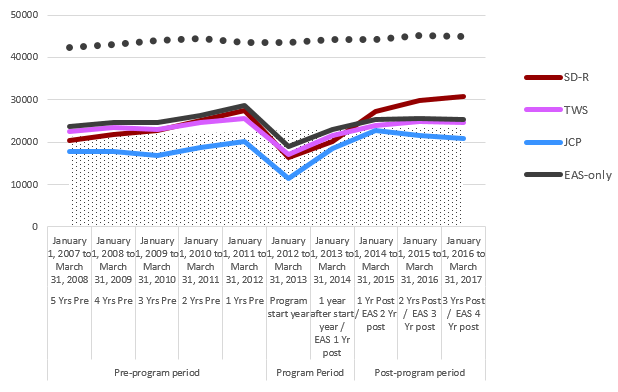
Text description of chart 57
| Pre-program period | Program Period | Post-program period | ||||||||
|---|---|---|---|---|---|---|---|---|---|---|
| 5 Yrs Pre | 4 Yrs Pre | 3 Yrs Pre | 2 Yrs Pre | 1 Yrs Pre | Program start year | 1 year after start year / EAS 1 Yr post | 1 Yr Post / EAS 2 Yr post | 2 Yrs Post / EAS 3 Yr post | 3 Yrs Post / EAS 4 Yr post | |
| January 1, 2007 to March 31, 2008 | January 1, 2008 to March 31, 2009 | January 1, 2009 to March 31, 2010 | January 1, 2010 to March 31, 2011 | January 1, 2011 to March 31, 2012 | January 1, 2012 to March 31, 2013 | January 1, 2013 to March 31, 2014 | January 1, 2014 to March 31, 2015 | January 1, 2015 to March 31, 2016 | January 1, 2016 to March 31, 2017 | |
| SD-R | 20,472 | 21,889 | 22,750 | 25,127 | 27,401 | 16,307 | 20,216 | 27,378 | 29,751 | 30,786 |
| TWS | 22,603 | 23,558 | 22,972 | 24,619 | 25,553 | 17,149 | 21,666 | 24,035 | 24,934 | 24,584 |
| JCP | 17,890 | 17,856 | 16,889 | 18,763 | 20,265 | 11,405 | 18,445 | 22,748 | 21,677 | 20,930 |
| EAS-only | 23,608 | 24,636 | 24,593 | 26,342 | 28,597 | 19,050 | 22,928 | 25,311 | 25,536 | 25,412 |
| Median wages | 42,369 | 43,172 | 44,097 | 44,444 | 43,575 | 43,585 | 44,278 | 44,181 | 45,318 | 44,920 |
| Low-income measure(after-tax) | 21,344 | 21,921 | 22,015 | 22,080 | 22,382 | 22,793 | 22,906 | 23,270 | 23,550 | 23,619 |
- Notes Low income measures (LIM) after tax are set at 50% of adjusted median household income, for an individual person
- EAS-only does not have an extended program period. One-year post start period is outside of the program period
- Sources Employment and Social Development Canada. Labour Market Program Data Platform
- Statistics Canada. Table 11-10-0232-01 Low income measure (LIM) thresholds by income source and household size
- Statistics Canada. Table 18-10-0005-01 Consumer Price Index, annual average, not seasonally adjusted
- Statistics Canada. Table 14-10-0340-01 Employee wages by occupation, annual
EAS is a gateway for claimants to enter interventions, with no direct supports to handle structural impediments. It illustrates the return to work for claimants who mostly managed their own transitions. Neither cohort returned to their highest level of income pre-job loss. The highest income for visible minorities after job loss was 9.6% below previous levels ($29,193 in FY1112 to $26,378 in FY1415) (Table26). Indexed incomes for visible minorities who only received EAS grew slightly faster (19%) than low‑income (11%) and national median wages (6%) (Chart 54). The wage gap with national median wages narrowed by 6.4 percentage points, from 48.6% (FY 0708) to 42.3% (FY 1617). Overall income for visible minorities moved further away from the low‑income threshold over the 10 year period by 7.8 percentage points, from 2.0% above low‑income (FY0708) to 9.8% above low‑income (FY1617) (Chart 56).
Indexed income for non-visible minorities who only received EAS grew at a similar rate (8%) to low‑income (11%) and national median wages (6%) over 10 years (Chart 55). This cohort did not return to their highest income level before job loss, income fell 10.7% below previous levels ($28,597FY1112 to $25,536FY1516). The wage gap with national median wages was small, widening 0.9 percentage points from 44.3% (FY0708) to 43.4% (FY1617) (Chart 57). While this group mostly remained above the low‑income threshold, they edged closer to poverty by 3.0 percentage points over 10 years (from +10.6% in FY0708 to +7.6% in FY1617). Both cohorts who had EAS-only interventions were predominantly males with NOC level C occupations who lost their jobs in mid-to-late career (ages 45 to 54).
Both TWS and EAS-only groups were made up of workers who lost their jobs mid-to-late career, from jobs that required lower skills and lower levels of education. The decline in income for both groups, 1 from an active employment benefit and 1 who only received gateway EAS treatment may signal structural barriers in their return to work. According to the National Seniors Council "the 2008 recession showed how older workers with low levels of educational attainment are more vulnerable to shifts in the business cycle. … Older workers with low literacy, low levels of education, or limited technical or computer skills may be at a disadvantage in their quest to transition from labour‑intensive to desk‑type work."Footnote 59 Similarly, Fournier, et al. (2018) found that workers who lose their jobs at age 45 or older face multiple barriers. These include skills mismatches, low education and discrimination in the form of ageism.Footnote 60 "When older workers return to the job market, the jobs they find are often synonymous with both precariousness and occupational downgrading, and are marked by a considerable decrease in revenue."Footnote 61 In addition, the cohort of mid-to-late career workers who are visible minorities returning to the labour market face an added level of discrimination based on race or ethnicity.Footnote 62
Table 27: Income for active claimants in Employment Benefits and Support Measures, January 1, 2012 to March 31, 2013, with median wages and low-income measures, 15 years and older, visible minorities, Canada, 2018 constant dollars
For accessibility reasons, the table has been simplified. Consult the PDF version for the full table.
| LMDAs | 5 Yrs Pre (January 1, 2007 to March 31, 2008) | 4 Yrs Pre (January 1, 2008 to March 31, 2009) | 3 Yrs Pre (January 1, 2009 to March 31, 2010) | 2 Yrs Pre (January 1, 2010 to March 31, 2011) | 1 Yrs Pre (January 1, 2011 to March 31, 2012) |
|---|---|---|---|---|---|
| SD-R | $19,686 | $21,520 | $22,841 | $25,045 | $27,593 |
| TWS | $21,914 | $21,165 | $20,300 | $23,104 | $26,791 |
| JCP | $14,494 | $15,944 | $17,719 | $20,722 | $28,898 |
| EAS-only | $21,763 | $23,576 | $23,406 | $25,788 | $29,193 |
| Median wages | $42,369 | $43,172 | $44,097 | $44,444 | $43,575 |
| Low-income measure (after-tax) | $21,344 | $21,921 | $22,015 | $22,080 | $22,382 |
- Notes Low income measures (LIM) after tax are set at 50% of adjusted median household income, for an individual person
- EAS-only does not have an extended program period. One-year post start period is outside of the program period
- Sources Employment and Social Development Canada. Labour Market Program Data Platform
- Statistics Canada. Table 11-10-0232-01 Low income measure (LIM) thresholds by income source and household size
- Statistics Canada. Table 18-10-0005-01 Consumer Price Index, annual average, not seasonally adjusted
- Statistics Canada. Table 14-10-0340-01 Employee wages by occupation, annual
| LMDAs | Program start year (January 1, 2012 to March 31, 2013) | 1 year after start year / EAS 1 Yr post (January 1, 2013 to March 31, 2014) |
|---|---|---|
| SD-R | $13,368 | $17,074 |
| TWS | $15,287 | $19,057 |
| JCP | $19,500 | $27,682 |
| EAS-only | $19,515 | $23,636 |
| Median wages | $43,585 | $44,278 |
| Low-income measure (after-tax) | $22,793 | $22,906 |
- Notes Low income measures (LIM) after tax are set at 50% of adjusted median household income, for an individual person
- EAS-only does not have an extended program period. One-year post start period is outside of the program period
- Sources Employment and Social Development Canada. Labour Market Program Data Platform
- Statistics Canada. Table 11-10-0232-01 Low income measure (LIM) thresholds by income source and household size
- Statistics Canada. Table 18-10-0005-01 Consumer Price Index, annual average, not seasonally adjusted
- Statistics Canada. Table 14-10-0340-01 Employee wages by occupation, annual
| LMDAs | 1 Yr Post / EAS 2 Yr post (January 1, 2014 to March 31, 2015) | 2 Yrs Post / EAS 3 Yr post (January 1, 2015 to March 31, 2016) | 3 Yrs Post / EAS 4 Yr post (January 1, 2016 to March 31, 2017) |
|---|---|---|---|
| SD-R | $25,848 | $28,002 | $28,988 |
| TWS | $22,375 | $21,650 | $23,327 |
| JCP | $35,732 | $32,318 | $31,343 |
| EAS-only | $26,378 | $26,342 | $25,937 |
| Median wages | $44,181 | $45,318 | $44,920 |
| Low-income measure (after-tax) | $23,270 | $23,550 | $23,619 |
- Notes Low income measures (LIM) after tax are set at 50% of adjusted median household income, for an individual person
- EAS-only does not have an extended program period. One-year post start period is outside of the program period
- Sources Employment and Social Development Canada. Labour Market Program Data Platform
- Statistics Canada. Table 11-10-0232-01 Low income measure (LIM) thresholds by income source and household size
- Statistics Canada. Table 18-10-0005-01 Consumer Price Index, annual average, not seasonally adjusted
- Statistics Canada. Table 14-10-0340-01 Employee wages by occupation, annual
Table 28: Income for active claimants in Employment Benefits and Support Measures, January 1, 2012 to March 31, 2013, with median wages and low-income measures, 15 years and older, visible minorities, Canada, 2018 constant dollars
For accessibility reasons, the table has been simplified. Consult the PDF version for the full table.
| LMDAs | 5 Yrs Pre (January 1, 2007 to March 31, 2008) | 4 Yrs Pre (January 1, 2008 to March 31, 2009) | 3 Yrs Pre (January 1, 2009 to March 31, 2010) | 2 Yrs Pre (January 1, 2010 to March 31, 2011) | 1 Yrs Pre (January 1, 2011 to March 31, 2012) |
|---|---|---|---|---|---|
| SD-R | $20,472 | $21,889 | $22,750 | $25,127 | $27,401 |
| TWS | $22,603 | $23,558 | $22,972 | $24,619 | $25,553 |
| JCP | $17,890 | $17,856 | $16,889 | $18,763 | $20,265 |
| EAS-only | $23,608 | $24,636 | $24,593 | $26,342 | $28,597 |
| Median wages | $42,369 | $43,172 | $44,097 | $44,444 | $43,575 |
| Low-income measure (after-tax) | $21,344 | $21,921 | $22,015 | $22,080 | $22,382 |
- Notes Low income measures (LIM) after tax are set at 50% of adjusted median household income, for an individual person
- EAS-only does not have an extended program period. One-year post start period is outside of the program period
- Sources Employment and Social Development Canada. Labour Market Program Data Platform
- Statistics Canada. Table 11-10-0232-01 Low income measure (LIM) thresholds by income source and household size
- Statistics Canada. Table 18-10-0005-01 Consumer Price Index, annual average, not seasonally adjusted
- Statistics Canada. Table 14-10-0340-01 Employee wages by occupation, annual
| LMDAs | Program start year (January 1, 2012 to March 31, 2013) | 1 year after start year / EAS 1 Yr post (January 1, 2013 to March 31, 2014) |
|---|---|---|
| SD-R | $16,307 | $20,216 |
| TWS | $17,149 | $21,666 |
| JCP | $11,405 | $18,445 |
| EAS-only | $19,050 | $22,928 |
| Median wages | $43,585 | $44,278 |
| Low-income measure (after-tax) | $22,793 | $22,906 |
- Notes Low income measures (LIM) after tax are set at 50% of adjusted median household income, for an individual person
- EAS-only does not have an extended program period. One-year post start period is outside of the program period
- Sources Employment and Social Development Canada. Labour Market Program Data Platform
- Statistics Canada. Table 11-10-0232-01 Low income measure (LIM) thresholds by income source and household size
- Statistics Canada. Table 18-10-0005-01 Consumer Price Index, annual average, not seasonally adjusted
- Statistics Canada. Table 14-10-0340-01 Employee wages by occupation, annual
| LMDAs | 1 Yr Post / EAS 2 Yr post (January 1, 2014 to March 31, 2015) | 2 Yrs Post / EAS 3 Yr post (January 1, 2015 to March 31, 2016) | 3 Yrs Post / EAS 4 Yr post (January 1, 2016 to March 31, 2017) |
|---|---|---|---|
| SD-R | $27,378 | $29,751 | $30,786 |
| TWS | $24,035 | $24,934 | $24,584 |
| JCP | $22,748 | $21,677 | $20,930 |
| EAS-only | $25,311 | $25,536 | $25,412 |
| Median wages | $44,181 | $45,318 | $44,920 |
| Low-income measure (after-tax) | $23,270 | $23,550 | $23,619 |
- Notes Low income measures (LIM) after tax are set at 50% of adjusted median household income, for an individual person
- EAS-only does not have an extended program period. One-year post start period is outside of the program period
- Sources Employment and Social Development Canada. Labour Market Program Data Platform
- Statistics Canada. Table 11-10-0232-01 Low income measure (LIM) thresholds by income source and household size
- Statistics Canada. Table 18-10-0005-01 Consumer Price Index, annual average, not seasonally adjusted
- Statistics Canada. Table 14-10-0340-01 Employee wages by occupation, annual
General outcomes for the Indigenous people of Canada
Labour market outcomes for Indigenous people of Canada are affected by more than a century of historical injustices.Footnote 63 These inequalities are too wide-ranging to be fully covered in this report. This analysis can only account for the general outcomes of Indigenous peoples who participated in LMDA programming. Further study is required to start to develop a better understanding of these imbalances and steps to take towards inclusivity and reconciliation.
According to the OECD, "Indigenous and non-Indigenous Canadians do not share the same labour market outcomes."Footnote 64 "In the past decade, Indigenous groups have almost always experienced worse outcomes within participation rates, employment rates and unemployment rates than their non‑Indigenous counterparts."Footnote 65 The Indigenous people of Canada who "participate in the labour force have consistently experienced disparities in wages and income."Footnote 66
According to Ryerson University and the Canadian Council of Aboriginal Business, some systematic barriers affecting labour market outcomes include chronic underfunding of education, lack of infrastructure such as reliable internet, inter‑generational poverty, and the residual effects of the residential school system. They report that a large proportion of Indigenous youth and adults do not finish high school, or "graduate without requisite essential literacy and numeracy skills."Footnote 67 It is stated that Indigenous workers also face discrimination with employment and hiring barriers,Footnote 68 workplace harassment and bullying,Footnote 69 and lack of culturally appropriate training and wrap-around supports.Footnote 70 The literature suggests that labour market programs for Indigenous peoples need to involve community partnership and be culturally sensitive.
Overall, 4.0% of active claimants who participated in EBSMs self-declared their status as Indigenous peoples. The majority of participants were young, male workers aged 25 to 34 years. The average income from January 1, 2007 to March 31, 2017, for Indigenous participants was 10.6% lower than their non‑Indigenous counterparts ($20,406 to $22,821). Additionally, First Nations, Inuit and Métis participants had a wider range of skills and education levels than the non-Indigenous Canadian group, with some claimants coming from NOC level B occupations.
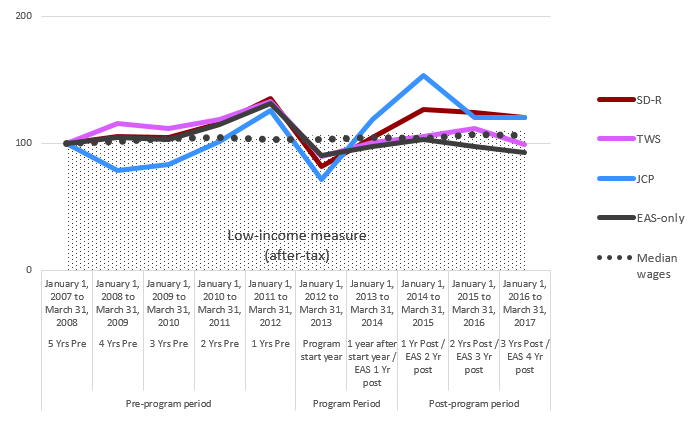
Text description of chart 58
| Pre-program period | Program Period | Post-program period | ||||||||
|---|---|---|---|---|---|---|---|---|---|---|
| 5 Yrs Pre | 4 Yrs Pre | 3 Yrs Pre | 2 Yrs Pre | 1 Yrs Pre | Program start year | 1 year after start year / EAS 1 Yr post | 1 Yr Post / EAS 2 Yr post | 2 Yrs Post / EAS 3 Yr post | 3 Yrs Post / EAS 4 Yr post | |
| January 1, 2007 to March 31, 2008 | January 1, 2008 to March 31, 2009 | January 1, 2009 to March 31, 2010 | January 1, 2010 to March 31, 2011 | January 1, 2011 to March 31, 2012 | January 1, 2012 to March 31, 2013 | January 1, 2013 to March 31, 2014 | January 1, 2014 to March 31, 2015 | January 1, 2015 to March 31, 2016 | January 1, 2016 to March 31, 2017 | |
| SD-R | 100 | 105 | 105 | 116 | 135 | 82 | 105 | 126 | 124 | 121 |
| TWS | 100 | 115 | 111 | 119 | 133 | 90 | 101 | 105 | 112 | 99 |
| JCP | 100 | 79 | 83 | 101 | 126 | 72 | 119 | 153 | 120 | 121 |
| EAS-only | 100 | 105 | 103 | 115 | 132 | 90 | 98 | 103 | 98 | 93 |
| Median wages | 100 | 102 | 104 | 105 | 103 | 103 | 105 | 104 | 107 | 106 |
| Low-income measure (after-tax) | 100 | 103 | 103 | 103 | 105 | 107 | 107 | 109 | 110 | 111 |
- Notes Low income measures (LIM) after tax are set at 50% of adjusted median household income, for an individual person
- EAS-only does not have an extended program period. One-year post start period is outside of the program period
- Sources Employment and Social Development Canada. Labour Market Program Data Platform
- Statistics Canada. Table 11-10-0232-01 Low income measure (LIM) thresholds by income source and household size
- Statistics Canada. Table 18-10-0005-01 Consumer Price Index, annual average, not seasonally adjusted
- Statistics Canada. Table 14-10-0340-01 Employee wages by occupation, annual
The program with the strongest and most sustainable income trajectory for Indigenous peoples was SD‑R. Those who participated in SD-R programs increased indexed income by 21% from 2007 to 2017 (Chart 58). Indexed income grew faster than national median wages (6%) and low‑income (11%). After job loss, income for Indigenous peoples did not recover their highest previous wage levels, income dropped 6.5% from $26,484 (FY1112) to $24,764 (FY1415), 1 year after participation (Table 28). Post‑program income slowly declined 4.5% for the 3 years after programs, from $24,764 (FY1415) to $23,639 (FY1617). Income after program participation remained above low-income throughout the 3‑year period. Over 10 years, income left low‑income by 8.3 percentage points, from -8.2% (FY0708) to +0.1% (FY1617) (Chart 60). Participants' income closed the wage gap with national median wages by 6.4 percentage points, from 53.8%, 5 years before job loss, to 47.4%,3 years after program participation.
In contrast, income for non-Indigenous Canadians who participated in SD-R reached their highest pre-program income level in the year after participation, and continued to rise 12.9%, from $27,438 (FY1112) to $30,971 (FY1617), in the third year after participation (Table 29). The indexed income for this cohort grew faster (51%) than low-income (11%) and national median wages (6%) (Chart 59). The wage gap for non-Indigenous Canadian participants closed 20.6 percentage points, from 51.7% five‑years before job loss, to 31.1% 3‑years after participation (Chart 61). Income moved away from low-income by 35.2 percentage points, from -4.1% (FY0708) to 31.1% (FY1617). While both groups share similar profiles, their outcomes were quite different. Both groups were predominantly made up of young males aged 25 to 34 years, from NOC skill level C jobs.
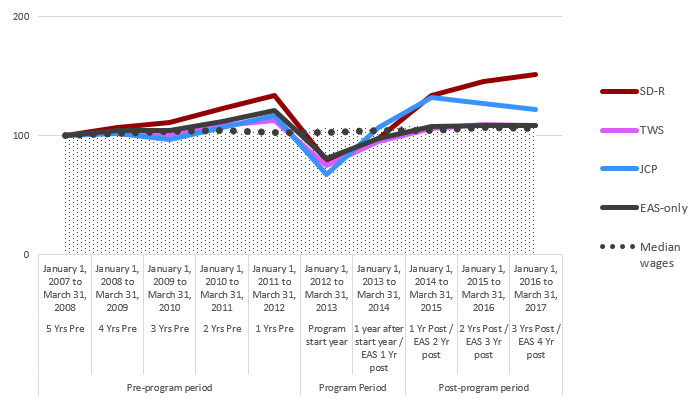
Text description of chart 59
| Pre-program period | Program Period | Post-program period | ||||||||
|---|---|---|---|---|---|---|---|---|---|---|
| 5 Yrs Pre | 4 Yrs Pre | 3 Yrs Pre | 2 Yrs Pre | 1 Yrs Pre | Program start year | 1 year after start year / EAS 1 Yr post | 1 Yr Post / EAS 2 Yr post | 2 Yrs Post / EAS 3 Yr post | 3 Yrs Post / EAS 4 Yr post | |
| January 1, 2007 to March 31, 2008 | January 1, 2008 to March 31, 2009 | January 1, 2009 to March 31, 2010 | January 1, 2010 to March 31, 2011 | January 1, 2011 to March 31, 2012 | January 1, 2012 to March 31, 2013 | January 1, 2013 to March 31, 2014 | January 1, 2014 to March 31, 2015 | January 1, 2015 to March 31, 2016 | January 1, 2016 to March 31, 2017 | |
| SD-R | 100 | 107 | 111 | 123 | 134 | 79 | 98 | 134 | 146 | 151 |
| TWS | 100 | 104 | 101 | 109 | 113 | 75 | 95 | 106 | 110 | 109 |
| JCP | 100 | 102 | 97 | 107 | 117 | 67 | 107 | 132 | 127 | 122 |
| EAS-only | 100 | 105 | 104 | 112 | 121 | 81 | 98 | 108 | 109 | 109 |
| Median wages | 100 | 102 | 104 | 105 | 103 | 103 | 105 | 104 | 107 | 106 |
| Low-income measure (after-tax) | 100 | 103 | 103 | 103 | 105 | 107 | 107 | 109 | 110 | 111 |
- Notes Low income measures (LIM) after tax are set at 50% of adjusted median household income, for an individual person
- EAS-only does not have an extended program period. One-year post start period is outside of the program period
- Sources Employment and Social Development Canada. Labour Market Program Data Platform
- Statistics Canada. Table 11-10-0232-01 Low income measure (LIM) thresholds by income source and household size
- Statistics Canada. Table 18-10-0005-01 Consumer Price Index, annual average, not seasonally adjusted
- Statistics Canada. Table 14-10-0340-01 Employee wages by occupation, annual
While income for Indigenous participants in JCP also had strong overall growth, it was more volatile, most likely due to fewer participants (1.0% of Indigenous participants took part in JCP programs). Indexed income from FY0708 to FY1617, increased by 21% (Chart 58). Income grew faster than national median wages (6%) and low-income (11%). These results need to be investigated further in future reports. Income after program participation had a sharp rise in the year after program participation, but fell in the second year, however, it started to rise slightly in the third year. While this group experienced low‑income throughout the ten-year period, income rose and slowly closed the gap with national median wages by 5.9 percentage points, from 57.5% in FY 0708 to 51.6% in FY1617 (Chart 60). The rising income started to move out of poverty by 7.7 percentage points, from ‑15.6% (FY0708) below the low‑income threshold to -7.9%(FY1617).
This followed a similar income trend for non-Indigenous participants, where indexed income grew 22% over the ten-year period (Chart 59). Indexed income for non-Indigenous JCP participants grew faster than median wages (6%) and low-income (11%). In the year after intervention, income for this group surpassed the highest level of income prior to job loss by 12.7%, from $20,724 (FY1112) to $23,362 (FY1415), but fell in the second and third year post-program (Table 29). Over 10 years, income for non-Indigenous JCP participants narrowed the gap with median wages by 6.5 percentage points, from 58.4% (FY0708) to 51.9% (FY1617). Like their counterparts, income for this group was in low‑income throughout the ten-year period, but started to edge out of low‑income by 8.8 percentage points, from ‑17.3% (FY0708) to -8.5% (FY1617) (Chart 61).
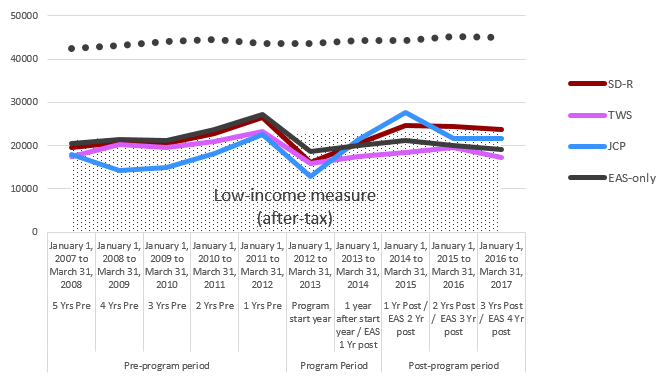
Text description of chart 60
| Pre-program period | Program Period | Post-program period | ||||||||
|---|---|---|---|---|---|---|---|---|---|---|
| 5 Yrs Pre | 4 Yrs Pre | 3 Yrs Pre | 2 Yrs Pre | 1 Yrs Pre | Program start year | 1 year after start year / EAS 1 Yr post | 1 Yr Post / EAS 2 Yr post | 2 Yrs Post / EAS 3 Yr post | 3 Yrs Post / EAS 4 Yr post | |
| January 1, 2007 to March 31, 2008 | January 1, 2008 to March 31, 2009 | January 1, 2009 to March 31, 2010 | January 1, 2010 to March 31, 2011 | January 1, 2011 to March 31, 2012 | January 1, 2012 to March 31, 2013 | January 1, 2013 to March 31, 2014 | January 1, 2014 to March 31, 2015 | January 1, 2015 to March 31, 2016 | January 1, 2016 to March 31, 2017 | |
| SD-R | 19,587 | 20,631 | 20,507 | 22,750 | 26,484 | 16,115 | 20,496 | 24,764 | 24,376 | 23,639 |
| TWS | 17,516 | 20,208 | 19,523 | 20,875 | 23,375 | 15,788 | 17,608 | 18,479 | 19,550 | 17,372 |
| JCP | 18,018 | 14,246 | 15,026 | 18,242 | 22,645 | 12,973 | 21,415 | 27,612 | 21,658 | 21,749 |
| EAS-only | 20,572 | 21,511 | 21,258 | 23,638 | 27,110 | 18,611 | 20,066 | 21,150 | 20,057 | 19,042 |
| Median wages | 42,369 | 43,172 | 44,097 | 44,444 | 43,575 | 43,585 | 44,278 | 44,181 | 45,318 | 44,920 |
| Low-income measure (after-tax) | 21,344 | 21,921 | 22,015 | 22,080 | 22,382 | 22,793 | 22,906 | 23,270 | 23,550 | 23,619 |
- Notes Low income measures (LIM) after tax are set at 50% of adjusted median household income, for an individual person
- EAS-only does not have an extended program period. One-year post start period is outside of the program period
- Sources Employment and Social Development Canada. Labour Market Program Data Platform
- Statistics Canada. Table 11-10-0232-01 Low income measure (LIM) thresholds by income source and household size
- Statistics Canada. Table 18-10-0005-01 Consumer Price Index, annual average, not seasonally adjusted
- Statistics Canada. Table 14-10-0340-01 Employee wages by occupation, annual
Both cohorts had NOC skill level D occupations. These are low skilled jobs that do not require high school graduation. The majority of Indigenous peoples who participated in JCP were aged 25 to 44 years and predominantly male. In comparison, the majority of non-Indigenous Canadian participants were aged 25 to 34, and predominantly female.
Indexed income for Indigenous people of Canada who participated in TWS declined by 1% over the ten‑year period. Indexed income grew at a slower rate than median income and low‑income. Income for this group remained mostly below the low‑income threshold throughout the ten‑year period. Income after program participation did not regain the highest level of income prior to job loss, but fell 16.4% from $23,375 (FY1112) to $19,550 (FY1516) (Table 28). From five-years before job loss, to 3‑years after program participation, the wage gap widened by 2.7 percentage points, from 58.7% (FY0708) to 61.3% (FY1617). Income for this group fell 8.5% further into low‑income, from -17.9% (FY0708) to ‑26.4% (FY1617) (Chart 60). In general, the wages were lower for this group, and more impacted by job loss.
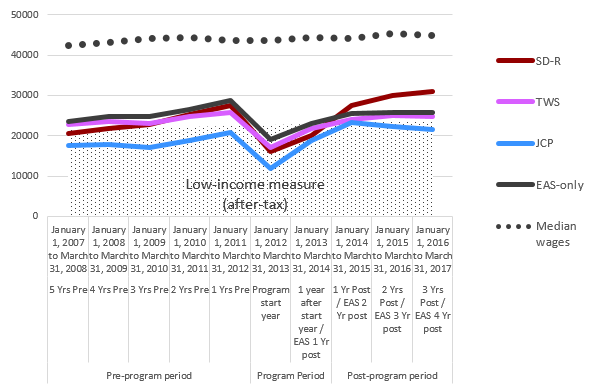
Text description of chart 61
| Pre-program period | Program Period | Post-program period | ||||||||
|---|---|---|---|---|---|---|---|---|---|---|
| 5 Yrs Pre | 4 Yrs Pre | 3 Yrs Pre | 2 Yrs Pre | 1 Yrs Pre | Program start year | 1 year after start year / EAS 1 Yr post | 1 Yr Post / EAS 2 Yr post | 2 Yrs Post / EAS 3 Yr post | 3 Yrs Post / EAS 4 Yr post | |
| January 1, 2007 to March 31, 2008 | January 1, 2008 to March 31, 2009 | January 1, 2009 to March 31, 2010 | January 1, 2010 to March 31, 2011 | January 1, 2011 to March 31, 2012 | January 1, 2012 to March 31, 2013 | January 1, 2013 to March 31, 2014 | January 1, 2014 to March 31, 2015 | January 1, 2015 to March 31, 2016 | January 1, 2016 to March 31, 2017 | |
| SD-R | 20,477 | 21,921 | 22,829 | 25,206 | 27,438 | 16,220 | 20,107 | 27,418 | 29,879 | 30,971 |
| TWS | 22,742 | 23,583 | 22,990 | 24,686 | 25,666 | 17,129 | 21,706 | 24,155 | 24,993 | 24,771 |
| JCP | 17,646 | 17,939 | 17,059 | 18,930 | 20,724 | 11,876 | 18,912 | 23,362 | 22,420 | 21,607 |
| EAS-only | 23,666 | 24,732 | 24,693 | 26,440 | 28,689 | 19,089 | 23,086 | 25,544 | 25,817 | 25,721 |
| Median wages | 42,369 | 43,172 | 44,097 | 44,444 | 43,575 | 43,585 | 44,278 | 44,181 | 45,318 | 44,920 |
| Low-income measure (after-tax) | 21,344 | 21,921 | 22,015 | 22,080 | 22,382 | 22,793 | 22,906 | 23,270 | 23,550 | 23,619 |
- Notes Low income measures (LIM) after tax are set at 50% of adjusted median household income, for an individual person
- EAS-only does not have an extended program period. One-year post start period is outside of the program period
- Sources Employment and Social Development Canada. Labour Market Program Data Platform
- Statistics Canada. Table 11-10-0232-01 Low income measure (LIM) thresholds by income source and household size
- Statistics Canada. Table 18-10-0005-01 Consumer Price Index, annual average, not seasonally adjusted
- Statistics Canada. Table 14-10-0340-01 Employee wages by occupation, annual
In contrast, indexed income for non-Indigenous Canadians who participated in TWS increased by 9% over 10 years (Chart 59). While it grew faster than median wages (6%), its growth was slower than low-income (11%). Like their counterparts, income for this group did not regain their highest level prior to job loss (-2.6%). However, income for this group remained relatively steady after interventions and mostly remained above the low-income threshold over 10 years (Chart 61). Income for non-Indigenous Canadians who participated in TWS narrowed the wage gap with national median wages by 1.5 percentage points, from 46.3% (FY0708) to 44.9% (FY1617). While income hovered above the low-income threshold for 10 years, it grew at a slower pace and edged 1.7 percentage points closer to the poverty line over 10 years, from 6.6% (FY0708) above low‑income to 4.9% (FY1617).
The majority of TWS participants from both groups were males aged 45 to 54. These were workers who lost their jobs mid-career. The skills profiles of these 2 groups varied. Participants from Indigenous groups had NOC skill level B occupations, while their counterparts had NOC skill level C occupations. NOC level B jobs are more technically skilled and require a college diploma, apprenticeship or specialized training. NOC level C jobs are intermediate jobs that require high school education or training specific to the job. Further analysis is required to understand the barriers for transitions back to work for this cohort.
Overall, participants who received only EAS, light-touch interventions, did not recover their previous earning levels after job loss. However, the impact was greater for participants who are Indigenous peoples, whose income not only fell below the poverty line after program participation, but continued to drop each year post-program. Indexed income for Indigenous participants who only received EAS fell 7% over 10 years, with the downward trend starting at job loss. Income grew at a slower pace than median wages and low‑income. Income after participation was 22.0% lower than the highest level prior to job loss, from $27,110 (FY1112) to $21,150 (FY1415) (Table 28). The wage gap moved 6.2percentage points further away from national median wages, from 51.4% (FY0708) to 57.6% (FY1617). Poverty increased for this group by 15.8 percentage points, from income -3.6% (FY0708) below the low‑income threshold, to -19.4% (FY1617).
Indexed income for claimants who are non-Indigenous Canadians who only received EAS increased 9% over 10 years (Chart 59). It grew faster than median wages, but slower than low‑income. Income after job loss was 10.0% lower than the highest previous income level ($28,689 in FY1112 to $25,817 in FY1516) (Table 29). Over 10 years, the wage gap with national median wages narrowed by 1.4 percentage points, from 44.1% (FY0708) to 42.7% (FY1617). Income remained mostly above the low‑income threshold for this period, but fell closer to the low‑income threshold by 2.0 percentage points, from 10.9% above low income in FY0708, to 8.9% above the low‑income threshold in FY1617 (Chart 61).
The majority of EAS recipients were male workers who had NOC skill level C occupations. Indigenous EAS recipients were primarily young workers aged 25 to 34. The majority of non-Indigenous Canadians who were EAS recipients were mid-career workers aged 45 to 54 years.
The barriers for Indigenous peoples in the labour market are systemic, multifaceted and complex. The transition back to work, and the effects of EBSM program participation, requires deeper analysis in a future study.
Table 29: Income for active claimants in Employment Benefits and Support Measures, January 1, 2012 to March 31, 2013, with median wages and low-income measures, 15 years and older, Indigenous peoples of Canada, Canada, 2018 constant dollars
For accessibility reasons, the table has been simplified. Consult the PDF version for the full table.
| LMDAs | 5 years Pre (January 1, 2007 to March 31, 2008) | 4 years Pre (January 1, 2008 to March 31, 2009) | 3 years Pre (January 1, 2009 to March 31, 2010) | 2 years Pre (January 1, 2010 to March 31, 2011) | 1 years Pre (January 1, 2011 to March 31, 2012) |
|---|---|---|---|---|---|
| SD-R | $19,587 | $20,631 | $20,507 | $22,750 | $26,484 |
| TWS | $17,516 | $20,208 | $19,523 | $20,875 | $23,375 |
| JCP | $18,018 | $14,246 | $15,026 | $18,242 | $22,645 |
| EAS-only | $20,572 | $21,511 | $21,258 | $23,638 | $27,110 |
| Median wages | $42,369 | $43,172 | $44,097 | $44,444 | $43,575 |
| Low-income measure (after-tax) | $21,344 | $21,921 | $22,015 | $22,080 | $22,382 |
- Notes Low income measures (LIM) after tax are set at 50% of adjusted median household income, for an individual person
- EAS-only does not have an extended program period. One-year post start period is outside of the program period
- Sources Employment and Social Development Canada. Labour Market Program Data Platform
- Statistics Canada. Table 11-10-0232-01 Low income measure (LIM) thresholds by income source and household size
- Statistics Canada. Table 18-10-0005-01 Consumer Price Index, annual average, not seasonally adjusted
- Statistics Canada. Table 14-10-0340-01 Employee wages by occupation, annual
| LMDAs | Program start year (January 1, 2012 to March 31, 2013) | 1 year after start year / EAS 1 year post (January 1, 2013 to March 31, 2014) |
|---|---|---|
| SD-R | $16,115 | $20,496 |
| TWS | $15,788 | $17,608 |
| JCP | $12,973 | $21,415 |
| EAS-only | $18,611 | $20,066 |
| Median wages | $43,585 | $44,278 |
| Low-income measure (after-tax) | $22,793 | $22,906 |
- Notes Low income measures (LIM) after tax are set at 50% of adjusted median household income, for an individual person
- EAS-only does not have an extended program period. One-year post start period is outside of the program period
- Sources Employment and Social Development Canada. Labour Market Program Data Platform
- Statistics Canada. Table 11-10-0232-01 Low income measure (LIM) thresholds by income source and household size
- Statistics Canada. Table 18-10-0005-01 Consumer Price Index, annual average, not seasonally adjusted
- Statistics Canada. Table 14-10-0340-01 Employee wages by occupation, annual
| LMDAs | 1 year Post / EAS 2 year post (January 1, 2014 to March 31, 2015) | 2 years Post / EAS 3 year post (January 1, 2015 to March 31, 2016) | 3 years Post / EAS 4 year post (January 1, 2016 to March 31, 2017) |
|---|---|---|---|
| SD-R | $24,764 | $24,376 | $23,639 |
| TWS | $18,479 | $19,550 | $17,372 |
| JCP | $27,612 | $21,658 | $21,749 |
| EAS-only | $21,150 | $20,057 | $19,042 |
| Median wages | $44,181 | $45,318 | $44,920 |
| Low-income measure (after-tax) | $23,270 | $23,550 | $23,619 |
- Notes Low income measures (LIM) after tax are set at 50% of adjusted median household income, for an individual person
- EAS-only does not have an extended program period. One-year post start period is outside of the program period
- Sources Employment and Social Development Canada. Labour Market Program Data Platform
- Statistics Canada. Table 11-10-0232-01 Low income measure (LIM) thresholds by income source and household size
- Statistics Canada. Table 18-10-0005-01 Consumer Price Index, annual average, not seasonally adjusted
- Statistics Canada. Table 14-10-0340-01 Employee wages by occupation, annual
Table 30: Income for active claimants in Employment Benefits and Support Measures, January 1, 2012 to March 31, 2013, with median wages and low-income measures, 15 years and older, non-Indigenous people, Canada, 2018 constant dollars
For accessibility reasons, the table has been simplified. Consult the PDF version for the full table.
| LMDAs | 5 years Pre (January 1, 2007 to March 31, 2008) | 4 years Pre (January 1, 2008 to March 31, 2009) | 3 years Pre (January 1, 2009 to March 31, 2010) | 2 years Pre (January 1, 2010 to March 31, 2011) | 1 years Pre (January 1, 2011 to March 31, 2012) |
|---|---|---|---|---|---|
| SD-R | $20,477 | $21,921 | $22,829 | $25,206 | $27,438 |
| TWS | $22,742 | $23,583 | $22,990 | $24,686 | $25,666 |
| JCP | $17,646 | $17,939 | $17,059 | $18,930 | $20,724 |
| EAS-only | $23,666 | $24,732 | $24,693 | $26,440 | $28,689 |
| Median wages | $42,369 | $43,172 | $44,097 | $44,444 | $43,575 |
| Low-income measure (after-tax) | $21,344 | $21,921 | $22,015 | $22,080 | $22,382 |
- Notes Low income measures (LIM) after tax are set at 50% of adjusted median household income, for an individual person
- EAS-only does not have an extended program period. One-year post start period is outside of the program period
- Sources Employment and Social Development Canada. Labour Market Program Data Platform
- Statistics Canada. Table 11-10-0232-01 Low income measure (LIM) thresholds by income source and household size
- Statistics Canada. Table 18-10-0005-01 Consumer Price Index, annual average, not seasonally adjusted
- Statistics Canada. Table 14-10-0340-01 Employee wages by occupation, annual
| LMDAs | Program start year (January 1, 2012 to March 31, 2013) | 1 year after start year / EAS 1 year post (January 1, 2013 to March 31, 2014) |
|---|---|---|
| SD-R | $16,220 | $20,107 |
| TWS | $17,129 | $21,706 |
| JCP | $11,876 | $18,912 |
| EAS-only | $19,089 | $23,086 |
| Median wages | $43,585 | $44,278 |
| Low-income measure (after-tax) | $22,793 | $22,906 |
- Notes Low income measures (LIM) after tax are set at 50% of adjusted median household income, for an individual person
- EAS-only does not have an extended program period. One-year post start period is outside of the program period
- Sources Employment and Social Development Canada. Labour Market Program Data Platform
- Statistics Canada. Table 11-10-0232-01 Low income measure (LIM) thresholds by income source and household size
- Statistics Canada. Table 18-10-0005-01 Consumer Price Index, annual average, not seasonally adjusted
- Statistics Canada. Table 14-10-0340-01 Employee wages by occupation, annual
| LMDAs | 1 year Post / EAS 2 year post (January 1, 2014 to March 31, 2015) | 2 years Post / EAS 3 year post (January 1, 2015 to March 31, 2016) | 3 years Post / EAS 4 year post (January 1, 2016 to March 31, 2017) |
|---|---|---|---|
| SD-R | $27,418 | $29,879 | $30,971 |
| TWS | $24,155 | $24,993 | $24,771 |
| JCP | $23,362 | $22,420 | $21,607 |
| EAS-only | $25,544 | $25,817 | $25,721 |
| Median wages | $44,181 | $45,318 | $44,920 |
| Low-income measure (after-tax) | $23,270 | $23,550 | $23,619 |
- Notes Low income measures (LIM) after tax are set at 50% of adjusted median household income, for an individual person
- EAS-only does not have an extended program period. One-year post start period is outside of the program period
- Sources Employment and Social Development Canada. Labour Market Program Data Platform
- Statistics Canada. Table 11-10-0232-01 Low income measure (LIM) thresholds by income source and household size
- Statistics Canada. Table 18-10-0005-01 Consumer Price Index, annual average, not seasonally adjusted
- Statistics Canada. Table 14-10-0340-01 Employee wages by occupation, annual
Conclusion
Participation in EBSMs may help participants return to work, leave poverty and increase income. This positive outcome is driven primarily by males who are not members of an equity group. The observation changes when participants are disaggregated by sex, visible minority status, or Indigenous peoples status. While it may be difficult for all workers who have lost their jobs to transition back to work, members of equity groups may face additional hurdles such as lower income, discrimination, and structural barriers that affect that their outcomes.Footnote 71, Footnote 72, Footnote 73
Academic studies have documented how females have more disadvantages than males when searching for new jobs.Footnote 74 Females tend to be employed in less productive jobs, in less productive sectors.Footnote 75 There is a greater chance of females doing part‑time or temporary work with little chance for advancement.Footnote 76 Females often shoulder the responsibility of family caregiving for elders and children.Footnote 77 Lack of safe and reliable transportation, and discrimination, may also factors that hinder female economic security.Footnote 78 The outcomes show that many female cohorts who participated in EBSMs lost their jobs mid-career (ages 45 to 54 years). They face additional vulnerabilities such as ageism, skills mismatch, low education and poor health, which can lead them to precarious jobs and "occupational downgrades".Footnote 79
Racialized Canadians face discrimination in the hiring and employment process and earn lower income than their counterparts who are not visible minorities.Footnote 80 Stereotyping results in many visible minorities being underemployed, working in lower wage jobs that under utilize their skill sets, and are marginalized in the labour market.Footnote 81 Discriminatory hiring processes have been well documented over the years in studies that send resumes to employers with randomized names (ethnic and non-ethnic).Footnote 82,Footnote 83 While greater proportions of visible minorities participate in the labour force than their counterparts who are not visible minorities, they have higher unemployment, which means more are looking for work.Footnote 84
Labour market outcomes for Indigenous peoples are affected by over a century of historical injustices,Footnote 85 which are too complex and wide-ranging to be fully addressed in this report. The Indigenous people of Canada have always experienced worse participation rates, employment rates, and lower income than their non-Indigenous counterparts.Footnote 86 This is the result of systematic barriers, such as chronically underfunded education, lack of infrastructure such as internet, inter‑generational poverty, and the residual effects of residential schools.Footnote 87 Indigenous workers also face discriminatory hiring and employment barriers,Footnote 88 workplace harassment and bullying,Footnote 89 and a lack of culturally appropriate training and wrap‑around supports.Footnote 90
Ng and Gagnon state that "while much of the focus of bridging programs has been on 'fixing' the … job seeker, mounting evidence suggests that more work is needed to modernize employment practices to address systematic bias and the continued reliance on exclusionary informal networks and processes."Footnote 91 There needs to be "greater focus on the impact of bias, discrimination and systematic barriers in the employment system rather than focussing solely on how job seekers can be better 'adjusted' for the labour market."Footnote 92
References
Bergman, S. (2019, August 22). One in 8 employers 'reluctant' to hire women who might have children. Retrieved January 12, 2021, from https://www.independent.co.uk/life-style/women-work-children-gender-pay-gap-a9074506.html
Bertrand, M., & Mullainathan, S. (2003, July 28). Are Emily and Greg more employable than Lakisha and JAMAL? A field experiment on labor Market Discrimination. Retrieved February 18, 2021, from https://www.nber.org/papers/w9873
Canadian Human Rights Commission. (2020, June 18). Significant employment barriers remain for indigenous people in banking and financial sector. Retrieved February 18, 2021, from https://www.chrc-ccdp.gc.ca/eng/content/significant-employment-barriers-remain-indigenous-people-banking-and-financial-sector
Charron, M. (2019, March 6). Première Nation, Autochtone ou Indigène? Il n'y a pas de réponse parfaite. NATIONAL. Retrieved March 8, 2021, from https://www.national.ca/fr/perspectives/detail/premiere-nation-autochtone-indigene-pas-reponse-parfaite/
The Conference Board of Canada. (2019, March 28). Collaboration key to addressing Indigenous employment challenges in Canada's North. Retrieved January 18, 2021, from https://www.conferenceboard.ca/press/newsrelease/2019/03/28/collaboration-key-to-addressing-indigenous-employment-challenges-in-canada-s-north
Datta, N. (2018, March 8). The invisible door: three barriers limiting women's access to work. Retrieved January 12, 2021, from https://blogs.worldbank.org/jobs/invisible-door-three-barriers-limiting-women-s-access-work
Desjardins, D., & Freestone, C. (2020, November 20). Canadian Women Continue to Exit the Labour Force - RBC Economics. Retrieved January 13, 2021, from https://thoughtleadership.rbc.com/canadian-women-continue-to-exit-the-labour-force/
Ferrant, G., & Thim, A. (2019, February). Measuring Women's Economic Empowerment: Time Use Data and Gender Inequality. Retrieved January 12, 2021, from https://www.oecd.org/dev/development-gender/MEASURING-WOMENS-ECONOMIC-EMPOWERMENT-Gender-Policy-Paper-No-16.pdf. OECD Development Policy Papers No. 16
First Nations and Indigenous Studies, & University of British Columbia. (2009). Terminology. Retrieved February 15, 2021, from https://indigenousfoundations.arts.ubc.ca/terminology/
Fournier, G., Zimmermann, H., Masdonati, J., & Gauthier, C. (2018, June 29). Job loss in a group of Older Canadian Workers: Challenges in the Sustainable labour MARKET Reintegration Process. Retrieved January 18, 2021, from https://www.mdpi.com/2071-1050/10/7/2245
Fuller, S. (2017, December 08). Segregation across workplaces and the motherhood wage gap: Why do mothers work in low-wage establishments? Retrieved February 23, 2021, from https://academic.oup.com/sf/article-abstract/96/4/1443/4710319 (Pages 1443–1476)
Government of Canada. (2020, September 14). Find your NOC. Retrieved January 18, 2021, from https://www.canada.ca/en/immigration-refugees-citizenship/services/immigrate-canada/express-entry/eligibility/find-national-occupation-code.html
Government of New Brunswick (2009). Calculating Your Wage Gap. Retrieved from: http://www.gnb.ca/0012/womens-issues/wg-es/tools/pdf/wg_calc-e.pdf
Harding, A. (2014, November 2). What is the difference between an impact and an outcome? Impact is the longer term effect of an outcome. Impact of Social Sciences. https://blogs.lse.ac.uk/impactofsocialsciences/2014/10/27/impact-vs-outcome-harding/
Joseph, B. (2016, July 20.). Indigenous peoples terminology guidelines for usage. Retrieved January 18, 2021, from https://www.ictinc.ca/blog/indigenous-peoples-terminology-guidelines-for-usage
Leana, C. R., & Feldman, D. C. (1991). Gender differences in responses to unemployment. Journal of Vocational Behavior, 38(1), 65-77. doi: 10.1016/0001-8791(91)90018-h
Low-skilled workers. (n.d.). Retrieved January 18, 2021, from https://www.srdc.org/populations-we-work-with/low-skilled-workers.aspx
Milan, A., & Ouellet-Léveillé, B. (2019, July 25). Results from the 2016 Census: Occupations with older workers. Retrieved January 18, 2021, from https://www150.statcan.gc.ca/n1/pub/75-006-x/2019001/article/00011-eng.htm
National Seniors Council, Canada. (2016, July 20). Older Workers at Risk of Withdrawing from the Labour Force or Becoming Unemployed: Employers' views on how to retain and attract older workers. Retrieved January 18, 2021, from https://www.canada.ca/en/national-seniors-council/programs/publications-reports/2013/older-workers-risk/page05.html
Ng, E., & Gagnon, S. (2020, February 25). More research needed to break down job barriers for racialized Canadians (Policy Options Politique, Ed.). Retrieved February 18, 2021, from https://policyoptions.irpp.org/magazines/january-2020/more-research-needed-to-break-down-job-barriers-for-racialized-canadians/
OECD (2018), Indigenous Employment and Skills Strategies in Canada, OECD Reviews on Local Job Creation, OECD Publishing, Paris. http://dx.doi.org/10.1787/9789264300477-en
OECD (n.d.). WORK FORCE AGEING: CONSEQUENCES AND POLICY RESPONSES WORKING PAPER AWP 4.1. Retrieved January 18, 2021, from https://www.oecd.org/els/public-pensions/2429096.pdf
Oreopoulos, P. (2011, November). Why do skilled immigrants struggle in the labour market? A field experiment with thirteen thousand resumes (1201640556 896839288 American Economic Journal: Economic Policy, Ed.). Retrieved February 17, 2021, from https://www.aeaweb.org/articles?id=10.1257/pol.3.4.148
Organisational gender pay gaps: Measurement and analysis guidelines: Stats nz. (n.d.). Retrieved January 18, 2021, from https://www.stats.govt.nz/methods/organisational-gender-pay-gaps-measurement-and-analysis-guidelines
Public Service Commission of Canada. (2016, September 15). Employment Equity. Retrieved January 18, 2021, from https://www.canada.ca/en/public-service-commission/jobs/services/gc-jobs/employment-equity.html
Ryerson Today, Ryerson University. (2020, July 23). Indigenous skills training and employment face systemic barriers. Retrieved January 18, 2021, from http://www.ryerson.ca/news-events/news/2020/07/indigenous-skills-training-and-employment-face-systemic-barriers/
Statistics Canada, Government of Canada (2018, April 18). Low Income Lines: What they are and how they are created. Retrieved January 18, 2021, from https://www150.statcan.gc.ca/n1/pub/75f0002m/75f0002m2016002-eng.htm
Statistics Canada, Government of Canada (2020, January 20). Visible minority of person. Retrieved January 27, 2021, from https://www23.statcan.gc.ca/imdb/p3Var.pl?Function=DEC&Id=45152
Treasury Board Secretariat (2017, December 18). Government of Canada. Retrieved January 15, 2021, from https://www.canada.ca/en/treasury-board-secretariat/services/innovation/equitable-compensation/fact-sheet-compensation-women-men-public-service.html
Truth and Reconciliation Commission of Canada (2015). Honouring the truth, reconciling for the future: summary of the final report of the Truth and Reconciliation Commission of Canada. 2015. ISBN 978-0-660-02078-5. www.trc.ca
Workplace Gender Equality Agency, Australian Government. (2020, August 17). Australia's gender pay Gap Statistics 2020. Retrieved January 18, 2021, from https://www.wgea.gov.au/publications/australias-gender-pay-gap-statistics
3.4 Pan-Canadian Activities and the National Employment Service
In this section:
- 3.4.1 Context
- 3.4.2 Indigenous programming
- 3.4.3 Enhancing investments in workplace skills and labour market information
- 3.4.4 Supporting agreements with provinces, territories and Indigenous organizations
This section analyzes pan-Canadian activities that ESDC supports and delivers EI Part II funds.
3.4.1 Context
The Government of Canada plays a leadership role in EI Part II by establishing objectives with provinces and territories through the LMDAs that develop active labour market policies and programming, and ensure accountability and evaluation of LMDA-funded activities. In addition, the federal government plays a primary role in responding to challenges that extend beyond local and regional labour markets by delivering pan-Canadian activities.
Pan-Canadian activities fulfill 3 primary objectives:
- promoting an efficient and integrated national labour market and preserving and enhancing the Canadian economic union
- helping address common labour market challenges and priorities of international or national scope that transcend provincial and territorial borders, and
- promoting equality of opportunity for all Canadians with a focus on helping underrepresented groups reach their full potential in the Canadian labour market
Pan-Canadian funding is focussed on 3 streams of investment:
- Indigenous Programming
- Enhancing Investments in Workplace Skills and Labour Market Information, and
- Supporting Agreements with Provinces, Territories and Indigenous Organizations
In FY1920, expenditures on pan-Canadian activities totalled $147.3 million, compared to $130.9 million in FY1819. Pan-Canadian programming delivered through the Indigenous Skills and Employment Training Strategy (ISET) were $121.1 million of the total, followed by expenditures on Labour Market Partnerships ($23.5 million) and Research and Innovation ($2.7 million). The overall Pan-Canadian expenditures increase was mainly due to additional funding under ISET discussed below.
3.4.2 Indigenous programmingFootnote 93
Pan-Canadian funding delivered through the Indigenous Skills and Employment Training (ISET) program is intended to increase the skills of Indigenous peoples and support their participation in the Canadian labour market, ensuring that First Nations, Inuit, Métis and Urban/Non-affiliated Indigenous peoples have access to skills training and employment supports to meet their long-term career goals.
Pan-Canadian programming in action: Rupertsland Institute
Rupertsland Institute enhances Métis participation in the economy by assisting individuals to prepare for, find and keep employment. Rupertsland Institute creates labour market programs to meet the needs of industry and Métis clients through employment assistance services and relevant labour market partnerships include an extensive array of 146 partners, extending from government to the not-for-profit sector.
Rupertsland Institute delivers labour market programming through 11 Métis Employment Service points of service across Alberta. ISET provides basic support and services to self-identifying Métis people residing in Alberta. Labour market priorities are within the green economy, health industry, construction, oil and gas, accommodation and food services.
Through the Métis Training to Employment Program, Rupertland Institute works under the mandate to:Footnote 94
- assist Métis individuals to prepare for, find and keep employment, thereby resulting in client self-sufficiency and savings to income support programs
- ensure that Métis women, Métis youth and Métis persons with disabilities access a fair share of resources as they prepare for, find and keep employment
- create labour market programs that are designed to meet the needs of the Métis community and industry and that are accountable to the Métis Nation and its funding partners
- create and make available a distinct network of Métis employment services comparable to mainstream services and to locate these services as close as possible to the Métis client community, and
- stimulate, mobilize and encourage industry and other community agencies to act in partnership on labour market related issues and/or activities designed to increase Métis participation in the economy
In FY1920, Rupertsland Institute served a total of 1,349 clients. Of these, 835 obtained a job, including 344 EI clients, and 279 returned to school.
*As per the Indigenous Labour Market Programs website on July 14, 2020.
ISET was introduced in April 2019 as the successor to the Aboriginal Skills and Employment Training Strategy (ASETS). The program's objective is to help reduce the skills and employment gaps between Indigenous peoples and non-Indigenous. Co-developed with Indigenous partners, the ISET program includes 4 distinct labour market strategies with separate funding envelopes for each group: First Nations, Inuit, Métis and Urban/Non-affiliated Indigenous peoples. It provides new investments and longer term, more flexible agreements to Indigenous service delivery organizations. With Indigenous partners, the Government is advancing reconciliation by creating more job training opportunities for Indigenous people.
The ISET program offers activities that support a holistic approach to service delivery. The eligible activities encompass a wide range of labour market activities including locally designed programs in support of each distinctions-based labour market strategy. Indigenous service delivery organizations may provide: employment-related and career development assistance; wrap-around supports, such as living expenses; financial assistance to support individuals in obtaining skills for employment; tuition costs; business coaching and mentorship; and disability-related supports.
ISET funding totalled $365.1 million in FY1920, including $121.07 million from EI Part II funds. Budget 2018 announced the creation of ISET to replace the ASETS, which increased the EI funding available by nearly $135 million over 5 years, beginning in FY1819. As of October 2019, all 112 ISET contribution agreements have been signed. ISET funds a network ofover 100Indigenous contribution recipients with over 650points of service across Canada.
In FY1920, ISET served 41,600 clients, including 21,842 EI clients. Out of the total number of clients, 15,284 found a job, including 7,493 EI clients, and 3,753 clients returned to school.
3.4.3 Enhancing investments in workplace skills and labour market information
These investments help Canadians ensure the labour market functions as an integrated national system by:
- removing barriers and impediments to labour mobility
- building capacity among workplace partners to improve skills development as a key factor in increasing productivity
- leveraging investment in, and ownership of, skills issues, especially in addressing skills and labour shortages, as well as
- supporting efforts to ensure Canada's learning system responds to employers' skills requirements
Sectoral Initiatives Program (SIP)
The Program supports sectors and employers to address current and future skills shortages by funding the development and distribution of sector-specific labour market intelligence, national occupational standards, and skills certification and accreditation systems. The Program also supports innovative workforce development approaches.
SIP's key stakeholders are primarily partnership-based organizations engaged in skills and workforce development in their respective economic sectors or employment groups across Canada. These include: employer consortia and Sector Councils, workplace organizations, industry associations, unions, education and training bodies, professional associations, and Indigenous organizations.
In FY1920, SIP was supporting 34 active projects in 18 different economic sectors. Projects funded by the Program produced:
- 141 labour market intelligence reports and 7 forecasting systems
- 14 national occupational standards (NOS)
- 15 certification systems
- 2 accreditation programs
- 13 curricula or training programs, and
- 3 pilot project reports
The 34 multi-year agreements SIP funded in FY1920 were for projects implemented by various stakeholders representing different industry sectors. Resulting products included: labour market information and/or forecasting systems; NOS; certification and accreditation; and creative labour market solutions producing curricula or training programs and labour market solution pilot project reports. Among them, several projects were cross-sectoral, whereas most projects focused on the following targeted sectors: construction, environment, tourism, mining, transportation, oil and gas, manufacturing, agriculture, aerospace and information technology sectors.
SIP advanced its priorities by:
- developing sectoral expertise and building intelligence c sectors experiencing labour market tightness
- supporting a project that developed a rapid, demand-driven upskilling training program designed to move skilled but often underutilized workers from disrupted sectors into more stable, high growth sectors
- supporting a complementary pilot project to test more impactful implementation of LMI, occupational standards and workforce development tools. The project focused particularly on developing forward-looking LMI to identify the skills, occupations, sectors and locations that would be well suited for worker transition initiatives
- engaging extensively with other government departments on initiatives of shared interest. For example, SIP worked closely with Health Canada to launch a project to train Personal Support Worker interns for long-term and home care facilities. SIP meets regularly with Innovation, Science and Economic Development officials to ensure alignment with their economic strategy tables
- implementing a streamlined performance measurement system following recommendations from the 2018 evaluation to improve performance measurement practices and to reduce funding recipient reporting burden
- increasing efforts in disseminating sectoral labour market intelligence and other products (NOS, certification, accreditation, etc.) to improve awareness and use among external and internal stakeholders, as well as to increase application and integration of SIP-funded products into programs and activities
National Essential Skills Initiative
The National Essential Skills Initiative (NESI) helps Canadians improve their essential skills so that they can better prepare for, get and keep jobs, as well as adapt and succeed at work. This aligns with the Government of Canada's overarching goal of helping Canadians develop the skills they need for good quality jobs.
NESI funds projects that develop and expand literacy and essential skills training. Projects focus on testing, replicating and scaling up proven approaches to skills upgrading, as well as improving the quality of employment and training supports that are responsive to job seekers, workers and employers. Particular emphasis is placed on supporting individuals with low skills and facing multiple barriers to employment such as Indigenous peoples, newcomers, youth, and official language minority communities (OLMCs). Multi-year projects began in Fall 2017 and in FY1920 NESI funded 7 projects that improve the literacy and essential skills of Canadians and help them to better prepare for, get and keep a job, and adapt and succeed at work.
For over 25 years, ESDC has been using an Essential Skills (ES) Framework of 9 essential skills to help service providers and other organizations understand the essential skills needs of Canadians and to design and deliver programming to address those needs. Given the increased use of technology and automation in the workforce and the effects of globalization and shifting demographics on the labour market, the Department is renewing its essential skills approach.
As part of the renewal, NESI funding supported cross-country engagement sessions on the ES Framework renewal with provincial and territorial partners, service delivery organizations, experts and Indigenous stakeholders to ensure that the new skills approach is inclusive and can be adapted to different contexts.
Just as engagement activities were starting to ramp up, COVID-19 started affecting Canada. Given that physical distancing orders were put in place in all provinces and territories, consultations were put on hold and funding recipients were forced to postpone all in-classroom training and explore new and creative ways to continue supporting Canadians. For example, some project recipients were responding to the pandemic by extending their online presence and offering enhanced Skills for Success programming in ways not previously envisioned.
Funding through NESI will continue to support projects that test, replicate and scale up new and innovative approaches based on Skills for Success to help Canadians get the skills they need to adapt to rapidly changing technology and get back to work in a post-pandemic world.
Skilled trades and apprenticeship and Red Seal Program
The Program works in partnership with the provinces and territories (who are responsible for apprenticeship training and trade certification in their jurisdictions, as well as industry), to develop national standards and examinations for each of the designated Red Seal trades. ESDC sponsors the Secretariat services for the Canadian Council of Directors of Apprenticeship (CCDA), which is responsible for the oversight of the Red Seal Program. All provinces and territories and the federal government participate as members of the CCDA. The Red Seal Secretariat also provides strategic and secretariat support to the Red Seal Program. The Red Seal endorsement promotes excellence to employers, instills pride in skilled workers, and facilitates labour mobility.
FY1920 Red Seal Program fast facts
- More than 25,000 Red Seal endorsements were issued to apprenticeship completers and trade qualifiers
- Top 5 Red Seal trades by number of endorsements issued included: Construction Electrician, Automotive Service Technician, Plumber, Carpenter, and Truck and Transport Mechanic
- Approximately 220 subject matter experts have participated in ESDC organized workshops to develop Red Seal products
- Over 300 industry representatives and training providers have participated in meetings and national webinars to harmonize apprenticeship training
- More than 46,000 Red Seal examinations were written
- The Red Seal Program's website counted 534,384 visitors
Source: Canadian Council of Directors of Apprenticeship, Red Seal Program administrative data FY1920.
The Program is well established at developing common interprovincial standards used to harmonize apprenticeship training in provinces and territories, to provide the public with up-to-date descriptions of trades in Canada, and to serve as the basis for assessment. Under this Program, experienced tradespeople and apprentices who have completed their training may take the interprovincial Red Seal examination. If successful, they receive a Red Seal endorsement on their provincial or territorial certificate of qualification, indicating they have met both the provincial/territorial requirements and have demonstrated the knowledge required for the national standard in that trade. In most provinces and territories, the Red Seal examination has been adopted as the final examination for certification for Red Seal trades.
The Red Seal endorsement is a nationally recognized standard for skilled trades' workers in Canada. In FY1920, 46,673 Red Seal examinations were written by completing apprentices and experienced tradespeople from across Canada and 25,640 Red Seals were issued.
The Red Seal Program currently covers 56 skilled trades, encompassing 77% of registered apprentices.Footnote 95 ESDC works closely with industry experts and apprenticeship authorities to coordinate the development of high-quality Red Seal products, including occupational standards and interprovincial examinations. These products are updated regularly to reflect evolving labour market needs. As each province and territory needs standards and examinations to certify thousands of apprentices and experienced tradespersons each year, the collaboration in interprovincial Red Seal standards and examinations results in significant economies of scale for governments.
The core of the Red Seal Program lies in quality interprovincial standards for industry, against which tradespeople can be trained and assessed. With ESDC support, the CCDA collaborates to build these standards with industry from across Canada. The Program also encourages the harmonization of apprenticeship training outcomes through common standards, which provinces and territories use to develop their respective in-school portion of apprenticeship training.
The Red Seal Program continuously evolves to reflect the needs of the Canadian labour market and Government of Canada priorities. In recent years, the Red Seal standards and their associated development processes have undergone significant enhancements. Where appropriate, the standards are now being developed as Red Seal Occupational Standards (RSOS), with broader input from stakeholders (including tradespeople, instructors and employers) and include industry-defined performance expectations, evidence of skills attainment, learning objectives and outcomes, as well as essential skills to encourage greater harmonized training and certification across the country. The RSOS has the capacity to generate several products that are geared to users' needs such as assessment, training and career information.
With the additional stakeholder engagement and enhanced content, fewer trades undergo a complete revision of their standards each year. In FY1920, 5 new occupational standards were completed. In this period, there were 34 Red Seal examinations released for 6 trades. As more trades' standards become developed in the new format, however, their subsequent revisions will be made more efficiently, allowing for more standards' updates per year.
To further reduce barriers to certification in the skilled trades in Canada and increase opportunities for apprentices, the Government of Canada continues to work closely with provinces and territories and industry through the CCDA to facilitate the harmonization of apprenticeship training requirements in targeted Red Seal trades. Harmonization will facilitate greater labour mobility across the country and help more apprentices complete their training. In October 2016, the Forum of Labour Market Ministers (FLMM) reaffirmed its commitment to harmonize 30 Red Seal trades, representing approximately 90% of apprentices (outside of Quebec) by 2020Footnote 96,Footnote 97,Footnote 98. Consensus was reached among provinces and territories for the 30 Red Seal trades over a year ahead of the FLMM's target.
The effectiveness of achieving consensus between industry stakeholders on harmonized training across Canada has been greatly enhanced by aligning the process with the development of the RSOS. Since the standards development process brings together the same key stakeholders that are involved in apprenticeship training development, they are able to share best practices, and provide a rationale for creating the best possible training for apprentices across Canada. This aligned process also ensures long-term sustainability of harmonized training, while keeping training content as up-to-date as the standard.
Innovation and Employer Engagement Initiative fund
ESDC also continues to work with provinces and territories to increase employer engagement in apprenticeship. In October 2016, the FLMM committed to explore innovative approaches to increase employer engagement for improved job opportunities and outcomes for apprentices. In support of this commitment, ESDC established the Innovation and Employer Engagement Initiative to fund innovative supports and increase employer engagement in apprenticeship (for example, help employers to create inclusive workplaces and provide support for employer consortia pilots).
In 2017, Manitoba, British Columbia and Nova Scotia came forward with proposals to pilot employer consortia models to help reduce non-financial barriers for employers. Each pilot targets different trades, groups (for example, women and Indigenous peoples), and incorporates supports such as mentorship. Canadian Manufacturers and Exporters (CME) was engaged to manage and evaluate these pilots. This will help ensure that provincial efforts are coordinated and the effectiveness of pilots is appropriately assessed in order to promote the replication of promising approaches to new regions or sectors. The CME projects were launched in FY1819 and are scheduled to end in FY2021.
Prince Edward Island (PEI) also came forward with a Blended Learning Initiative, a 3-year pilot apprenticeship training program focussing on the welder and machinist trades. This project, which started in FY1819 and is scheduled to end in FY2122, aims to help apprentices continue working while completing technical training.
Research Project "The Registered Apprenticeship Information System
The Registered Apprenticeship Information System (RAIS) is an annual mandatory survey conducted by Statistics Canada. The survey compiles data from provinces and territories on the number of registered apprentices taking in-class and on-the-job training in trades, whether Red Seal or not.
There were 318,630 continuing apprentices in FY1920, 77% of whom were in Red Seal trades. There were 77,574 new registrations, 79% of which were in Red Seal trades. In FY1920, 38,514 apprentices received certifications, 80% of which were in Red Seal trades.
The RAIS is part of the new Education and Labour Market Longitudinal Platform (ELMLP), announced in Budget 2018 with an investment of $5.5 million per year ongoing starting in FY1819. The Platform provides up-to-date labour market information Canadians need to make informed career decisions. The core foundation systems linked to the Platform are the RAIS, the Post-Secondary Information System, and Canada Revenue Agency's T1 Family File. RAIS longitudinal indicators, published annually, provide insight on a number of key topics including apprenticeship pathways, labour market outcomes, and interprovincial mobility.
Labour Market Information
Labour Market Information (LMI) remains an integral component of the Government of Canada's economic agenda. The 2016 Federal Budget reiterated the importance of LMI by committing to provide access to timely, reliable, and comprehensive LMI to all Canadians to make informed decisions.
LMI includes qualitative and quantitative information that pertains to the enhancement of the economy through labour market development. More precisely, LMI can include relevant information on the supply and demand of the various types of labour services (employment), including information on wages and other forms of compensation, as well as detailed and aggregate-level information about work trends and the skills, experience, education and training Canadians will need for jobs today, and in the future.
National Occupational Classification
ESDC's LMI portfolio includes the administration of the National Occupational Classification (NOC), the national framework for collecting, analyzing and disseminating occupational data in Canada in support of employment‑related programming.
The NOC describes job titles, functions, tasks and duties, employment requirements, responsibilities and qualifications. The current version of the NOC gathers more than 30,000 job titles into 500 Unit Groups that is groups of occupations that have similar main duties, employment requirements, skill levels and skill types.
Labour market surveys, research, analysis and reports are usually based on the NOC. Employment-based programming, such as EI, the Temporary Foreign Worker Program, and programming for the integration of injured workers and persons with disabilities rely on NOC-based information to analyze labour market conditions for strategic considerations, as well as for policy development, program design and service delivery. Other LMI-based products, such as wages, outlooks, forecasts and career tools enable job seekers to connect with employers seeking workers, students to make informed educational and career choices, and governments and other organizations to design and deliver programming in support of an efficient labour market.
In order to increase the NOC's accuracy and relevance, ESDC, in collaboration with Statistics Canada, agreed to revise the NOC on a more frequent basis. Changes published in December 2017 and December 2018 included the addition of new job titles, notably related to the Cannabis industry, as well as changes to the content of some occupations such as the main duties. During this time, the program also conducted consultations and research for the next structural revision of the classification, which will be published in 2021. About 150 submissions from industry associations, unions, academia, provincial and territorial governments, and other stakeholders have been received, to inform this process.
Regional and labour market analysts develop and deliver regular LMI based on the NOC. These products and services, such as wages and wage analyses, job vacancies, employment outlooks and economic forecasts are made available to all Canadians on the Job Bank website. These help match students, immigrants, current and future job seekers to available and potential job opportunities, and provide access to LMI, facilitating the exploration of educational and training choices and career decisions.
Work to incorporate changes associated with the NOC 2021 revision in ESDC's IT infrastructure was launched in late FY1920. Despite some delays attributable to the COVID-19 pandemic, work is still expected to be completed in time for its publication in 2021. Over the next years, the IT infrastructure will also be expanded to facilitate the update and dissemination of additional LMI tools, such as the Skills and Competency Taxonomy.
National Work Plan
ESDC implements a National Work Plan for LMI services in support of the National Employment Service. ESDC is responsible for determining the employment outlooks and wages for detailed occupations at the NOC 4-digit level (500 occupations), at the provincial, territorial and economic region levels, where data permits. ESDC disseminated the updated wages and employment outlooks on the JobBank website respectively in November and December 2019.
Job vacancies information, weekly Labour Market News, monthly, quarterly and annual Labour Market Bulletins, Sectoral Outlooks, as well as annual and/or semi-annual Environmental Scans, were also made available on the Job Bank website for all regions of the country, along with the education and skill requirements for in-demand occupations, to support a more informed, skilled, competitive and mobile Canadian labour force.
Support for the Labour Market Information Council
In FY1920, ESDC worked alongside Statistics Canada and provincial/territorial governments to support the LMIC on an array of key LMI projects, including:
- qualitative research on the needs of first-year college and university students
- surveying and analyzing the LMI needs of NEET (not in employment, education or training) Youth
- advancing the understanding of skills in demand from online job posting data
- research on approaches to measuring skills shortages
- collaborating with provinces and territories to explore untapped data sources that could contribute to more local, granular LMI
- an in-depth study on the labour market outcomes of college and university graduates using tax data, via the Education and Labour Market Longitudinal Platform (ELMLP), and
- tracking and reporting on the latest research and findings about the future of work through an evergreen annotated bibliography
The LMIC also focused on the development of partnerships, in order to understand and align approaches to the collection, analysis and dissemination of LMI across Canada.
For instance, in FY1920, the LMIC partnered with the Canadian Career Development Foundation to conduct a series of webinars to help train and inform those delivering career advice to Canadians about data sources and related LMI tools. The Council also presented its work at a number of research conferences, and advised the Brookfield Institute's Employment 2030 project.
The LMIC is partnering with ESDC and Statistics Canada on developing robust skills indicators, including developing linkages between National Occupational Classification (NOC) codes and ESDC's Skills and Competencies Taxonomy. In addition, the LMIC has been leveraging and sharing the online job posting data it obtains from Vicinity Jobs with ESDC, Statistics Canada and provincial/territorial counterparts.
National Employment Service Initiatives
Departmental operating funds also support online national employment services administered by ESDC, to help Canadians find suitable employment and help employers find suitable workers. These free-to-use, bilingual online services connect job seekers with employers, and help individuals prepare and carry out their return-to-work action plans. Job Bank disseminates reliable, timely and accessible job postings and labour market information by reducing duplication, improving the quality of information, as well as making online LMI more accessible and easier to use.
ESDC delivers Job Bank on behalf of the Canada Employment Insurance Commission, in collaboration with provincial and territorial governments. The department maintains the Job Bank website and mobile app, which offers an electronic labour exchange service to connect job seekers and employers as part of the National Employment Service. Job Bank provides workers with a listing of employment opportunities across Canada to assist them with their job search. Employers use Job Bank to post their job vacancies and to find qualified candidates.
Job Bank receives incoming job feeds from Monster, Career Beacon, jobpostings.ca, Jobillico, CivicJobs and ZipRecruiter to increase the diversity of available job postings. In September 2019, Job Bank added 2 new feeds from ZipRecruiter and CivicJobs. Further analysis on sectoral gaps enables discussions with new incoming feeds to satisfy labour market needs. Outgoing feeds are established systematically with external sites to improve the visibility of Job Bank jobs.
Job Bank completed a number of online service enhancements in FY1920. A revamped job seeker dashboard allows job seekers to access Job Bank services from a single location. The introduction of a tiered user account system allows users to access levels of services based on the information they want to provide. Job seekers are now able to save their job searches and resumes.
In end of May 2019, Job Bank began automatically subscribing all EI regular and fishing benefits' applicants to Job Alerts by removing the confirmation step. With the change, 100% of regular and fishing EI applicants are auto-enrolled. Previously, only 30% of EI applicants completed their enrollment when there was a confirmation step required.
Job Bank job seeker trends
The Job Bank Summary Report for FY1920 (released November 2020) examined the use of the Job Alerts services available on the Job Bank platform. The report shows that:
- AppliWeb auto-enrollment accounted for 88% of the new Job Alerts users
- 43% of users who received at least 1 Job Alert email clicked to view more information
- users with college, vocational or apprenticeship training accounted for 35% of new Job Alerts users
- top Job Alerts occupations were in the construction and education sectors
- upon unsubscribing, 42% of Job Alerts users stated having found a job regardless of source
- the Job Bank mobile app had 200,000 installs. It received over 1.9 million sessions, which resulted in more than 4.2 million job posting views
- 1.4 million job seekers newly subscribed to the Job Alerts service. In total, 196 million Job Alerts were sent. 108,000 Plus user accounts created; 120,000 Job Match profiles were activated
The Job Bank mobile application received multiple updates in FY1920 to improve user experience, branding and back-end processes. The re-design of the search page and inclusion of salary details to job postings increased the relevance to job seekers and enables future improvements.
Job Bank worked with stakeholders within ESDC to increase interoperability between programs. Job Bank again made available its job posting capabilities to support the integration of the Canada Summer Jobs initiative on the Job Bank website and mobile app. Job Bank continues to collaborate with the Temporary Foreign Worker Program in the development of the Labour Market Impact Assessment Online tool, which integrates the Job Bank website and leverages its employer registration process.
Key highlights of FY1920
- The Job Bank website received 44 million visits. This represented 121,000 site visits and 642,000 page views per day
- of the total visits, 31% included a job search, and 55% viewed job postings
- the Labour Market Information section received 12,000 site visits per day, leading to the generation of 27,000 job market reports on a daily basis
- Job Bank displayed 886,000 job postings, including those from provincial, territorial and private job boards
- 21,600 new employer files were approved and 61,000 employers posted directly on Job Bank
Results from the Patterns of Job Bank Use by Employers of Temporary Foreign Workers study
A recent study, covering the period from to 2015 to 2019, examined the patterns in the usage of the Job Bank platform by employers who made Labour Market Impact Assessment (LMIA) applications to recruit Temporary Foreign Workers (TFWs). A positive LMIA is a document indicating that there is a need for a TFW to fill the job because there is no Canadian or permanent resident available to do it.
Some key findings from the study included:
- between the period 2015 and 2019, about a fifth (18.6%) of all Job Bank postings were associated with an LMIA application while 81.4% were non-TFW related
- TFW jobs were on average advertised longer (2 months) than non-TFW jobs (1 month)
- the average number of days between a job posting and LMIA application increased between 2015 and 2019 implying employers considering use of the TFW program were increasingly waiting longer before doing so
- top 3 industries accounting for nearly 53% of the job postings on Job Bank associated with an LMIA application were: 'Accommodation and Food Services'; 'Other Services (except Public Administration)'; and, 'Agriculture, Forestry, Fishing and Hunting'
- counting each location of an employer as a separate firm, job postings associated with an LMIA application were more likely to be posted by firms with less than 100 employees
- businesses did not typically reduce their use of Job Bank over time; and employers who applied to use the TFW program in their first year of posting over the period analysed continued to have postings associated with an LMIA application
- the number of TFW postings peaked in the 1st quarter of the year driven by the industries with most job postings associated with LMIA applications (notably the 'Accommodation and Food Services' and 'Other Services (except Public Administration)' industries) and recruitment through the primary agriculture stream
Work Integration Social Enterprises (WISE) research
ESDC launched the WISE research program in 2017. It is a 5-year longitudinal study composed of 6 main projects to measure the impact of social enterprises on labour market outcomes for vulnerable populations, specifically: persons with disabilities, youth, recent immigrants, homeless or individuals at risk of homelessness, and Indigenous peoples. Funding is strictly for research purposes and does not cover the WISE organizations/interventions themselves. Together with a series of complementary research projects with other funding sources, the WISE research program is expected to provide answers to the following key policy research questions:
- are WISE projects effective in promoting the social and labour market integration of vulnerable individuals?
- which WISE models and type of training programs work best for their targeted clients?
- under which circumstances?
- what is the return on public investment?
These 6 longitudinal research projects include 1 project based on a quasi-experimental design and 5 based on multi-site extended case studies. Four projects are located in Ontario, 1 in Québec, and 1 in British Columbia. They focus on different at-risk groups, WISE modes of labour market integration and training programs. Some of the projects build on previous case study research. Almost all projects include cost benefit analysis and/or Social Return on Investment (SROI) to measure the return on investment and the social impacts of WISE interventions.
Contribution agreements for all 6 research projects were signed in mid-Fall 2017 and their implementation started in late 2017 and early 2018.
ESDC continues to monitor the progress of all 6 research projects, funded through the Research & Innovation Support Measure under EI Part II. To do so, periodic teleconference calls have been coordinated with the research teams to monitor the progress of all projects and identify any emerging issues. In order to gain a deeper understanding of WISE intervention approaches and participants' experiences, ESDC also started to visit sites (not funded under EI Part II) to discuss with researchers and engage directly with WISE practitioners and community researchers in spring 2018. These site visits have provided key insights for the development and management of the WISE research program and will continue through the life cycle of the project.
This 5-year research program is expected to provide evidence to support the achievement of the Government of Canada's and ESDC's objectives to create a skilled, adaptable and inclusive workforce and an efficient labour market. This evidence will guide policy and program funding decisions for Government of Canada investments in these areas. These objectives emphasize collaboration with the not-for-profit sector and private business on the implementation of innovative ideas, social partnerships and social finance approaches. As such, the approach undertaken for the research program itself is an example of this type of collaboration.
This research strategy aligns well with the Government's Social Innovation and Social Finance Strategy and more broadly with long standing initiatives by various governments to support social enterprise as a key business model. WISEs are primary examples of community organizations developing solutions for society's most challenging problems. WISEs continuously look for new sources of revenue and innovative financing to become more sustainable and achieve greater impact.
WISEs may have the capacity to (re)integrate vulnerable populations into existing labour markets, or to create long‑term new jobs, and more broadly to increase the employability of disadvantaged populations. However, because this is an evolving area for government, there is an absence of a coordinated, focused policy framework, while government funded programs for WISEs have been fragmented and possibly underfunded. The lack of empirical data on the direct labour market impact and other relevant social outcomes of WISEs for different vulnerable populations in Canada presents a barrier to evidence-based policy and program development.
To complement the longitudinal WISE research program, ESDC is undertaking an internal research agenda analysing its Grants and Contributions database to estimate how many of these social enterprises are being funded via ESDC programs and how much money is invested in these organizations annually. ESDC is also exploring the feasibility of using its program administration data to estimate both the relative short-term effectiveness of WISEs in promoting the labour market integration of vulnerable individuals compared to the effects achieved by other types of interventions, and the longer-term effectiveness. ESDC will also test the possibility of using program administrative data to quantify the results of the Social Innovation and Social Finance Strategy.
Achievements for WISE Research Projects in FY1920
- In June 2019, a teleconference call was held with all research teams to discuss progress to date and provide feedback on all projects. Projects are on track to meet expected results, as defined in the contribution agreements
- Projects have begun to share their interim research reports, which summarize baseline information about the participants and preliminary short-term results
- In the summer of 2019, ESDC analysts visited sites in Ontario and British Columbia. These visits gathered information on the clients and operations of the WISEs as well as the conditions in which they operated. Findings from these visits were incorporated into an evergreen WISE Visits Summary report that covers all WISEs visited to date
- In February 2020, ESDC organized a Workshop (not funded by EI Part II) at which WISE representatives, researchers, and leading measurement experts made presentations on their WISE, their research projects, including preliminary results, and provided guidance on how best to measure the success of WISE interventions with 1 another and with internal and external stakeholders
WISE research projects will monitor the experience of these WISE participants for up to 3 years. Interim research reports will be delivered in each upcoming fiscal year. The research teams will submit final research reports by March 31, 2022.
The estimated notional budget for the entire research program over 5 years is $2,030,000, dependant on annual allocation through the EI Expenditure Plan for Pan-Canadian funded activities.
3.4.4 Supporting agreements with provinces, territories and Indigenous organizations
In FY1920, ESDC continued its work to enhance and modernize the LMDA data systems including the implementation of a standardized Performance Measurement Strategy across provinces and territories, data warehousing to accommodate standardized data from provinces and territories, the Targeting, Referral, and Feedback (TRF) tool, and improvements to the Employment Insurance Benefits Information System (EIBIS).
The Department continued work on the Data Warehouse for Labour Market Programs project to expand and update existing data storage solutions to support the implementation of a new LMDA and ISET Performance Measurement Strategy (PMS). ESDC supported all jurisdictions in their transition to a standard XML data format, as prescribed in the new PMS. This ensures a more consistent data transfer between ESDC and all jurisdictions to facilitate reporting on key performance indicators. The architecture for the overall Data Warehouse solution is scalable to accommodate the evolution of labour market programs, while safeguarding personal information in a secure environment. Follow-up work will provide better access to aggregate data across programs to inform policy development.
The TRF allows provinces and territories to receive information on EI applicants immediately following their application for EI, based on predefined criteria. Jurisdictions then proactively contact these applicants to offer services and supports to help with their return to work. In FY1920, Quebec, Alberta and British Columbia continued refining their use of TRF. ESDC worked closely with the remaining 10 provinces and territories to onboard to TRF.
In addition, in FY1920, the Department approved a project to align data exchange methodology with the guiding principles set out in the 2017–2021 Government of Canada Strategic Plan for Information Management and Information Technology. The project will achieve program efficiencies by increasing speed of service delivery and data integrity through an Application Programming Interface server-to-server solution. This solution replaces a manual process to verify client program eligibility, reduce errors and the exposure of data to unauthorized personnel, and improve data integrity and security.