
Chapter 4 - Program administration
From: Employment and Social Development Canada
Official title: Employment Insurance Monitoring and Assessment Report for the fiscal year beginning April 1, 2019 and ending March 31, 2020: Chapter 4: Program administration
In chapter 4
- List of abbreviations
- 4.0 Program delivery
- 4.1 Chapter 4 at a glance
- 4.2 Introduction and context of Employment Insurance service delivery
- 4.3 Information and tools for Employment Insurance
- 4.4 Application intake and claim processing
- 4.5 Recourse
- 4.6 Service transformation to improve service delivery
- 4.7 Service quality
- 4.8 Conclusion
List of abbreviations
This is the complete list of abbreviations for the Employment Insurance Monitoring and Assessment Report for the fiscal year beginning April 1, 2019 and ending March 31, 2020.
Abbreviations
- ASETS
- Aboriginal Skills and Employment Training Strategy
- ATSSC
- Administrative Tribunals Support Service of Canada
- B/C Ratio
- Benefits-to-Contributions ratio
- B/U Ratio
- Benefits-to-Unemployed ratio
- B/UC Ratio
- Benefits-to-Unemployed Contributor ratio
- BDM
- Benefit Delivery Modernization
- CANSIM
- Canadian Socio-Economic Information Management System
- CAWS
- Citizen Access Workstation Services
- CCAJ
- Connecting Canadians with Available Jobs
- CCB
- Canada Child Benefit
- CCDA
- Canadian Council of Directors of Apprenticeship
- CEIC
- Canada Employment Insurance Commission
- COLS
- Community Outreach and Liaison Service
- CSO
- Citizen Service Officer
- CPI
- Consumer Price Index
- CPP
- Canada Pension Plan
- CRA
- Canada Revenue Agency
- CRF
- Consolidated Revenue Fund
- CUSMA
- Canada-United States-Mexico Agreement
- CX
- Client Experience
- EBSMs
- Employment Benefits and Support Measures
- ECC
- Employment Contact Centre
- EF
- Enabling Fund
- EI
- Employment Insurance
- EI PAAR
- Employment Insurance Payment Accuracy Review
- EI PRAR
- Employment Insurance Processing Accuracy Review
- EICS
- Employment Insurance Coverage Survey
- eROE
- Electronic Record of Employment
- ESDC
- Employment and Social Development Canada
- FLMM
- Forum of Labour Market Ministers
- FY
- Fiscal Year
- G7
- Group of Seven
- GDP
- Gross Domestic Product
- HCCS
- Hosted Contact Centre Solution
- HRSDC
- Human Resources and Social Development Canada
- IQF
- Individual Quality Feedback
- IVR
- Interactive Voice Response
- LFS
- Labour Force Survey
- LMDA
- Labour Market Development Agreements
- LMI
- Labour Market Information
- LMP
- Labour Market Partnerships
- MIE
- Maximum Insurable Earnings
- MSCA
- My Service Canada Account
- NAICS
- North American Industry Classification System
- NAFTA
- North American Free Trade Agreement
- NAS
- National Apprenticeship Survey
- NERE
- New-Entrant/Re-Entrant
- NESI
- National Essential Skills Initiative
- NIS
- National Investigative Services
- NOS
- National Occupational Standards
- NQCP
- National Quality and Coaching Program for Call Centres
- OAS
- Old Age Security
- OECD
- Organization for Economic Co-operation and Development
- PPEs
- Clients who are Premiums Paid Eligible
- P/Ts
- Provinces and Territories
- PPTS
- Percentage points
- PRP
- Premium Reduction Program
- QPIP
- Quebec Parental Insurance Plan
- RAIS
- Registered Apprenticeship Information System
- ROE
- Record of Employment
- RSOS
- Red Seal Occupational Standards
- SA
- Social Assistance
- SCC
- Service Canada Centres
- SDP
- Service Delivery Partner
- SEPH
- Survey of Employment, Payrolls and Hours
- SIN
- Social Insurance Number
- SIR
- Social Insurance Registry
- SME
- Small and medium sized enterprises
- SO
- Scheduled Outreach
- SST
- Social Security Tribunal
- STDP
- Short-term disability plan
- SUB
- Supplemental Unemployment Benefit
- UV
- Unemployed-to-job-vacancy ratio
- VBW
- Variable Best Weeks
- VER
- Variable Entrance Requirement
- WWC
- Working While on Claim
4.0 Program delivery
Information note
This chapter refers to both claimants and clients. Claimants include individuals who are submitting or have submitted an Employment Insurance (EI) claim as well as those currently receiving benefits. Clients include claimants, employers and other interested parties.
In addition, in the EI program, the fiscal year runs from April 1 to March 31. This chapter uses "FY" with the last 2 digits of the specific year to indicate the fiscal year. For example, “FY1920" refers to the period starting on April 1, 2019 and ending on March 31, 2020.
This chapter uses “Budget” to refer to the Canadian federal budget.
The Canada Employment Insurance Commission (CEIC) has 4 members representing the interests of:
- government
- workers, and
- employers
The CEIC has a legislated mandate to monitor and assess the EI program. It has delegated EI administration and day-to day operational responsibilities to:
- Employment and Social Development Canada (ESDC), and
- Service Canada, which is part of ESDC
The CEIC retains a key role in overseeing the EI program, including reviewing and approving policies related to administration and delivery.
4.1 Chapter 4 at a glance
The EI program provides economic security to millions of Canadians when they need it most. Through consultations and client feedback, the Government of Canada understands that Canadians want better and faster services.
Each year, ESDC takes the pulse of its clients via the Client Experience (CX) survey, which measures client satisfaction for ESDC programs. Overall, the survey found that 77% of clients were satisfied with the overall service experience after completing the process of applying for EI and receiving a decision. ESDC conducted the survey between August and October 2019.
In FY1920, ESDC took some significant steps in improving Canadians overall EI service delivery experience by:
- implementing the Hosted Contact Centre Solution (HCCS), a modern and supported technology which allowed EI call centres to increase the capacity of the queue
- in addition, the Social Security Tribunal introduced improvements and reforms for a faster and more client-centric delivery for EI clients
However, due to the COVID-19 pandemic, EI clients in the FY1920 faced many new challenges: Canada counted more than one million job loss.
To help serve Canadians, the Department launched the Canadian Emergency Response Benefit to address the high numbers of Canadians in need. Additionally, the Department:
- developed new service delivery measures
- implemented new ways to support the labour market
The Department’s response to the crisis unveiled the significant amount of work undertaken in a short period of time. This work has laid the ground for important measures that are expected to have positive impacts on EI clients in the years to come.
4.2 Introduction and context of Employment Insurance service delivery
In this section
- 4.2.1 Impact of COVID-19 on the service delivery network and Service Canada’s response to the pandemic
- 4.2.2 Service standards
- 4.2.3 Client response
Eligible workers count on EI benefits when they lose their job. Service Canada delivers the EI program for ESDC. There are different types of EI benefits:
- regular and fishing benefits support workers while they look for a job or upgrade their skills
- sickness, maternity, parental, and caregiving benefits support workers when they take time off due to life events
- work-sharing benefits support workers when they work part-time due to a reduction of their employer’s level of business activity
Claimants and employers can interact with Service Canada through 3 channels:
- on the phone
- online, or
- in person
The processing and payment of EI benefits occurs through a service delivery network. This network is made up of EI processing sites and EI call centres located across the country. It addresses seasonal fluctuations in workload while adjusting to unexpected spikes due to economic conditions or major disruptions such as natural disasters or pandemics.
4.2.1 Impact of COVID-19 on the service delivery network and Service Canada’s response to the pandemic
This year’s Report excludes data related to CERB during the FY1920 reporting period (from March 15, 2020 to March 31, 2020). This ensures continuity in the reported data on EI regular benefits from year to year. It also enables to perform meaningful yearly comparisons in FY1920 with previous fiscal years. Further described in chapter 2.
Like other citizens in the world, the COVID-19 pandemic affected Canadians on many levels, including public health and economic ones. In March 2020, the global pandemic caused the sudden loss of more than one million jobs in Canada.
As a result, over the last weeks of FY1920:
- the number of applications for EI benefits received by Service Canada increased sharply, with 1,800,637 million received in March 2020 alone
- the EI call centres saw a substantial increase in the number of calls received
- almost 1 quarter (24.1%) of EI call centres’ call volume for FY1920 was received in the 2 and a half week period of March 16 to 31, 2020
ESDC quickly began to develop new initiatives to respond to the changing needs of its clients and of alternative approaches to maintain service delivery. For example, ESDC:
- launched the eServiceCanada portal as a replacement to the Service Canada Centre (SCC) that were temporarily closed
- the portal allows clients to submit an online request and to be contacted within 2 business days
- from March 12 to 31, 2020, clients were served both in person at SCC s and through eService when required
- clients submitted 13,150 EI service requests and 157,279 were served in SCC s for a total of 170,429 EI clients
- the portal allows clients to submit an online request and to be contacted within 2 business days
- engaged with Indigenous and remote communities to offer alternate service delivery mechanisms
- offered virtual information sessions for both employers and employees affected by mass layoffs
- leveraged its new call centre platform, implemented on March 9, 2020, to migrate the entire EI call centre and Employer Contact centre networks of agents to telework in only 4 weeks
- this platform ensures they could work safely while physical distancing
- this platform also greatly increased the number of calls that the system could manage in comparison with the previous call centre platform, which was critical given the vast increase in calls received
4.2.2 Service standards
ESDC aims to provide high quality and timely services to EI clients. In support of this goal, ESDC is committed to meeting its service standards. ESDC publicly reports the service standards each year on Canada.ca.
ESDC’s service standards measure the efficiency, effectiveness and accountability of the delivery of its programs and services. These are fundamental in assessing how the Department carries out its work, and are integral to providing the best service to clients.
Payment of Employment Insurance benefits
- Our standard: to issue notifications of EI benefit payments or non-benefit within 28 calendar days of filing
- Our target: ESDC aims to meet this standard 80% of the time
- Our performance in FY1920: ESDC met this standard 80.0% of the time
- Consult Speed of payment for more details
Accuracy of Employment Insurance payments
- Our standard: for EI payments to be accurate
- Our target: ESDC aims to meet an annualized accuracy rate of 95%
- Our performance in FY1920: ESDC met this standard 94.1%Footnote 1 of the time
- Consult EI PAAR results for more details
Employment Insurance requests for reconsideration
- Our standard: to finalize EI request for reconsideration decisions within 30 days of the request being received
- Our target: ESDC aims to meet this standard 70% of the time
- Our performance in FY1920: ESDC met this standard 76.2 % of the time
- Consult 4.5.1 EI request for reconsideration for more details
Access to an Employment Insurance call centre agent
- Our standard: for agents to answer EI calls within 10 minutes
- Our target: ESDC aims to meet this standard 80% of the time annually
- Our performance in FY1920: ESDC met this standard 48.3% of the time
- Consult Calls answered and Factors affecting call centre performance for more details
This highlights the importance of a strong service delivery and integrity model. This ensures clients have timely access to the benefits to which they are entitled.
4.2.3 Client response
ESDC thrives to meet Canadians expectations with respect to service delivery. The Department takes the pulse of clients via the CX Survey on an annual basis. This helps provide clients with the best services that are adapted to their needs.
Context of the CX survey
The annual CX Survey tracks clients’ ability to access the major ESDC programs, including EI. A public opinion research firm conducts the survey by telephone and assesses the ease, effectiveness, confidence and satisfaction with the client experienceFootnote 2. This information is based on survey interviews with EI clients who completed a client journey, that is, received an initial decision. It also assesses reported take-up of self-service and help. The survey asks clients to provide attributes of their service experience using a scale of 1 to 5. The survey reports clients as satisfied if they rated their satisfaction as 4 or 5 out of 5.
The FY1920 Survey results for EI clients reflect the service experience of claimants who received an initial decision between August 1 and October 31, 2019, inclusively. This wave is the third annual Service Canada-wide survey.
EI sample, statistical information and statistical errors
ESDC selected a random sample of recent clients, stratified by province and territory, from the EI administrative databases. The sample included new and repeat clients, whether granted or denied benefits. It included all benefit types, except compassionate care and benefits for parents of murdered and missing children. This was due to the sensitivity of contacting these clients about the service delivery. ESDC did not include renewals and revisions claims, as these actions occur after clients have accessed the program. ESDC sampled clients living in remote areas and from Indigenous communities in sufficient numbers for analysis of service delivery issues across all ESDC programs.
The completed survey sample of 701 telephone interviews with EI clients is lower than the target sample size of 1000. This is because ESDC stopped the fieldwork at the outset of the pandemicFootnote 3.
Main results of the EI Client Experience
Results from the FY1920 Service Canada CX Survey found that 77% of clients were satisfied with the overall service experience. ESDC conducted this survey with clients who:
- had completed the process of applying for EI, and
- had received a decision in the period of August to October 2019
This is not significantly lower than the same period in FY1819 (80%). However, it is a statistically significant decrease compared to the 83% satisfaction rating from the FY1718 results.
The 3 strongest drivers of satisfaction among EI clients were:
- whether the client considered the length of their journey was reasonable
- (68% of the clients found the length until they received a decision was reasonable, compared to 69% in FY1819)
- the ability of EI call centre representatives to be helpful
- (73% of the clients found them helpful)
- the ease of getting help when needed
- (70% of clients found it easy, compared to 72% in FY1819)
The CX survey identified all 3 drivers as areas for improvement. This is because they are aspects of the client experience with both:
- high impact on satisfaction, and
- lower ratings
(The CX Survey has an overview of the drivers of satisfaction, and changes in service attribute ratings and channel ratings.)
There were significant changes to satisfaction from the previous year in the service channel ratings:
- the online channel satisfaction decreased from 79% to 71% for the web, and
- specialised call centre channel satisfaction decreased from 74% to 59% for EI call centresFootnote 4
In the FY1920 results:
- only 47% of EI clients reported that they self-served online to apply, compared to 52% in FY1718
- (FY1718 is the previous year that ESDC measured multiple channel use)
- use of the in-person channel was higher than in the previous period for completing and submitting an application (43% vs 34%)
- use of EI call centres was higher than in the previous period for following up on an application (28% vs 19%)
4.3 Information and tools for Employment Insurance
In this section
4.3.1 Online
Canada.ca
EI information is available on Canada.ca, the main website of the Government of Canada. Clients use Canada.ca and ESDC’s secure applications to access information and make online transactions. EI online information and services are among the most popular content on Canada.ca. For example, In FY1920, there were a record 13.4 million web visits to the web pages for EI Regular Benefits. That is 150% more visits than in FY1819. The COVID-19 outbreak was the reason behind this surge in web visits. Web visits in March 2020 made up 58.3% of all the web visits for whole the year. Also, EI regular benefits had a 56% task conversion rate. This means that 56% of those who visited the regular benefits pages went on to start an application using Appliweb. This is an unusually high conversion rate for any ESDC web content.
At the end of FY1819, ESDC added a Maternity and Parental Benefits Estimator to its EI maternity and parental benefits web pages. This new tool is an interactive calculator that claimants use to estimate how much they could receive when applying for maternity and parental benefits.
Client usage statistics for the Estimator became available in FY1920. The data is available for 10 months of FY1920 (June 2019 to March 2020. The data shows that clients used the tool an average of 54,712 times a month.
In January 2020, ESDC updated the EI sickness benefits web pages. The goal of the project was to improve the client experience and increase the success rate for clients. ESDC defined success as using the content to start an application on AppliWeb. The updates included:
- simplifying content by using a client-centric approach and plain language
- revising the page layout for easier navigation
Following these changes, testing showed that:
- 65% of users were able to find and understand the information they needed, compared to 44% before the updates
- number of people who visited the website and went on to start an application using Appliweb increased to 55%, compared to 31% before
Of all the visits that successfully started applications in FY1920, 73.2% of them occurred in March 2020. This was after ESDC updated the EI sickness website.
Service Canada data shows that the following factors increased the rate of people who remained on the website to start an application in FY1920:
- the process of improving the website, and
- a spike of visits from the COVID-19 outbreak
The COVID-19 outbreak created a situation where assessing improvements to the client’s web experience was made more difficult.
Services
EI claimants have access to tools that help them apply for their benefit, report on their situation, or consult their EI file.
AppliWeb
AppliWeb is the online tool EI claimants can use at any time to submit applications. Claimants can access AppliWeb from anywhere there is internet access, including Service Canada Centres. AppliWeb is the method preferred by claimants to apply for EI benefits. In FY1920, claimants submitted 99.1% of EI applications using this tool.
Electronic reporting
Every 2 weeks, claimants must complete EI reports attesting to their work situation. In their report, claimants provide responses to a series of questions. These questions determine, week to week, if the claimants are entitled to the EI benefits they are claiming. Claimants can complete electronic EI reports using the phone or the internet reporting service. Both services are simple, fast, convenient, secure, and available at all times.
The internet service remained the preferred electronic reporting method. It experienced an increase in usage from 79.1% in FY1819 to 80.9% in FY1920. Claimants submitted the remaining 19.1% of EI reports electronically by using the phone reporting service.
Based on their EI report, the report sometimes asks claimants to give information about their availability for work. Instead of contacting the call centre to give this information, claimants using the internet service can use e-questionnaires. If they submit information this way, it is instantly transferred to the EI systems.
My Service Canada Account
My Service Canada Account (MSCA) is an online service that Canadians can access through Canada.ca. MSCA allows Canadians to view and update their information for:
- EI
- Canada Pension Plan (CPP)
- Canada Pension Plan Disability (CPP-D), and
- Old Age Security (OAS)
MSCA has features and functionalities that enable EI claimants to take advantage of self-serve options. This makes MSCA available for EI claimants 24 hours a day, 7 days a week, from anywhere there is internet access.
Claimants can:
- manage their account
- check the status of their application and transactions, including payment information
- update their mailing address or direct deposit information
- receive new information from Service Canada about their EI claim on changes to their account
- get their T4E tax slip
- view previous EI claim information
As a result, the MSCA portal contributes to more accessible, accurate and timely services for
Canadians.
Service Canada promotes the EI services on MSCA through Canada.ca, on AppliWeb, and in communications sent to claimants. An average of 39.1% of EI claimants used MSCA each month in FY1920, an increase of 1.1% compared to FY1819.
As of June 29, 2019, claimants receiving Family Caregiver benefits have also been able to use MSCA to view their claim information. As well, Service Canada added a new feature to MSCA in December 2019. It allows claimants who have been approved for extended parental benefits to consult what their extended benefit rate will be.
4.3.2 By telephone (call)
EI clients frequently contact 1 800 O-Canada for general enquiries related to EI. For more complex and client-specific enquiries, EI clients have the choice of:
- calling the EI call centre, or
- logging into their MSCA
1 800 O-Canada
1 800 O-Canada supports Government of Canada communication activities, both in regular times and in crises. It often serves as the first point of contact for callers regarding Government of Canada programs and services, including EI.
The 1 800 O-Canada line is available Monday to Friday in more than 60 countries, with service in both official languages. In Canada, the service is available from 8:00 am to 5:00 pm in each time zone. Callers outside of Canada can reach someone from 8:00 am to 8:00 pm Eastern Standard Time.
1 800 O-Canada can provide general information on EI programs and how to access them, including:
- an overview of the benefits and eligibility criteria
- application process and forms
- direct deposit information
- referral of contacts to specific programs, including the pertinent EI web pages and links necessary to complete their service delivery journey
Canadians can expect to be served within 18 seconds (or within 3 rings), 80% of the time.
During FY1920, 1 800 O-Canada:
- continued to provide timely, high quality service to Canadians answering 81% of calls within 18 seconds (pre-pandemic results)
- made recorded messages available to callers, answering some frequently asked questions without the need to speak to an agent
- initiated real time performance reporting online with live results that refresh every 5 minutes
- helps callers set expectations and decide on the right time to call
Employment Insurance call centres
The EI call centre network is made up of:
- 10 call centres across the country, and
- approximately 1,100 agent full-time equivalents
It is the main point of contact for EI clients. The EI call centres spread calls across the network based on availability of resources, regardless of from where in the country they are coming.
EI call centre agents respond to questions about the application process for EI, eligibility for EI benefits, and enquiries specific to claimants’ EI files. They resolve enquiries by:
- providing claim-specific information
- updating information on the claimant’s file (for example, changing an address or direct deposit information)
- adjudicating a wide variety of contentious and non-contentious issues (such as claim calculation and reason for separation)
Call volume
The total EI call volume reached almost 36.7 million calls in FY1920, an increase of approximately 12 million calls from the previous year. 8.8 million calls came between March 16 and 31, 2020. This shows the impact that the COVID-19 had on EI call volumes. Almost a quarter of the calls from clients occurred within a 2 and a half week period.
ESDC equipped call centres with an Interactive Voice Response (IVR) system. The IVR allows clients to self-serve:
- clients can check their application status
- get details about their payments, and
- complete their bi-weekly declarations
54% of the calls for the current reporting year (19.8 million) were resolved in the IVR Footnote 5 without the need to speak to an agent. This is 3.9 million more calls than were resolved the previous year. Although a smaller percentage of calls was resolved in the IVR than FY1819 (64%), the total number of calls resolved calls increased. This is because of the sheer volume of calls placed to EI call centres this year.
Agents are available to help and guide clients through issues that clients do not resolve by self-service. For this reporting year, the top 5 main reasons clients requested agent assisted services were:
- questions about the status of a claim/decision (includes claims/decisions within or outside the timeframes, as well as initial, revised, renewals)
- needing an agent’s intervention to complete an electronic claimant’s report (that is, a claimant’s report started by the claimant through a self-service option)
- questions about entitlement conditions for EI benefits unrelated to a claim
- help on how to file their application
- requests that an agent complete a claimant’s report for them (that is, a claimant’s report not started by the claimant through a self-service option)
Calls answered
This year, call centre agents answered 4.4 million calls, 244,727 fewer calls than last year. This is the first time that the annual volume of calls answered has fallen since FY1516. The number is partially explained by delays in onboarding new employees, due to limitations in the capacity for training. Onboarding capacity was affected because call centres were not able to hire ahead of attrition. Capacity for training was affected because there were competing training priorities that limited the availability of both trainers and training spaces. The number of calls answered was also affected by increased average call length. This year, the average call length was 1 minute and 3 seconds longer than in FY1819.
Call length is affected by the nature and complexity of the calls received. It is also affected by the proportion of new staff, who generally have longer call lengths than experienced agents. The volume of calls answered still represents an increase of almost a million calls answered over FY1516 (when EI call centre agents answered 4 million calls). When looking at the entire period since the call centre investment of Budget 2016, there has been a very significant increase in calls answered.
Agent accessibility is another important performance indicator for call centres. It represents the percentage of call attemptsFootnote 6 that are successfully placed in queue to wait to speak to an agent. Based on the investment of Budget 2018, EI call centres set a target to achieve 70% accessibility for FY1920. The target was not achieved, and agent accessibility decreased to 40.8% this reporting year, compared to 65.5% in FY1819. This change in accessibility is attributable to the same factors noted above: delays in onboarding and an increased call length.
The EI call centre IVR was 92.2% accessible, although it has been virtually 100% accessible in recent years. Agent accessibility was lower over the course of the entire year. However, most of the reduction in IVR accessibility was a result of the volume of calls at the end of the fiscal year. This was in conjunction with the COVID-19 pandemic.
For FY1920, clients had to wait an average of almost 7 minutes longer than in FY1819 for an agent to answer their calls. This is similar to the wait times clients experienced in FY1516. It is important to note that this wait time was disproportionately affected by the period of March 16 to 31, 2020. This was when the call volume escalated because of the COVID-19 pandemic, wait times were just under 1 hour. This is compared to just under 12 minutes for earlier in the year.
The published service level target for the EI call centres is to answer 80% of calls within 10 minutes. (Once a caller is in the queue to speak to an agent). EI call centres did not meet this target, and recorded a 48% service level. Service level was negatively affected by the call volume associated with the pandemic, in addition to the issues previously mentioned.
There was also an increase in the rate of callers who chose to hang-up, rather than wait to speak to an agent (consult table 1). The increased hang-ups are likely related with the longer wait times, particularly as the population felt the impact of the COVID-19 pandemic.
| Fiscal Year | FY1718 | FY1819 | FY1920 |
|---|---|---|---|
| Call answered by an agent | 4,607,964 | 4,648,516 | 4,403,789 |
| Calls for which a client could not access an agent | 3,597,707 | 3,189,609 | 8,298,993 |
| Abandoned callsFootnote 7 | 691,907 | 979,761 | 1,303,770 |
- Source: Employment and Social Development Canada.
Factors affecting call centre performance
While the COVID-19 pandemic had a profound impact on EI call centres, several other factors also affected call centre performance throughout FY1920. This included unexpected office closures, system outages, and increased number of calls throughout the year from clients waiting for EI claim decisions.
Furthermore, claim status enquiries are correlated with the volume of EI claims submitted but not yet processed. In FY1920, calls to the EI call centres about outstanding claim decisions increased the overall EI call volume by approximately 190,000 calls.
The telephone system that EI call centres use for the majority of FY1920 could not support the total volume of calls from clients wishing to speak to agents during peak times. It limited the number of clients that could access the queue to speak to an agent. To address this, a modern telephone system replaced the outdated telephone system on March 9, 2020.
The Call Centre Improvement Strategy section (section 4.6.2) describes the migration to a modernized telephone system. With this migration complete, ESDC continues to review and adjust how it manages incoming calls to improve access to call centre services.
Calls resolved at first point of contact
Once a client connects to a call centre agent, the majority of their telephone enquiries are resolved at the call centre. There may be cases where the call centre environment is not well suited to handle a request efficiently. If this is the case, the call centre sends the request to EI processing officers for appropriate follow-up.
Call centres track the volume of calls resolved at first point of contact. The call is considered resolved if the agent was able to address the client’s enquiry during the telephone interaction. Of note, it does not measure client satisfaction and is an internal organizational performance indicator. During this reporting year, the percentage of calls that were resolved by a call centre agent with no additional follow-up required decreased by 4.2% to 77.3%. This decrease is largely related to a higher than normal EI claims inventory throughout FY1920. This decrease is largely related to a higher than normal EI claims inventory throughout FY1920. Because more claimants were waiting for a decision about their EI claims, the call centres received more calls from clients asking about the status of those unresolved claims. Decisions on these claims are not always possible at the first point of contact. For example, when a client has not yet submitted a needed document:
- information is required from a 3rd party, or
- the complex action required is not suited to being completed during a telephone call
Employer Contact Centre
Another critical component of the call centre network is the Employer Contact Centre (ECC). Launched in June 2011, the ECC provides enhanced services to employers through an accessible, national, single point of contact. The ECC network consists of three call centres, and is comprised of approximately 65 agent full-time equivalents.
Employers contact the ECC to get information and help on a variety of service offerings.
Calls volume
The total number of calls made by clients to the ECC in FY1920 was 1,482,858 calls. This volume includes:
- calls answered by ECC agents
- calls for which the self-serve option resolved the clients’ needs
- calls for which the caller chose to abandon while waiting to speak to an agent
- calls limited from accessing an agent
The successful migration to a new call centre platform on October 29, 2018, introduces some informational self-serve options.
In FY1920, over half a million calls were resolved in the IVR systemFootnote 8. This was a major increase compared to 89,000 calls in the last 5 months of the year before. For example, the ECC’s new call centre platform now allows clients to identify if they called the correct service. In FY1920, the percentage of the ECC’s total call volume that agents had to refer to other programs or Departments decreased to 7.9%. This is approximately half of the calls that ECC agents referred to other programs or departments in FY1718, before the department implemented the platform. These results suggest that since the changes made in FY1819, callers can more easily and immediately determine if they have called the wrong number, without needing to speak to an agent.
Calls answered
In the current reporting year, 78.7% of clients who selected to speak to an agent were placed in queue. This is 15.1% less than the previous year. Calls for which a client could not access an agent increased to 102,468. This is an increase of 71,885 calls from the previous year. This change is due to the significant call volume associated with the COVID-19 pandemic. Before March 2020, virtually 100% of clients who selected to speak to an agent were placed in queue.
The ECC has the same service level target as the EI call centres, which is to answer 80% of calls within 10 minutes. The ECC exceeded this target by answering 89.1% of calls within 10 minutes, an increase of 2.3% from the previous year. The average length of time clients had to wait to speak to an agent decreased by approximately 30 seconds, to 3.7 minutes. The number of clients who chose to hang up after being placed in queue decreased to 15,410. This is a decrease of 36,337 calls from the previous year.
ECC agents answered 362,545 calls in FY1920, compared with 411,666 calls in FY1819. The following are the top 5 reasons employers called the ECC to speak to an agent for help (from highest to lowest):
- to order paper record of employment (ROE) forms (consult section 4.4.1 for record of employment)
- to enquire about ROE Web registration and login
- to receive help about block specific information on ROE s
- to enquire about the status of an application for the Temporary Foreign Worker Program
- to receive help on how and when to issue an ROE
Quality of call centre service delivery
EI and ECC call centres are committed to ensuring that clients receive consistent high quality service. Agents are supported in delivering on this commitment from the moment they are hired, beginning with an extensive training program.
Training for call centre agents
The initial training for call centre agents varies by program. EI call centre agents receive 10 weeks of onboarding training, whereas ECC agents receive a minimum of 7 weeks. The training takes various forms, including computer-based learning, classroom instruction, practical exercises, and reading materials. The training is followed by a post-training monitoring program to ensure that agents are supported as they begin to answer calls. Even once agents begin to work more independently, ongoing support is available through a dedicated agent assist telephone line. With this telephone line, agents can get advice and help from experts.
Call centre agents receive more training when the department introduces changes to programs or systems. They also have weekly time scheduled to review procedures and new information that doesn’t require formal training. This allows them to keep their skills and knowledge current. Call centre agents also have regular team meetings where they discuss technical information and strategies for handling calls.
National Quality and Coaching Program for call centres
Beyond supporting agents through training, ESDC ensures the delivery of high quality service to clients. ESDC does this through its National Quality and Coaching Program for Call Centres.
This program monitors agent calls on an ongoing basis. The program provides regular feedback to ensure that agents provide accurate and complete information. Feedback may include coaching developing training plans tailored to individual needs. The program can then do more monitoring as part of these plans to ensure continued performance improvements. The program holds national sessions on a regular basis to ensure that it’s applying the same monitoring criteria across all call centres.
The program evaluates calls to the call centres in terms of specific elements of the call. These elements include:
- the greeting
- the authentication of the client
- the resolution of the client’s need, and
- the closing
The program categories each element as meeting, partially meeting, or not meeting quality expectations. Of note, when the program categories an element as partially meeting expectations, the agent has addressed the fundamental criteria associated with that indicator. In this case, the program has identified only a need for minor improvement.
For FY1920, 83.5% of the reviewed EI calls had an overall call score of:
- meeting expectations (69.0% of calls reviewed), or
- partially meeting expectations (14.6% of calls reviewed)
The specific element "Provides Accurate and Complete Information" is a key indicator of the result achieved for the client. For this element, 87.6% of reviewed EI calls met or partially met quality expectations.
For the ECC, 93.8% of calls monitored had an overall call score that the program categorized as:
- meeting expectations (76.3% of calls reviewed), or
- partially meeting (17.5% of calls reviewed) expectations
97.5% of reviewed ECC calls met or partially met quality expectations for "Provides Accurate and Complete Information".
This National Quality and Coaching Program complements the Processing Accuracy Review, which assesses the accuracy of transaction processing (consult section 4.7.2 ). In FY1920, EI call centre agents had a processing accuracy rate of 92.9%, well surpassing the target of 80%.
Clients may give comments about the service received through the call centre network. Each call centre agent has an ID number assigned to them. Clients can request this number during any call, and reference it when providing feedback.
4.3.3 In person (visit)
Prior to March 2020, Canadians could get information and support on ESDC services through in-person points of service. Because of the COVID-19 pandemic, SCC s closed temporarily in March 2020. Clients were able to maintain access to essential Service Canada programs, services and benefits through eServiceCanada. eServiceCanada is a quickly established, new virtual approach to service delivery.
Prior to this, Canadians were able to access our services at 606 in-person points of service across the country. These included:
- 317 SCC s
- 247 scheduled outreach sites
- 27 Service Canada Centre Passeport Service sites
- 15 Service Delivery Partner (SDP) sites
SCC s are open up to 5 days a week, managed and staffed by Service Canada employees, and offer general information and transactional services. SCC s may be stand-alone or co-located with other organizations.
Scheduled outreach sites are points of service located outside a SCC but offer similar services. Service Canada staff travel to a pre-determined location, typically in rural or remote areas that are otherwise underserved. ESDC suspended outreach in March 2020 due to the pandemic. Staff proactively reached out to all scheduled outreach site partners to ensure communities were aware of how to access virtual services.
In the 15 SDP sites, employees of the Government of Northwest Territories provide services on behalf of Service Canada. They offer general information and referral services for federal government programs and services on behalf of Service Canada.
Service Canada Centres operations
SCC employees provide general program information and application intake support to clients. They help clients complete the application online by walking them through the various steps. Although SCC employees do not process claims, they perform support functions for the EI program, such as:
- authenticating identity
- validating supporting documents
- verifying information for completeness, and
- non-complex transactions:
- change of address
- direct deposit
- temporary access code issuance
- change of tax code, and
- extension of sickness benefits
SCC s also leverage existing video chat capabilities in select sites to enhance the service experience of Canadians. This allows high volume centres to reduce client wait times. The clients are directed to the next available “virtual officer” in small designated centres that have the capacity to help with select services. Video chat service delivery is increasingly becoming an accepted mode of meeting clients’ service needs.
Service Canada provides services to EI clients in English and French, as per the Official Languages Act. In addition, Telephone Interpretation Services in 81 languages are available in all SCC s and outreach locations.
In FY1920, Service Canada in-person points of service staff completed over 2.6 million service requests related to EI. This represents nearly 33% of all service requests handled. In the SCC s, the self-help zones on the Citizen Access Workstation Services, (CAWS) recorded over 1.3 million activities related to EI. This represents close of 30% of all CAWS activities.
The breakdown of the types of In-Person services provided on the EI Program in FY1920 is as follows:
- follow-up assistance - 1,297,519 or 50.4%
- general information – 1,218,173 or 47.3%
- help with applications – 56,551 or 2.2%
- processing support – 2,182 or 0.1%
Community Outreach and Liaison Service (COLS)
COLS provides access to programs, services and benefits to clients where they live and/or spend time. It focuses on clients facing distinct access barriers. COLS also increases awareness and uptake of programs and services. Among others, they provide:
- EI information at mass layoff sites
- EI application help
- information for employers
Between April 1, 2019 and March 31, 2020, COLS conducted 11,180 outreach activities to 170,486 participants.
COLS support for employers and workers facing labour market adjustments
In times of economic uncertainty, Service Canada may adapt processes and create partnerships with other service providers to meet clients’ needs more effectively. Service Canada outreach staff makes proactive calls to employers at risk of conducting a layoff to promote other mitigation options. These options include the Work-Sharing or the Work-Force Reduction programs. Service Canada conducts information sessions for Work-Sharing for both workers and employers.
Outreach staff delivers EI information sessions (both virtually and in-person when possible) when the Department receives news of a mass layoff.
Outreach staff work with the employer to organize information sessions for employees, in partnership with provincial and territorial governments. The purpose of these joint sessions is to help reduce the stress and worry of employees facing a job loss. They provide participants with important information on:
- when, how, and why they should apply for EI
- how benefits can affect other monies received because of termination (such as severance, pay in lieu of notice)
- other federal programs and services, such as the Canada Pension Plan, Old Age Security, the Job Bank, and My Service Canada Account
The provincial or territorial partner provides information on programs and services available to help participants find suitable employment. This includes information on re-training, resume writing, job search techniques and interview skills. During FY1920, provincial or territorial partners delivered the following EI related information sessions:
- 976 sessions to citizens, with a total of 19,621 participants
- 135 sessions to workers on work sharing, with a total of 3,993 participants and
- 213 sessions to employers, with 610 companies and organizations participating
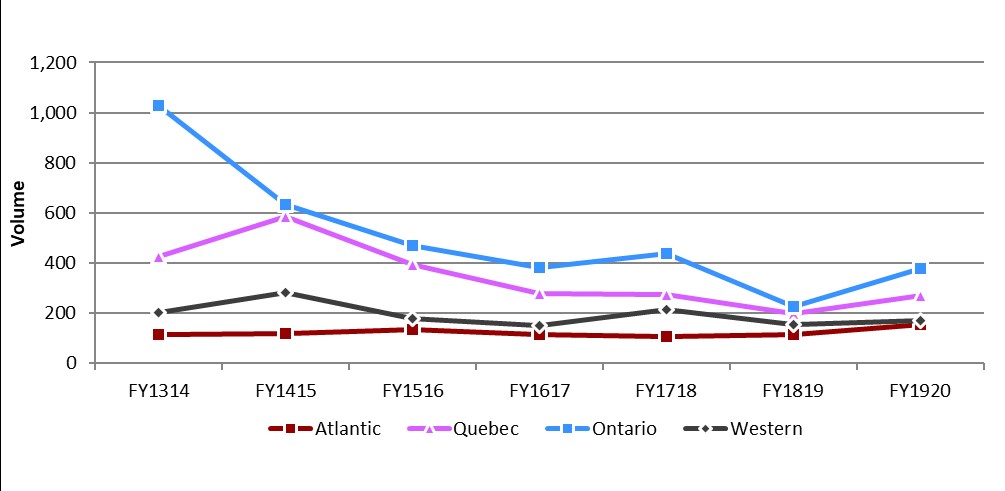
Text description of Chart 1
| Region | FY1314 | FY1415 | FY1516 | FY1617 | FY1718 | FY1819 | FY1920 |
|---|---|---|---|---|---|---|---|
| Atlantic | 114 | 119 | 133 | 115 | 106 | 115 | 155 |
| Quebec | 425 | 586 | 395 | 277 | 274 | 197 | 271 |
| Ontario | 1,029 | 632 | 470 | 381 | 440 | 228 | 380 |
| Western | 202 | 282 | 177 | 152 | 216 | 156 | 170 |
Support to Indigenous communities
In Budget 2018, the Government granted the Department three-year funding to expand outreach efforts to all:
- on-reserve
- remote, and
- Northern Indigenous communities
This includes pilot outreach activities for urban communities so that Indigenous people are better able to access social benefits.
The Department contacted all Indigenous communities and offered them a visit. Many communities received multiple visits where demand existed. These visits have proven successful in increasing awareness of and access to programs, services and benefits. Because of these visits, the Department completed 14,001 service requests, including 1,415 for EI.
4.4 Application intake and claim processing
In this section
4.4.1 Employer intake
Service Canada works with employers to get the accurate information necessary to ensure efficient processing of EI claims. To support employers, the Department offers help through the Employer Contact Centre and online at Canada.ca.
Record of employment
The ROE is a paper or electronic form issued by an employer to give information about an employee’s work history. Employers play a crucial role in EI claim processing by issuing ROE s. They are responsible for providing ROE s to their employees within prescribed time limits as required by the Employment Insurance Regulations (EIR).
Service Canada uses the ROE to determine if a claimant is eligible for EI benefits. If a claimant is eligible, Service Canada uses the ROE to determine the benefit rate for the claim and the length of the claim. In FY1920, employers issued over 13.5 million ROEs. In some cases, employers fail to issue a ROE to cover a period of employment. In these situations, Service Canada agents can create an interim ROE based on other information on file to avoid any delays in the issuance of EI benefits. In FY1920, Service Canada created 37,101 interim ROEs. This represents 0.8% of initial and renewal claims received.
Service Canada encourages employers to register for the online ROE Web application so they can use electronic ROE s (eROEs). The ROE Web application interacts directly with employers’ pay systems. This reduces errors by removing the need for employees to enter their information manually. eROEs also cut down on paper burden.
When Service Canada receives eROEs, the information is instantly available to the EI systems. In this way, the use of eROEs reduces the time required to obtain and input information, resulting in quicker claims processing.
In FY1920, there was a 2.3 % increase in the number of ROEs submitted electronically using eROEs, from 92.3% (FY1819) to 94.6%. As well, 45,849 more employers registered for ROE Web, the secure online application employers use to create eROEs.
4.4.2 Claimant application intake
Claimants use the online AppliWeb tool to apply for EI benefits. In FY1920, 99.1% of applications for EI benefits were from claimants who used the AppliWeb to submit them. The remaining 0.9% of applications were from claimants who used paper forms to submit them.
Claim volumes
In FY1920, Service Canada received 4,458,841 initial and renewal claims. This was a 59.1% increase (1,656,027) in claims received compared to FY1819. The majority of this increase was due to the spike in job losses at the start of the COVID-19 pandemic in March 2020.
4.4.3 Claims processing
A national network of officers processes EI claims. They sort, review and make decisions about EI applications with support from EI processing systems. These systems automate the processing of EI claims and the management of the workload. EI systems process a fully automated claim without officers having to intervene manually. A partially automated claim requires officers to intervene at some point during processing. In many cases, the systems can finalize the processing of claims requiring officers to manual intervention, once the officers have completed the manual intervention. Fully automated claims make up approximately 30% of claims. Partially automated claims make up 40% of claims, and manual claims make up 30% of claims. In FY1920, the Department processed 3,325,534 EI claims. The Department used partially or fully automated processing for 76.6% of these claims.
In order to avoid delays in the payment of EI benefits, employers must complete ROEs in a timely and correct manner. Failing to issue ROEs, issuing incorrect ROEs or delays in issuing ROEs can impact payments for eligible claimants. Fact-finding with employers or manual interventions may be necessary in order to process these claims.
Speed of payment
Speed of Payment is 1 of 4 EI service standards. The speed of payment service standard is for EI claimants to:
- receive their first benefit payment, or
- be notified that they are not eligible for payments, within 28 days after they submit their application
The Department’s target is to meet this service standard 80% of the time.
The high number of job losses due to COVID-19 in March 2020 resulted in a sudden large increase in EI applications in the last weeks of the fiscal year. Despite this, Service Canada met the speed of payment standard for 80.0% of claims in FY1920. The average time for eligible claimants to receive a first payment in FY1920 was within 19 days of filing an application. Partial and full automation of applications played a major role in helping the Department meet its target.
In some cases, automated processing of an application is not possible because manual interventions are required. When this happens, delivery of EI benefits can sometimes be delayed.
Examples of manual interventions that officers may have to make to process an EI application include:
- contacting clients to get missing ROEs
- contacting claimants to clarify information
- contacting employers for fact-finding related to the claimant’s ROE or employment history
4.5 Recourse
In this section
4.5.1 Employment Insurance request for reconsideration
If claimants or employers disagree with a decision made related to an EI claim, they have the right to ask Service Canada to reconsider the decision. A request for reconsideration provides clients with the opportunity to submit new or more information, and to have Service Canada review the decision.
The service standard is to finalize requests for reconsideration within 30 days of when Service Canada received the request. Service Canada’s target is to meet this standard 70% of the time. In FY1920, Service Canada reached its target for 76.2 % of the requests. This is an increase of 5.4 percentage points, from 70.8% in FY1819. In FY1920, the CEIC received 48,297 requests for reconsideration. Requests for reconsideration volumes have been stable, over the past 5 years. The average time to complete a request for reconsideration in FY1920 was 27 days.
The EI Act allows clients to request a reconsideration of almost any decision related to an EI claim. The following chart shows the types of decisions that claimants or employers submitted for reconsideration in FY1920 (consult chart 2):

Text description of Chart 2
| Types of decisions | Percentage |
|---|---|
| Voluntary leaving without just cause | 25.7% |
| Unavailability for work | 13.6% |
| Not meeting the eligibility requirements to establish a claim | 9.3% |
| Penalty imposed for providing false or misleading information | 9.2% |
| Dismissal for misconduct | 7.9% |
| Antedate | 5.3% |
| Earnings-post audit | 4.4% |
| Allocation of earnings | 4.3% |
| Claim procedure | 3.9% |
| Sickness | 3.8% |
| Other | 12.5% |
The officer who made the first decision is not the one who does the reconsideration. A different officer considers all information on file, as well as the legislation and policies that apply. Because of the review, the first decision is either kept, reversed or changed. Once an officer completes the review, Service Canada informs the client of the outcome.
In FY1920, 52.0% of reconsidered decisions were reversed or changed following review. There a few common reasons for reversing or changing a decision. These include identifying errors made by Service Canada, and receipt of new or additional information from the client.

Text description of Chart 3
| Fiscal year | Percentage |
|---|---|
| FY1516 | 45.9% |
| FY1617 | 50.6% |
| FY1718 | 49.9% |
| FY1819 | 52.6% |
| FY1920 | 52.0% |
4.5.2 Employment Insurance sickness benefits class action
Prior to 2013, claimants could not switch from parental benefits to sickness benefits unless they could show that they were otherwise available for work.
Since March 24, 2013, new rules in the Employment Insurance Act allow parents to switch to sickness benefits if they:
- fall ill while receiving parental benefits, or
- are injured while receiving parental benefits
They can then go back to collecting their remaining parental benefits, if needed, after their sickness benefits have been paid out.
Mrs. Jennifer McCrea sued the Federal Government of Canada. She alleged that during the period from March 3, 2002 to March 23, 2013, officials with Service Canada and the CEIC were negligent in denying sickness benefits to individuals who were:
- in receipt of parental leave benefits, and
- were ill, injured, or in quarantine
In January 2019, the Federal Court approved a settlement agreement to resolve a class action between the federal government and parents. Between 2002 and 2013, the parents applied for EI sickness benefits while in receipt of EI parental benefits and were denied.
Service Canada received a total of 942 claim forms, representing 1,052 periods of sickness. Out of the 1,052 periods of sickness, Service Canada approved 789 for payment. Service Canada denied the other 263 since they did not meet the eligibility criteria outlined in the Settlement Agreement. This represents a total pay-out of $3,299,443 (excluding legal fees).
As of March 31, 2020, ESDC had fulfilled its obligations as the Court-appointed Administrator under the Settlement Agreement. The Federal Court issued an Order confirming the successful implementation of the Settlement Agreement. It formally discharged the Department, Class Counsel and the Monitor from the obligations assigned to each under the Settlement Agreement.
Order and reasons
In her Order and reasons terminating administration of the claims process for the Settlement Agreement, the Honourable Madam Justice Kane indicated that “The Court is satisfied that the Settlement Agreement has been fully implemented in a spirit of cooperation, and that the claims have been adjudicated, reviewed and finally determined.” She further noted that “The Reports of the Administrator and the Monitor both convey that the Department of ESD[C]very effectively administered the claims in a timely manner, communicated with potential claimants, responded to their inquiries and advised claimants of the review process for disputed claims.”
According to Justice Kane, the Monitor’s Report “praised the spirit of cooperation and commitment of the team at the Department of ESD[C] to reach out to potential claimants, respond to claims, and accurately determine the amount to be paid. The Monitor’s review of claims confirms that those administering the claims were thorough and accurate.” While the action had been “a long journey,” the Justice concluded that “the administration of the Settlement Agreement has been professional, fair and timely” and “the outcome is regarded as a success by all parties.”
4.5.3 Employment Insurance appeals and the Social Security Tribunal of Canada
The Social Security Tribunal of Canada (SST) is an independent administrative tribunal that makes quasi-judicial decisions on appeals related to the:
- Employment Insurance Act
- Canada Pension Plan, and
- Old Age Security Act
The SST operates at arm's length from the Department and the CEIC. The following groups fund its activities:
- the EI Operating Account
- the CPP Operating Account, and
- the Consolidated Revenue Fund for OAS cases
The SST’s mandate is to provide Canadians with the client-centric appeals system they rightly expect. This occurs through an appeals process that is fast, simple and transparent. There are 3 divisions at the SST:
- the General Division - Employment Insurance hears appeals of EI reconsideration decisions
- the General Division - Income Security hears appeals of CPP and OAS reconsideration decisions
- the Appeal Division hears EI and Income Security appeals, based on restricted grounds, of General Division decisions
Members appointed by the Governor in Council decide these appeals.
For the purposes of this report, only EI appeals to the General Division and the Appeal Division are examined.
More information:
For the Tribunal’s 2020 Progress Report – “Helping people access justice”, visit 2020 Progress report.
SST – General Division, Employment Insurance section
When the CEIC makes a reconsideration decision, a client has 30 calendar days to appeal the decision to the General Division-EI.
On behalf of the CEIC, Service Canada is responsible for providing the General Division-EI with the reconsideration file. The reconsideration file includes all relevant documents used in making and reviewing the initial decision. When requested, CEIC will also answer any questions or requests for more information from the SST member and may participate in appeal hearings.
Service standards and performance
According to the legislation, CEIC, through Service Canada, must provide the General Division-EI with:
- all relevant documents, and
- its representations on the issue under appeal
CEIC must provide those materials to the SST 7 days from the time CEIC is notified of an appeal. For the FY1920 reporting period, CEIC sent 97% of reconsideration files to the General Division-EI within 7 days, as opposed to 87% in FY1819. The lower percentage in FY1819 was due to a large group appeal including 400 appeals.
For the purposes of performance measurement, the SST manages and tracks EI appeals in 2 categories:
- regular appeals
- group appeals
A group appeal includes more than 1 claimant appealing decisions made in the same or a similar matter. For example, the SST considers the appeals together as 1 group when multiple claimants of the same employer:
- lose their jobs under similar circumstances, and
- do not agree with the reconsideration decision
Group appeals tend to be more complex and require more time to complete.
The SST has succeeded in reducing the number of cases waiting for a hearing. Therefore, the SST was able to put in place tighter timeframes for dealing with most cases at the General Division – EI. Up until the FY1920, the service standard was to finalize 85% of decisions within 90 days. In FY1920, the SST reviewed that service standard. The new goal was to complete 80% of decisions within 45 days from the date the appeal is filed with the Tribunal. This service standard applies to regular (non-group) appeal cases. Establishing this new standard at the General Division – EI speaks directly to the recommendations of the EI Service Quality Review.
In the first quarter of FY1920, the SST met the service standard 44% of the time. However, because of various measures put into place, by the last quarter of FY1920, the SST met that standard 71% of the time. The SST focused on improving how it processes appeals, and the result has been that, overall, it takes less time to handle appeals. For the month of March 2020, it took 42 days to conclude a regular EI appeal. The average for the previous FY1819 was 142 days.
The number of cases that are waiting to be heard has also gone down.
| Appeal information | Number of regular files | Number of group files | Total number of files |
|---|---|---|---|
| Appeals in progress April 1, 2019 | 667 | 655 | 1,322 |
| Appeals received | 3,813 | 114 | 3,927 |
| Appeals concluded | 3,980 | 562 | 4,542 |
| Appeals in progress at March 31, 2020 | 500 | 207 | 707 |
The SST has published a progress report on its performance in FY1920 titled “Helping people access justice”. Please visit the 2020 Progress report for more statistics pertaining to the Tribunal’s performance and service standards.
Outcomes at the General Division - EI
An appeal to the General Division may be concluded by a withdrawal or a written decision.
Chart 4 below shows the number of SST concluded appeals by possible outcomes:
- concessions – Service Canada recommends that the Tribunal allows the appeal
- late appeals denied – the Tribunal refuses the appeal filed beyond the 30-day deadline
- summary dismissals – the Tribunal decides, based on the information in the file, that the appeal has no reasonable chance of success
- withdrawn/other – client either withdraws or abandons the appeal
- allowed – decision is in the client’s favour
- denied – not in the client’s favour

Text description of Chart 4
| Outcome | Regular |
|---|---|
| Allowed | 1143 |
| Concession | 146 |
| Favourable to the Commission | 2309 |
| Late Appeal Denied | 99 |
| Summary Dismissals | 77 |
| Withdrawn/Other | 206 |
SST – Appeal Division, Employment Insurance section
When a party to the appeal—the claimant, the employer or the CEIC —disagrees with the decision made by the General Division - EI, it may dispute this decision at the SST ’s Appeal Division. With the exception of appeals summarily dismissed by the General Division, the first step at the Appeal Division is to file an application for leave to appeal. The Appeal Division will grant leave, or permission, to appeal if there is an arguable case. The grounds of appeal to the Appeal Division are limited to certain errors of fact, law, jurisdiction and natural justice.
Service standards and performance
The Appeal Division had the following Service Standards for regular appeals:
- decisions on leave to appeal made within 60 days, 85% of the time
- final decisions made within 210 days of the leave to appeal, 85% of the time
The SST met the service standards in FY1920. The results were:
- 94% of leave to appeal decisions issued within 60 days, and
- 94% of final decisions issued within 210 days of leave granted
On average in FY1920, it took 24 days from application to a leave to appeal decision. It took 106 days (or approximately 3.5 months) from the date the leave to appeal was granted to a final decision.
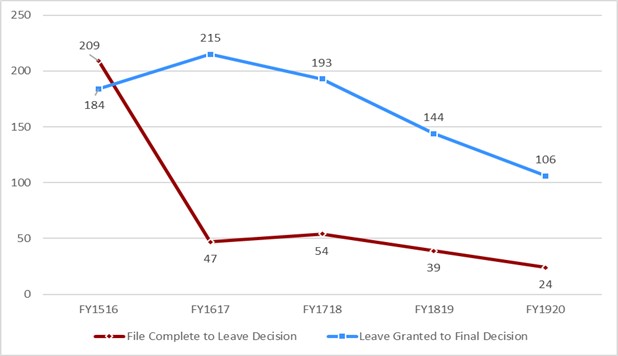
Text description of Chart 5
| Fiscal year | File complete to leave decision | Leave granted to final decision |
|---|---|---|
| FY1516 | 209 | 184 |
| FY1617 | 47 | 215 |
| FY1718 | 54 | 193 |
| FY1819 | 39 | 144 |
| FY1920 | 24 | 106 |
At the end of FY1920, the Appeal Division’s inventory included 3 group appeals (461 appellants) and 72 regular appeals.
| Appeal information | Number of regular files | Number of group files | Total number of files |
|---|---|---|---|
| Appeals in progress April 1, 2019 | 147 | 167 | 314 |
| Appeals received | 494 | 469 | 963 |
| Appeals concluded | 569 | 175 | 744 |
| Appeals in progress at March 31, 2020 | 72 | 461 | 533 |
Outcomes at the Appeal Division
An appeal to the Appeal Division may be concluded by a withdrawal or a written decision.
Chart 6 below shows the number of concluded appeals by possible outcomes:
- late appeals denied – the Appeal Division refuses the appeal filed beyond the 30-day deadline
- leave to appeal is denied – the Appeal Division denies permission to appeal
- withdrawn/other – appellant either withdraws or abandons the appeal
- allowed – decision is in the appellant’s favour
- denied – decision unfavourable to the appellant
During FY1920, the Appeal Division expanded alternative dispute resolution (ADR) to EI files. In ADR, parties look for ways to resolve their appeal informally, with the help of an Appeal Division member. There are 3 possible outcomes to ADR:
- a settlement of some or all of the issues under appeal;
- withdrawal of the appeal, or
- if the parties do not reach an agreement, the appeal returns to the regular appeal process
Over the course of FY1920, 49 EI appeals went through ADR, and 42 of those appeals were resolved by agreement.
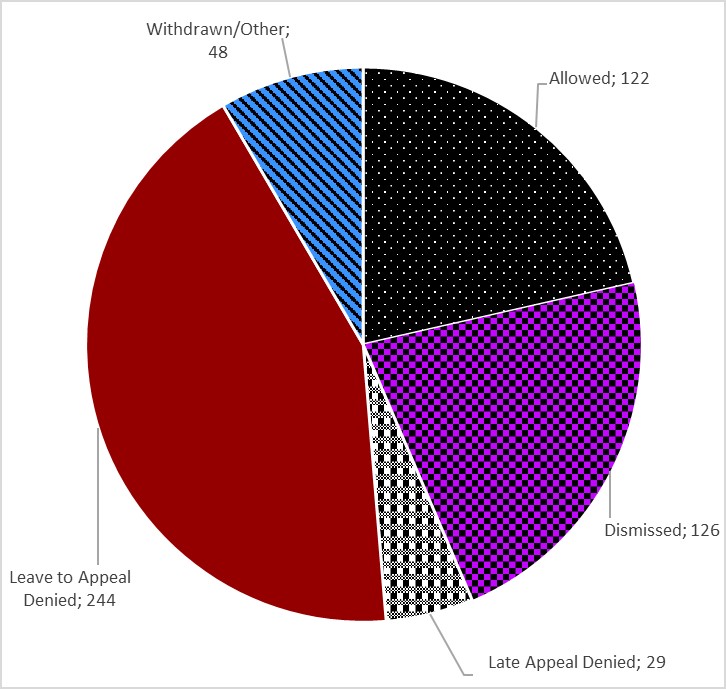
Text description of Chart 6
| Outcome | Regular |
|---|---|
| Allowed | 122 |
| Dismissed | 126 |
| Late Appeal Denied | 29 |
| Leave to Appeal Denied | 244 |
| Withdrawn/Other | 48 |
Social Security Tribunal review
In FY1718, the Minister of Families, Children and Social Development ordered a review of the SST. Some reports had found that the appeal process took too long, especially for EI claimants. The review looked at the overall recourse process between 2013 and 2016. The overall recourse process is the whole system individuals have to navigate when they do not agree with a decision. It starts when an individual asks Service Canada to reconsider a decision about their claim. The next step is to appeal to the SST.
The review assessed how efficient, fair, and transparent the overall recourse process was in those years. It also pointed out ways to make the system better for the people who use it.
The “Review of the Social Security Tribunal of Canada” came out in January 2018. It made several recommendations. Based on those recommendations, the Government put together an in-depth plan to make the process better. The main idea behind the plan was to make the recourse process more client-centric, simple, and quick.
In March 2019, the 2019 Budget announcement confirmed an investment of $253.8 million over 5 years, starting in FY1920. The investment is $56.7 million a year to make the EI, CPP and OAS recourse process more responsive to Canadians. It remains to be seen how Covid-19 will impact the associated spending identified in this five-year plan.
Improvements made since the review
Operational improvements made in FY1819 following the review included:
- simplifying the criteria to get an appeal started
- giving appellants their choice of form of their hearing at the General Division
- introducing a virtual videoconferencing option
- publishing more General Division-EI decisions
The SST built on these improvements in FY1920:
- the SST now proactively reaches out to appellants to have them complete their applications. As a result, SST has reduced delays in opening appeal files from 39 days to 3 days, on average
- the SST introduced HTML forms and offers appellants the option of submitting their application by email
- every final Appeal Division decision is published along with the related General Division decision, providing an appeal’s full history on the website
- the SST provided training to staff and Tribunal Members in plain language writing. Tribunal letters that were once at a university reading level have been rewritten to be clear and simple. Progress is being made towards ensuring that decisions are easier to understand
- the SST trained employees who work directly with the public over the phone on how to communicate clearly
- since May 2019, the Appeal Division has scheduled hearings earlier in the process (as soon as permission to appeal is granted), to reduce the time to decision
- since June 2019, the SST has partnered with an independent distress and crisis helpline to support appellants who demonstrate a need for immediate support
- since December 2019, the SST has been surveying claimants to evaluate and improve operations. The feedback received is published on the SST’s website. The surveys show very favourable results
- ADR is offered for suitable appeals at the Appeal Division
- the SST continues to offer parties the option of joining a hearing by videoconference from their home or office
All of these improvements have made the process more client-centric. And, the time it takes for an appellant to get their decision has dropped from 227 days (at the time of the review) to 42 days (in March 2020) at the General Division – EI. At the Appeal Division, the time it takes to get leave and final decisions has dropped. It has dropped from 70 and 193 days (at the time of the review) to 24 and 85 days (in March 2020). The number of cases that are waiting to be heard has gone down. It has gone down from 667 at April 1, 2019, to 500 at March 31, 2020 at the General Division – EI. It went down from 147 to 72 at the Appeal Division (both excluding group appeals).
Impact of COVID-19 on the SST operations
The global COVID-19 pandemic had minimal impact on the SST ’s service delivery. Given the fact that it is already an “e-Tribunal”, some Secretariat staff and all Tribunal members were equipped to work from home. This has enabled operations to continue.
Hearings proceeded by phone or videoconference. To respect the appellant’s form of hearing preference, cases have been put on hold for those that chose to have their hearing in person. In addition, email communication with appellants and parties to an appeal helped the appeal process continue. Processing times and inventory remained steady at the onset of the COVID-19 pandemic. 332 General Division-EI appeals were finalized in March, compared to 340 in February. Similarly, the Appeal Division finalized 46 EI appeals in March, compared to 41 in February. In February, General Division-EI appeals were finalized within 38 days from the time the appeal is received. In March, this increased only slightly to 42 days.
Client representation at the SST and most frequently appealed issues at the General Division-EI
At each level of appeal, appellants can choose to either represent themselves or have a representative (formal or informal, such as a friend or family member) assist them during the appeal process.
Charts 7 through 10 indicate the percentage of allowed appeals based on clients with or without representation for the General Division – EI, and the Appeal Division.
Note on charts: Percentage allowed rate is based on final decisions (allowed and dismissed) only. Appeals with representation include files with any type of representative:
- professional
- personal
- advocacy group
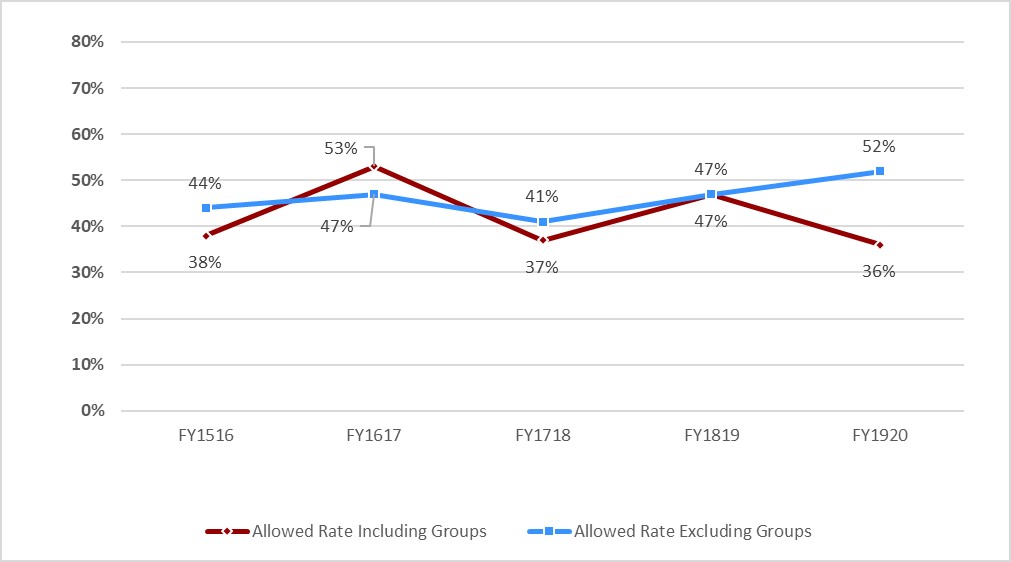
Text description of Chart 7
| Fiscal year | Allowed rate including groups | Allowed rate excluding groups |
|---|---|---|
| FY1516 | 38% | 44% |
| FY1617 | 53% | 47% |
| FY1718 | 37% | 41% |
| FY1819 | 47% | 47% |
| FY1920 | 36% | 52% |
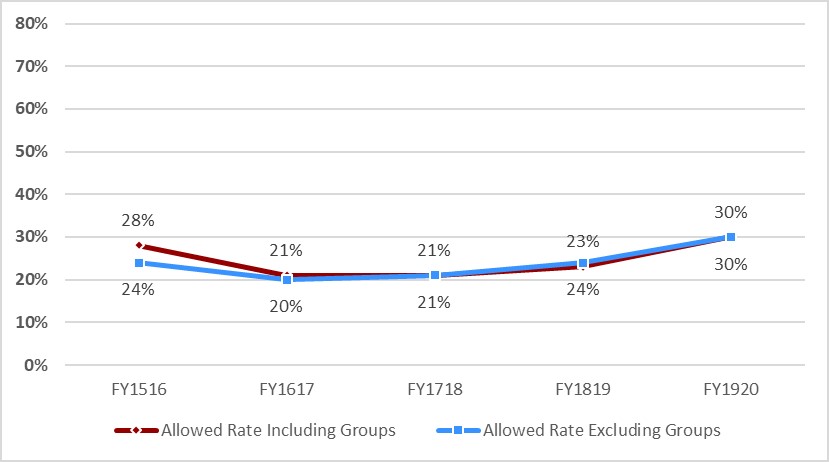
Text description of Chart 8
| Fiscal year | Allowed rate including groups | Allowed rate excluding groups |
|---|---|---|
| FY1516 | 28% | 24% |
| FY1617 | 21% | 20% |
| FY1718 | 21% | 21% |
| FY1819 | 23% | 24% |
| FY1920 | 30% | 30% |
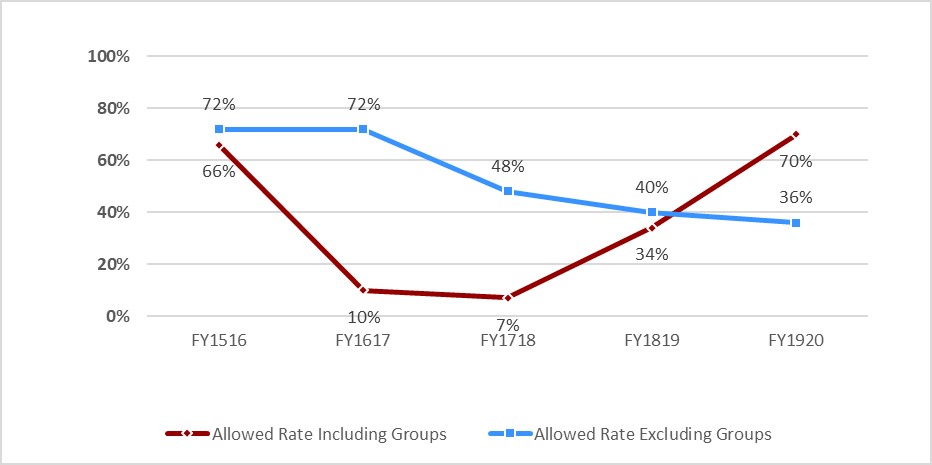
Text description of Chart 9
| Fiscal year | Allowed rate including groups | Allowed rate excluding groups |
|---|---|---|
| FY1516 | 66% | 72% |
| FY1617 | 10% | 72% |
| FY1718 | 7% | 48% |
| FY1819 | 34% | 40% |
| FY1920 | 70% | 36% |
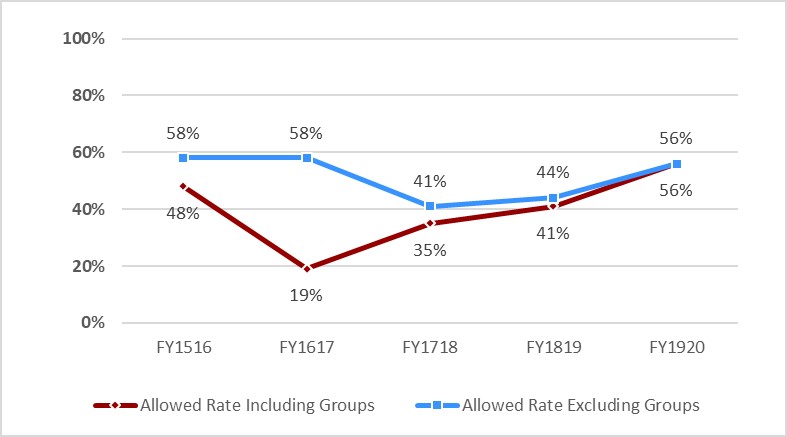
Text description of Chart 10
| Fiscal year | Allowed rate including groups | Allowed rate excluding groups |
|---|---|---|
| FY1516 | 48% | 58% |
| FY1617 | 19% | 58% |
| FY1718 | 35% | 41% |
| FY1819 | 41% | 44% |
| FY1920 | 56% | 56% |
The issues most frequently challenged in an appeal to the General Division-EI remain constant from year to year (consult chart 11 ).
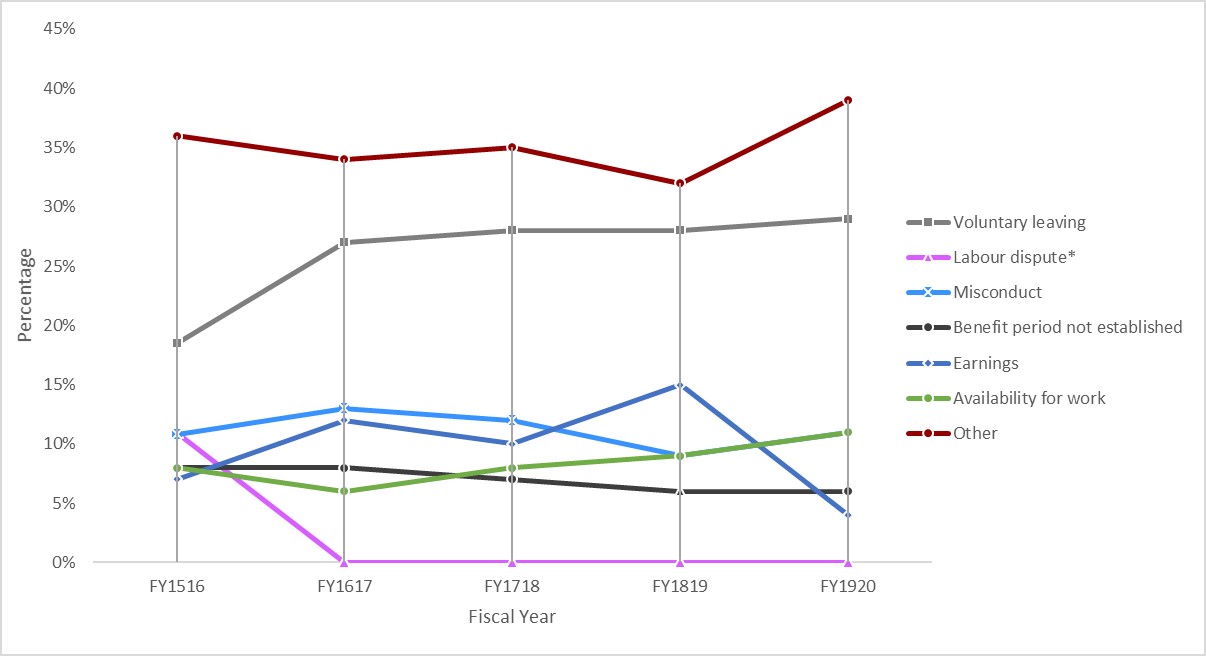
Text description of Chart 11
| Fiscal year | Voluntary leaving | Labour dispute* | Misconduct | Benefit period not established | Earnings | Availability for work | Other |
|---|---|---|---|---|---|---|---|
| FY1516 | 19% | 11% | 11% | 8% | 7% | 8% | 36% |
| FY1617 | 27% | 0% | 13% | 8% | 12% | 6% | 34% |
| FY1718 | 28% | 0% | 12% | 7% | 10% | 8% | 35% |
| FY1819 | 28% | 0% | 9% | 6% | 15% | 9% | 32% |
| FY1920 | 29% | 0% | 11% | 6% | 4% | 11% | 39% |
- Source: EI administrative data.
- *The chart illustrates the issue of Labour Dispute only in FY1516. In later years, Labour Dispute was no longer among the issues most frequently appealed to the SST General Division - EI
4.5.4 Recourse of the future
Following the review, in March 2019 the 2019 Budget announcement confirmed an investment of $253.8 million over 5 years, starting in FY1920. The investment is $56.7 million a year to make the EI, CPP and OAS recourse process more responsive to Canadians. Further, in August 2019, the Government announced its intention to implement a recourse process that is simpler, faster, more client-centric, and best meets the needs of workers and employers through the creation of a new tripartite decision-making tribunal called the Employment Insurance Boards of Appeal. Due to the challenges created by COVID-19, it is no longer feasible to implement the EI Boards of Appeal and other legislative changes associated with EI recourse process in April 2021. Changes to the EI recourse process will continue to advance in parallel with the ‘EI system for the 21st century’ work announced in the September 23, 2020, Speech from the Throne.
4.6 Service transformation to improve service delivery
In this section
- 4.6.1 Service Transformation and the Benefits Delivery Modernization (BDM) Programme
- 4.6.2 Call Centre Improvement Strategy
To support the Government of Canada’s commitment to improving services to Canadians, ESDC launched an internal Service Strategy in 2016. It continues to evolve and improve as technologies and expectations advance.
In 2017, the Department launched the Service Transformation Plan (STP) in order to achieve the goals and commitments of:
- the Government of Canada, and
- ESDC Service Strategies
The Department also launched the STP to respond to the recommendations from the Employment Insurance Service Quality Review (EI SQR). This Plan has continued to serve as the roadmap for the transformation and modernization of ESDC’s services. It helps advance ESDC’s vision for improving 4 dimensions of client service excellence:
- experience: providing clients with a world-class experience delivering benefits whenever they need them with a focus on digital self-service
- quality: clients receive high-quality, accurate services and decisions, no matter where they live and, when possible, have their needs anticipated
- timeliness: delivering benefits and services to clients in a timely fashion and resolving clients' issues at first point of contact
- access: services, delivered by a well-equipped and knowledgeable workforce, are 100% accessible to clients with digital by choice everywhere
4.6.1 Service Transformation and the Benefits Delivery Modernization (BDM) Programme
As an important part of the Department’s STP, the BDM Programme is designed to significantly transform the client experience. It transforms the EI, OAS and CPP programs through a modern technology platform. This will streamline benefits processing, new digital services, and enhanced service management capabilities. Using a phased-in approach, this large-scale transformation is expected to achieve a total of 18 outcomes by 2030. This supports its overall goals of: Service Excellence, Policy, Agility and Transformed Organization. As BDM is currently in the programme definition phase, benefits to EI clients will be reflected in future EI Monitoring and Assessment reports.
Between April 2019 and March 2020, the Department also delivered the following STP initiative, which will positively impact EI clients:
- developed the Client Centric Policy Playbook: The Playbook provides ESDC employees with a collection of:
- best practices
- tools and resources for engaging clients, and
- better understanding of their needs
- enhanced the existing online benefits finder tool: It is now easier and more intuitive for Canadians to find out about benefits. The tool continues to be used at about 20-25,000 visits a week (higher during COVID peaks)
Employee engagement
Service Canada is developing a strong service culture by ensuring employees have the proper training, tools, and expertise necessary to provide the best quality service possible to Canadians. Employee engagement is also key to maintaining this culture. The Department’s employees have the opportunity to voice their opinion and engage in service improvement through multiple initiatives.
Examples of employees engagement initiatives held in FY1920:
- Ask Me Live! is a bilingual event that gives employees from coast-to-coast the opportunity to chat live with senior management and business experts on pertinent topics surrounding the transformational changes happening across ESDC
- EI Continuous Improvement initiatives focus on improving processes, procedures and operational policy and aim to improve client access and processing efficiency. One important achievements of this project was to allow processing officers to deliver benefits in a more timely way by connecting directly with applicants through emails
- employee engagement sessions focus on getting employee feedback on several topics. Through the sessions, employees provided input on the simplification and improvement of the EI program delivery
- in FY1920, ESDC continuously reported on employee engagement
Connecting with clients through email
In FY1920 Service Canada put in place a new procedure to improve service to EI claimants. When information or documentation is missing for an EI claim and the claimant can’t be reached immediately by phone, processing officers can now send an email to ask the claimant to call them.
In the past, if a processing officer needed to speak with the claimant for information, the officer would call the claimant twice over a span of 48 hours. If the claimant couldn’t be reached, Service Canada would send a follow-up letter by Canada Post asking the claimant to call. The processing officer would have to wait several days for the claimant to receive the notice by mail and make the call.
Processing officers suggested that emailing claimants would be much more efficient. To make sure claimants knew that the emails sent by processing officers were not part of a phishing scam, steps were taken to inform claimants of the new approach. Procedures were put in place in all service delivery channels:
- phone
- online
- in person
This simple but important change is allowing processing officers to deliver benefits in a more timely way by connecting more quickly with claimants.
4.6.2 Call Centre Improvement Strategy
As part of its ongoing response to the recommendations of the Service Quality Review, the Department continues to advance its Call Centre Improvement Strategy. This strategy is a transformation initiative that leverages industry best practices. It also implements ongoing business and technology improvements to increase accessibility and enhance services to clients. The Strategy includes a number of key components such as:
- Call Centre Platform
- Accountability Framework
- Review of new employee training, and
- Post Training Transition Strategy
Call Centre Platform
ESDC has implemented the HCCS. It is a modern and supported technology that enhances functionalities to support the Department’s future business requirements. On March 9, 2020, HCCS was implemented for the EI call centre network.
With the new system, claimants calling EI simply enter their social insurance number and Access Code to submit claimant reports. Callers now reach a redesigned menu with improved options and overall navigation to indicate the type of help they need. This menu also allows for greater flexibility in routing specific types of calls to designated groups of agents. It also opens the potential of targeted training on specific enquiry types to get new agents on the phone, answering calls faster. This will be piloted in the next fiscal year.
Along with the redesigned menu, new IVR scripts were written and recorded. Following industry best practices, messages were written clearly, concisely and in plain language so clients could easily understand them. The messages were focus-tested with citizens before they were released. They simplify the messages that clients hear when they call the EI call centres.
HCCS brought forward many other operational improvements including functionality such as Computer Telephony Integration. This functionality passes information to the agent via a screen pop with information captured in the IVR from the caller. Call centre agents are now able to see relevant information on their screen and are ready to provide service.
In implementing HCCS, the Department delivered on its commitment to Canadians, as stated in the:
- 2019 Spring Report of the Auditor General of Canada on Call Centres, and
- previous Monitoring and Assessment Reports
The implementation in March allowed call centres to increase the capacity of both the IVR and the queue to speak to an agent. This happened as the COVID-19 pandemic started to have an impact on Canadians.
The implementation of the HCCS enables EI and Employer Contact Centre agents to answer calls from any location using any phone. This was critical to ESDC’s response to the COVID-19 pandemic, as it permitted agents to telework.
Accountability Framework
The Accountability Framework is intended to improve service to Canadians by internally monitoring key performance metrics in five areas: financial, productivity, client satisfaction, employee satisfaction, and quality. Following consultations with private industry, the key elements were identified to monitor call centre productivity and align with industry best practices. The Accountability Framework developed performance measurements to monitor financial performance, productivity, and call quality. The Accountability Framework will develop future performance measures to assess client satisfaction and employee satisfaction. The Framework will internally monitor these elements to support call centres in delivering service that meets the service standards.
Review of new employee training
Launched in March 2018, the Call Centre Improvement Strategy (CCIS) training review working group had undertaken a review of the call centre training program in FY1819.This helped develop more training materials to support agents. In June of 2019, the group reconvened to complete the implementation of the revised materials (case studies, tests) into the curriculum. More introductory and review activities were developed. This helped facilitate the learning on 6 of the modules that were identified as more difficult to reduce the learning curve for new hires. The last part of the project was to reorganize the curriculum with the intent to split the training into phases. Work on new employee training will continue to evolve, particularly in consideration of ongoing benefit delivery modernization transformational projects.
Post Training Transition Strategy
The Department developed the Post Training Transition Strategy in response to recommendations from the CCIS. It is intended to facilitate the transition of new employees from in-class learners to independent call centre agents. The Department designed the strategy to reduce the learning curve of new agents by providing optimized support and a more meaningful assessment methodology. Improved new agent performance can both help increase the accessibility of call centres, and ensure a continued enhancement of the client experience.
During the FY1920, the lessons learned from the pilot project of 2018 as well as recommendations from the CCIS were examined and presented to management. A number of operational procedures, program tools and guidance documents were initiated and others were reviewed. More consultation and engagement with various stakeholder also occurred. Both regional and national feedback and recommendations were incorporated in the procedures for a more prescriptive and structured Post Training Transition Strategy.
4.7 Service quality
In this section
- 4.7.1 Employment Insurance Payment Accuracy Review
- 4.7.2 Employment Insurance Processing Accuracy Review
- 4.7.3 Individual Quality Feedback
Canadians expect sound stewardship and accountability from the EI program. ESDC has well-established activities, processes, and tools in place to prevent, detect and manage error, fraud and abuse. This is to ensure that the right benefits are paid to the right person, in the right amount. These efforts improve the quality of EI services, strengthen the integrity of ESDC programs and demonstrate effective and prudent stewardship of public resources.
Service Canada’s policies, processes and information technology systems are designed to ensure that EI contributions are handled appropriately, and claims are handled correctly the first time.
The Department also has mechanisms in place to ensure that the calculated amount claimants receive are accurate. These mechanisms include:
4.7.1 Employment Insurance Payment Accuracy Review
With the goal to reduce errors, ESDC validates the information provided by the claimant at the start of the claim’s process. Through the Payment Accuracy Review (PAAR) program, ESDC also controls the quality of the claims once established. This additional verification provides an indicator of the of the program’s overall payment accuracy.
EI PAAR sample
As indicated above, using a monetary unit sampling (MUS) methodology, the EI PAAR program estimates the accuracy of EI benefit payments. The Department reviews a number of files each year to identify undetected errors that result in possible mispayments. This categorizes them as either a potential underpayment or potential overpayment.
It is important to note that getting the information required and validating a claim through the PAAR program takes an average of 12 weeks. Information sources may include the claimant, the employer and the Department. As such, PAAR generally starts reviews for a given fiscal year in July of that fiscal and completes them in June of the following year. However, in March 2020, because of the COVID-19 pandemic, all quality programs including EI PAAR were suspended. The Department suspended all quality programs in order to redeploy staff to focus on paying Canadians.
With payment stability gained within the scope of COVID-19 payments, the Department reinstated the EI PAAR program late in July 2020. Given the lost time to carry out PAAR reviews using the standard process, the PAAR sample for the last 4 month’s of reviews was reduced from 42 files per month to 13. This reduction occurred in consultation with key partners such as the Office of the Auditor General (OAG). Similarly, in agreement with the OAG, a few steps in the PAAR process such as the ROE validations were either modified or omitted. Nevertheless, the integrity of the results were maintained throughout.
Because of these changes, PAAR results for the FY1920 are based on a sample of 388 reviews instead of the usual 500 files. Of the 388 reviews, 336 were completed following the regular PAAR process and 52, under the modified PAAR program. This reduced number of files still allows for statistically valid results based on the standards and procedures established and approved by OAG.
EI PAAR results
ESDC has an established target accuracy rate of 95%Footnote 9 in benefit payments per year. This rate includes claimant, employer and Services Canada errors. Together, claimants, employers and the Department have maintained an accuracy rate of approximately 95.0% over the last 15 years. During this reporting period, the overall accuracy rate reached 94.1%Footnote 10 Footnote 11 (consult table 4 ). Four potential errors remain outstanding and may be contributing to a lower accuracy rate. A final accuracy rate will be available once all potential errors have been resolved.
Annual results can be found in the financial audit of the EI account. The Office of the Auditor General reports these results each year in the Public Accounts of Canada.
Error rate by sources
Table 4.1 and 4.2 —EI Payment Accuracy Review: Estimated financial impact of errors and estimated error rate, by sources (based on PAAR sample)
| Fiscal Year | FY1819 | FY1920 |
|---|---|---|
| Total EI Benefit payout | 17.5B | 17.9B |
| EI Payment Accuracy Rate | 96.0% | 94.1% |
- Note: Estimated financials impacts are the sum of overpayments and underpayments.
- Source: Employment and Social Development Canada
| Errors by source: | Estimated financial impact ($M) –FY1819 | Estimated error rate – FY1819 | Estimated financial impact ($M) –FY1920 | Estimated error rate – FY1920 |
|---|---|---|---|---|
| Total | $693.1 | 4.0% | 1.1B | 5.9% |
| Client | $ 312.0 | 1.8% | $565.9 | 3.2% |
| Employer | $ 232.7 | 1.3% | $149.2 | 0.8% |
| ESDC | $ 148.4 | 0.9% | $340.8 | 1.9% |
- Note: Estimated financials impacts are the sum of overpayments and underpayments.
- Source: Employment and Social Development Canada
Claimant error rate
This year, the claimant error rate increased from 1.8% to 3.2% (consult chart 12). Most claimant errors occur after the initial claim is established. For example, 58.9% of the claimant error rate was caused by claimants incorrectly reporting their earnings while in receipt of benefits. Whereas 27.3% of the error rate was due to claimant’s not declaring the refusal of jobs quitting a job, or being dismissed from a job.
The Department continues to assess claimant errors to understand why they happen, the financial impact and how to avoid them.
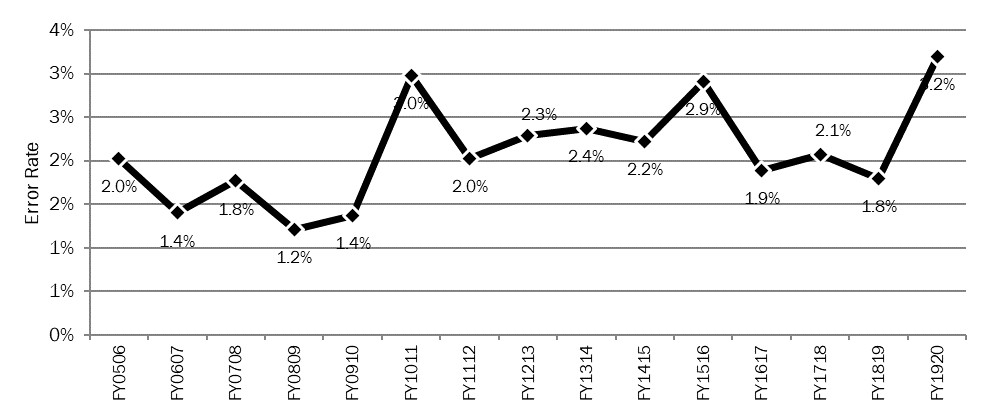
Text description of Chart 12
| Fiscal year | Claimant error rate (percentage) |
|---|---|
| FY0506 | 2.0% |
| FY0607 | 1.4% |
| FY0708 | 1.8% |
| FY0809 | 1.2% |
| FY0910 | 1.4% |
| FY1011 | 3.0% |
| FY1112 | 2.0% |
| FY1213 | 2.3% |
| FY1314 | 2.4% |
| FY1415 | 2.2% |
| FY1516 | 2.9% |
| FY1617 | 1.9% |
| FY1718 | 2.1% |
| FY1819 | 1.8% |
| FY1920 | 3.2% |
- Note: Results are provided with a level of confidence of 95% and a margin of error of ± 5%.
- Source: Employment and Social Development Canada.
Employer error rate
The employer error rate decreased slightly this year, from 1.3% to 0.8%. Incorrect information reported by the employer for each period of employment accounts for 100% of the error rate. In order to identify employer errors, the Department reviews all ROEs used in the PAAR sample to establish a claim. ROEs were validated on all files selected for the April to November reviews due to the COVID-19 pandemic, and the suspension of the EI PAAR program in March. The ROE validations for the December and January reviews were only completed if the employers had returned the validation form. ROEs for the February and March review periods were not validated and could have contributed to the decrease in the employer error rate. The Department continues to improve the tools that eliminate possible sources of error during the first steps of the application submission. The Department also continues to analyze employer errors to understand why these mistakes occur, the financial value, and possible ways to avoid them.
ESDC and Service Canada error rate
ESDC’s efforts to automate processing contributed to maintaining low levels of errors (consult chart 13). Clerical errors, processing errors and inadequate fact-finding errors contributed to the increase of the Service Canada error rate, from 0.9% to 1.9%. It is important to note that year over year variations occur in estimated error rates. Changes observed here are within the margin-of-error (+/- 3%) and may simply be the result of statistical variation. The Department continues to explore opportunities for improvement, including increased automation.
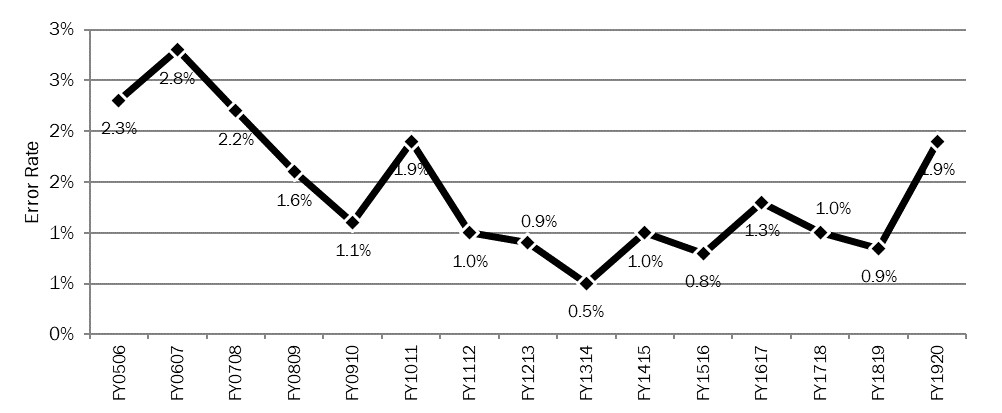
Text description of Chart 13
| Fiscal Year | Claimant error rate (percentage) |
|---|---|
| FY0506 | 2.3% |
| FY0607 | 2.8% |
| FY0708 | 2.2% |
| FY0809 | 1.6% |
| FY0910 | 1.1% |
| FY1011 | 1.9% |
| FY1112 | 1.0% |
| FY1213 | 0.9% |
| FY1314 | 0.5% |
| FY1415 | 1.0% |
| FY1516 | 0.8% |
| FY1617 | 1.3% |
| FY1718 | 1.0% |
| FY1819 | 0.9% |
| FY1920 | 1.9% |
- Note: Results are provided with a level of confidence of 95% and a margin of error of ± 5%.
- Source: Employment and Social Development Canada.
4.7.2 Employment Insurance Processing Accuracy Review
The EI Processing Accuracy Review (PRAR) is a national program that evaluates the aggregate processing health of the EI program. PRAR completes file reviews on claims that Business Expertise Advisors in the regions have recently processed (within 4 weeks).
PRAR sample
Based on a random sample of 3,080 claims per year (770 per region), EI PRAR results measure the percentage of initial claims deemed to be in order. PRAR does this by assessing the degree of conformity to national operational policies and procedures. This year, due to the COVID-19 pandemic, the Department suspended EI PRAR reviews in March 2020 and will not resume until April 2021. As such, PRAR results for this fiscal are based on a sample of 2,823 files (257 files short of the 3080 target). It was processed between April 2019 and February 2020. The PRAR methodology and procedures were unaltered and the number of files reviewed is large enough to ensure the statistical validity of our estimates. The focus will be to continue developing the integrated quality platform (IQP). It will automate the current sampling process, allow for reviews to be conducted across the regions using the same tools and maintain consistency in the delivery of the EI PRAR program.
PRAR results
Of the 2,823 claims reviewed during the fiscal year, 2,371 claims (84.0%) were deemed to be in order. The remaining 452 claims were found to have 1 or more errors on file at the time of review. Within the review of 2,823 files, 7,922 individual processing activities were reviewed; 7,324 processing (92.5%) activities were found to be in order.
4.7.3 Individual Quality Feedback
The Department initially launched the Individual Quality Feedback (IQF) program in April 2016. The Department launch IQF with the intent to bring national standardization to disparate regional individual quality review programs. This was designed to complement the Payment Accuracy Review and the Processing Accuracy Review. The IQF review is an internal ESDC quality control program assessing processing accuracy at the individual level. The results of these reviews help identify training or coaching requirements.
The program was paused in July 2018 to allow for a comprehensive refresh of the program as part of departmental continuous improvement efforts and to address concerns raised by staff and management. A national stakeholder working group was engaged to collaboratively develop the new IQF program.
The Department conducted the IQF national Pilot project from May to September 2019 to test the modernized IQF program. During this time, the IQF program performed 9,457 IQF reviews for the EI program. IQF business processes were streamlined, new user tools were created, and a modern IT platform was developed to automate manual practices and increase process efficiencies. The new Integrated Quality Platform (IQP) includes:
- automated random file-selection
- automated file upload directly from the National Workload System (NWS)
- pre-defined error and observation codes
- enhanced business intelligence, data analysis and reporting capability
The enhancements above increased the IQF work item processing efficiency by 33%. In addition, a calibration process was developed and implemented to ensure consistency in the review of IQF files. This process has reviewers reviewing a common file and annotating their findings. A discussion then takes place to ensure that there is a common understanding of the issues identified. Calibration ensures that the feedback received by personnel is accurate and consistent across all regions. This process proved successful as the program achieved targeted national consistency rates.
The successful calibration results enabled the operational launch of IQF in October 2019. From October 2019 to March 2020, 15,939 IQF EI reviews were conducted and results were shared with the processing network to contribute to the annual employee performance agreements. Chart 14 displays a summary of the results representing the reviews for the 6-month period, from October 2019 to March 2020.
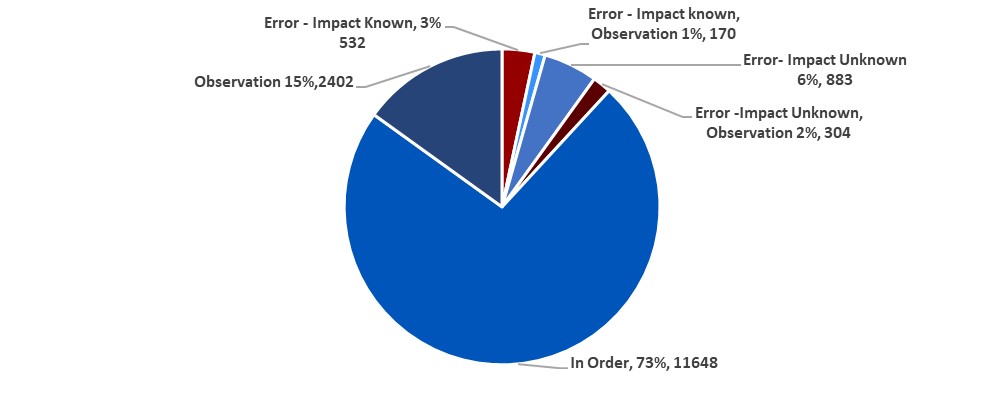
- Source: Employment and Social Development Canada.
Text description of Chart 14
| Results | Percentage | Reviews |
|---|---|---|
| Observation | 15% | 2402 |
| Error – Impact known | 3% | 532 |
| Error – Impact known, Observation | 1% | 170 |
| Error – Impact unknown | 6% | 883 |
| Error – Impact unknown, Observation | 2% | 304 |
| In Order | 73% | 11648 |
Of the 15,939 reviews performed, 14,050 (88%) were either found to be in order or had minor issues without significant impact on the clients. The other 12% of reviews identified errors affecting client eligibility, entitlement, or payment (detailed below). Thus, not only did the EI IQF program show an individual accuracy rate of 88%, it also led to the review and correction, where applicable, of 1889 work items:
- in order: 11,648 or 73%—work items free of any errors
- observations: 2,402 or 15%—minor issues not impacting eligibility, entitlement, or payment
- errors: 1,889 or 12%—impact client eligibility, entitlement, or payment
In summary, in FY1920, the IQF program successfully piloted and launched the newly modernized IQF program with the enhanced Integrated Quality Platform. It streamlined processes and the first 6 months of reviews revealed an 88% individual accuracy result.
4.7.4 Administrative reviews and investigations
Integrity activities in ESDC focus primarily on detection activities using a variety of tools and processes to help identify and address:
- error
- fraud, and
- abuse
The most significant of these activities are directed towards conducting administrative reviews and investigations.
During the reporting year, ESDC conducted close to 271,000 administrative reviews and investigations relating to the EI program. This includes:
- claimant investigations into error, fraud and abuse
- employer investigations
- missing ROE
- accuracy of ROE s, and
- employer noncompliance or misrepresentation
These efforts found that the most common type of unintentional error was made when claimants incorrectly declared their work and earnings. The most common types of intentional error were:
- when a claimant knowingly failed to declare their work, earnings, or self-employment income
- failed to declare periods when unavailable for work, and/or
- failed to report absences from Canada
Because of these administrative reviews and investigations, ESDC has saved $442.1 million for the EI Operating Account (consult chart 15 ). The savings amount reflects a combination of overpayments, penalties, as well as, the prevention of future ineligible payments. These efforts benefit both employee and employer payers of EI premiums. The savings reduce the overall cost of the EI program when overpayments are recuperated.
ESDC uses several methods to recover funds from EI claimants who have been overpaid. These include:
- the automatic recovery of monies from active EI benefit claims (either the full amount or an agreed upon partial deduction)
- voluntary cash payments, or
- the collection of the debt by the Canada Revenue Agency through an agreed upon repayment schedule
When the claimant is capable of paying but collection efforts have failed, ESDC can recover monies owing through:
- an income tax refund or income tax reversal
- a garnishment of wages and other income, or
- bank deposits
As a last resort, ESDC can seek federal court certification where the court converts the money owing from an EI overpayment into a civil judgment debt, recoverable by a seizure of assets.
ESDC's Transformation efforts, such as Benefits Delivery Modernization, represent an opportunity to use newer technologies within the integrity process. Through the design of a more proactive approach and the use of analytical tools, ESDC will further improve the accuracy of payments, and ensure stewardship. In addition to assessing new technologies, the Department has continued to standardize and improve processes. This is in an effort to generate efficiencies and improve client service. These changes include reducing the number of hand-offs required to complete a review or investigation. As an example, ISB launched a pilot project which increased the level of decision making authority of investigators maintaining appropriate measures to maintain neutrality. The pilot project met the objectives; however, it was temporally suspended due to Covid-19.

- * NIS: National Investigative Services (NIS). Cases dealing with unreported absences from Canada while on Employment Insurance, and the Report on Hiring program are centrally managed through Integrity's NIS centre in Miramichi, New Brunswick.
- Note: The numbers ($M) have been rounded to the nearest hundred thousand. The national amounts have been calculated using the raw data.
Text description of Chart 15
| Region | FY1617 | FY1718 | FY1819 | FY1920 |
|---|---|---|---|---|
| Western | 164.1 | 157.4 | 166.7 | 141.6 |
| Quebec | 105.5 | 116.4 | 118.8 | 111.7 |
| Ontario | 118.5 | 137.7 | 131.9 | 119.9 |
| Atlantic | 44.9 | 54.4 | 51.7 | 46.6 |
| NIS | 28.7 | 25.6 | 27.3 | 22.3 |
Claimant information sessions
In addition to administrative reviews and investigations, integrity activities also include outreach and prevention activities, such as Claimant Information Sessions. The purpose of these sessions is twofold:
- to provide claimants with information on programs and services available to help them find suitable employment, and
- to inform them about their rights and obligations regarding the EI program requirements and the consequences of abusing the system namely:
- penalties, or
- prosecutions
The Department aims to conduct 10,000 Claimant Information Sessions per year. Over 94,000 EI claimants attended close to 9,700 sessions that ESDC delivered in FY1920. Both the number of claimants and sessions held declined by 8.19% and 10% respectively from the previous year. This is because all operations stopped as of March 2020 due to Covid-19. ESDC identifies and directs to a session based on the local job demand in their previous occupation, and the availability of work.
| Claimant information Session FY1617 to FY1920 | FY1617 | FY1718 | FY1819 | FY1920 |
|---|---|---|---|---|
| Number of Claimant Information Sessions | 11,012 | 10,978 | 10,772 | 9,691 |
| Percentage change in the number of Claimant Information Sessions from the previous fiscal year | +2% | -0.31% | -1.88% | -10% |
- Source: Employment and Social Development Canada.
- Attendance at these sessions is mandatory; however, claimants have an opportunity to reschedule if needed. Should claimants not attend or fail to provide evidence of an active job search, their EI benefits could be suspended.
Integrity quality initiatives
The Department has a National Quality Management Program in place to ensure a high level of quality and consistency across investigative activities. This includes conducting in-depth quality monitoring activities to measure work performance as it relates to the handling of investigations. The results from these investigations determine the type of corrective measure to be implemented. This involves:
- amending the training material
- national guidance, and
- policy and system enhancements
Quality initiatives and results are tracked and reported both nationally and across each region. They are used to indicate trends, patterns of errors and to identify best practices. For FY1920, the average quality rate for EI investigations was 88.57%, surpassing the national quality objective of 85%.
Identity management
The accuracy of the Social Insurance Registry (SIR) is fundamental to all programs and services that use the SIN to identify clients accurately. This includes the EI program. The SIN program maintains accuracy of the SIR through the use of strict identity and quality management practices. They are designed to ensure that claimants applying for a SIN, or updating their SIN records are properly identified and that SIN records are accurate. The SIN program electronically validates the applicant's identity information with the issuing source when performing most transactions. When validated, the risk of critical errors when processing SIN transactions is significantly reduced.
Online applications to the EI program are in part facilitated by the electronic validation of claimant identities with the SIR in real-time. This amounts to approximately 35 million validations annually. These efforts ensure not only an efficient application process but also that the individual requesting benefits is the correct SIN holder.
Risk management
ESDC uses various risk-based strategies to improve the overall integrity of the EI program so that resources are directed to higher-risk cases. Higher-risk cases have a higher probability of misrepresentation, abuse, payment errors, or fraud. Potential issues flagged in the early stages of the benefit life cycle allow the Department to allocate scarce integrity resources to higher risk cases. This helps to prioritize investigation activities.
Generally, the number of EI administrative reviews and investigations that are conducted annually is in line with the number of cases, which are considered high-risk. However, in any given year, the volume might vary slightly based on the changing nature and significance of identified risks.
ESDC also has a risk analysis function to assess program integrity risks quantitatively and qualitatively and to understand better the root cause of "mispayments". This activity includes developing appropriate mitigation strategies which may involve implementing more controls where required to address any identified vulnerabilities.
4.8 Conclusion
FY2019 brought its share of challenges to ESDC including the COVID-19 pandemic.
While facing these challenges, the Department was able to adjust itself quickly by adapting its systems and processes to meet EI clients’ needs. Additionally, the Department stayed faithful to its ambition to provide world-class service delivery to Canadians, and introduced some improvements to EI clients. In addition, ESDC improved service to Canadians through the delivery of faster and more client-centric service by the Social Security Tribunal.
The Department’s response to the crisis unveiled the significant amount of work undertaken in a short period of time. It has laid the ground for important measures that are expected to have positive impacts on EI clients in the years to come.