Official title: Employment Insurance Monitoring and Assessment Report for the fiscal year beginning April 1, 2020 and ending March 31, 2021: Annex 4: Key program administrative data and results
This is the complete list of abbreviations for the Employment Insurance Monitoring and Assessment Report for the fiscal year beginning April 1, 2020 and ending March 31, 2021.
Annex 4.2.2a Electronic services: partially or fully automated claims (%)
Region
FY1617
FY1718
FY1819
FY1920
FY2021
% Change1
Atlantic
78.9
79.2
80.1
81.4
89.5
10.0%
Quebec
71.3
72.2
72.4
76.0
88.6
16.6%
Ontario
72.1
72.5
72.3
77.0
89.3
16.0%
Western
71.9
69.1
69.6
74.6
88.5
18.6%
Canada
72.7
72.4
72.6
76.6
88.9
16.1%
Source: Service Canada, Employment Insurance (EI) administrative data.
1 Percentage change between 2019 to 2020 and 2020 to 2021.
Annex 4.3.1a Electronic services: claimants receiving benefits through direct deposit (%)
Region
FY1617
FY1718
FY1819
FY1920
FY2021
% Change1
Atlantic
96.7
97.0
97.5
97.7
96.9
-0.8%
Quebec
96.0
96.2
96.5
96.6
94.5
-2.2%
Ontario
95.3
95.7
96.4
96.6
95.4
-1.2%
Western
95.1
95.3
95.7
96.0
94.9
-1.1%
Canada
95.6
95.9
96.4
96.6
95.2
-1.4%
Source: Service Canada, Employment Insurance (EI) administrative data.
1 Percentage change between 2019 to 2020 and 2020 to 2021
Annex 4.3.1b Points of service for EI Program delivery1 (number)
Region
FY1617
FY1718
FY1819
FY1920
FY20212
% Change3
Atlantic
84
84
84
84
84
0.0%
Quebec
94
93
92
92
93
1.1%
Ontario
167
167
165
163
162
-0.6%
Western
213
214
238
240
240
0.0%
Canada
558
558
579
579
579
0.0%
Note: Totals may not add up due to rounding.
Source: Service Canada, Employment Insurance (EI) administrative data.
1 The values represent existing points of service as of March 31st for each fiscal year. The 579 total for FY2021 represent the points of service including: Service Canada Centres, Scheduled Outreach sites, Service Delivery Partners and Service Canada Community Offices. The total does not include the Service Canada Centre - Passport Service sites.
2 As a result of the pandemic, the Service Canada Centres were closed in March 2020. EI Volumes for 2020 to 2021 only include activities that occurred in Service Canada Centres as a result of an appointment or since they're reopening in July 2020. In response to the pandemic, eServiceCanada was launched in March 2020, enabling clients to request assistance for EI via an online form. Once a form was submitted, an officer would call the client within 2 business days to either provide the client assistance or, if necessary, make an appointment to see an officer in a Service Canada Centre; note that eServiceCanada volumes are not included in this table.3Percentage change between 2019 to 2020 and 2020 to 2021.
Annex 4.3.1c Service delivery: in-person Employment Insurance requests1 (in millions)
Region
FY1617
FY1718
FY1819
FY1920
FY20212
% Change3
Atlantic
0.7
0.6
0.6
0.6
0.09
-85.0%
Quebec
1.3
1.2
1.2
1.2
0.28
-76.7%
Ontario
1
0.9
0.9
1.04
0.16
-84.0%
Western
1.4
1.2
1.1
1.1
0.18
-83.6%
Canada
4.4
3.9
3.8
3.9
0.7
-82%
Note: Totals may not add up due to rounding.
Source: Service Canada, Employment Insurance (EI) administrative data.
1 These values could reflect multiple requests by the same client. Statistics include clients assisted face to face and those serving themselves at a Client Access Work Station (CAWS) computer.
2 As a result of the pandemic, the Service Canada Centres were closed in March 2020. EI Volumes for 2020 to 2021 only include activities that occurred in Service Canada Centres as a result of an appointment or since they're reopening in July 2020. In response to the pandemic, eServiceCanada was launched in March 2020, enabling clients to request assistance for EI via an online form. Once a form was submitted, an officer would call the client within 2 business days to either provide the client assistance or, if necessary, make an appointment to see an officer in a Service Canada Centre; note that eServiceCanada volumes are not included in this table.
3 Percentage change between 2019 to 2020 and 2020 to 2021.
4 Number rounded up to avoid discrepancies
Annex 4.3.1d Service delivery: eServiceCanada Employment Insurance requests1,2 (in thousands)
Region
FY20213
Atlantic
556
Quebec
353
Ontario
528
Western
160
Canada
1,603
Note: Totals may not add up due to rounding.
Source: Service Canada, eServiceCananda, Employment Insurance (EI) administrative data from Microsoft Dynamics.
1 These values could reflect multiple requests by the same client. Data include all EI services requested by clients as they complete the eServiceCanada form on Canada.ca.
2 The total for Canada includes over 5,000 requests from outside of Canada.
3 The service request totals correspond to requests made by nearly 1.3 million EI clients.
Annex 4.3.1e Community Outreach and Liaison Services: all Employment Insurance information sessions – Citizens (Number)
Region
FY1617
FY1718
FY1819
FY1920
FY2021
% Change1
Atlantic
115
106
115
155
116
-25.2%
Quebec
277
274
197
271
381
40.6%
Ontario
381
440
228
380
208
-45.3%
Western
152
216
156
170
121
-28.8%
Canada
925
1,036
696
976
826
-15.4%
Source: Service Canada, Employment Insurance (EI) administrative data.
1 Percentage change between 2019 to 2020 and 2020 to 2021.
Annex 4.3.1f Community Outreach and Liaison Services: workers facing mass layoffs reached (number)
Region
FY1617
FY1718
FY1819
FY1920
FY2021
% Change1
Atlantic
769
807
781
1,437
249
-82.7%
Quebec
2,408
3,603
2,800
2,983
5,848
96%
Ontario
2,596
3,659
2,363
3,718
1,141
-69.3%
Western
2,318
2,431
1,247
2,458
1,624
-33.9%
Canada
8,091
10,500
7,191
10,596
8,862
-16.4%
Source: Service Canada, Employment Insurance (EI) administrative data.
1 Percentage change between 2019 to 2020 and 2020 to 2021.
Annex 4.3.1g Community Outreach and Liaison Services: employers reached (number)
Region
FY1617
FY1718
FY1819
FY1920
FY2021
% Change1
Atlantic
46
70
21
109
156
43.1%
Quebec
221
134
120
272
1704
526.5%
Ontario
305
284
105
298
1943
552.0%
Western
183
47
32
86
498
479.1%
Canada
755
535
278
765
4,301
462.2%
Source: Service Canada, Employment Insurance (EI) administrative data.
1 Percentage change between 2019 to 2020 and 2020 to 2021.
Annex 4.3.1h Community Outreach and Liaison Services: work-sharing sessions – Citizens (number)
Region
FY1617
FY1718
FY1819
FY1920
FY2021
% Change1
Atlantic
18
7
4
12
84
600.0%
Quebec
118
57
49
65
240
269.2%
Ontario
58
23
19
49
39
-20.4%
Western
4
0
0
10
3
-70.0%
Canada
198
87
72
136
366
169.1%
Source: Service Canada, Employment Insurance (EI) administrative data.
1 Percentage change between 2019 to 2020 and 2020 to 2021.
Annex 4.3.1i Community Outreach and Liaison Services: outreach support centre Employment Insurance requests1 (in thousands)
Region
FY2021
Atlantic
1.4
Quebec
3.3
Ontario
4.2
Western
20.4
Canada
29.3
Note: Totals may not add up due to rounding.
Source: Service Canada, Outreach Support Centre, Employment Insurance (EI) administrative data from ATOM.
1 These values could reflect multiple requests by the same client.
Annex 4.3.2a 1 800 O-Canada call centres: Employment Insurance related calls1 (in thousands)
Region
FY1617
FY1718
FY1819
FY1920
FY2021
% Change2
Atlantic
46
43
41
50
47
-4.4%
Quebec
94
93
109
137
159
16.3%
Ontario
138
114
114
155
169
8.7%
Western
161
133
133
170
152
-10.2%
Canada
440
383
397
511
528
3.2%
Note: Totals may not add up due to rounding.
Source: Service Canada, Employment Insurance (EI) administrative data.
1 Data includes calls from within Canada only.
2 Percentage change between 2019 to 2020 and 2020 to 2021.
Annex 4.3.2b 1 800 O-Canada call centres: first call resolution - Employment Insurance related calls1 (%)
Region
FY1617
FY1718
FY1819
FY1920
FY20212
% Change3
Atlantic
17.6%
18.6%
20.2%
21.0%
16.6%
-21.0%
Quebec
17.0%
17.5%
19.8%
20.7%
16.9%
-18.4%
Ontario
17.7%
18.9%
20.8%
22.5%
18.1%
-19.6%
Western
18.4%
19.2%
21.6%
22.9%
18.3%
-20.1%
Canada
17.8%
18.7%
21.0%
22.3%
18.0%
-19.3%
Note: Totals may not add up due to rounding.
Source: Service Canada, Employment Insurance (EI) administrative data.
1 EI Related Calls received on 1 800 O-Canada are based on program activities (enquiries) and more than one program activity may apply to a call. First Call Resolution was derived from program activity statistics that indicated only program information was provided to a caller to satisfy an EI related enquiry and a referral to the program was not required. While one enquiry may have been resolved at first contact, a caller may still have additional enquiries related to EI or other Government of Canada programs and services.
2 The lower first contact resolution can be attributed to several pandemic related benefits and measures, as noted below, which by necessity required us to provide more referrals to the EI program for assistance that was more than general in nature.
The pandemic year introduced new measures to Employment Insurance that affected the eligibility of applicants.
New benefits became available as a result of the pandemic which also required agents to provide details on other programs at the same time as providing information on Employment Insurance.
Service delivery methods changed with the in-person channel which may have created enquiries and referrals with 1 800 O-Canada that would not otherwise have existed.
3 Percentage change between 2019 to 2020 and 2020 to 2021.
Annex 4.3.2c Call centres: Enquiries resolved via Employment Insurance voice response system (in millions)
Fiscal year
FY1617
FY1718
FY1819
FY1920
FY2021
% Change1
Canada
18.6
16.6
15.9
19.8
25.6
29.3%
Source: Service Canada, Employment Insurance (EI) administrative data.
1 Percentage change between 2019 to 2020 and 2020 to 2021.
Source: Service Canada, Employment Insurance (EI) administrative data.
1 Percentage change between 2019 to 2020 and 2020 to 2021.
Annex 4.3.3b Service delivery: My Service Canada Account logins1 (in millions)
Fiscal year
FY1617
FY1718
FY1819
FY1920
FY2021
% Change2
Canada
29.3
28.8
32.2
37.2
80.1
115.3%
Note: Totals may not add up due to rounding.
Source: Service Canada, Employment Insurance (EI) administrative data.
1 Regional breakdowns for My Service Canada Account (MSCA) logins are not available. The data tracking system used for MSCA is a secure information portal; hence, Service Canada does not track personal identifying client information through this portal. Personal identifying client information would be needed in order to capture regional data. 2Percentage change between 2019 to 2020 and 2020 to 2021.
Annex 4.3.3c Service delivery: EI Claimants who accessed My Service Canada Account (%)
Fiscal year
FY1617
FY1718
FY1819
FY1920
FY2021
% Change1
Canada
36.8%
35.2%
38.0%
39.1%
34.8%
-11.0%
Note: Totals may not add up due to rounding.
Source: Service Canada, Employment Insurance (EI) administrative data.
1 Percentage change between 2019 to 2020 and 2020 to 2021.
Annex 4.4.1a Electronic records of employment (eROEs): % distribution of paper records of employment versus electronic records of employment (%)
Fiscal year
eROEs – Canada % total
Paper – Canada % total
FY1617
88.1
11.9
FY1718
90.4
9.6
FY1819
92.3
7.7
FY1920
94.6
5.4
FY2021
95.6
4.4
Year-by-Year comparison1
1.1
-
Source: ROE Single Database, Corporate Client Information Service (CCIS or Easy Access) - Employer Summary Table (Note: 2nd copy paper ROEs loaded in CCIS).
1 This figure represents the percentage point increase over the percentage of ROEs submitted electronically the previous fiscal year.
Annex 4.4.1b Electronic records of employment (eROEs): new record of employment web registrations (number)
Fiscal year
FY1617
FY1718
FY1819
FY1920
FY2021
% Change2
Canada
51,625
42,411
39,949
45,849
84,699
84.7%
Source: Record of Employment (ROE) Single Database, Corporate Client Information Service (CCIS or Easy Access) - Employer Summary Table (Note: 2nd copy paper ROEs loaded in CCIS).
2 Percentage change between 2019 to 2020 and 2020 to 2021.
Annex 4.4.1c Electronic records of employment (eROEs): records of employment submitted electronically by employers1 (number)
Fiscal year
FY1617
FY1718
FY1819
FY1920
FY2021
% Change2
Canada
8,726,202
9,290,983
9,800,954
12,808,991
12,237,632
-4.5%
Source: ROE Single Database, Corporate Client Information Service (CCIS or Easy Access) - Employer Summary Table (Note: 2nd copy paper ROEs loaded in CCIS).
1 Electronic Records of Employment (eROEs) consist of Web eROEs and Secure Automated Transfer (SAT) eROEs.
2 Percentage change between 2019 to 2020 and 2020 to 2021.
Note: The error rate is calculated as the sum of projected overpayment and projected underpayment divided by gross total payout. The projected most likely errors are generated by means of the Monetary Unit Sampling (MUS) method.
Source: Employment and Social Development Canada
March fiscal year-end results include both confirmed and potential monetary errors for overpayments and underpayments identified through the course of the payment accuracy review. Potential errors require additional actions to confirm whether an error has occurred. Until those actions are completed, they are captured as errors. Although Quality Services works diligently to resolve all potential errors by fiscal year-end, it is not always possible. The results presented in annex 4.6.1 reflect the most current results for both FY1920 and FY2021.
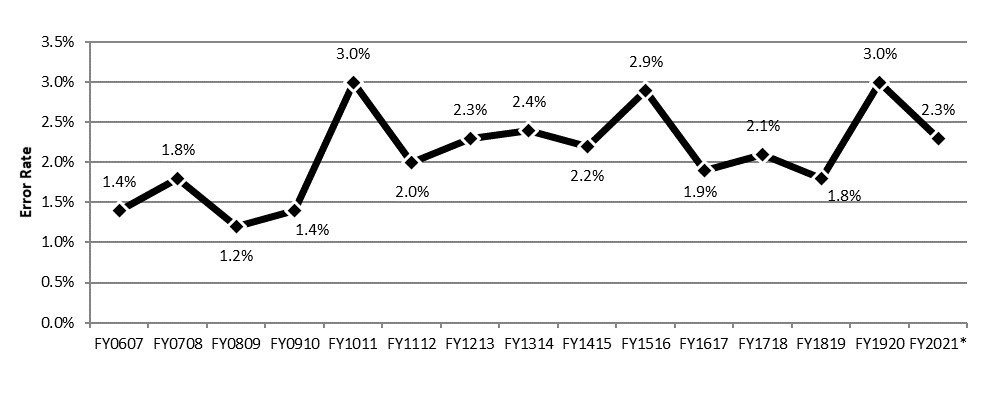
Annex 4.6.1b – 15-year overview of claimant errorsText description of Annex 4.6.1b
Fiscal year
Error rate
FY0607
1.4%
FY0708
1.8%
FY0809
1.2%
FY0910
1.4%
FY1011
3.0%
FY1112
2.0%
FY1213
2.3%
FY1314
2.4%
FY1415
2.2%
FY1516
2.9%
FY1617
1.9%
FY1718
2.1%
FY1819
1.8%
FY1920
3.0%
FY2021
2.3%
Note: The error rate is calculated as the sum of projected overpayment and projected underpayment divided by gross total payout. The projected most likely errors are generated by means of the Monetary Unit Sampling (MUS) method.
Source: Employment and Social Development Canada.
*FY2021 results are weighted by month to reflect monthly variations in total payout, sample size, workload and associated processing.
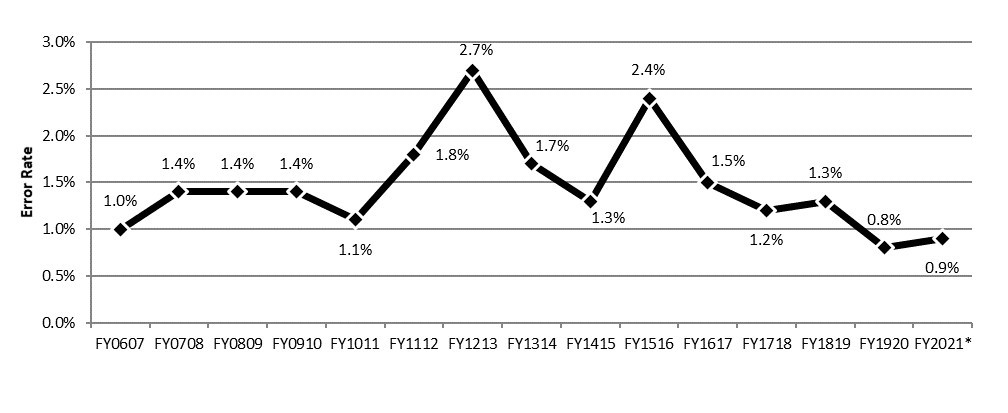
Annex 4.6.1c – 15-year overview of employer errorsText description of Annex 4.6.1.c
Fiscal year
Error rate
FY0607
1.0%
FY0708
1.4%
FY0809
1.4%
FY0910
1.4%
FY1011
1.1%
FY1112
1.8%
FY1213
2.7%
FY1314
1.7%
FY1415
1.3%
FY1516
2.4%
FY1617
1.5%
FY1718
1.2%
FY1819
1.3%
FY1920
0.8%
FY2021
0.9%
Note: Note: The error rate is calculated as the sum of projected overpayment and projected underpayment divided by gross total payout. The projected most likely errors are generated by means of the of the Monetary Unit Sampling (MUS) method.
Source: Employment and Social Development Canada.
*FY2021 results are weighted by month to reflect monthly variations in total payout, sample size, workload and associated processing.
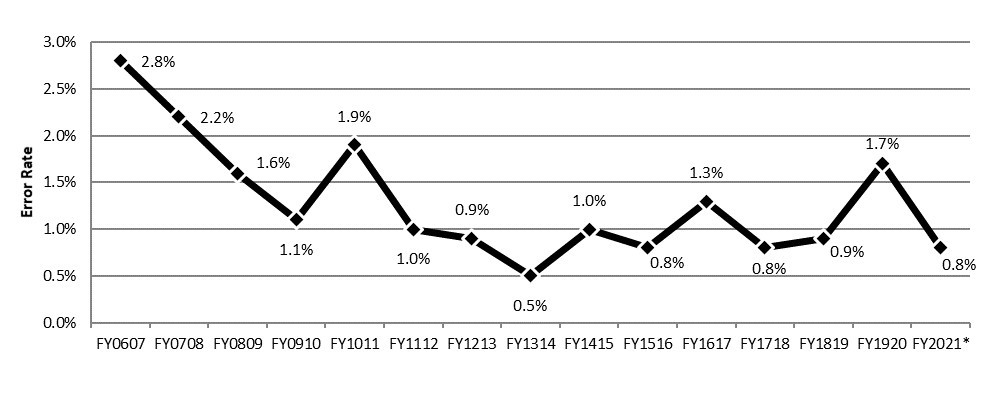
Annex 4.6.1d – 15-year overview of ESDC errorsText description of Annex 4.6.1d
Fiscal year
Error rate
FY0607
2.8%
FY0708
2.2%
FY0809
1.6%
FY0910
1.1%
FY1011
1.9%
FY1112
1.0%
FY1213
0.9%
FY1314
0.5%
FY1415
1.0%
FY1516
0.8%
FY1617
1.3%
FY1718
0.8%
FY1819
0.9%
FY1920
1.7%
FY2021
0.8%
Note: The error rate is calculated as the sum of projected overpayment and projected underpayment divided by gross total payout. The projected most likely errors are generated by means of the Monetary Unit Sampling (MUS) method.
Source: Employment and Social Development Canada.
*FY2021 results are weighted by month to reflect monthly variations in total payout, sample size, workload and associated processing.
Annex 4.6.3a Number of Claimant Information Sessions over the last 4 fiscal years
Claimant Information Session
FY1617
FY1718
FY1819
FY1920
Number of Claimant Information Sessions
11,012
10,978
10,772
9,691
Percentage change in the number of Claimant Information Sessions from the previous fiscal year
+2%
-0.31%
-1.88%
-10%
Source: Employment and Social Development Canada.
Annex 4.7.2a - SST General Division - EI appeals - EI appeals
Appeal information
Number of regular files
Number of group files
Total number of files
Appeals in progress
March 31,2020
501
208
709
Appeals received
1669
163
1832
Appeals concluded
1905
49
1954
Appeals in progress
March 31, 2021
265
322
587
Annex 4.7.2b SST General Division service standards
Month
Apr 2020
May 2020
June 2020
July 2020
Aug 2020
Sept 2020
Oct 2020
Nov 2020
Dec 2020
Jan
2021
Feb
2021
Mar
2021
FY2021
Average Days
40
42
37
38
40
37
29
35
37
25
36
32
36
Met %
73
73
71
75
74
73
86
87
80
92
91
92
80
Note: The goal is to complete 80% of decision within 45 days from the date the appeal is filed with the Tribunal
Annex 4.7.2c SST General Division decisions disputed at the Appeal Division
Appeal information
Number of regular files
Number of group files
Total number of files
Appeals in progress
March 31,2020
72
461
533
Appeals received
199
0
199
Appeals concluded
232
461
693
Appeals in progress March 31, 2021
39
0
39
Annex 4.7.2d SST Appeal Division Leave to Appeal service standard
Month
Apr 2020
May 2020
June 2020
July 2020
Aug 2020
Sept 2020
Oct 2020
Nov 2020
Dec 2020
Jan
2021
Feb
2021
Mar
2021
FY2021
Average Days
25
18
34
16
15
23
14
23
13
17
10
15
20
Met %
100
100
80
100
100
100
100
100
100
100
100
100
98
Note: The service standard is to make Leave to Appeal decisions within 45 days 80% of the time
Annex 4.7.2e SST Appeal Division final decision service standard
Month
Apr 2020
May 2020
June 2020
July 2020
Aug 2020
Sept 2020
Oct 2020
Nov 2020
Dec 2020
Jan
2021
Feb
2021
Mar
2021
FY2021
Average Days
58
77
86
89
84
70
71
79
82
66
112
69
77
Met %
100
92
94
100
100
100
100
100
100
100
100
100
99
Note: Final decisions are made within 150 days of the Leave to Appeal decision, 80% of the time
As of July 1, 2020, the service standard was updated from 210 days 85% of the time to 150 days 80% of the time.
The percentage met for FY2021 is a combination of Q1 at 210 days and Q2 onwards at 150 days.
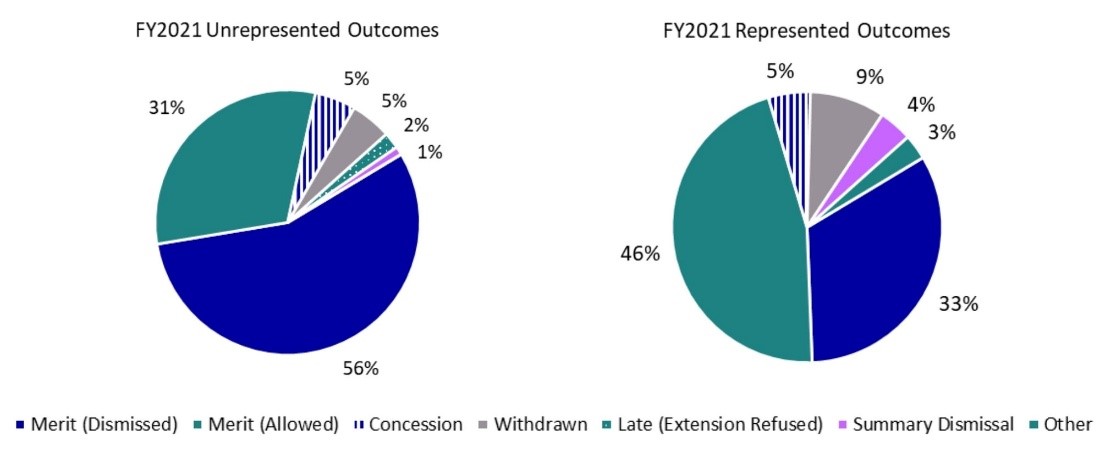
Annex 4.7.2f – SST General Division - EI allowed rate - appeals with and without representationText description of Annex 4.7.2f
FY2021 Unrepresented outcomes
Outcome
% Share
Merit-Dismissed
56%
Merit-Allowed
31%
Concession
5%
Withdrawn
5%
Late-Extension of time refused
2%
Summary Dismissal
1%
Other
0%
FY2021 Represented outcomes
Outcome
% Share
Merit-Dismissed
33%
Merit-Allowed
46%
Concession
5%
Withdrawn
9%
Late-Extension of time refused
0%
Summary Dismissal
4%
Other
3%
Note on charts: Percentage allowed rate is based on final decisions (allowed and dismissed) only.
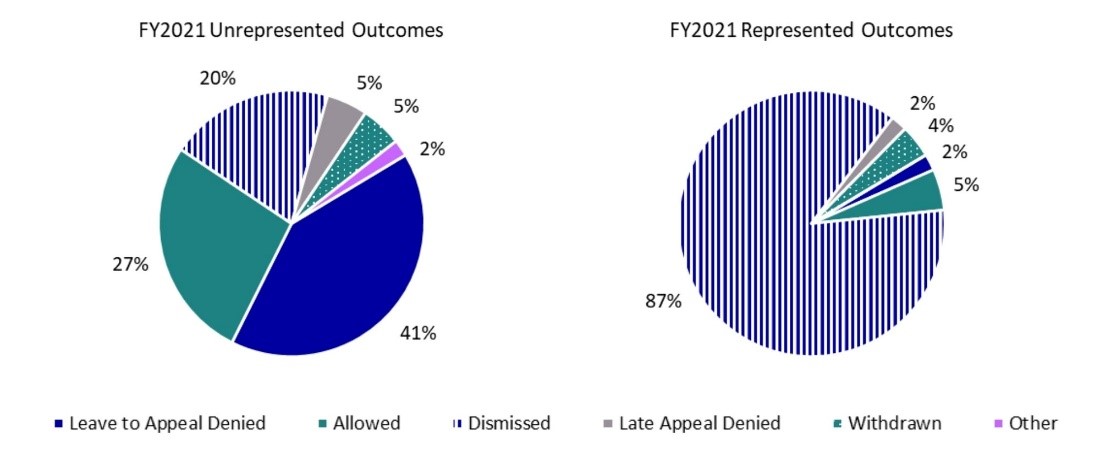
Annex 4.7.2g – SST Appeal Division - allowed rate – EI appeals with and without representationText description of Annex 4.7.2g
FY2021 Unrepresented outcomes
Outcome
% Share
Leave to Appeal Denied
41%
Allowed
27%
Dismissed
20%
Late Appeal Denied
5%
Withdrawn
5%
Other
2%
FY2021 Represented outcomes
Outcome
% Share
Leave to Appeal Denied
2%
Allowed
5%
Dismissed
87%
Late Appeal Denied
2%
Withdrawn
4%
Other
0%
Note on charts: Percentage allowed rate is based on final decisions (allowed and dismissed) only.
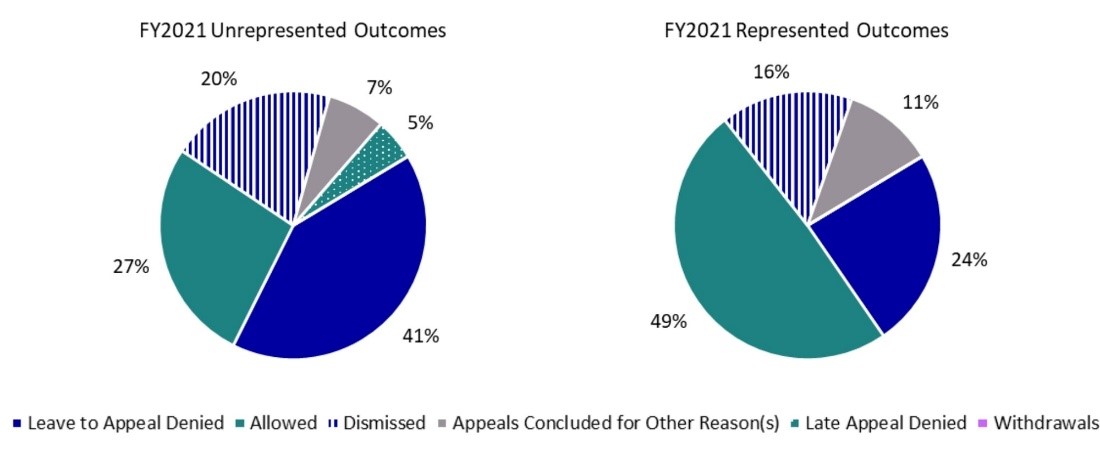
Annex 4.7.2h – SST Appeal Division - allowed rate – EI appeals with and without representation (groups excluded)Text description of Annex 4.7.2h
FY2021 Unrepresented outcomes
Outcome
% Share
Leave to Appeal Denied
41%
Allowed
27%
Dismissed
20%
Appeals Concluded for other reasons
7%
Late Appeal Denied
5%
Withdrawals
0%
FY2021 Represented outcomes
Outcome
% Share
Leave to Appeal Denied
24%
Allowed
49%
Dismissed
16%
Appeals Concluded for other reasons
11%
Late Appeal Denied
0%
Withdrawals
0%
Note on charts: Percentage allowed rate is based on final decisions (allowed and dismissed) only.