
Chapter 1: Labour market context
Official title: Employment Insurance Monitoring and Assessment Report for the fiscal year beginning April 1, 2023, and ending March 31, 2024: Chapter 1: Labour market context
In chapter 1
List of abbreviations
This is the complete list of abbreviations for the Employment Insurance Monitoring and Assessment Report for the fiscal year beginning April 1, 2023 and ending March 31, 2024.
- B/C
- Benefits-to-Contributions
- B/U
- Beneficiary-to-Unemployed (rate)
- B/UC
- Beneficiary-to-Unemployed Contributor (rate)
- CAWS
- Client Access Work Station
- CCB
- Compassionate Care Benefits
- CCDA
- Canadian Council of Directors of Apprenticeship
- CCIS
- Corporate Client Information Service
- CEEDD
- Canadian Employer-Employee Dynamics Database
- CEGEP
- College of General and Professional Teaching
- CEIC
- Canada Employment Insurance Commission
- CEIFB
- Canada Employment Insurance Financing Board
- CERB
- Canada Emergency Response Benefit
- CF
- Canadian Forces
- CFP
- Call for Proposals
- CPI
- Consumer Price Index
- CPP
- Canada Pension Plan
- CRA
- Canada Revenue Agency
- CRF
- Consolidated Revenue Fund
- EAS
- Employment Assistance Services
- EBSM
- Employment Benefits and Support Measures
- EDI
- Equity, Diversity and Inclusion
- EI
- Employment Insurance
- EI-ERB
- Employment Insurance Emergency Response Benefit
- EIACC
- Employment Insurance Appeals Consultative Committee
- EICS
- Employment Insurance Coverage Survey
- eROE
- Electronic Record of Employment
- ESDC
- Employment and Social Development Canada
- FS
- Family Supplement
- G7
- Group of Seven
- GC
- Government of Canada
- GDP
- Gross Domestic Product
- HR
- Human Resources
- IC
- Individual Counselling
- ID
- Identification
- IMP
- International Mobility Program
- ISET
- Indigenous Skills and Employment Training
- JCP
- Job Creation Partnership
- LFS
- Labour Force Survey
- LMDA
- Labour Market Development Agreements
- LMI
- Labour Market Information
- LMP
- Labour Market Partnerships
- LTU
- Long-Term Unemployed
- MSCA
- My Service Canada Account
- MIE
- Maximum Insurable Earnings
- NERE
- New Entrant and Re-Entrant
- NESI
- National Essential Skills Initiative
- NHQ
- National Headquarters
- NOC
- National Occupation Classification
- OAS
- Old Age Security
- OASIS
- Occupational and Skills Information System
- p.p.
- Percentage point
- PCIC
- Parents of Critically Ill Children
- PCS
- Post Call Survey
- PPE
- Premium Paid Eligible
- PRP
- Premium Reduction Program
- PTs
- Provinces and Territories
- QPIP
- Quebec Parental Insurance Plan
- RAIS
- Registered Apprenticeship Information System
- R&I
- Research and Innovation
- ROE
- Record of Employment
- SAT
- Secure Automated Transfer
- SCT
- Skills and Competency Taxonomy
- SD
- Skills Development
- SD-A
- Skills Development - Apprentices
- SD-R
- Skills Development - Regular
- SE
- Self-Employment
- SEAQ
- Service, Excellence, Accuracy and Quality
- SEPH
- Survey of Employment, Payrolls and Hours
- SFS
- Skills for Success
- SIN
- Social Insurance Number
- SIP
- Sectoral Initiatives Program
- SME
- Small and medium-sized enterprise
- SST
- Social Security Tribunal
- STVC
- Status Vector
- SUB
- Supplemental Unemployment Benefit
- SWSP
- Sectoral Workforce Solutions Program
- TES
- Targeted Earning Supplements
- TR
- Temporary Resident
- TRF
- Targeting, Referral and Feedback
- TFWP
- Temporary Foreign Worker Program
- TWS
- Targeted Wage Subsidies
- UV
- Unemployment-to-job-vacancy
- VBW
- Variable Best Weeks
- VER
- Variable Entrance Requirement
- WISE
- Work Integration Social Enterprises
- WWC
- Working While on Claim
List of figures
- Chart 1 – Quarterly real gross domestic product, Canada, 2021-22 to 2023-24
- Chart 2 – Change in real gross domestic product by industry, Canada, 2022-23 to 2023-24
- Chart 3 – Year over year change in the Consumer Price Index (CPI), Canada, January 2011 to March 2024, not seasonally adjusted
- Chart 4 – Components of quarterly population growth in Canada, Q2 2022 to Q1 2024
- Chart 5 – Change in employment by industry, Canada, 2022‑23 to 2023‑24
- Chart 6 – Unemployment rate, Canada, April 2019 to March 2024
- Chart 7 – Average duration of unemployment (in weeks) and share of long-term unemployment (% unemployed for 52 weeks or more), Canada, April 2020 to March 2024
- Chart 8 – Share of unemployment by reason for unemployment, Canada, 2019‑20 to 2023‑24
- Chart 9 – Job vacancies and job vacancy rates, Canada, third quarter of 2021‑22 to fourth quarter of 2023‑24
- Chart 10 – Unemployment-to-vacancy ratio, Canada, 2022‑23 to 2023‑24
- Chart 11 – Nominal and real hourly wage growth and CPI inflation, April 2022 to March 2024
- Chart 12 – Unemployment-to-vacancy ratio by province, last quarter of 2022‑23, and last quarter of 2023‑24
List of tables
- Table 1 – Job vacancies and job vacancy rates, by industry, Canada, fourth quarter of 2022‑23 and 2023‑24
- Table 2 – Change in labour force and labour force participation rate, by province or territory, Canada, 2022‑23 to 2023‑24
- Table 3 – Change in employment and employment rate, by province or territory, Canada, 2022‑23 to 2023‑24
- Table 4 – Change in unemployment and unemployment rate, by province or territory, Canada, 2022‑23 to 2023‑24
- Table 5 – Average weeks of unemployment, by province, Canada, 2022‑23 to 2023‑24
- Table 6 – Nominal weekly earnings, weekly hours worked and consumer price index by province or territory, Canada, 2022‑23 to 2023‑24
- Table 7 – Change in job vacancies, job vacancy rates and unemployment-to-vacancy ratio, by province and territory, Canada, 2023‑24
Introduction
This chapter provides an overview of the economic situation and key labour market developments in Canada during the fiscal year beginning on April 1, 2023, and ending on March 31, 2024 (2023‑24).Footnote 1 This is the same period for which this Report assesses the Employment Insurance (EI) program. Section 1.1 provides a general overview and context of the economic situation for 2023‑24.
Section 1.2 summarizes key labour market developments in the Canadian economy during the reporting period.Footnote 2 Section 1.3 concentrates on the evolution of regional labour market conditions. Definitions and more detailed statistical tables related to key labour market concepts discussed in the chapter can be found in Annex 1.
1.1 Economic overviewFootnote 3
Global economic context in 2023-24
The global economic environment over the 2023‑24 period was characterised by resilient growth and declining inflation across most advanced economies.Footnote 4 The global economy grew at an average annual rate of 3.4% in 2023‑24, mostly driven by strong growth in the US economy despite tighter financial conditions, the ongoing war in Ukraine and evolving conflicts in the Middle East (consult Chart 1, for Canada).
During 2023‑24, most central banks in advanced economies continued raising interest rates to fight inflation, while global supply chain pressures eased, and energy prices dropped substantially. These factors contributed to declining global inflation, although it remained above the target of central banks in most advanced economies including Canada and other G7 countries.Footnote 5 Over the 2023-24 period, Canada had an inflation rate (3.3%) that was lower than the average of G7 countries (4.3%).Footnote 6 Meanwhile, inflation in the average advanced economy dropped from 6.3% in the first quarter of 2023‑24 to 3.0% in the last quarter of the same fiscal year.Footnote 7
Canadian economic context in 2023‑24
In 2023-24, there was a slowdown in economic growth in Canada. The real Gross Domestic Product (GDP) increased by 1.1% in 2023-24 compared to 2022‑23, while it had increased by 3.6% in 2022‑23 compared to 2021‑22.Footnote 8
Looking at quarterly movements, the Canadian economy showed a modest annualized growth rate in the first quarter of 2023‑24. However, it contracted in the second quarter as consumption spending and business investment continued to adjust to past interest rates increases.Footnote 9 While economic growth grew little in the third quarter, it rebounded in the fourth quarter by 2.0% (consult Chart 1) as a result of higher household spending on services and a significant increase in the population growth driven by higher immigration and non-permanent residents.Footnote 10 Overall, in 2023‑24, the significant rise in population growth and the slowdown in aggregate demand for goods and services during this period shifted the Canadian economy from excess demand pressures to moderate excess supply pressures.
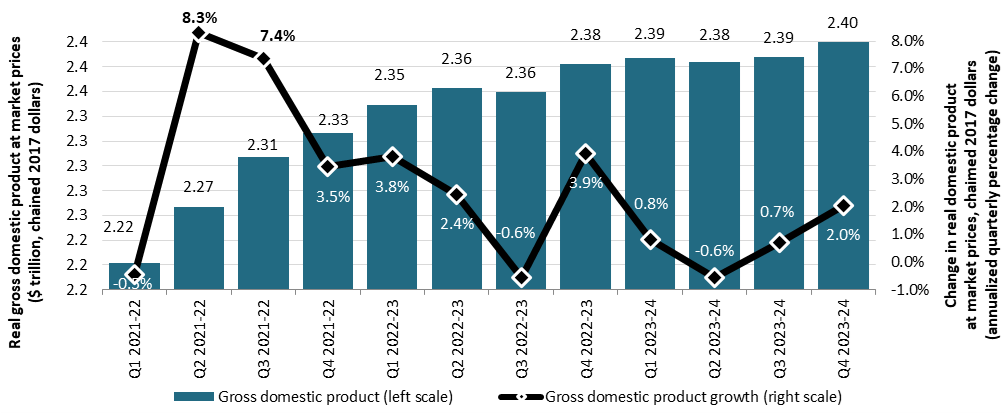
Text description for Chart 1
| Quarter | Real GDP at market prices ($ trillion, chained 2017 dollars) (left scale) | Change in real GDP at market prices, chained 2017 dollars (annualized quarterly percentage change) (right scale) |
|---|---|---|
| Q1 2021-22 | 2.22 | -0.5% |
| Q2 2021-22 | 2.27 | 8.3% |
| Q3 2021-22 | 2.31 | 7.4% |
| Q4 2021-22 | 2.33 | 3.5% |
| Q1 2022-23 | 2.35 | 3.8% |
| Q2 2022-23 | 2.36 | 2.4% |
| Q3 2022-23 | 2.36 | -0.6% |
| Q4 2022-23 | 2.38 | 3.9% |
| Q1 2023-24 | 2.39 | 0.8% |
| Q2 2023-24 | 2.38 | -0.6% |
| Q3 2023-24 | 2.39 | 0.7% |
| Q4 2023-24 | 2.40 | 2.0% |
Source: Statistics Canada, Table 36-10-0104-01.
On the international scene, Canada ranked fourth in real GDP growth rate among G7 countries in 2023‑24, down from having the highest growth rate in 2022‑23. Footnote 11 Additionally, Canada ranked fifth in terms of real GDP per capita (using Purchasing Power Parity) among G7 countries, averaging roughly US$ 51,512 per capita over 2023‑24.Footnote 12 In fact, real GDP per capita has been declining since the beginning of the 2023‑24 fiscal year and is now below pre-pandemic levels.Footnote 13 These declines can be attributed to low economic growth and recent increase in population.
A closer look at industry level (consult Chart 2) showed that the resilience of the Canadian economy was uneven across sectors during 2023‑24. While most industries experienced GDP growth compared to 2022‑23, some contracted. The sectors with the highest growth in 2023‑24 were Transport and warehousing, Health care and social assistance, and Professional, scientific and technical services. Production levels in these sectors (Transport and warehousing, Health care and social assistance and Professional, scientific and technical services) in March 2024 exceeded their pre-pandemic levels of February 2020. Sectors with the largest declines were Agriculture, forestry, fishing, and hunting, followed by Utilities, and Manufacturing. Although Accommodation and food services increased between the 2 fiscal years, they remained below their pre‑pandemic levels.

Text description for Chart 2
| Industry | Change in real GDP 2022‑23 to 2023‑24 |
|---|---|
| Accommodation and food services | 0.8% |
| Transportation and warehousing | 5.5% |
| Agriculture, forestry, fishing and hunting | -5.8% |
| Other services (except public administration) | 2.2% |
| Professional, scientific and technical services | 2.9% |
| Information and culture and recreation** | 1.4% |
| Mining, quarrying, and oil and gas extraction | 1.5% |
| Public administration | 2.6% |
| Business, building and other support services* | -0.4% |
| Educational services | 1.7% |
| Manufacturing | -1.3% |
| Health care and social assistance | 3.1% |
| Utilities | -2.5% |
| Construction | -1.0% |
| Finance, insurance, real estate, rental and leasing | 1.9% |
| Wholesale and retail trade | 1.1% |
- * Includes management of companies and enterprises and administrative and support, waste management and remediation services.
- ** Includes information and cultural industries and arts, entertainment, and recreation industries.
- Source: Statistics Canada, Table 36-10-0434-01.
The inflation rate in Canada has decreased significantly over the 2023‑24 period, although it remained above the Bank of Canada's target level of 2%. The year‑over‑year change in the Consumer Price Index (CPI), or CPI inflation, fell from a peak of 8.1% in June 2022 to 2.9% in March 2024 (consult Chart 3). This decline was largely due to higher interest rates, falling energy prices and improvements in global supply chain conditions.

Text description for Chart 3
| Month | 12‑month CPI change rate |
|---|---|
| Jan-11 | 2.3% |
| Feb-11 | 2.2% |
| Mar-11 | 3.3% |
| Apr-11 | 3.3% |
| May-11 | 3.7% |
| Jun-11 | 3.1% |
| Jul-11 | 2.7% |
| Aug-11 | 3.1% |
| Sep-11 | 3.2% |
| Oct-11 | 2.9% |
| Nov-11 | 2.9% |
| Dec-11 | 2.3% |
| Jan-12 | 2.5% |
| Feb-12 | 2.6% |
| Mar-12 | 1.9% |
| Apr-12 | 2.0% |
| May-12 | 1.2% |
| Jun-12 | 1.5% |
| Jul-12 | 1.3% |
| Aug-12 | 1.2% |
| Sep-12 | 1.2% |
| Oct-12 | 1.2% |
| Nov-12 | 0.8% |
| Dec-12 | 0.8% |
| Jan-13 | 0.5% |
| Feb-13 | 1.2% |
| Mar-13 | 1.0% |
| Apr-13 | 0.4% |
| May-13 | 0.7% |
| Jun-13 | 1.2% |
| Jul-13 | 1.3% |
| Aug-13 | 1.1% |
| Sep-13 | 1.1% |
| Oct-13 | 0.7% |
| Nov-13 | 0.9% |
| Dec-13 | 1.2% |
| Jan-14 | 1.5% |
| Feb-14 | 1.1% |
| Mar-14 | 1.5% |
| Apr-14 | 2.0% |
| May-14 | 2.3% |
| Jun-14 | 2.4% |
| Jul-14 | 2.1% |
| Aug-14 | 2.1% |
| Sep-14 | 2.0% |
| Oct-14 | 2.4% |
| Nov-14 | 2.0% |
| Dec-14 | 1.5% |
| Jan-15 | 1.0% |
| Feb-15 | 1.0% |
| Mar-15 | 1.2% |
| Apr-15 | 0.8% |
| May-15 | 0.9% |
| Jun-15 | 1.0% |
| Jul-15 | 1.3% |
| Aug-15 | 1.3% |
| Sep-15 | 1.0% |
| Oct-15 | 1.0% |
| Nov-15 | 1.4% |
| Dec-15 | 1.6% |
| Jan-16 | 2.0% |
| Feb-16 | 1.4% |
| Mar-16 | 1.3% |
| Apr-16 | 1.7% |
| May-16 | 1.5% |
| Jun-16 | 1.5% |
| Jul-16 | 1.3% |
| Aug-16 | 1.1% |
| Sep-16 | 1.3% |
| Oct-16 | 1.5% |
| Nov-16 | 1.2% |
| Dec-16 | 1.5% |
| Jan-17 | 2.1% |
| Feb-17 | 2.0% |
| Mar-17 | 1.6% |
| Apr-17 | 1.6% |
| May-17 | 1.3% |
| Jun-17 | 1.0% |
| Jul-17 | 1.2% |
| Aug-17 | 1.4% |
| Sep-17 | 1.6% |
| Oct-17 | 1.4% |
| Nov-17 | 2.1% |
| Dec-17 | 1.9% |
| Jan-18 | 1.7% |
| Feb-18 | 2.2% |
| Mar-18 | 2.3% |
| Apr-18 | 2.2% |
| May-18 | 2.2% |
| Jun-18 | 2.5% |
| Jul-18 | 3.0% |
| Aug-18 | 2.8% |
| Sep-18 | 2.2% |
| Oct-18 | 2.4% |
| Nov-18 | 1.7% |
| Dec-18 | 2.0% |
| Jan-19 | 1.4% |
| Feb-19 | 1.5% |
| Mar-19 | 1.9% |
| Apr-19 | 2.0% |
| May-19 | 2.4% |
| Jun-19 | 2.0% |
| Jul-19 | 2.0% |
| Aug-19 | 1.9% |
| Sep-19 | 1.9% |
| Oct-19 | 1.9% |
| Nov-19 | 2.2% |
| Dec-19 | 2.2% |
| Jan-20 | 2.4% |
| Feb-20 | 2.2% |
| Mar-20 | 0.9% |
| Apr-20 | -0.2% |
| May-20 | -0.4% |
| Jun-20 | 0.7% |
| Jul-20 | 0.1% |
| Aug-20 | 0.1% |
| Sep-20 | 0.5% |
| Oct-20 | 0.7% |
| Nov-20 | 1.0% |
| Dec-20 | 0.7% |
| Jan-21 | 1.0% |
| Feb-21 | 1.1% |
| Mar-21 | 2.2% |
| Apr-21 | 3.4% |
| May-21 | 3.6% |
| Jun-21 | 3.1% |
| Jul-21 | 3.7% |
| Aug-21 | 4.1% |
| Sep-21 | 4.4% |
| Oct-21 | 4.7% |
| Nov-21 | 4.7% |
| Dec-21 | 4.8% |
| Jan-22 | 5.1% |
| Feb-22 | 5.7% |
| Mar-22 | 6.7% |
| Apr-22 | 6.8% |
| May-22 | 7.7% |
| Jun-22 | 8.1% |
| Jul-22 | 7.6% |
| Aug-22 | 7.0% |
| Sep-22 | 6.9% |
| Oct-22 | 6.9% |
| Nov-22 | 6.8% |
| Dec-22 | 6.3% |
| Jan-23 | 5.9% |
| Feb-23 | 5.2% |
| Mar-23 | 4.3% |
| Apr-23 | 4.4% |
| May-23 | 3.4% |
| Jun-23 | 2.8% |
| Jul-23 | 3.3% |
| Aug-23 | 4.0% |
| Sep-23 | 3.8% |
| Oct-23 | 3.1% |
| Nov-23 | 3.1% |
| Dec-23 | 3.4% |
| Jan-24 | 2.9% |
| Feb-24 | 2.8% |
| Mar-24 | 2.9% |
- Note: The dotted lines indicate Bank of Canada's 1-3% control range for the inflation target with inflation measured as the 12‑month rate of change in the consumer price index (CPI), Bank of Canada, Monetary Policy Report, April 2024.
- Source: Statistics Canada, Table 18-10-0004-01.
To combat higher inflation, the Bank of Canada raised its policy interest rate by 50 basis points or 0.5 percentage points (p.p.) in 2023‑24, from 4.5% in April 2023 to 5.0% in March 2024.Footnote 14 In general, the purpose of policy interest rate hikes is to slow down the economic activity by reducing inflationary pressures and aggregate demand which has direct impacts on unemployment levels and job creation. Considering the evolutions of real GDP growth and CPI inflation in 2023‑24, we observe that tighter monetary policy (increase of the interest rate) effectively slow downed aggregate demand for goods and services and eased inflationary pressures in Canada.
1.2 The Canadian labour market
This section highlights key labour market developments in Canada during 2023‑24, including several elements related to the administration of the EI program.Footnote 15 Overall, the Canadian labour market during this period was characterised by significant population growth, moderate employment growth, a higher national unemployment rate, and slowly easing labour market conditions.Footnote 16 Footnote 17
Labour force and participation rate
In 2023, Canada's population increased by over 1 million individuals, resulting in a 3.2% growth rate in population, the highest in Canada since 1957. The population surge was mostly driven by international migration (both permanent and temporary immigration), which accounted for 97.6% of this growth (consult Chart 4).Footnote 18
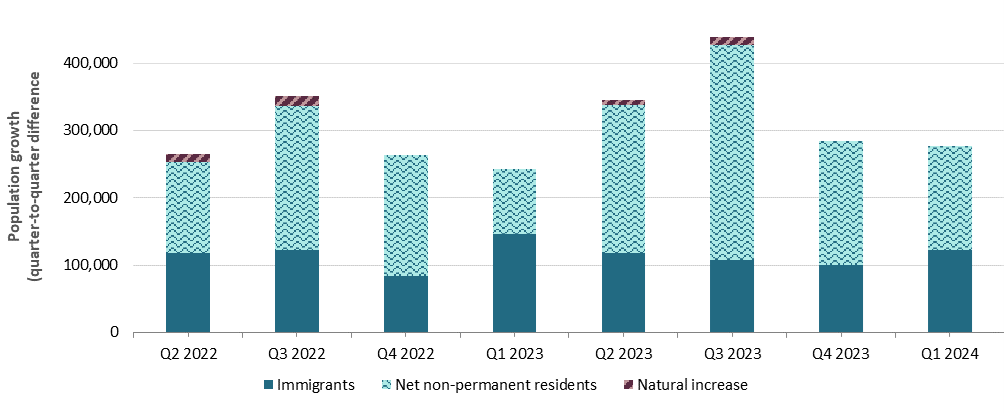
Text description for Chart 4
| Quarter | Immigrants | Net non-permanents residents | Natural increase | Population growth |
|---|---|---|---|---|
| Q2 2022 | 118,319 | 134,626 | 11,877 | 116,392 |
| Q3 2022 | 122,199 | 214,789 | 14,932 | 253,510 |
| Q4 2022 | 83,291 | 179,968 | -2,760 | 343,567 |
| Q1 2023 | 145,496 | 97,845 | -6,034 | 248,485 |
| Q2 2023 | 117,927 | 220,149 | 7,862 | 220,892 |
| Q3 2023 | 107,988 | 318,433 | 12,472 | 334,606 |
| Q4 2023 | 100,406 | 184,339 | -1,804 | 430,297 |
| Q1 2024 | 121,733 | 154,483 | -5,302 | 270,575 |
Source: Statistics Canada, Table 17-10-0040-01, Table 17-10-0059-01 and Table: 17-10-0009-01. Population is the estimated number of Canadians whose usual place of residence is within Canada. Population growth is the change in population between 2 successive quarters. Natural increase is the difference between the numbers of births and deaths. Net non-permanent residents represent the difference between the inflows and outflows of non-permanent residents to Canada between 2 dates. Immigrant refers to a person who is a permanent resident or a landed immigrant.
A key impact of this change was that Canada's labour force grew by 3.3% (+686,775, from 21.0 million to 21.7 million) between 2022‑23 and 2023‑24.Footnote 19 During this period, the working-age population expanded by 3.0%, but the participation rate remained unchanged at 65.7%.Footnote 20
The unchanged national participation rate masks significant variations by age groups. The participation rate for older (55 years and over) and core-aged people (25 to 54 years) marginally increased, while it declined for youth (15 to 24 years). Participation in the labour market is driven by 2 factors (changes in labour force and working age population). The core-aged working age population (3.5%) and their labour force (3.7%) grew at similar pace; hence their participation rate remained relatively unchanged (+0.2 p.p.). Similarly, the older people working age population (1.8%), and their labour force (2.3%) increased at a similar pace, resulting in a slight change in their participation rate (+0.2 p.p.). In contrast, the youth working age population expanded by 4.5%, while their labour force increased by 2.7%, leading to a decline in their participation rate (-1.1 p.p.)
Employment and employment rate
During the reporting period, total employment grew by 2.0%, from 20.2 million in March 2023 to 20.6 million in March 2024. While the employment level was above its pre-pandemic level of 19.2 million in February 2020, it was insufficient to absorb the labour force expansion, resulting in a rise in the national unemployment rate.
During this fiscal period, employment trends varied widely depending on the type of workers, the size of firms, the age and gender of individuals. The average number of part‑time employees increased by 118,200 (+2.2%), while full‑time employees rose by 282,200 (+1.7%) over the same period.
Employment growth was higher for employees in the public sector (+4.2%) than for private sector employees (+1.6%), while self‑employment rose only by 0.5% (+13,700). In 2023-24, the number of employees in the public and private sectors continued to exceed their pre-pandemic levels from February 2020 while self-employment lagged its pre-pandemic level and has been trending downward, indicating that workers are becoming less likely to be self-employed and more likely to be paid employees. Employment increased only in large enterprisesFootnote 21 (500 employees and over).Footnote 22 Nearly half of all employed individuals (47.0%) worked in large enterprises in the last quarter of 2023‑24.
Between 2022‑23 and 2023‑24, most industry sectors registered employment growth and returned to their pre-pandemic levels. The 3 broad sectors with the largest employment increases during the reporting period were Other services (except public administration), followed by Transportation and warehousing and Accommodation and food services. In contrast, Agriculture, as well as Business, building and other support services were the 2 sectors that registered declines in employment (consult Chart 5).

Text description for Chart 5
| Industry | Change (%) in employment by industry 2022‑23 to 2023‑24 |
|---|---|
| Transportation and warehousing | 7.4% |
| Forestry, fishing, mining, quarrying, oil and gas | 2.8% |
| Educational services | 3.3% |
| Wholesale and retail trade | 0.2% |
| Other services (except public administration) | 8.2% |
| Manufacturing | 2.3% |
| Business, building and other support services | -0.7% |
| Agriculture | -5.4% |
| Health care and social assistance | 3.4% |
| Finance, insurance, real estate, rental and leasing | 1.3% |
| Total employed, all industries | 2.7% |
| Public administration | 3.2% |
| Construction | 1.7% |
| Professional, scientific and technical services | 3.9% |
| Utilities | 3.3% |
| Information, culture and recreation | 3.1% |
| Accommodation and food services | 5.0% |
Source: Statistics Canada, Labour Force Survey, Table 14-10-0355-01.
When looking at employment changes by age group, core-aged individuals had the biggest increase in employment (+3.2%) in 2023‑24 compared to 2022‑23, followed by older people (+2.4%), and youth (+1.1%).
During the 2023‑24 period, men represented on average 55.9% of full‑time workers while women accounted for 44.1%. Conversely, women represented on average 62.2% of part‑time workers, whereas men accounted for 37.8%. These proportions were similar to the previous fiscal year. However, between the 2 fiscal years, full‑time employment increased by 2.5% for men and 3.1% for women. Part‑time employment rose by 7.5% for men but decreased by 0.4% for women.
The increase in total employment does not account for changes in the working‑age population. Conversely, the employment rate, which measures the proportion of people aged 15 years and over who were employed during a given period, takes changes in the working‑age population into account. The employment rate dropped by 0.2 p.p., from 62.2% in 2022‑23 to 62.1% in 2023‑24. This decline was largely due to a significant increase in the working-age population, driven mainly by international migration as mentioned earlier. At the international level, Canada had the highest employment rate among G7 countries during this period.Footnote 23 Looking at employment rate trends across gender groups, the employment rate for men remained unchanged while that for women was lower in 2023‑24 compared to the previous fiscal year (-0.3 p.p.). Among age groups, the youth had the largest drop, down by 1.9 p.p. to 57.2% compared to core-aged people who experienced only a smaller decrease (-0.3 p.p.). Conversely, older people employment rate slightly increased (+0.2 p.p.) and was the lowest (35.1%) among all age groups in 2023‑24.
Unemployment and unemployment rate
Unemployment rate is a key factor in determining a claimant's eligibility for EI regular benefits. A lower unemployment rate in an EI economic region translates into a higher number of hours of insurable employment required within the qualifying period for a claimant that resides in that region to be eligible for EI regular benefits.Footnote 24 Additionally, the unemployment rate in an EI economic region also plays a role in determining the EI regular benefit a claimant can receive and the number of weeks of insurable earnings (known as the divisor) used to calculate their weekly benefit rate. Regional variations in the unemployment rates are discussed in subsection 1.3.
The number of unemployed individuals rose from 1.1 million in 2022‑23 to 1.2 million in 2023‑24, representing an increase of 13.3%. The unemployment level in 2023‑24 corresponds to the pre-pandemic level of 1.2 million recorded in 2019‑20. Along with the growth in the labour force during the same period, the unemployment rate increased by 0.5 p.p., from 5.1% in 2022‑23 to 5.6% in 2023‑24 but remained below the pre-pandemic level of 5.9% in 2019-20. Unemployment rates varied significantly by age and gender. In 2023-24, women had a slightly lower unemployment rate than men (5.4% vs 5.8%) but the change in unemployment rate between the 2 fiscal years was the same for both men and women (+0.5 p.p.). By age group, the youth faced the highest unemployment rate at 11.1%, compared to 4.7% for core-aged and 4.5% for older people. The unemployment rate of youth increased by 1.3 p.p. while that of core-aged had an increase of 0.5 p.p. The unemployment rate of older people decreased marginally (-0.1 p.p.) compared to the previous fiscal year.
Throughout 2023‑24, the monthly unemployment rate continued to rise from its record low but remained well below the previous peak during the pandemic. It increased from 5.1% in April 2023 to 6.1% in March 2024, representing an increase of 1.0 p.p. during this period (consult Chart 6).
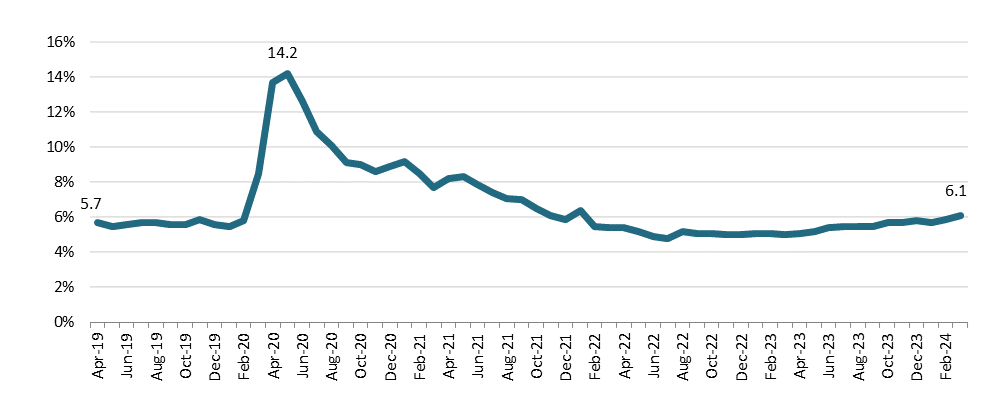
Text description for Chart 6
| Month | Unemployment rate (%) |
|---|---|
| Apr-19 | 5.7% |
| May-19 | 5.5% |
| Jun-19 | 5.6% |
| Jul-19 | 5.7% |
| Aug-19 | 5.7% |
| Sep-19 | 5.6% |
| Oct-19 | 5.6% |
| Nov-19 | 5.9% |
| Dec-19 | 5.6% |
| Jan-20 | 5.5% |
| Feb-20 | 5.8% |
| Mar-20 | 8.5% |
| Apr-20 | 13.7% |
| May-20 | 14.2% |
| Jun-20 | 12.6% |
| Jul-20 | 10.9% |
| Aug-20 | 10.1% |
| Sep-20 | 9.1% |
| Oct-20 | 9.0% |
| Nov-20 | 8.6% |
| Dec-20 | 8.9% |
| Jan-21 | 9.2% |
| Feb-21 | 8.5% |
| Mar-21 | 7.7% |
| Apr-21 | 8.2% |
| May-21 | 8.3% |
| Jun-21 | 7.9% |
| Jul-21 | 7.4% |
| Aug-21 | 7.1% |
| Sep-21 | 7.0% |
| Oct-21 | 6.5% |
| Nov-21 | 6.1% |
| Dec-21 | 5.9% |
| Jan-22 | 6.4% |
| Feb-22 | 5.5% |
| Mar-22 | 5.4% |
| Apr-22 | 5.4% |
| May-22 | 5.2% |
| Jun-22 | 4.9% |
| Jul-22 | 4.8% |
| Aug-22 | 5.2% |
| Sep-22 | 5.1% |
| Oct-22 | 5.1% |
| Nov-22 | 5.0% |
| Dec-22 | 5.0% |
| Jan-23 | 5.1% |
| Feb-23 | 5.1% |
| Mar-23 | 5.0% |
| Apr-23 | 5.1% |
| May-23 | 5.2% |
| Jun-23 | 5.4% |
| Jul-23 | 5.5% |
| Aug-23 | 5.5% |
| Sep-23 | 5.5% |
| Oct-23 | 5.7% |
| Nov-23 | 5.7% |
| Dec-23 | 5.8% |
| Jan-24 | 5.7% |
| Feb-24 | 5.9% |
| Mar-24 | 6.1% |
Source: Statistics Canada, Labour Force Survey, Table 14-10-0287-01.
Factors influencing job expectations
A recent departmental study* evaluates how the EI program mitigates the impact of unemployment on jobless individuals and identifies key factors driving employment expectations among unemployed individuals, including both Employment Insurance (EI) benefits recipients and non-recipients.
Using Employment Insurance Coverage Survey (EICS) data from 2000 to 2019, the study finds that approximately 7.3 million unemployed individuals received EI benefits (recipients) and 14.6 million did not (non-recipients) during this period. Among unemployed recipients, approximately 70% expected to find a job within the next 3 months, compared to 60% of unemployed non-recipients.
Several factors including their demographic characteristics, previous employment, and job search activities influence employment expectations for both groups. Specifically, unemployed individuals had higher likelihood of expecting to find employment if, for example, they were men, younger, single-earner family members, Canadian-born, Quebec residents, job seekers who directly contacted employers and less attached to their previous employer. Additionally, unemployed recipients receiving a greater amount of EI benefits or receiving benefits for a shorter duration (6 months or less) were more optimistic about finding a job.
The share of unemployed individuals expecting to find a job varies with the Canadian economy, declining during downturns and rising in booms. The study reports a fall in job expectations among the unemployed of 6 percentage points (p.p.) during the 2001 slowdown and 16 p.p. during the Great Recession. Job expectations also closely follow labor market trends. Declines in unemployment were associated with increasing optimism among unemployed individuals for finding a job.
* ESDC, Factors influencing job expectations. (Ottawa: ESDC, Labour Market Information Directorate, 2025)
Duration of unemploymentFootnote 25
Although the national unemployment rate increased in 2023‑24 compared to the previous fiscal year, 2 indicators measuring the duration of unemployment showed downward trends.
First, the average duration of unemployment spells (the number of continuous weeks of unemployment where an individual is looking for work or is on temporary layoff) decreased from 18.5 weeks in 2022‑23 to an average of 17.5 weeks in 2023‑24, representing a reduction of 1.0 week (consult Chart 7). This was closer to the pre-pandemic average of 16.1 weeks in 2019‑20.

Text description for Chart 7
| Month | Average weeks of unemployment spells (left scale) | Share of long-term unemployment (%) (right scale) |
|---|---|---|
| Apr-20 | 8.9 | 2.8% |
| May-20 | 11.2 | 2.9% |
| Jun-20 | 12.6 | 3.7% |
| Jul-20 | 16.6 | 4.4% |
| Aug-20 | 17.5 | 4.8% |
| Sep-20 | 19.4 | 5.6% |
| Oct-20 | 18.2 | 6.2% |
| Nov-20 | 18.6 | 5.9% |
| Dec-20 | 20.5 | 7.4% |
| Jan-21 | 21.0 | 8.8% |
| Feb-21 | 21.8 | 10.0% |
| Mar-21 | 22.6 | 16.2% |
| Apr-21 | 21.9 | 18.9% |
| May-21 | 22.3 | 18.0% |
| Jun-21 | 24.2 | 18.5% |
| Jul-21 | 24.0 | 18.2% |
| Aug-21 | 23.8 | 16.9% |
| Sep-21 | 23.5 | 16.7% |
| Oct-21 | 24.6 | 17.3% |
| Nov-21 | 21.9 | 13.9% |
| Dec-21 | 21.3 | 13.2% |
| Jan-22 | 20.5 | 12.5% |
| Feb-22 | 19.7 | 11.6% |
| Mar-22 | 19.7 | 11.6% |
| Apr-22 | 20.9 | 12.8% |
| May-22 | 20.0 | 10.5% |
| Jun-22 | 19.3 | 10.8% |
| Jul-22 | 19.4 | 9.5% |
| Aug-22 | 19.4 | 9.0% |
| Sep-22 | 17.5 | 8.9% |
| Oct-22 | 16.9 | 8.7% |
| Nov-22 | 18.0 | 8.8% |
| Dec-22 | 18.1 | 7.9% |
| Jan-23 | 17.5 | 9.9% |
| Feb-23 | 18.0 | 8.6% |
| Mar-23 | 17.5 | 9.1% |
| Apr-23 | 16.9 | 7.9% |
| May-23 | 17.5 | 7.5% |
| Jun-23 | 15.9 | 5.9% |
| Jul-23 | 16.5 | 7.2% |
| Aug-23 | 16.1 | 7.6% |
| Sep-23 | 17.3 | 7.1% |
| Oct-23 | 19.0 | 8.4% |
| Nov-23 | 18.4 | 7.9% |
| Dec-23 | 17.6 | 8.3% |
| Jan-24 | 18.2 | 8.3% |
| Feb-24 | 18.4 | 9.7% |
| Mar-24 | 18.5 | 9.5% |
Source: Statistics Canada, Labour Force Survey, Table 14-10-0342-01.
Second, the share of long‑term unemployment (those looking for work for 52 weeks or moreFootnote 26) dropped from 9.5% in 2022‑23 to 8.0% in 2023‑24, representing a decrease of 1.6 p.p. This was closer to the pre-pandemic level of 7.5% in 2019‑20. However, in absolute terms, the number of long-term unemployed increased from 85,000 in April 2023 to 127,600 in March 2024. Canada had the lowest number of long-term unemployed among G7 countries in 2023.Footnote 27
There are substantial differences in unemployment duration by age and gender. Older people generally experience longer durations of unemployment compared to the youth because as workers age, their chances of finding a job decrease, making it more difficult for them to re-enter the labour market.Footnote 28 In 2023‑24, the average duration of unemployment was 24.6 weeks for older people, compared to 18.5 weeks for core‑aged people and 11.6 weeks for youth. Compared to 2022‑23, the duration decreased by 3.2 weeks for older people, by 1.2 weeks for core-aged people, while it increased by 1.6 weeks for youth. The share of long-term unemployed was respectively 10.5% for older people, 8.8% for core‑aged people and 4.0% for youth. This represented a decrease of 4.0 p.p. for older people, 1.7 p.p. for core‑aged people and an increase of 0.5 p.p. for youth compared to 2022‑23.
By gender, men experienced an average unemployment duration of 17.9 weeks, slightly longer than women, who had an average of 17.2 weeks. In 2023-24, the duration decreased by 1.6 weeks for men and only 0.4 week for women compared to 2022‑23. The share of long‑term unemployment was 8.4% for men and 7.5% for women in 2023‑24. Compared to the previous fiscal year, the share of long-term unemployment decreased by 1.9 p.p. for men and 1.1 p.p. for women.
Reason for unemploymentFootnote 29
In general, workers can become unemployed for various reasons, and the cause of unemployment is a key factor in determining if an individual is eligible for EI benefits. EI regular benefits are available only to unemployed individuals with a valid reason for job separation according to the Employment Insurance Act.
The Labour Force Survey reports 5 categories of reasons for unemployment: job leavers, permanent layoff, temporary layoff, not worked in last year and never worked.Footnote 30 Of these, permanent and temporary layoff are most relevant to the administration of the EI program. Between the 2 fiscal years (2022‑23 and 2023‑24), unemployment due to permanent layoffs represented the largest share of all unemployment, increasing on average from 35.1% in 2022‑23 to 39.3% in 2023‑24, surpassing its pre-pandemic level of 37.1% in 2019‑20. The proportion of unemployed individuals who did not work in the last year declined from 28.1% to 24.3%, remaining above its pre-pandemic level of 23.3%. Similarly, the share of job leavers fell from 19.6% to 18.9%, dropping below its pre-pandemic level of 20.6%. The share of individuals who never worked rose from 13.4% to 14.0%, exceeding its pre-pandemic level of 11.8%. Lastly, the share of temporary layoffs decreased from 3.9% to 3.4%, falling below its pre-pandemic level of 7.2% (consult Chart 8).

Text description for Chart 8
| Reasons | 2019‑20 | 2022‑23 | 2023‑24 |
|---|---|---|---|
| Job leavers | 20.6% | 19.6% | 18.9% |
| Permanent layoff | 37.1% | 35.1% | 39.3% |
| Temporary layoff | 7.2% | 3.9% | 3.4% |
| Have not worked in last year | 23.3% | 28.1% | 24.3% |
| Never worked | 11.8% | 13.4% | 14.0% |
Source: Statistics Canada, Labour Force Survey, Table 14-10-0125-01, seasonally unadjusted.
Hours of workFootnote 31
Hours of work are closely related to the administration of the EI program. The number of hours of insurable employment is a key eligibility criterion of the EI program, as claimants must have worked a minimum number of insurable hours during the qualifying period to be eligible to receive EI benefits. The number of hours of insurable employment also determines, along with the regional unemployment rate, the maximum number of weeks of EI regular benefits that a claimant is entitled to receive.
In 2023‑24, the average number of hours Canadians usually worked per week across all jobs was 36.5, remaining virtually unchanged from 2022‑23. In contrast, the average number of actual hours worked reflects temporary decreases or increases in work hours, for example, hours lost due to illness or vacation or more hours worked due to overtime. The average number of hours Canadians actually worked per week was 32.9, showing a slight change from the previous fiscal year (32.8).
Job vacanciesFootnote 32 and labour market tightness
Job vacancies is the number of unoccupied positions for which employers are actively seeking workers, whereas the job vacancy rate is number of job vacancies expressed as a proportion of total labour demand (both occupied and vacant jobs).
During the 2023‑24 period, both job vacancies and job vacancy rates have been steadily declining, nearing pre-pandemic levels. The number of job vacancies fell from 832,000 in the last quarter of 2022‑23 to 641,000 in the last quarter of 2023‑24, exceeding the average pre-pandemic level of 540,000 in 2019‑20 and representing a decline of 22.9% compared to the same quarter in the previous fiscal year. Similarly, the job vacancy rate decreased from 4.7% in the last quarter of 2022‑23 to 3.6% in the last quarter of 2023‑24, surpassing the pre-pandemic level of 3.2% in 2019‑20, representing a decrease of 1.1 p.p. between the 2 quarters (consult Chart 9).

Text description for Chart 9
| Quarter | Job vacancies (in thousands) (left scale) | Job vacancy rate (%) (right scale) |
|---|---|---|
| Q3 2021-22 | 935 | 5.5% |
| Q4 2021-22 | 943 | 5.4% |
| Q1 2022-23 | 995 | 5.7% |
| Q2 2022-23 | 945 | 5.3% |
| Q3 2022-23 | 867 | 4.9% |
| Q4 2022-23 | 832 | 4.7% |
| Q1 2023-24 | 773 | 4.4% |
| Q2 2023-24 | 686 | 3.8% |
| Q3 2023-24 | 660 | 3.7% |
| Q4 2023-24 | 641 | 3.6% |
Source: Statistics Canada, Job vacancies, payroll employees and job vacancy rate by provinces and territories, monthly Table 14-10-0432-01, seasonally adjusted.
An indicator of labour market tightness is the unemployment-to-vacancy (UV) ratio. This ratio measures the potential number of available unemployed people for each vacant position. A lower UV ratio indicates a tighter labour market characterized by more job vacancies and fewer unemployed persons available to fill up vacant positions, possibly leading to longer vacancy durations. Conversely, a higher UV ratio corresponds to easing of the labour market with more unemployed persons and fewer job vacancies, making it easier for firms to fill up vacant positions. A comparison of the UV ratio between 2 points in time indicates how labour market conditions evolve over the period.
During the 2023‑24 period, the UV ratio has been on an upward trend (consult Chart 10). The UV ratio increased from 1.3 in the last quarter of 2022‑23 to 2.0 in the last quarter of 2023‑24. The UV ratio for the first 3 quarters of 2023‑24 was also higher compared to the same periods in the previous fiscal year, indicating that labour market conditions have been steadily easing. The continued easing of the labour market is partially explained by the strong population growth driven by international migration (permanent immigration and non-permanents residents) and a slowdown in aggregate demand for good and services.

Text description for Chart 10
| Quarter | Unemployment-to-vacancy ratio |
|---|---|
| Q1 2022-23 | 1.1 |
| Q2 2022-23 | 1.1 |
| Q3 2022-23 | 1.2 |
| Q4 2022-23 | 1.3 |
| Q1 2023-24 | 1.4 |
| Q2 2023-24 | 1.7 |
| Q3 2023-24 | 1.9 |
| Q4 2023-24 | 2.0 |
Sources: Statistics Canada, Job Vacancies, payroll employees and job vacancy rate by provinces and territories, monthly Table 14-10-0432-01, seasonally adjusted (for job vacancies) and Labour Force Survey, Table 14-10-0287-01 seasonally adjusted (for unemployment). Data on job vacancies and unemployment for Canada exclude territories.
Job vacancies and job vacancy rates varied substantially across industries. A decrease in levels of job vacancies has been observed in all industrial groups between the last quarter of 2022‑23 and the last quarter of 2023‑24 (consult Table 1). Information, culture, and recreation, Manufacturing, and Accommodation and food services had the most substantial declines in levels of job vacancies while Public administration, Educational services, and Health care and social assistance registered the smallest decreases in job vacancies among all industries.
Similarly, job vacancy rates also decreased for all industrial groups. Accommodation and food services, and Business, building and other support services had the largest decreases in job vacancy rates, whereas Education services, Public administration and Utilities registered the smallest reductions in job vacancy rates among industries between the last quarter of the previous fiscal year and the last quarter of 2023‑24 (consult Table 1).
| Industry | Job vacancies Q4 2022‑23 | Job vacancies Q4 2023‑24 | Job vacancies change (%) Q4 2022‑23 to Q4 2023‑24 | Job vacancy rate Q4 2022‑23 (%) | Job vacancy rate Q4 2023‑24 (%) | Job vacancy rate change (% points) Q4 2022‑23 to Q4 2023‑24 |
|---|---|---|---|---|---|---|
| Agriculture, forestry, fishing, and hunting | 12,750 | 9,215 | -27.3% | 5.0 | 3.7 | -1.3 |
| Mining, quarrying, and oil and gas extraction | 8,330 | 5,805 | -30.2% | 3.8 | 2.7 | -1.1 |
| Utilities | 3,095 | 2,820 | -8.4% | 2.3 | 2.1 | -0.2 |
| Construction | 69,560 | 52,150 | -25.2% | 5.7 | 4.3 | -1.4 |
| Manufacturing | 64,005 | 42,240 | -34.2% | 3.9 | 2.6 | -1.3 |
| Wholesale and retail trade | 122,745 | 84,170 | -31.4% | 4.1 | 2.9 | -1.2 |
| Transportation and warehousing | 45,665 | 36,220 | -20.2% | 5.2 | 4.1 | -1.1 |
| Information, culture, and recreation | 29,045 | 18,630 | -35.9% | 2.5 | 1.6 | -0.9 |
| Finance, insurance, real estate, rental and leasing | 42,145 | 30,330 | -28.0% | 3.6 | 2.6 | -1.0 |
| Professional, scientific and technical services | 51,750 | 43,830 | -15.2% | 4.1 | 3.5 | -0.6 |
| Business, building and other support services | 54,780 | 40,220 | -26.3% | 9.2 | 6.8 | -2.4 |
| Educational services | 23,905 | 22,830 | -4.5% | 1.7 | 1.6 | -0.1 |
| Health care and social assistance | 144,750 | 135,560 | -6.4% | 6.0 | 5.5 | -0.5 |
| Accommodation and food services | 109,930 | 72,910 | -34.0% | 7.9 | 5.3 | -2.6 |
| Other services (except public administration) | 37,335 | 29,645 | -20.2% | 6.3 | 4.9 | -1.4 |
| Public administration | 14,745 | 14,565 | -1.5% | 2.7 | 2.5 | -0.2 |
| All industries | 834,535 | 641,140 | -23.1% | 4.7 | 3.6 | -1.1 |
Source: Statistics Canada, Job vacancies, payroll employees, and job vacancy rate by industry sector, quarterly, Table 14-10-0400-01, adjusted for seasonality
WagesFootnote 33
Employment earnings are another important factor for the administration of the EI program. They determine the EI premiums paid by both employers and employees, as well as the level of benefits claimants are eligible to receive. Employment earnings can be a combination of hourly wages and hours worked, a fixed amount paid for a specific period (a week, for example) or in the form of commissions, tips, or bonuses. To better understand the evolution of wages in Canada, we analyzed key indicators such as average hourly nominal wages and average weekly earnings.
The evolution of nominal wages can be influenced by several factors including labour productivity, labour market tightness, inflation, demographic shifts, structural changes in the labour market such as minimum wage increases. As an example, an increase in inflation and a tighter labour market are more likely to generate an increase in nominal wages. Unlike in the previous fiscal year, nominal wages have been increasing at a higher rate than inflation in 2023‑24, hence real wages are growing. Since February 2023, the nominal wage growth has outpaced inflation, following 2 consecutive years of sluggish growth. Nominal wages have grown on average by 5.0% while inflation have risen by 3.3%, resulting in average growth in real wages of 1.7% in 2023‑24 (consult Chart 11).

Text description for Chart 11
| Month | Average nominal hourly wage growth | Average real hourly wage rate growth | CPI inflation |
|---|---|---|---|
| Apr-22 | 3.3% | -3.5% | 6.8% |
| May-22 | 3.6% | -4.1% | 7.7% |
| Jun-22 | 4.9% | -3.2% | 8.1% |
| Jul-22 | 4.3% | -3.3% | 7.6% |
| Aug-22 | 4.9% | -2.2% | 7.0% |
| Sep-22 | 4.9% | -2.0% | 6.9% |
| Oct-22 | 5.3% | -1.5% | 6.9% |
| Nov-22 | 5.7% | -1.1% | 6.8% |
| Dec-22 | 4.7% | -1.6% | 6.3% |
| Jan-23 | 4.5% | -1.5% | 5.9% |
| Feb-23 | 5.4% | 0.1% | 5.3% |
| Mar-23 | 5.3% | 1.0% | 4.3% |
| Apr-23 | 5.1% | 0.7% | 4.4% |
| May-23 | 5.1% | 1.7% | 3.4% |
| Jun-23 | 4.2% | 1.4% | 2.8% |
| Jul-23 | 5.0% | 1.8% | 3.3% |
| Aug-23 | 4.9% | 0.9% | 4.0% |
| Sep-23 | 5.1% | 1.3% | 3.8% |
| Oct-23 | 4.8% | 1.7% | 3.1% |
| Nov-23 | 4.8% | 1.7% | 3.1% |
| Dec-23 | 5.5% | 2.1% | 3.4% |
| Jan-24 | 5.2% | 2.4% | 2.9% |
| Feb-24 | 5.0% | 2.2% | 2.8% |
| Mar-24 | 5.1% | 2.2% | 2.9% |
Sources: Statistics Canada, Consumer Price Index Measures, Table 18-10-0004-01 (for CPI) and Labour Force Survey, Table 14-10-0063-01 (for nominal hourly wage). Real hourly wage is the difference between nominal hourly wage and CPI inflation.
Another key indicator is average nominal weekly earnings. This measure is influenced not only by gross weekly nominal earnings by an employee (including overtime), but also by the number of weekly hours worked by an employee (including overtime). While the average weekly hours worked by an employee remained relatively unchanged compared to the previous fiscal year, the average nominal weekly earnings increased by 3.9%, rising from $1,171 in 2022‑23 to $1,217 in 2023‑24, which is equivalent to a $45.42 increase in weekly earnings.Footnote 34
1.3 Canada's regional labour market
Labour market developments at the national level may not be consistently observed across regions. This subsection examines the evolution of some key labour market indicators at the provincial and territorial levels in Canada.Footnote 35
Labour force and participation rate
In 2023‑24, all provinces, and Yukon registered labour force increases compared to 2022‑23. Prince Edward Island had the highest growth in its labour force followed by Yukon and Alberta during this period (consult Table 2). Conversely, the Northwest Territories and Nunavut experienced decreases in labour force growth between the 2 fiscal years (consult Table 2).
While the national participation rate in Canada for 2023‑24 remained unchanged compared to the previous fiscal year, significant variations were noted at the provincial and territorial levels. Prince Edward Island and Yukon were the only regions to register significant increases in their participation rates while the Northwest Territories and Nunavut recorded the largest declines in participation rates over the 2 fiscal periods (consult Table 2).
| Province or territory | Change in labour force 2022‑23 to 2023‑24 | Participation rate 2022‑23 | Participation rate 2023‑24 | Change in participation rate (% points) 2022‑23 to 2023‑24 |
|---|---|---|---|---|
| Newfoundland and Labrador | +1.1% | 58.0% | 57.8% | -0.2 |
| Prince Edward Island | +7.6% | 64.6% | 66.8% | +2.1 |
| Nova Scotia | +3.1% | 61.8% | 61.9% | +0.1 |
| New Brunswick | +2.8% | 60.6% | 60.4% | -0.2 |
| Quebec | +2.8% | 64.7% | 64.7% | 0.0 |
| Ontario | +3.4% | 65.5% | 65.6% | +0.1 |
| Manitoba | +3.4% | 66.7% | 66.9% | +0.3 |
| Saskatchewan | +2.2% | 67.6% | 67.2% | -0.3 |
| Alberta | +4.0% | 69.7% | 69.5% | -0.2 |
| British Columbia | +3.5% | 65.6% | 65.8% | +0.3 |
| Yukon | +5.2% | 72.8% | 74.5% | +1.7 |
| Northwest Territories | -2.3% | 75.7% | 73.4% | -2.3 |
| Nunavut | -2.1% | 63.9% | 61.6% | -2.3 |
| Canada* | +3.3% | 65.6% | 65.7% | 0.2 |
- * Figures for Canada's labour force and participation rate exclude the territories. Percentage change is based on unrounded numbers.
- Sources: Statistics Canada; Labour Force Survey, Table 14-10-0287-01 and 14-10-0292-01, seasonally adjusted data.
Employment and employment rate
In 2023‑24, all provinces and Yukon had an increase in employment compared to 2022‑23. Prince Edward Island, Yukon and Alberta recorded the highest growth in employment during this period (consult Table 3).
Although the national employment rate declined by 0.2 p.p. over the 2 fiscal years, significant variations were observed at the provincial and territorial levels. Overall, 7 out of 13 regions experienced decreases in employment rates, except for Yukon, Prince Edward Island, and Newfoundland and Labrador which saw employment rates increases between the 2 fiscal years. Quebec, Nunavut, and Manitoba were the only regions where employment rates remained unchanged.
| Province or territory | Change in employment 2022‑23 to 2023‑24 | Employment rate 2022‑23 | Employment rate 2023‑24 | Change in employment rate (% points) 2022‑23 to 2023‑24 |
|---|---|---|---|---|
| Newfoundland and Labrador | +1.9% | 52.0% | 52.2% | +0.2 |
| Prince Edward Island | +7.3% | 60.0% | 61.0% | +1.0 |
| Nova Scotia | +2.7% | 57.9% | 57.8% | -0.1 |
| New Brunswick | +2.8% | 56.4% | 56.3% | -0.1 |
| Quebec | +2.3% | 62.0% | 62.0% | 0.0 |
| Ontario | +2.7% | 62.0% | 61.7% | -0.3 |
| Manitoba | +2.7% | 63.7% | 63.6% | 0.0 |
| Saskatchewan | +1.8% | 64.5% | 63.9% | -0.6 |
| Alberta | +3.6% | 65.7% | 65.3% | -0.4 |
| British Columbia | +2.7% | 62.6% | 62.3% | -0.2 |
| Yukon | +5.4% | 69.8% | 71.6% | +1.8 |
| Northwest Territories | -2.9% | 71.7% | 69.0% | -2.6 |
| Nunavut | -2.0% | 55.8% | 55.8% | 0.0 |
| Canada* | +2.7% | 62.2% | 62.1% | -0.2 |
- * Figures for Canada's employment and employment rate exclude the territories. Percentage change is based on unrounded numbers.
- Sources: Statistics Canada; Labour Force Survey, Table 14-10-0287-01 and 14-10-0292-01, seasonally adjusted data.
Employment insurance receipt, the local unemployment and employment among temporary residents
Temporary Residents (TRs) in Canada include visitors, students, workers, and other TR permit holders. Foreign nationals can work under either the Temporary Foreign Worker Program (TFWP) which issues employer-specific work permits and require a positive Labour Market Impact Assessment (LMIA), or the International Mobility Program (IMP), which grants both employer- specific and open work permits depending on program stream. The International Student Program (ISP) issues study permits and allows students to work on- and off-campus without a work permit.
TRs help offset the impact of Canada's shrinking working age population due to population ageing and contribute to mitigating labor shortages in most regions and sectors. A recent departmental study* analyses how the employment of TRs holding all permit types affects local labour market conditions, and the receipt of Employment Insurance (EI) benefits across different EI regions. Using data from the Employment Insurance Coverage Survey (EICS), the Canadian Employer-Employee Dynamics Database (CEEDD) and Labour Force Surveys (LFS) from 2014 to 2019, the study finds that approximately 80.1% of TRs who filed taxes during this period were employed, with their employment rate across EI regions varying from 65.5% in London to 95.0% in the Territories. TFWP work permit holders had the highest likelihood of being employed given that they held employer-specific work permits, followed by IMP work permit holders (which included TRs with open work permits) and study permit holders.
The study includes a complementary analysis to examine the marginal effects of the employment of TRs on labour market conditions in EI regions. The analysis finds that employed TRs, particularly TFWP work permit holders, were more likely to reside in EI regions with low unemployment rates (low-ranked EI regions), and low shares of the population of EI recipients of any type. Conversely, employed TRs holding other permit types were likely to be found in medium-ranked EI regions.
Furthermore, EI regions with the lowest proportion of EI benefits recipients also had the highest shares of employed TRs holding all permit types except for IMP work permit holders employed in the Agriculture, Forestry, Fishing and Hunting; Mining, Quarrying, and Oil and Gas Extraction sector who were more likely to reside in EI regions with higher shares of EI benefit recipients.
* ESDC, Employment insurance receipt, the local unemployment and employment among temporary residents. (Ottawa: ESDC, Labour Market Information Directorate, 2025)
Unemployment and unemployment rate
In 2023‑24, all regions, except for Newfoundland and Labrador, Yukon and Nunavut, experienced increases in unemployment levels compared to the previous fiscal period. All in all, 6 out of 10 provinces experienced increases in unemployment levels above 10%. British Columbia, Ontario, and Manitoba registered the largest increases in unemployment while Newfoundland and Labrador, Yukon, and Nunavut experienced decreases during this period (consult Table 4).
During the same period, all provinces and Northwest Territories registered increases in their unemployment rates except for Newfoundland and Labrador, Yukon, and Nunavut which had decreases in their unemployment rates as the growth in their labour force exceeded the growth in their unemployment levels. New Brunswick was the only province where the unemployment rate remained unchanged. In 2023‑24, Yukon, and 4 provinces (Quebec, Manitoba, Saskatchewan, and British Columbia) had lower unemployment rates than the national unemployment rate (5.6%).
| Province or territory | Change in unemployment 2022‑23 to 2023‑24 | Unemployment rate 2022‑23 | Unemployment rate 2023‑24 | Change in unemployment rate (% points) 2022‑23 to 2023‑24 |
|---|---|---|---|---|
| Newfoundland and Labrador | -5.9% | 10.5% | 9.7% | -0.7 |
| Prince Edward Island | +12.0% | 7.1% | 7.4% | +0.3 |
| Nova Scotia | +8.2% | 6.3% | 6.6% | +0.3 |
| New Brunswick | +2.6% | 6.9% | 6.8% | 0.0 |
| Quebec | +12.1% | 4.2% | 4.6% | +0.4 |
| Ontario | +15.2% | 5.3% | 5.9% | +0.6 |
| Manitoba | +15.2% | 4.5% | 4.9% | +0.4 |
| Saskatchewan | +11.6% | 4.5% | 4.9% | +0.4 |
| Alberta | +9.9% | 5.6% | 6.0% | +0.3 |
| British Columbia | +20.4% | 4.6% | 5.3% | +0.8 |
| Yukon | -4.9% | 4.1% | 3.7% | -0.4 |
| Northwest Territories | +8.5% | 5.4% | 6.0% | +0.6 |
| Nunavut | -3.2% | 12.8% | 12.7% | -0.1 |
| Canada* | +13.3% | 5.1% | 5.6% | +0.5 |
- * Figures for Canada's unemployment and unemployment rate exclude the territories. Percentage change is based on unrounded numbers.
- Sources: Statistics Canada; Labour Force Survey, Table 14-10-0287-01 and 14-10-0292-01, seasonally adjusted data.
Duration of unemployment
In 2023‑24, the average duration of unemployment in Canada was 5.5% lower than in 2022‑23. Significant differences were noted at provincial level. Compared to 2022-23, all provinces had decreases in average unemployment duration in 2023-24, except for Manitoba, and British Columbia where average durations increased (consult Table 5). Prince Edward Island, Quebec, and Saskatchewan recorded the largest declines in average unemployment duration that exceeded the national average over the 2 fiscal periods. Alberta was the only province where the average unemployment duration remained unchanged.
| Province | Average weeks of unemployment 2022‑23 | Average weeks of unemployment 2023‑24 | Difference in average weeks of unemployment 2022‑23 to 2023‑24 | Change (%) in average weeks of unemployment 2022‑23 to 2023‑24 |
|---|---|---|---|---|
| Newfoundland and Labrador | 18.8 | 17.7 | -1.1 | -5.9% |
| Prince Edward Island | 19.8 | 14.1 | -5.7 | -28.7% |
| Nova Scotia | 20.1 | 19.8 | -0.3 | -1.3% |
| New Brunswick | 17.1 | 15.4 | -1.7 | -9.7% |
| Quebec | 17.8 | 14.5 | -3.3 | -18.5% |
| Ontario | 18.9 | 18.2 | -0.7 | -3.5% |
| Manitoba | 18.3 | 19.0 | 0.7 | 3.7% |
| Saskatchewan | 20.0 | 16.5 | -3.5 | -17.5% |
| Alberta | 20.5 | 20.5 | 0.0 | 0.2% |
| British Columbia | 17.0 | 17.7 | 0.6 | 3.8% |
| Canada | 18.5 | 17.5 | -1.0 | -5.5% |
- * Excludes the territories. Percentage change is based on unrounded numbers.
- Sources: Statistics Canada; Labour Force Survey, Table 14-10-0342-01.
Weekly hours and earnings
In 2023‑24, Canada had an increase of 0.3% in the average weekly hours actually worked compared to 2022‑23. Significant variations were observed at provincial and territorial levels. Compared to the previous fiscal year, the average weekly hours actually worked increased in all provinces except for Quebec, Saskatchewan and British Columbia which registered decreases (consult Table 6).
Over the same period, the average nominal weekly earnings and inflation increased in all provinces and territories compared to 2022‑23. All regions, except for Saskatchewan, Alberta, and the Northwest Territories, had increases in nominal weekly earnings that exceeded their inflation, indicating that the purchasing power of the average worker in these regions improved in 2023‑24. The change in average nominal weekly earnings was above the national average in all regions, except for Saskatchewan, Alberta, Ontario, New Brunswick, Northwest Territories and Nunavut (consult Table 6).
| Province or territory | Average weekly hours worked* 2023‑24 | Change in average weekly hours worked (%) 2022‑23 to 2023‑24 | Average nominal weekly earnings** 2023‑24 | Change in average nominal weekly earnings (%) 2022‑23 to 2023‑24 | Change in consumer price index (%) 2022‑23 to 2023‑24 |
|---|---|---|---|---|---|
| Newfoundland and Labrador | 34.2 | 1.5% | $1,210 | 4.3% | 2.7% |
| Prince Edward Island | 34.4 | 1.3% | $1,030 | 4.4% | 1.9% |
| Nova Scotia | 32.8 | 1.2% | $1,082 | 5.3% | 3.3% |
| New Brunswick | 33.9 | 0.9% | $1,115 | 3.6% | 2.8% |
| Quebec | 31.6 | -0.8% | $1,167 | 4.3% | 4.0% |
| Ontario | 33.2 | 0.8% | $1,243 | 3.7% | 3.2% |
| Manitoba | 33.6 | 2.5% | $1,114 | 4.2% | 2.3% |
| Saskatchewan | 33.7 | -0.1% | $1,174 | 2.3% | 3.0% |
| Alberta | 34.2 | 0.4% | $1,291 | 2.4% | 3.2% |
| British Columbia | 32.2 | -0.2% | $1,230 | 5.0% | 3.2% |
| Yukon | n.a. | n.a. | $1,397 | 4.3% | 3.8% |
| Northwest Territories | n.a. | n.a. | $1,608 | 2.4% | 2.5% |
| Nunavut | n.a. | n.a. | $1,634 | 3.4% | 2.4% |
| Canada*** | 32.9 | 0.3% | $1,217 | 3.9% | 3.3% |
- * Weekly hours worked reflect the number of hours actually worked in the reference week of the Labour Force Survey from all jobs, including overtime.
- ** Earnings data are based on gross payroll before source deductions; this includes earnings for overtime.
- *** Excludes the territories. Percentage change is based on unrounded numbers.
- Sources: Statistics Canada, Labour Force Survey, Table 14-10-0042-01, unadjusted for seasonally (for hours worked), Survey of Employment, Payrolls and Hours, Table 14-10-0203-01, unadjusted for seasonality (for nominal weekly earnings) and Consumer Price Index Measures, Table 18-10-0004-01, unadjusted for seasonality (for CPI).
Job vacancies and labour market tightness
Job vacancies decreased in all provinces and territories except for Nunavut in the last quarter of 2023‑24 compared to the same quarter in the previous fiscal year (consult Table 7). Prince Edward Island, Yukon, Quebec, and Ontario had the largest declines in job vacancies among all regions that exceeded the national average (-22.9%). Similarly, the job vacancy rate decreased in all regions except for Nunavut over the 2 fiscal years. Quebec, Ontario, British Columbia, and Yukon had higher decreases in job vacancy rates than the national average (-1.3 p.p.). In 2023-24, job vacancy rates varied significantly across regions. Saskatchewan, British Columbia, Quebec, Alberta, and all territories had higher job vacancy rates than the national average (3.9%) during this period (consult Table 7).
With the number of unemployed people rising and job vacancies decreasing in almost all regions, the UV ratio showed signs of easing in regional labour markets in 2023‑24 although they remained relatively tight. The UV ratio was relatively low in all provinces in the last quarter of 2022‑23 but increased in the last quarter of 2023‑24, reflecting a loosening of the labour market over the 2 fiscal years (consult Chart 12).
| Province and territory | Change in number of job vacancies (%) Q4 of 2022‑23 to Q4 of 2023‑24 | Job vacancy rate (%) 2023‑24 | Change in job vacancy rate (% points) 2022-23 to 2023-24 | Unemployment-to-vacancy ratio 2023‑24 |
|---|---|---|---|---|
| Newfoundland and Labrador | -6.0% | 3.2% | -0.3 | 3.9 |
| Prince Edward Island | -27.3% | 3.8% | -1.3 | 2.6 |
| Nova Scotia | -21.6% | 3.7% | -1.0 | 2.2 |
| New Brunswick | -20.9% | 3.6% | -0.8 | 2.4 |
| Quebec | -27.2% | 4.1% | -1.5 | 1.3 |
| Ontario | -25.0% | 3.5% | -1.4 | 2.1 |
| Manitoba | -19.9% | 3.8% | -0.7 | 1.6 |
| Saskatchewan | -15.7% | 4.4% | -0.5 | 1.3 |
| Alberta | -17.3% | 4.0% | -0.8 | 1.8 |
| British Columbia | -19.0% | 4.4% | -1.4 | 1.4 |
| Yukon | -24.3% | 5.2% | -2.2 | 0.9 |
| Northwest Territories | -5.8% | 5.4% | -1.2 | 1.2 |
| Nunavut | 25.8% | 4.2% | 0.8 | 3.9 |
| Canada | -22.9% | 3.9% | -1.3 | 1.8 |
Sources: Statistics Canada, Table 14-10-0432-01, Job vacancies, payroll employees, and job vacancy rate by provinces and territories, monthly, adjusted for seasonally (for job vacancies) and Labour Force Survey, Table 14-10-0287-01, and Table 14-10-0292-01, adjusted for seasonality (for unemployment).

Text description for Chart 12
| Region | Unemployment-to-vacancy ratio, last quarter of 2022-23 | Unemployment-to-vacancy ratio, last quarter of 2023-24 |
|---|---|---|
| Canada | 1.3 | 2.0 |
| Newfoundland and Labrador | 4.0 | 4.3 |
| Prince Edward Island | 1.8 | 2.8 |
| Nova Scotia | 1.5 | 2.4 |
| New Brunswick | 1.9 | 2.8 |
| Quebec | 0.9 | 1.5 |
| Ontario | 1.5 | 2.5 |
| Manitoba | 1.3 | 1.6 |
| Saskatchewan | 1.1 | 1.6 |
| Alberta | 1.6 | 2.2 |
| British Columbia | 1.1 | 1.5 |
Sources: Statistics Canada, Table 14-10-0432-01, Job vacancies, payroll employees, and job vacancy rate by provinces and territories, monthly, adjusted for seasonality, (for job vacancies) and Labour Force Survey, Table 14-10-0287-01, adjusted for seasonality (for unemployment).
1.4 Summary
While the global economic environment experienced robust growth and declining inflation in 2023‑24, the Canadian economy saw a reduction in annualized real GDP growth by 2.5 p.p. and a significant decrease in inflation during this same period. Inflation dropped from a peak of 8.1 % in June 2022 to 2.9% in March 2024, although it remained above the Bank of Canada target of 2%. The decline in inflationary pressures was due to tighter monetary policy (increase of the interest rate), falling energy prices and improvements in global supply chain conditions.
In 2023‑24, Canada experienced a significant population growth driven by higher immigration and non permanent residents which had a considerable impact on its labour market. This led to a moderate employment growth that was insufficient to fully absorb labour force growth, causing the national unemployment rate to rise by 1 p.p., from 5.1% in April 2023 to 6.1% in March 2024. At the same time, steady declines in job vacancies and job vacancy rates, combined with increasing unemployment-vacancy (UV) ratio, contributed to a gradual easing of labour market conditions. Higher population growth and the slowdown in demand for goods and services shifted the Canadian economy from excess demand pressures to moderate excess supply pressures.
At the regional level, all provinces and Yukon registered employment growth in 2023‑24 compared to the previous fiscal year, with the largest gains in Prince Edward Island, Yukon, and Alberta. All regions, except for Newfoundland and Labrador, Yukon and Nunavut, had increases in unemployment rates, as labour force growth outpaced changes in unemployment levels in these regions. This, coupled with declining job vacancies and rising UV ratios in almost all regions, signaled a loosening of labour markets, although they remained relatively tight compared to the pre-pandemic levels. In 2023‑24, Yukon, Northwest Territories, Saskatchewan, and Quebec had the tightest labour markets, while Newfoundland and Labrador and Nunavut had the loosest.
The impact of these recent labour market developments on the EI program is discussed in the following sections of this report.