
Technical report: Estimating the net impact of the Opportunities Fund for Persons with Disabilities program, 2026
By: Christiane Arsenault, Momath Wilane, Yu-Hsien Liu, Begench Yazlyyev, Aurelas Tohon and Andy Handouyahia
On this page
- List of tables
- List of figures
- List of abbreviations
- Acknowledgement
- Executive summary
- 1. Introduction
- 2. Methodology
- 3. Socio-demographic profile of participants
- 4. Net impacts analysis results
- 5. Cost-benefit analysis
- 6. Conclusion
- Appendix A: Propensity score distribution and common support region for overall OFPD
- Appendix B: Covariates used in MCF model
- Appendix C: Detailed socio-demographic characteristics results
- Appendix D: Distribution of participants across different disability types by intervention, gender and age
- Appendix E: Average treatment effects (ATE) for all individuals by intervention using Modified Causal Forest
- Appendix F: Profile by group for overall OFPD
- Appendix G: Robustness check
- References
- Footnotes
Alternate formats

Technical report: Estimating the net impact of the Opportunities Fund for Persons with Disabilities program, 2026 [PDF - 1.5 MB]
Large print, braille, MP3 (audio), e-text and DAISY formats are available on demand by ordering online or calling 1 800 O-Canada (1-800-622-6232). If you use a teletypewriter (TTY), call 1-800-926-9105.
List of tables
- Table 1: Gender distribution of participants compared to the Canadian population with disabilities
- Table 2: Age distribution of participants compared to the Canadian population with disabilities
- Table 3: OFPD participants compared to the Canadian population with disabilities, by other socio-demographic characteristics
- Table 4: Net impact estimates for overall OFPD participants, post-program period until 2022 (cohort of fiscal years 2015/2016 and 2016/2017) (n = 7,591)
- Table 5: Net impact estimates for OF-EEAS participants, post-program period until 2022 (cohort of fiscal years 2015 and 2016 and 2016 and 2017) (n = 3,761)
- Table 6: Net impact estimates for OF-WS participants, post-program period until 2022 (cohort of fiscal years 2015/2016 and 2016/2017) (n = 3,063)
- Table 7: Net impact estimates for OF-SFE participants, post-program period until 2021 (cohort of fiscal years 2015/2016 and 2016/2017) (n = 767)
- Table 8: Costs and benefits accounting framework from the perspectives of participants, government, and society
- Table 9: Variable used in Modified Causal Forests model
- Table 10: Variables removed by feature selection of 5-year annual average outcome for overall OFPD
- Table 11: OFPD participants by Action Plan Equivalent type (n = 7,893)
- Table 12: OFPD participants by Action Plan Equivalent type and fiscal year (n = 7,893)
- Table 13: OFPD participants by Action Plan Equivalent type and gender (n = 7,893)
- Table 14: OFPD participants by Action Plan Equivalent type and age group (n = 7,893)
- Table 15: OFPD participants by Action Plan Equivalent type and disability (n = 7,893)
- Table 16: OFPD participants by Action Plan Equivalent type and marital status (n = 7,893)
- Table 17: OFPD participants by Action Plan Equivalent type and socio-demographic characteristics (n = 7,893)
- Table 18: OFPD participants by Action Plan Equivalent type and DTC claimant status (n = 7,893)
- Table 19: OFPD participants by Action Plan Equivalent type and province (n = 7,893)
- Table 20: OFPD participants by Action Plan Equivalent type and earnings range one year prior to starting the intervention (n = 7,893)
- Table 21: OFPD participants by Action Plan Equivalent type and social assistance / Employment Insurance recipient status one year prior to starting the intervention (n = 7,893)
- Table 22: Proportion of participants by intervention types who claimed COVID-19 support via EI (%) (n = 7,893)
- Table 23: Distribution of participants by types of disability and intervention (%) (n = 7,893)
- Table 24: Gender distribution of overall OFPD participants by types of disability (%) (n = 7,893)
- Table 25: Age distribution of overall OFPD participants by types of disability (%) (n = 7,893)
- Table 26: Average Treatment Effects for OFPD overall (2015-2016 fiscal year cohort) over post participation period until 2022 (n = 7,591)
- Table 27: Average Treatment Effects for EEAS (2015-2016 fiscal year cohort) over post participation period until 2022 (n = 3,761)
- Table 28: Average Treatment Effects for WS (2015-2016 fiscal year cohort) over post participation period until 2022 (n = 3,063)
- Table 29: Average Treatment Effects for SFE (2015-2016 fiscal year cohort) over post participation period until 2022 (n = 767)
- Table 30: Profile of overall OFPD participants by fiscal year (n = 7,893)
- Table 31: Profile of overall OFPD participants by gender (n = 7,893)
- Table 32: Profile of overall OFPD participants by age groups (n = 7,893)
- Table 33: Profile of overall OFPD participants by disability type (n = 7,893)
- Table 34: Profile of overall OFPD participants by marital status (n = 7,893)
- Table 35: Profile of overall OFPD participants by other socio-demographic characteristic (n = 7,893)
- Table 36: Profile of overall OFPD participants by DTC claimant status (n = 7,893)
- Table 37: Profile of overall OFPD participants by province/territory (n = 7,893)
- Table 38: Profile of overall OFPD participants by income groups (n = 7,893)
- Table 39: Profile of overall OFPD participants by SA/EI recipient status (n = 7,893)
- Table 40: Net impacts for program participants (ATET) by intervention: Employment earnings ($)
- Table 41: Net impacts for program participants by intervention: Incidence of employment (pp.)
- Table 42: Net impacts for program participants by intervention: EI benefits ($)
- Table 43: Net impacts for program participants (ATET) by intervention: SA benefits ($)
List of figures
- Figure 1: Levels of aggregation for effects produced with Modified Causal Forest
- Figure 2: Distribution of individualized average treatment effects for 5-year annual average employment earnings ($) for overall program (n=7,591)
- Figure 3: Distribution of individualized average treatment effects for 5-year annual average incidence of employment (pp) for overall program (n=7,591)
- Figure 4: Distribution of individualized average treatment effects for 5-year annual average employment insurance benefits ($) for overall program (n=7,591)
- Figure 5: Distribution of individualized average treatment effects for 5-year annual average social assistance benefits ($) for overall program (n=7,591)
- Figure 6: Group Average Treatment Effects (GATE) by 5-year annual average incidence of employment (pp.) and employment earnings ($) (n = 7,591)
- Figure 7: Overall OFPD deviation from average by groups for 5-year annual average incidence of employment (pp.) (n = 7,591)
- Figure 8: Overall OFPD deviation from average by groups for 5-year annual average employment earnings ($) (n = 7,591)
- Figure 9: Cost-benefit analysis and social rate of return
- Figure 10: Social return from investing in different types of program activities
- Figure 11: Distribution of estimated propensity scores for Overall OFPD participants and non‑participants
- Figure 12: Distribution of estimated propensity scores for Wage Subsidy participants and non‑participants
- Figure 13: Distribution of estimated propensity scores for Skills for Employment participants and non‑participants
- Figure 14: Distribution of estimated propensity scores for Enhanced Employment Assistance Service participants and non‑participants
List of abbreviations
- APE
- Action Plan Equivalent
- ATE
- Average Treatment Effect
- ATET
- Average Treatment Effect on the Treated
- CBA
- Cost-benefit analysis
- CRA
- Canada Revenue Agency
- DTC
- Disability Tax Credit
- EI
- Employment Insurance
- ESDC
- Employment and Social Development Canada
- LMDA
- Labour Market Development Agreements
- LMPDP
- Labour Market Program Data Platform
- MCF
- Modified Causal Forests
- NPV
- Net present value
- OFPD
- Opportunities Fund for Persons with Disabilities
- OF-EEAS
- Enhanced Employment Assistance Services
- OF-SE
- Self-employment
- OF-SFE
- Skills for Employment
- OF-WE
- Work Experience
- OF-WS
- Wage Subsidy
Acknowledgement
We would like to acknowledge the contributions of those who reviewed this technical report and provided valuable information about the Opportunities Fund for Persons with Disabilities program. We are grateful for the input and support from Jérôme Mercier, Donna Smith-Moncrieffe and our colleagues from the Grants and Contributions Division. We would also like to thank our colleagues from the Opportunities Fund for Persons with Disabilities program and Program Operations Branch for their collaboration and assistance.
Executive summary
This technical report presents the methodology and findings from the net impact and cost-benefit analyses conducted as part of the fifth evaluation of the Opportunities Fund for Persons with Disabilities program (OFPD). The analysis examines whether, and to what extent, participation in OFPD is effective in improving labour market outcomes for participants and yields a positive social return on investment. Specifically, it addresses the following evaluation questions:
- To what extent and in what ways does the program help participants improve their employability, enter the labour market, and/or maintain their labour market attachment?
- How do disability type, gender, or other intersecting identity factors, influence experiences with the program and outcomes for participants?
Program context
The OFPD program supports persons with disabilities to find and keep employment, advance their careers, or become entrepreneurs, by funding third-party organizations to deliver skills training, job placements, self-employment activities and a range of other employment and wrap-around supports. In addition, some funded organizations work with employers to raise awareness of the benefits of hiring persons with disabilities, and to support their integration into the workplace.
Methodology
The analysis focuses on a cohort of individuals who started participating in OFPD interventions between April 2015 and March 2017. Participants' labour market outcomes were followed up to calendar year 2022. The analysis uses rich integrated administrative data from the Labour Market Program Data Platform (LMPDP). The LMPDP is an integrated relational database that contains information from multiple data sources such as program participant data, Employment Insurance (EI) records and income tax data from the Canada Revenue Agency (CRA). Using the LMPDP, we can follow participants' labour market outcomes, including employment earnings, incidence of employment, and use of EI benefits and social assistance (SA).
The analysis uses the Modified Causal Forests (MCF) algorithm to estimate net impacts for participants, compared to similar non-participants. MCF is a novel machine learning method that estimates not only the average program effect but also the heterogeneous program effects, supporting analysis of impact variation across socio-demographic factors.
The cost-benefit analysis assesses the OFPD program's return on investment over a 10-year period following participation. It examines program costs and benefits from 3 perspectives: participants, government, and society. The results include 4 indicators: net present value, the benefit-cost ratio, the payback period, and the social rate of return.
Key findings
Overall, the net impact results show that program participation led to improvements in participants' labour market attachment. While the impacts vary by type of intervention, OFPD participants earned, on average, $1,180 more per year and had a 3.7 percentage points (pp) higher incidence of employment over the 5-year post‑participation period, relative to similar non-participants.
Results from the group analysis indicate that all socio-demographic groups showed positive net impact on employment outcomes, although impacts varied. Below-average impacts on incidence of employment were observed among individual aged 30 or younger, racialized individuals and those with developmental and learning disabilities, whereas individuals aged over 54 years showed above-average impacts on the incidence of employment. Differences in impacts on earnings were also observed across groups, suggesting that some participants may face greater barriers to employment.
The cost-benefit analysis shows that the OFPD program yielded a net positive return on investment over the 10-year post participation period. From a societal perspective, benefits outweigh their associated costs in 3.4 years. Overall, over a 10-year period following the intervention, each $1 invested yielded a net social return of $1.31.
1. Introduction
This technical report presents the methodology and findings from net impact analysis conducted to support the fifth evaluation of the OFPD program. The analysis focuses on a cohort of individuals who participated in the OFPD program between April 2015 and March 2017 and assesses their labour market outcomes following their participation up to calendar year 2022. The net impact analysis uses the novel Modified Causal Forest (MCF) algorithm, and this report details the methodology and approach used. This report also presents results from a cost-benefit analysis, which informs on the OFPD program's cost effectiveness and value for money over a 10-year horizon after program participation.
1.1 OFPD program overview and types of interventions
The OFPD program was introduced in 1997 in response to a report of the Federal Task Force on Disability Issues, which recommended the creation of an employment fund to fill a gap in labour market programming for persons with disabilities, with a view of increasing their participation in the labour force.
The program was first announced in Budget 1997 as a 3-year initiative to reduce barriers to the labour market participation of Canadians with disabilities who were relying on social assistance but would rather work and be financially self-sufficient. The program was designed to serve those who were not in the labour force, but could work either part-time or full-time, if they were provided assistance to prepare for, find and keep jobs.
After the program became permanent in 2000, it had undergone several changes, including recent changes stemming from Budget 2022 announcements in support of Canada's Disability Inclusion Action Plan and the Employment Strategy for Canadians with Disabilities.
The program funds projects delivered by third-party organizations across CanadaFootnote 1 known as Community Coordinators, funding recipients, or service providers. Funded organizations deliver employment supports and services to job seekers with disability or employers, including job search assistance, skills development through training, workplace accommodation supports, and wage subsidies. The following interventions are offered within the framework of OFPD:
- Enhanced Employment Assistance Services (OF-EEAS)
- Wage Subsidy (OF-WS)
- Skills for Employment (OF-SFE)
- Work Experience (OF-WE)
- Self-Employment, Service and Development
Net impact analysis was conducted for the first 3 intervention types, which are described in greater detail below. OF-WE was not included as no OF-WE activities were funded during the analysis reference period. In addition, net impact analysis was not conducted for Self-Employment participants, because personal income tax data alone, without information on assets, liabilities, or income from incorporated businesses, may provide an incomplete assessment of their post-participation outcomes.
Enhanced Employment Assistance Services (OF-EEAS): This intervention supports a variety of pre-employment activities tailored to meet the needs of persons with disabilities and facilitate their integration into employment. They may include counseling and job placement services, access to labour market information, assistance in determining appropriate skills training, and more.
Wage Subsidy (OF-WS): This intervention provides financial incentives to employers to hire persons with disabilities whom they would not typically employ in the form of a share of the wages paid to these participants. The main objective is to place participants in positions that have the potential to become permanent jobs with the host employers. The program also aims to assist participants whose chances of finding employment significantly improve through the establishment of employer-employee relationships.
Skills for Employment (OF-SFE): This intervention enables participants to undertake short-duration training and develop skills, from basic to advanced. Such skills must relate to a specific job opportunity in a stable or expanding sector, and where there is a reasonable expectation of employment.
2. Methodology
2.1 Data and unit of analysis
The report is based on data from the Labour Market Program Data Platform (LMPDP). The LMPDP is an integrated relational database that contains information from multiple data sources such as program participant data, Employment Insurance (EI) records and the income tax data from the Canada Revenue Agency (CRA).
The unit of analysis is the Action Plan Equivalent (APE). It is a group of interventions an individual participated in within 6 months of each other (in other words, a gap of 6 months or less between the end of one intervention and the beginning of the next). The principal intervention is the longest one within an APE. In the selected reference period, APEs are not defined in the OFPD administrative data files and have to be reconstructed from intervention records.
2.2 Population and reference period
The reference period for this study is selected to enable the assessment of program impacts over a 5-year post-participation period. The analysis includes all participants who started an intervention between April 2015 and March 2017. The labour market outcomes of these program participants are then examined up to calendar year 2022, the most recent year of data available at the time of the analysis. The analysis considers the overall OFPD participant group, which comprises individuals who participated in OF-WS, OF-SFE or OF-EEAS interventions, as well as results by intervention type.Footnote 2
2.3 Selection of comparison groups
The technical report estimates the effectiveness of the OFPD program by comparing the outcomes of program participants with their counterfactual outcomes, that is, the outcomes that participants would have experienced in the absence of the program. In order to construct counterfactual outcomes for the program participants during the reference period, a valid comparison group composed of non-participants with similar characteristics and observed pre-participation outcomes is required.
The comparison group is composed of non-EI claimants who shared the same eligibility criteria and socio-demographic characteristics as OFPD participants but had received only minor interventions via Labour Market Development Agreements-Employment Assistance Services (LMDA-EAS) and self-identified as having a disability. The comparison group is drawn from this group of participants who started participation during the same reference period from April 2015 to March 2017. Using participants from the LMDA-EAS as the comparison group has several advantages:
- The LMDA-EAS population is large, making it possible to obtain close matches to program participants in terms of their observable characteristics, their EI history and the timing of their participation.
- The availability of information on several observed characteristics for LMDA-EAS participants facilitates matching techniques needed to develop the counterfactual for OFPD participants (for example, disability types).
- EAS interventions are low-intensity and of short duration (that is, a minor intervention such as helping how to write a curriculum vitae). EAS interventions represent a true "limited treatment".
2.4 Outcome indicators and timeframes
A key consideration in impact evaluation is the choice of the time period for measuring program effects. The time period should be the same for participants and non-participants to ensure comparisons are made within the same political and socioeconomic context. All impacts were measured from the APE start date, when funding begins and to avoid conditioning on future program completion outcomes.
For the following 4 labour market indicators, the net impacts were measured throughout the participation period and up to five years following the start of participation:
Incidence of employment
- This indicator measures the incidence of having earnings from employment and/or self-employment, that is, probability that an individual is employed. It is derived from T1 and T4 tax return records as a binary variable on an annual basis [1 = had employment earnings (in either the pre- or post-participation period), 0 = no employment earnings].
Employment earnings
- This indicator measures the total earnings an individual had from paid employment and/or self-employment. It is captured from the T1 and T4 supplementary forms. To account for the possibility that multiple T4 forms may be issued for an individual within a single year, we calculate the annual total employment earnings by aggregating earnings across all the T4s for each individual.
Employment Insurance (EI) benefits
- This indicator measures the total amount of EI benefits received per year. It is captured using EI part I data.
Social assistance (SA) benefits
- This indicator measures the average amount of social assistance benefits received. This information is available on a calendar year basis and is obtained from T1 tax return records.
2.5 Method of estimation
This evaluation is built on the potential outcomes framework (Rubin, 1974). The main idea is that everyone has two possible outcomes: one that would be observed if they participate in OFPD (or a specific OFPD intervention) and another that would be observed if they do not participate. For any given person, only one of these outcomes can be observed in real life. The other outcome is unobserved and represents the counterfactual, that is, what would have happened in the absence of OFPD.
In this report, net impacts represent the difference between participants' observed outcomes and the outcomes they would have experienced without OFPD participation. Because we cannot directly observe what would have happened to participants had they not participated, the analysis constructs a counterfactual by identifying comparable non-participants. This counterfactual comparison is essential because simple differences between participants and non-participants may reflect selection effects (differences in who participates), rather than the causal effect of OFPD. In addition, to avoid the influence of outliers, this study excluded individuals whose average annual earnings over the five years prior to participation were higher than or equal to $75,000.
To allow valid comparison of outcomes between participants and non-participants, and to be able to identify the causal effects, some underlying assumptions must hold. The data used for the analysis cover a large number of characteristics reflecting individuals' labour market experiences including the socio-demographic characteristics of both participant and comparison cases, as well as their labour market histories. The richness of the available administrative data allows for the inclusion of the most relevant variables influencing the decision to participate in the OFPD program and subsequent labour market outcomes. The use of standard personal characteristics, pre-treatment outcomes, transitions between different labour market states, regional information and labour market history is essential for reducing the likelihood of biased estimators of the true treatment effect. An assessment of the Conditional Independence Assumption demonstrates that the analysis considers most, if not all, factors that determine participation and labour market outcomes. In this context, this study assumes that this assumption is satisfied and the matching estimator can be used with confidence to estimate the incremental impacts of OFPD interventions on the selected outcome indicators.
The common support assumption was assessed by examining the overlap in the distributions between participants and the comparison group of non-participants. Results show substantial overlap between participants and comparison group in each OFPD intervention type (Appendix A). This overlap indicates that participants and non‑participants share similar observed characteristics, ensuring that appropriate counterfactuals can be constructed for impact estimation (Heckman, Lalonde, & Smith, 1999).
Given the small‑scale implementation of OFPD, we assume that the Stable Unit Treatment Value Assumption (SUTVA) is met. SUTVA implies that program impacts on individuals are independent of others' participation or the size of the treated population. This assumption is generally considered reasonable for programs not implemented at scale (Frölich, 2004) and is therefore appropriate in the OFPD context.
This study uses the Modified Causal Forests (MCF) to estimate the impacts of OFPD at both the overall program level and by each intervention, while also examining how these impacts vary across socio-demographic factors (Lechner & Mareckova, 2022; Lechner, 2019; Cockx et al., 2023). Two recent ESDC studies (ESDC, 2023a; ESDC, 2023b) demonstrated that the MCF could be effective in producing net impacts by groups. Earlier evaluations of the OFPD, in contrast, relied on propensity score matching combined with difference-in-differences to estimate net impacts, which did not allow for the same level of impact heterogeneity analysis.
2.5.1 MCF model parameters
Different MCF model specifications, such as number of trees, splitting rules, and the minimum number of observations per participation status in a leaf, were tested in this study. Increasing the number of trees (2,000) substantially reduced the net impacts from benchmark MCF estimates. Imposing higher number of observations per participation status limits the depth of each leaf potentially limiting model flexibility. Therefore, the best-performing specifications uses the default setting of 1,000 trees and a minimum of 2 observations per participation status in a leaf.
2.5.2 Covariates used in MCF model
The covariates used in this study cover an extensive variety of characteristics. These covariates reflect individuals' labour market experiences, including the socio-demographic characteristics (such as, age, gender, disability status), province, and labour market history (such as, employment/self-employment earnings, use of social assistance, in the five years preceding participation). The variables related to EI history were excluded from the covariates as both participants and non-participants were not EI claimants prior to the participation period. The detail list of variables used in the MCF model can be found in Appendix B: Covariates used in MCF model.
These covariates were selected using the automated procedure in the Python MCF package, which retains covariates that contribute to explaining the net impact heterogeneity and removes variables with limited predictive value. The variables excluded are presented in Appendix B: Covariates used in MCF model.
2.5.3 Training MCF model
The MCF model implicitly splits the population into a tree-structureFootnote 3 of smaller groups, called strata, so that the treatment effect is constant within a given group, but different from other groups. The MCF algorithm splits the population into:
- Training data to learn how to split the population into groups (50% of observations)
- Honest data to estimate the impacts of the intervention so that it is constant within a given group (50% of observations)
Additionally, (Wager and Athey 2018) demonstrated that honest splitting yields several benefits including reduced bias, asymptotically Gaussian and centered sampling distribution, lower mean squared error, and a theoretical foundation for causal forests that enables valid inference on heterogeneous treatment effects.
2.5.4 Estimating net impacts on honest data
We report multiple levels of program effects estimated on the honest data. As shown in Figure 1, the MCF allows to produce results that estimate net impacts at multiple levels of aggregation:
- Individualized Average Treatment Effects (IATEs): These measure the impact of participation versus non-participation for individuals with specific characteristics
- Group Average Treatment Effects (GATEs): These are calculated at a user-defined aggregation level that falls between IATEs and Average Treatment Effects (ATEs). The selection of groups was informed by policy relevance and existing literature on factors that might influence program impacts
- Average Treatment Effects (ATEs) and Average Treatment Effects on the Treated (ATETs): These represent the average impact of the intervention on the overall population of participants
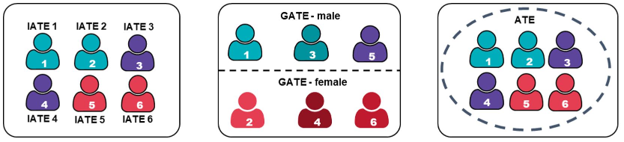
Figure 1: Text description
Visual representation of the outputs of the MCF model. The model produces estimates of net impacts at 3 levels of aggregation. For example:
- The Individualized Average Treatment Effects (IATEs) measure the impact of participation compared to non-participation for individuals with specific characteristics.
- The Group Average Treatment Effects (GATEs) measure the impact of participation compared to non-participation for groups with shared characteristics (for example, different socio-demographic groups like male and female).
- The Average Treatment Effects (ATEs) represent the overall average impact on all participants on the aggregate level.
Source: ESDC, Gender-based analysis plus exploratory evaluation study on selected labour market programs: final report (ESDC, 2023a)
2.6 Group analysis of net impacts
In prior evaluations of the OFPD program conducted by ESDC, group analyses were performed by estimating average effects for specific groups to investigate treatment effect heterogeneity. Instead of conducting several analyses of these groups, the MCF allows for estimation of GATEs by aggregating the IATEs.
In this study, the primary group variables included:
- Gender: Examining differences in labour market outcomes between men and women
- Age groups: Examining 3 categories (aged 30 or younger, between 31 and 54 years, and over 55 years) to capture potential differences in outcome indicators at various career stages
- Other socio-demographic characteristics: Analyzing indicators such as Indigenous status, racialized status, and recent immigrant status to understand the distinct labour market challenges these groups may encounter
- Disability-related characteristicsFootnote 4: Including factors like Disability Tax Credit (DTC) statusFootnote 5, developmental disabilities, learning disabilities, and physical disabilities to assess how these factors shape program impacts
2.7 Strengths and limitations
A key strength of this study is the ability to conduct robust net impact analysis using the rich, integrated administrative data available through the LMPDP. The Platform enables the use of numerous sociodemographic and labour‑market characteristics to estimate the net impact of programs on participants relative to similar non‑participants.
This study uses the MCF, a novel machine learning method, that is designed to estimate heterogeneous treatment effect. This method allows for more granular impact analysis to what was available previously and can help inform the effectiveness of programs across sociodemographic groups.
Despite these strengths, the study identified several limitations related to the linked administrative data and net impact analysis:
- the findings can only be reported on a calendar year basis mainly due to the structure of the CRA T1 and T4 data. In addition, it was not possible to identify whether the participant had full-time or part-time employment
- the analysis was restricted to disability types common to both non-participants and participants due to differences in reported disability classifications
- results of the present study are not directly comparable to those of similar previous analyses of the program, and any comparison should be done with caution
- there might have been pre-existing differences between the participants and non-participants that were not captured during the matching process. It was not possible to completely rule out the influence of these unobserved factors
3. Socio-demographic profile of participants
This section presents the socio-demographic profile of the OFPD participants (fiscal years 2015 to 2016 and 2016 to 2017), focusing on characteristics such as gender, age, marital status, disability type, location, as well as racialized, Indigenous and immigration status. This section also includes the proportion of participants who claimed COVID-19 income support via EI Canada Emergency Response Benefit (EI-CERB)Footnote 6. Appendix C presents the detailed profile of participants.
In terms of the socio-demographic profile of participants:
- approximately 47% participated in the OF-EEAS intervention, while 39% participated in OF-WS, 10% in OF-SFE and 4% in OF-SE. Participants were more likely to be male (55%) than female (39%). This trend applies to other OFPD intervention types except for OF-SE, which attracted a higher proportion of female participants (54%) than male participants (44%)
- overall, with respect to the type of disabilities, participants with mental health issues constituted the largest group (33%), followed by those with developmental disabilities (18%), learning disabilities (14%), agility disabilities (9%) as shown in Appendix C
- slightly more than half of participants were aged 30 or younger (53%), followed by those aged between 31 and 54 years (38%) and those aged over 55 years (9%)
- the majority of the OFPD participants were single (69%), and resided in Ontario (33%), Quebec (17%) and British Columbia (16%)
- about 24% of OFPD participants claimed a Disability Tax Credit (DTC) in the year they started their participation
- 15% of OFPD participants claimed EI CERB (Table 20 in Annex C). The highest proportion is observed among participants who took OF-WS (18%), and the lowest proportion is observed among OF-SE participants (7%)
- in the year preceding OFPD participation, 48% of participants received social assistance, and 3% received EI benefits
The distribution of participants across different types of disabilities varied by intervention, gender and age, as shown in Tables 23 to 25 in Appendix D:
- by intervention: O F-EEAS is more common among participants with agility/physical (57%), visual (55%), and other disabilities (55%), relative to the overall share of participants in OF-EEAS (47%). OF-WS is more common among participants with speaking (56%), motor skills (47%), developmental/intellectual (43%), and learning disabilities (41%), relative to the overall share of participants in OF-WS (39%). Participants with mental health disabilities display the highest participation in SFE (16%) relative to other disability types
- by gender: Men representation is higher among participants with speaking (68%), developmental/intellectual (61%), learning (57%), and other disabilities (60%), relative to the overall share of men participants in the cohort (55%). Female representation is higher among participants with visual (45%), agility/physical (45%), and mental health disabilities (44%), relative to the overall share of female participants (39%)
- by age: Representation of participants aged 30 or younger is higher among those with developmental/intellectual (78%), learning (70%), and speaking disabilities (68%), relative to the overall share of participants aged 30 or younger in the cohort (53%). Representation of participants aged 31-54 years is higher among those with motor skills (53%), physical disabilities (53%), and agility (51%), compared with the overall share of this age group (38%). Representation of participants aged over 55 years is higher among those with physical (30%), agility (24%), and motor skills disabilities (18%), relative to the overall share of older participants in the cohort (9%)
To contextualize the socio-demographic profile of OFPD participants, data from the 2017 Canadian Survey on Disability (CSD) were used as a benchmark. The comparison reveals that the proportion of men relative to women is higher among OFPD participants than in the broader CSD (Table 1). Specifically, men represent 55% of OFPD participants, compared to 44% in the CSD. Conversely, women who make-up 56% of the CSD population with disabilities, account for only 39% of the OFPD participants.
| Gender | 2017 Canadian Population with Disability | Opportunities Fund 2015 to 2017 Cohort (n = 7,893) |
|---|---|---|
| Men | 44% | 55% |
| Women | 56% | 39% |
- Source: ESDC, Administrative Data; Statistics Canada Table 13-10-0374-01 - Persons with and without disabilities aged 15 years and over, by age group and gender.
Note: The gender distribution of OFPD participants does not add up to 100% as the graph excludes the “Other” category (less than 1%) and those who refused to declare their gender or with missing values (6%).
Differences are also observed in age distribution (Table 2). OFPD participants are significantly younger than the broader Canadian working-age population with disabilities. Over one-third (37%) of OFPD participants are aged 15 to 24, compared to only 13% in the CSD population. Conversely, individuals aged 45 to 64 are underrepresented in the program, accounting for just 23% of OFPD participants versus 55% in the CSD population.
| Age group | 2017 Canadian Population with Disability | Opportunities Fund 2015 to 2017 Cohort (n = 7,893) |
|---|---|---|
| 15 - 24 years | 13% | 37% |
| 25 - 44 years | 32% | 40% |
| 45 - 64 years | 55% | 23% |
- Source: ESDC, OFPD administrative data; ESDC calculations for persons with disabilities between 15 and 64 years old based on Statistics Canada Table 13-10-0374-01 - Persons with and without disabilities aged 15 years and over, by age group and gender.
Furthermore, OFPD participants show a distinct representation by other socio-demographic characteristics (Table 3). The racialized individuals account for a slightly higher share of OFPD participants (16%) than in in the CSD (14%). Indigenous persons represent a substantially larger proportion of OFPD participants (11%) than of the CSD population (5%). Recent immigrants account for 2% of OFPD participants, relative to 1% in the CSD population.
| Socio-demographic characteristic | 2017 Canadian Population with Disability | Opportunities Fund 2015 to 2017 Cohort (n = 7,893) |
|---|---|---|
| Indigenous | 5% | 11% |
| Racialized | 14% | 16% |
| Recent immigrant | 1% | 2% |
- Sources: ESDC, OFPD administrative data; Statistics Canada. Table: 13-10-0380-01 Visible minority group of persons with and without disabilities aged 15 years and over, by age group and sex, Canada; Table: 13-10-0381-01 Immigrant status and period of immigration for persons with and without disabilities aged 15 years and over, by gender, Canada; ESDC calculations using the 2017 Canadian Survey on Disability and the 2017 Aboriginal Peoples Survey.
4. Net impacts analysis results
4.1 OFPD overall
Overall, OFPD participants had stronger labour market attachment five years after starting an intervention relative to similar non-participants. As shown in the Table 4 below, participants earned annually on average $1,180 more than similar non-participants. The OFPD participants also had an incidence of employment 3.7 pp. higher than similar non-participants on average over the 5-year post-program period.
The overall results presented in Table 4 reflect the mix of interventions delivered under OFPD, including OF-EEAS, OF-WS, and OF-SFE. Some interventions, such as training, may involve opportunity costs because participants spend time in training rather than searching for work or working (often referred to as a "lock-in effect"). By contrast, interventions that provide wage subsidies or paid work experience (OF-WS) directly support employment and therefore involve little or no forgone employment during participation.
Comparisons between OFPD participants and similar non-participants in the program start year show positive overall impacts on earnings (+$965) and the incidence of employment (+14.5 pp.). These results suggest that the program's impacts are driven by interventions that include a paid work experience component (OF-WS), which enrolled 39% of participants in the cohort.
In terms of the EI benefits, OFPD participants received, on average, $60 more per year than similar non-participants during the 5-year post-program period. In contrast, OFPD participants received an average of $376 less per year in SA benefits over the same period.
Results suggest that OFPD interventions had a positive impact on participants' employment earnings and incidence of employment but had a limited impact on participants' dependence on income support, including EI and SA benefits.
| Indicators | Program start year | 1st year post-program | 2nd year post-program | 3rd year post-program | 4th year post-program | 5th year post-program | 5-year annual average post-program |
|---|---|---|---|---|---|---|---|
| Employment earnings ($) | 965*** | 1,148*** | 1,127** | 1,062** | 1,092** | 1,482** | 1,180 |
| Incidence of employment (pp) | 14.5*** | 8.2*** | 5.9*** | 4.0** | 5.9*** | 5.1*** | 3.7*** |
| EI benefits ($) | -11 | 43 | 9 | 11 | 209 | 99 | 60 |
| SA benefits ($) | -188* | -345** | -509*** | -364** | -611*** | -355* | -376 |
- Note: Significance level: ***1%, **5%, *10%
4.2 Enhanced employment assistance services
Net impact results suggest that OF-EEAS had a limited positive impact on participants' labour market attachment relative to non-participants over five years after participating. As shown in the Table 5 below, participants earned annually, on average, $196 more than similar non-participants. These results are statistically not significant.
Participants had an incidence of employment 2.6 pp. higher than similar non-participants on average over the 5-year post-program period. Participants used on average $248 less per year in EI benefits compared to similar non-participants over the post-program period. Participants received more SA benefits than similar non-participants, with the incremental amount decreasing over the post-program period, for an annual average of $157 over the 5-year post-program period.
Net impact results suggest that OF-EEAS had a limited positive impact on participants' employment earnings and incidence of employment, and that participants received slightly higher SA benefits relative to non-participants over the 5-year post participation period. EEAS are relatively modest activities such as counselling, job search assistance and case management, which focus on quicker returns to work for participants. These supports, when not combined with more intensive interventions, are not expected to increase participants' skills or influence their employment levels to a large extent.
| Indicators | Program start year | 1st year post-program | 2nd year post-program | 3rd year post-program | 4th year post-program | 5th year post-program | 5-year annual average post-program |
|---|---|---|---|---|---|---|---|
| Employment earnings ($) | -168 | 108 | -353 | -14 | 459 | 775 | 196 |
| Incidence of employment (pp) | 8.7*** | 6.7** | 1 | 1 | 1 | 2.4 | 2.6 |
| EI benefits ($) | -84 | -120 | -47 | -372*** | -320* | -321 | -248** |
| SA benefits ($) | 385** | 360 | 112 | 138 | 63 | -39 | 157 |
- Note: Significance level: ***1%, **5%, *10%
4.3 Wage subsidy
Participants in OF-WS showed greater labour market attachment relative to non-participants over the five years following participation. As shown in Table 6 below, participants earned on average $2,489 more per year than similar non-participants. Participants also had, on average, an incidence of employment 13.3 pp higher than similar non-participants over the 5-year post-program period. Although the incremental positive impacts diminish in the years following the end of the wage subsidy, the positive impacts of OF-WS persist into the 5th years after participation. This suggests that the intervention had a positive and lasting impact on participants.
Participants received, on average, $299 more per year in EI benefits, and $587 less per year in SA benefits, compared to similar non-participants over the same post-program period.
| Indicators | Program start year | 1st year post-program | 2nd year post-program | 3rd year post-program | 4th year post-program | 5th year post-program | 5-year annual average post-program |
|---|---|---|---|---|---|---|---|
| Employment earnings ($) | 2,392*** | 3,005*** | 2,331*** | 2,652*** | 2,009** | 1,939** | 2,489*** |
| Incidence of employment (pp) | 32.4*** | 18.0*** | 13.3*** | 14.3*** | 10.3*** | 9.7*** | 13.3*** |
| EI benefits ($) | 59 | 238** | 103 | 206 | 274 | 660** | 299** |
| SA benefits ($) | -518*** | -659*** | -551** | -677** | -540* | -475* | -587*** |
- Note: Significance level: ***1%, **5%, *10%
4.4 Skills for employment
Net impact results suggest that OF-SFE had a positive impact on participants' labour market attachment relative to non-participants over the five years after participation. As shown in Table 7 below, participants earned, on average, $2,262 more per year than similar non-participants. Participants also had, on average, an incidence of employment 7.8 pp. higher than similar non-participants over the 5-year post-program period.
Participants used slightly more in EI benefits compared to similar non-participants over the post-program period, with participants receiving on average $314 more per year in EI benefits. In terms of SA benefits, participants used less SA benefits compared to similar non-participants, with participants receiving on average $1,295 less per year in SA benefits over the same period.
| Indicators | Program start year | 1st year post-program | 2nd year post-program | 3rd year post-program | 4th year post-program | 5th year post-program | 5-year annual average post-program |
|---|---|---|---|---|---|---|---|
| Employment earnings ($) | 747 | 2,187** | 2,296** | 2,011* | 1,956 | 2,719* | 2,262** |
| Incidence of employment (pp) | 11.9*** | 5 | 6.3* | 8.3** | 11.3*** | 9.6*** | 7.8*** |
| EI benefits ($) | 272* | 71 | -19 | 86 | 785* | 539 | 314* |
| SA benefits ($) | -489* | -536 | -1,250*** | -1,458*** | -1,734*** | -1,570*** | -1,295*** |
- Note: Significance level: ***1%, **5%, *10%
4.5 Net impacts heterogeneity
Heterogeneity in program impacts is examined by analyzing the distribution of net impacts at the individual level. Figures below show the distribution of IATEs for OFPD overall participants and indicate variation in individual-level net impacts, suggesting that the effects of participation are not uniform across all individuals. Salmon color indicates that individuals have negative impacts while blue indicates positive impacts. Compared to non-participants, individuals are observed at both tails of the distributions, exhibiting significantly higher or lower employment earnings (Figure 2), incidence of employment (Figure 3), usage of EI (Figure 4), and social assistance benefits (Figure 5).
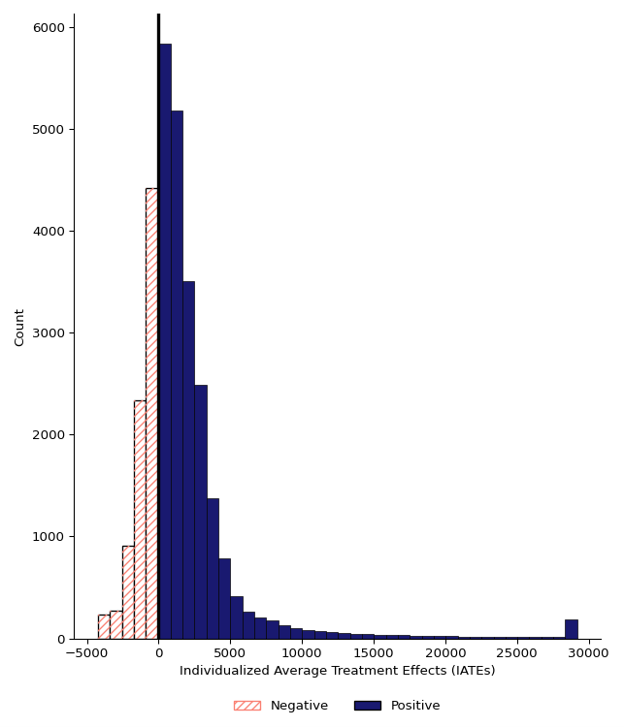
Figure 2: Text description
Distribution of individual average treatment effects for employment earnings for overall OFPD
Histogram showing the distribution of individualized average treatment effects (IATEs) on employment earnings. The x‑axis represents IATE on employment earnings (from negative to large positive amounts), and the y‑axis shows the number of individuals falling within each range. Most values are positive (blue bars), while fewer are negative (hatched bars). The distribution is right‑skewed, with a long tail of high positive values, indicating that most individuals showed positive impacts in employment earnings after participating in OFPD, with a small number experiencing very large positive impacts.

Figure 3: Text description
Distribution of individual average treatment effects for incidence of employment for overall OFPD
Histogram showing the distribution of individualized average treatment effects (IATEs) on the incidence of employment. The x‑axis represents IATE on the incidence of employment (ranging from negative to positive amounts), and the y‑axis shows the number of individuals falling within each range. Negative impacts appear as hatched bars to the left of zero, while positive impacts are shown as solid blue bars to the right. A vertical reference line marks zero. The distribution is asymmetric, with most observations clustered in the positive range and a spread extending into both left and right tails. This indicates that most individuals showed positive impacts in incidence of employment after participating in OFPD, although some experienced negative impacts.
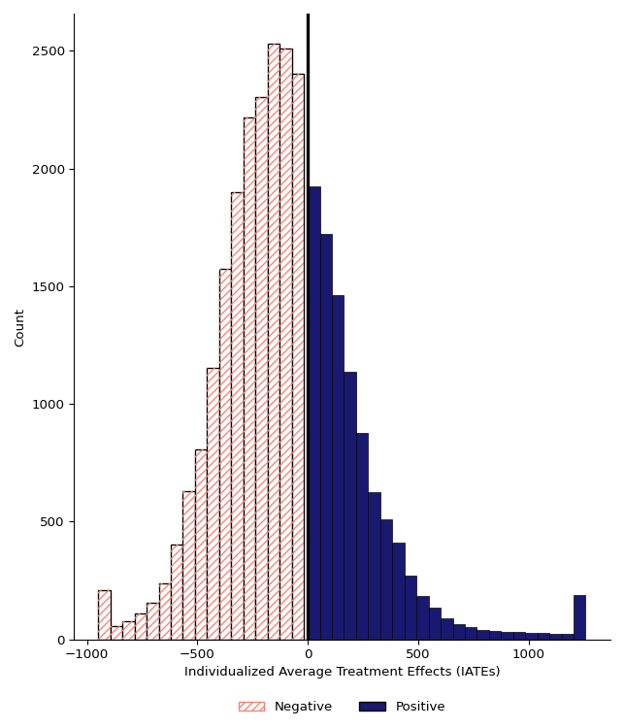
Figure 4: Text description
Distribution of individual average treatment effects for EI benefits for overall OFPD.
Histogram showing the distribution of individualized average treatment effects (IATEs) on Employment Insurance (EI) benefits. The x‑axis represents IATE on EI benefits (ranging from negative to positive amounts), and the y‑axis shows the number of individuals falling within each range. Negative impacts are displayed as hatched bars to the left of zero, while positive impacts appear as solid blue bars to the right. A vertical reference line marks zero. The distribution is asymmetric, with observations spread across both negative and positive values and tails on both ends. The counts of negative and positive values are relatively balanced, indicating that participation in OFPD is associated with both positive and negative impacts in EI benefits across individuals.
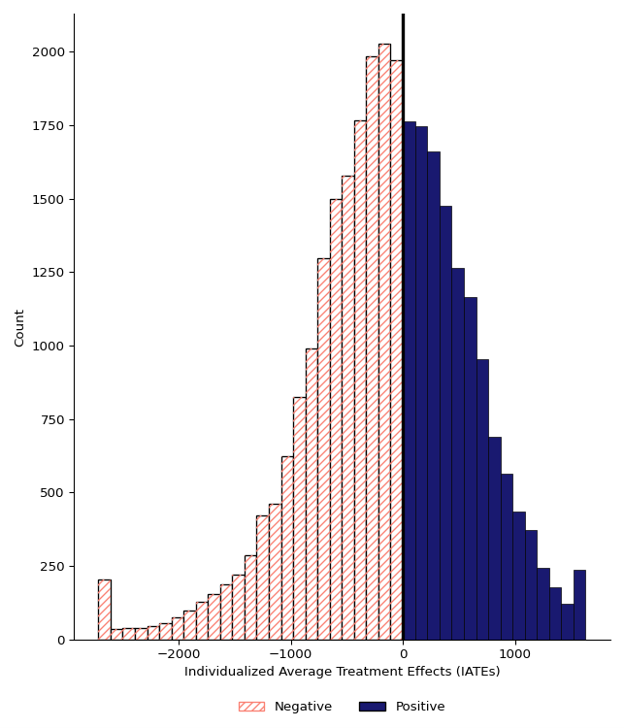
Figure 5: Text description
Distribution of individual average treatment effects for social assistance benefits for overall OFPD
Histogram showing the distribution of individualized average treatment effects (IATEs) on social assistance benefits. The x‑axis represents IATE on social assistance benefits (ranging from negative to positive amounts), and the y‑axis shows the number of individuals falling within each range. Negative impacts are displayed as hatched bars to the left of zero, while positive impacts appear as solid blue bars to the right. A vertical reference line marks zero. The distribution is roughly bell‑shaped but slightly skewed to the left, with a longer tail extending into negative values. Most values fall below zero, indicating that participation in OFPD showed negative impacts in social assistance use for many individuals, while some individuals showed positive impacts.
4.6 Group analysis for overall OFPD
Figure 6 presents the average annual GATEs for the incidence of employment (in percentage points, pp.) and employment earnings (in dollars) over the 5-year post participation period. It shows that across all groups, impacts are positive on both employment incidence and employment earnings. However, some groups seem to have higher or lower impacts than the average, when compared to the overall average impacts.
An assessment of impact heterogeneity was conducted to test whether the GATE for each group differs from the overall average treatment effect (ATE) (see Appendix E for ATE results). Statistical tests are used to identify groups that are statistically different from the average. Groups with impacts that are statistically different from the average are highlighted in solid colour in Figure 6. To support the interpretation, tables in Appendix F provide the profiles of the group members versus non-group members. Exploring differences in profiles can help better understand the dynamics that might contribute to differences in group impacts.
Groups with statistically different results in incidence of employment:
- individuals aged 30 or younger show a lower-than-average impact on their incidence of employment (3.7 pp.), while those aged between 31 and 54 years experience a higher-than-average impact (10.2 pp.). Profiles point to weaker prior labour market attachment for younger participants compared to older participants. Participants aged 30 or younger have relatively lower pre‑program earnings (91% vs. 87% receiving below $10,000) and lower reliance on EI (2% vs 5%). Younger participants are less likely to be married compared to older participants (4% vs. 24%). They are also more likely to have disability types which are associated with below-average employment outcomes, such as developmental/intellectual (26% vs. 8%) and learning disabilities (18% vs. 9%). Participants aged 30 or younger are more likely to be men (60% vs. 50%) and to have claimed the DTC in the year they started their participation (28% vs. 19%)
- racialized individuals show a positive but lower-than-average impact on incidence of employment (5.0 pp.). Profiles show that racialized participants are more likely to be recent immigrants (8% vs. 1%), married (19% vs 12%), live in Ontario (46% vs 30%)
- individuals with developmental and learning disabilities show a positive but lower-than-average impact on their incidence of employment (2.4 pp. and 3.3 pp. respectively). As discussed above, these disability types are more prevalent among participants aged 30 or younger and less prevalent among older participants
Groups with statistically different results in employment earnings:
- Indigenous individuals show a $1,008 impact on their employment earnings, which is below the overall average ($1,635). Profiles indicate that Indigenous participants show a higher prevalence of learning disabilities, which is associated with below-average gains in incidence of employment (24% vs 13%). They are also more likely to be aged 30 or younger (57% vs 53%), and less likely to have claimed the DTC (15% vs 25%)
- those with physical disabilities show a $2,289 impact on their employment earnings, which is higher than the overall average
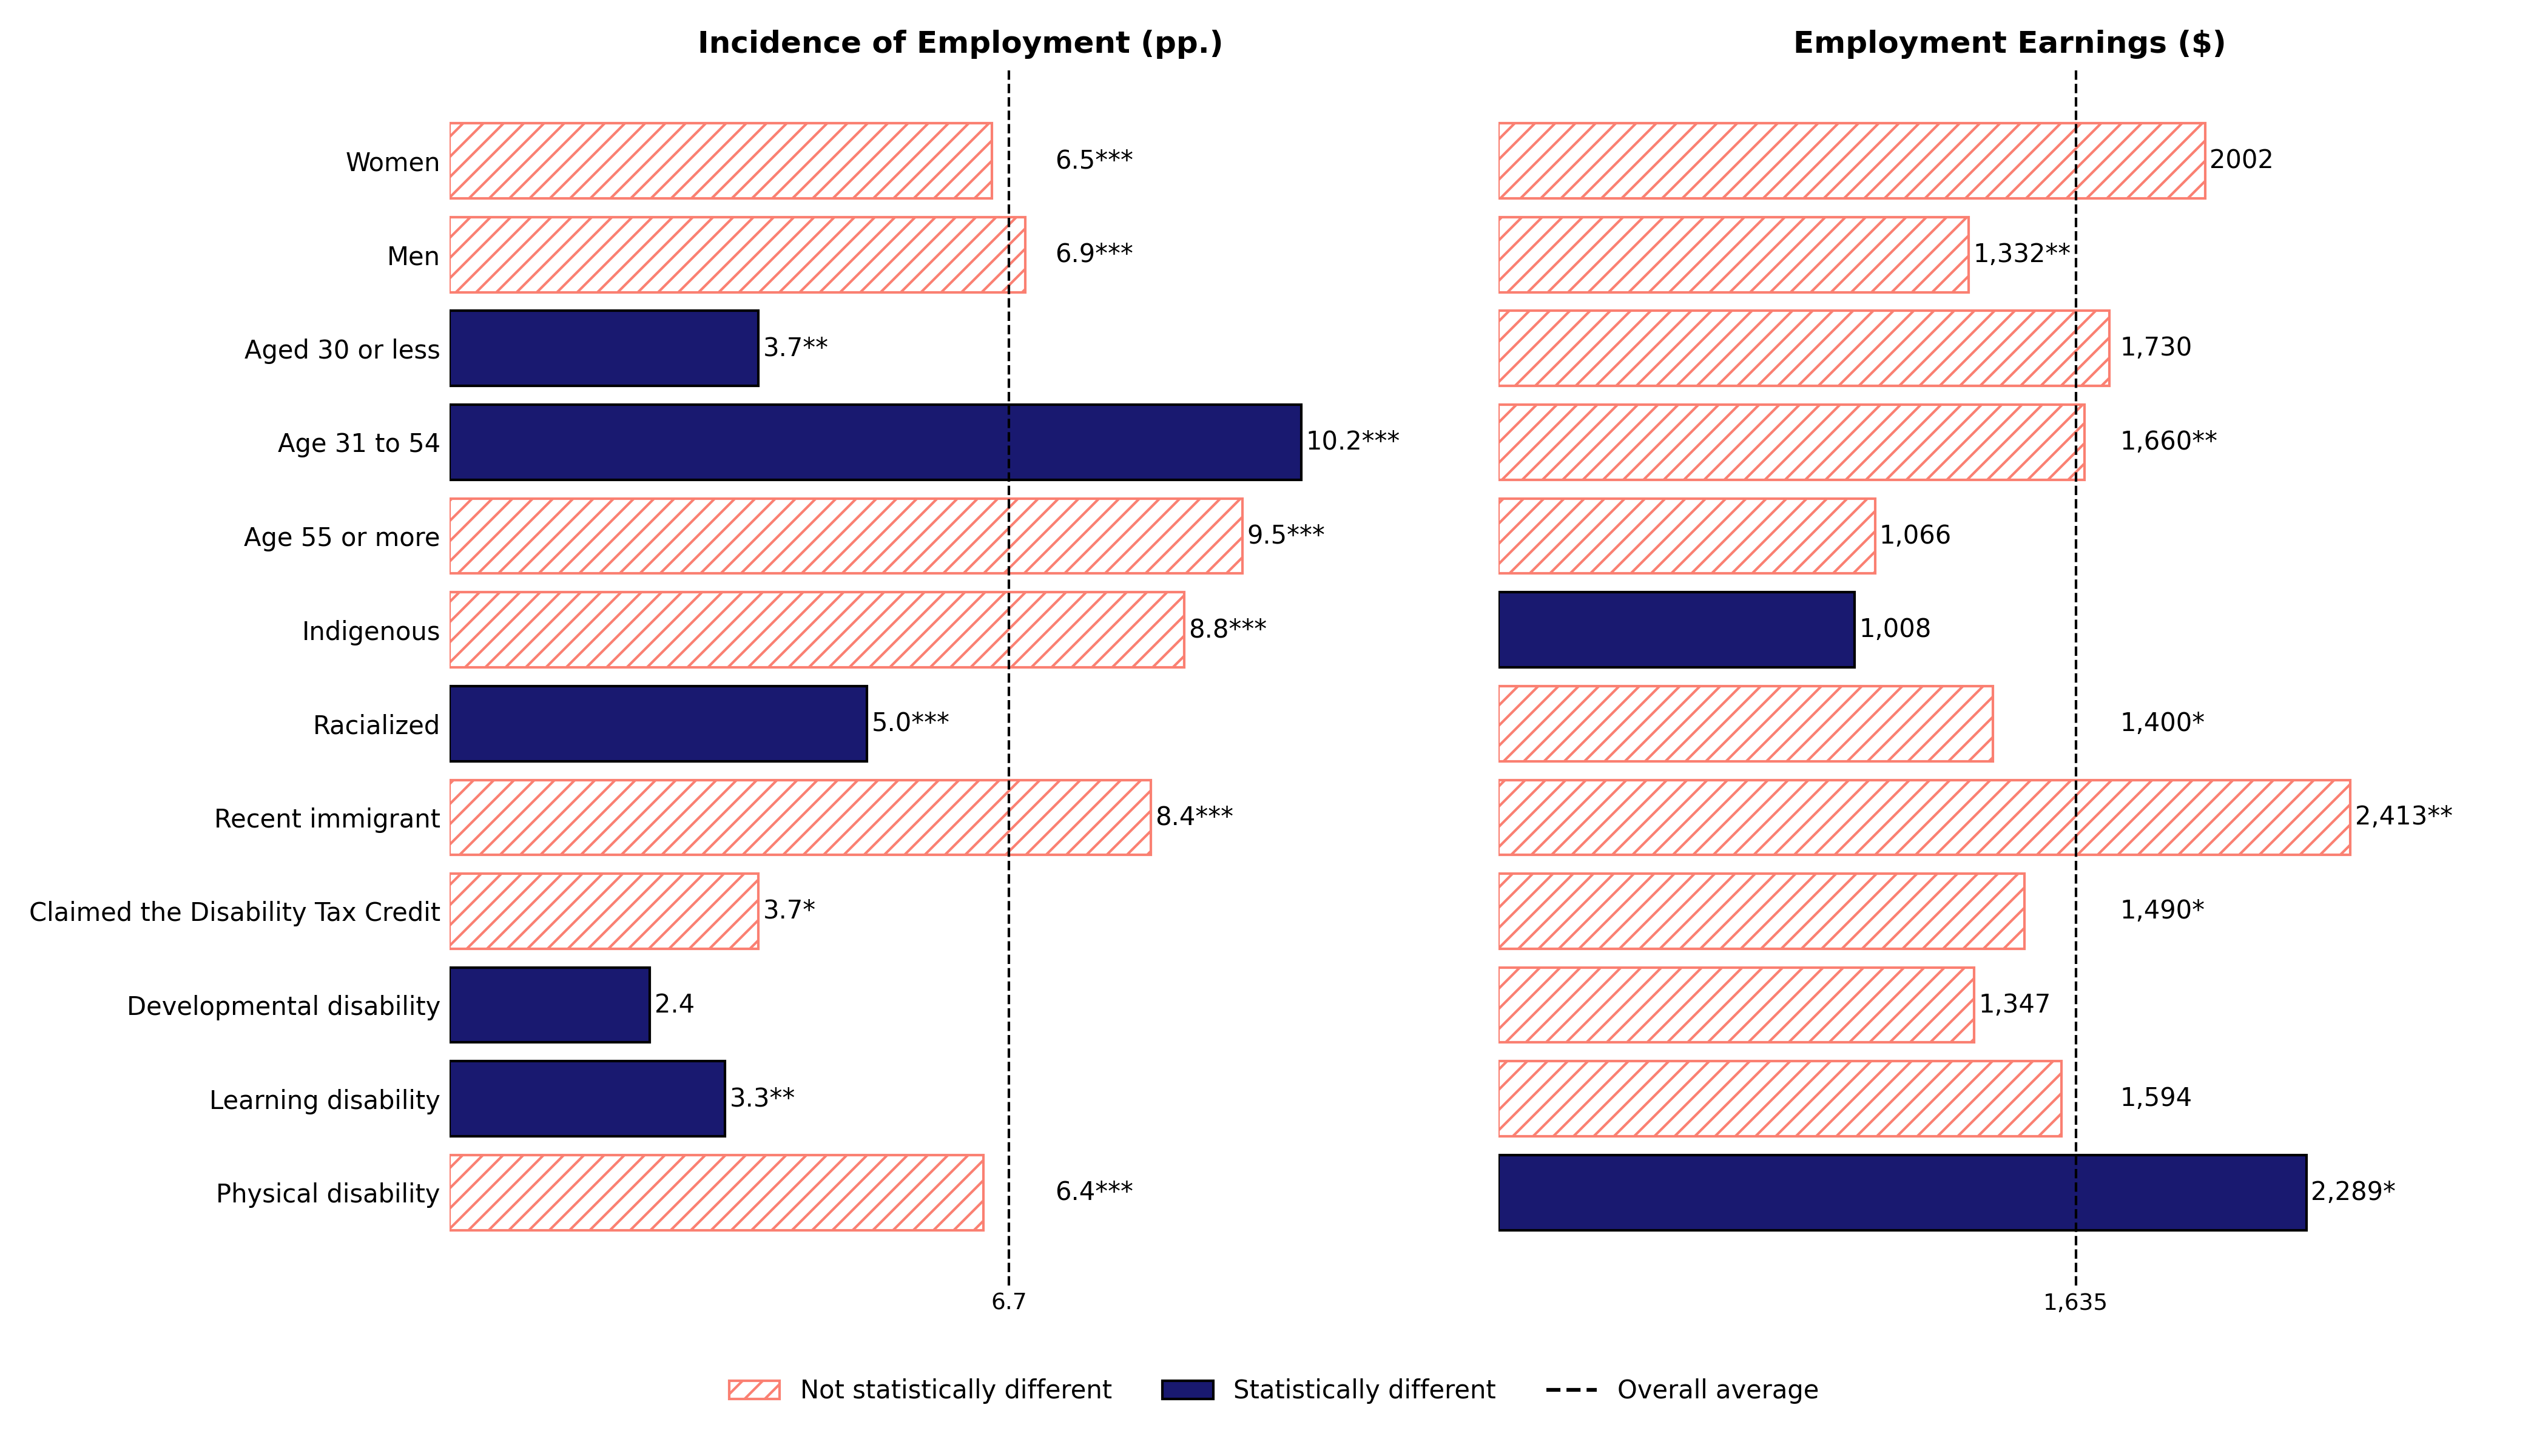
Figure 6: Text description
| Socio-demographic characteristic | Net impact on incidence of employment (percentage points) | Net impact on employment earnings ($) |
|---|---|---|
| Overall average | 6.7*** | 1,635* |
| Women | 6.5*** (not statistically different from average) | 2,002 (not statistically different from average) |
| Men | 6.9*** (not statistically different from average) | 1,332** (not statistically different from average) |
| Aged 30 or less | 3.7** (statistically different from average) | 1,730 (not statistically different from average) |
| Aged 31 to 54 | 10.2*** (statistically different from average) | 1,660** (not statistically different from average) |
| Aged 55 or more | 9.5*** (not statistically different from average) | 1,066 (not statistically different from average) |
| Indigenous | 8.8*** (not statistically different from average) | 1,008 (statistically different from average) |
| Racialized | 5.0*** (statistically different from average) | 1,400* (not statistically different from average) |
| Recent immigrant | 8.4*** (not statistically different from average) | 2,413** (not statistically different from average) |
| Claimed the Disability Tax Credit | 3.7* (not statistically different from average) | 1,490* (not statistically different from average) |
| Developmental disability | 2.4 (statistically different from average) | 1,347 (not statistically different from average) |
| Learning disability | 3.3** (statistically different from average) | 1,594 (not statistically different from average) |
| Physical disability | 6.4*** (not statistically different from average) | 2,289* (statistically different from average) |
- Note: Significance level: ***1%, **5%, *10%
Deviation from the average (GATE-ATE)
Figure 7 and Figure 8 present a more detailed view of the difference between the group-specific effect (GATE) and the overall average (ATE) for the same groups. To assess this difference, confidence intervals are examined: when a group's 95% confidence interval does not cross the horizontal line at zero, the difference between the group-specific GATE and the overall ATE is statistically significant at the 5% level.Footnote 8 The focus on 95% confidence intervals reflects a balanced criterion that is neither overly strict (for example, 1%) nor overly permissive (for example, 10%).
For each group, the point estimate is presented in a circular dot, and the 95% confidence intervals is enclosed by the upper and lower caps. A group's estimate above or below this line indicates a higher or lower effect relative to the average.
Consistent with the Figure 3, the following statistically significant differences from the average are observed:
- for incidence of employment, individuals aged 30 or younger (−3.0 pp.), racialized (−1.7 pp.), and with developmental (−4.3 pp.) or learning disabilities (−3.4 pp.) show a positive but lower than average impacts, while those aged between 31 and 54 show a positive and 3.5 pp. higher than average impacts (Figure 7)
- for employment earnings, Indigenous individuals show a positive but $626 lower than average impacts, while those with physical disabilities show a positive and $654 larger than average impacts (Figure 8)
The width of the confidence intervals provides insight into the precision of these estimates. For example, the group aged over 55 years exhibit wide confidence intervals, suggesting greater variability. In contrast, the racialized group has narrower intervals, indicating more precise estimates.
Some groups, such as recent immigrants, display relatively large point estimates (for example, a higher-than-average impact in incidence of employment), but these are not statistically significant due to the wide confidence intervals crossing the ATE line in Figure 7 and Figure 8. This highlights the importance of considering both the magnitude and the precision of the estimates when interpreting results.
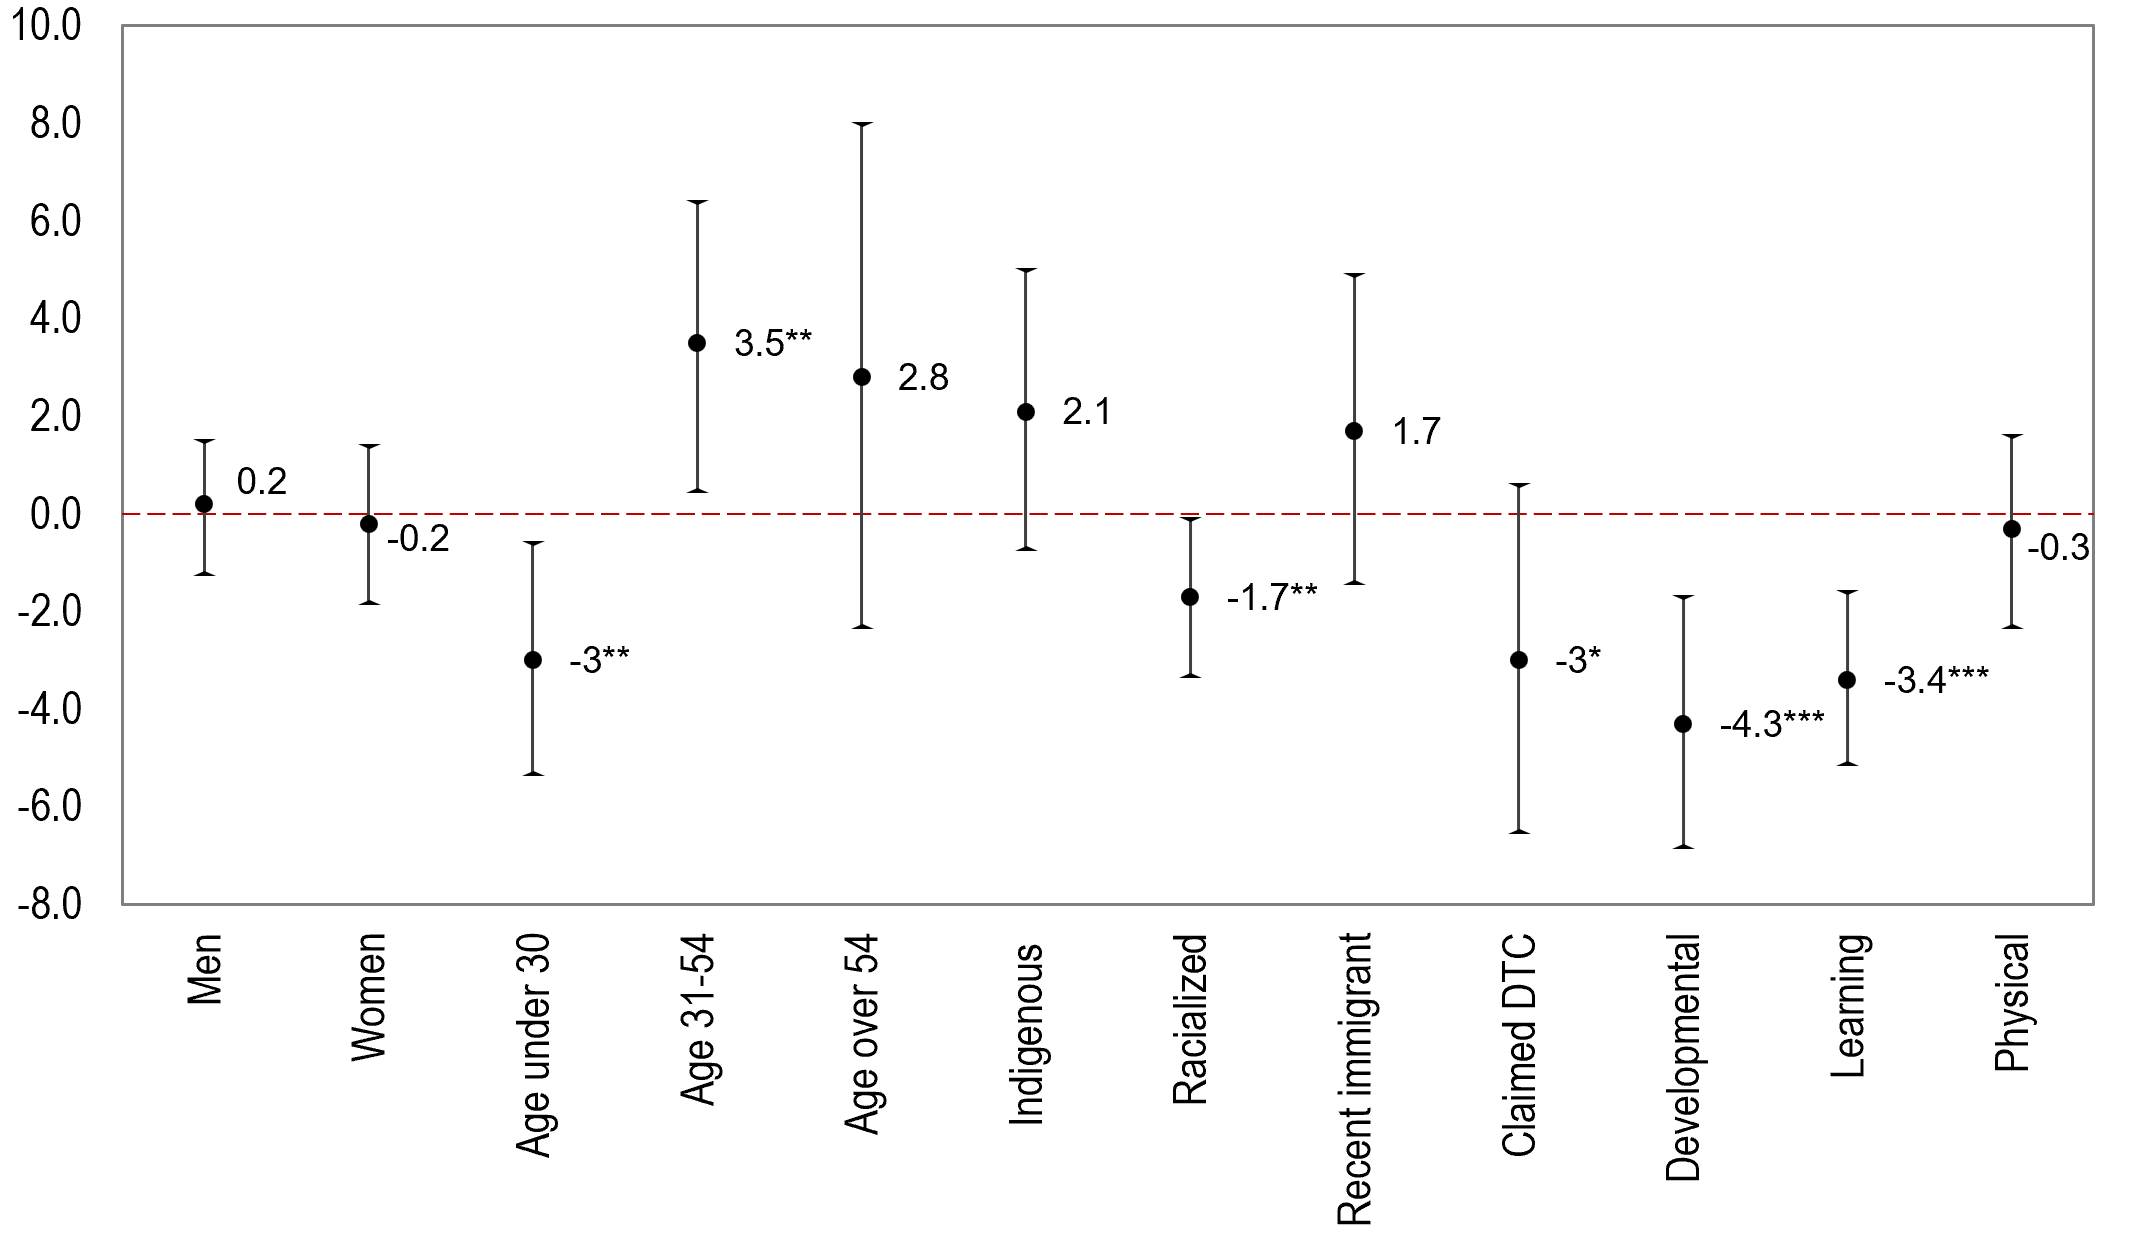
Figure 7: Text description
| Socio-demographic characteristic | deviation from average on incidence of employment (percentage points) |
|---|---|
| Overall average | 0 |
| Women | -0.2 (not statistically different from average) |
| Men | 0.2 (not statistically different from average) |
| Aged 30 or less | -3** (statistically different from average) |
| Aged 31 to 54 | 3.5** (statistically different from average) |
| Aged 55 or more | 2.8 (not statistically different from average) |
| Indigenous | 2.1 (not statistically different from average) |
| Racialized | -1.7** (statistically different from average) |
| Recent immigrant | 1.7 (not statistically different from average) |
| Claimed the Disability Tax Credit | -3* (not statistically different from average) |
| Developmental disability | -4.3*** (statistically different from average) |
| Learning disability | -3.4*** (statistically different from average) |
| Physical disability | -0.3 (not statistically different from average) |
- Note: Significance level: ***1%, **5%, *10%
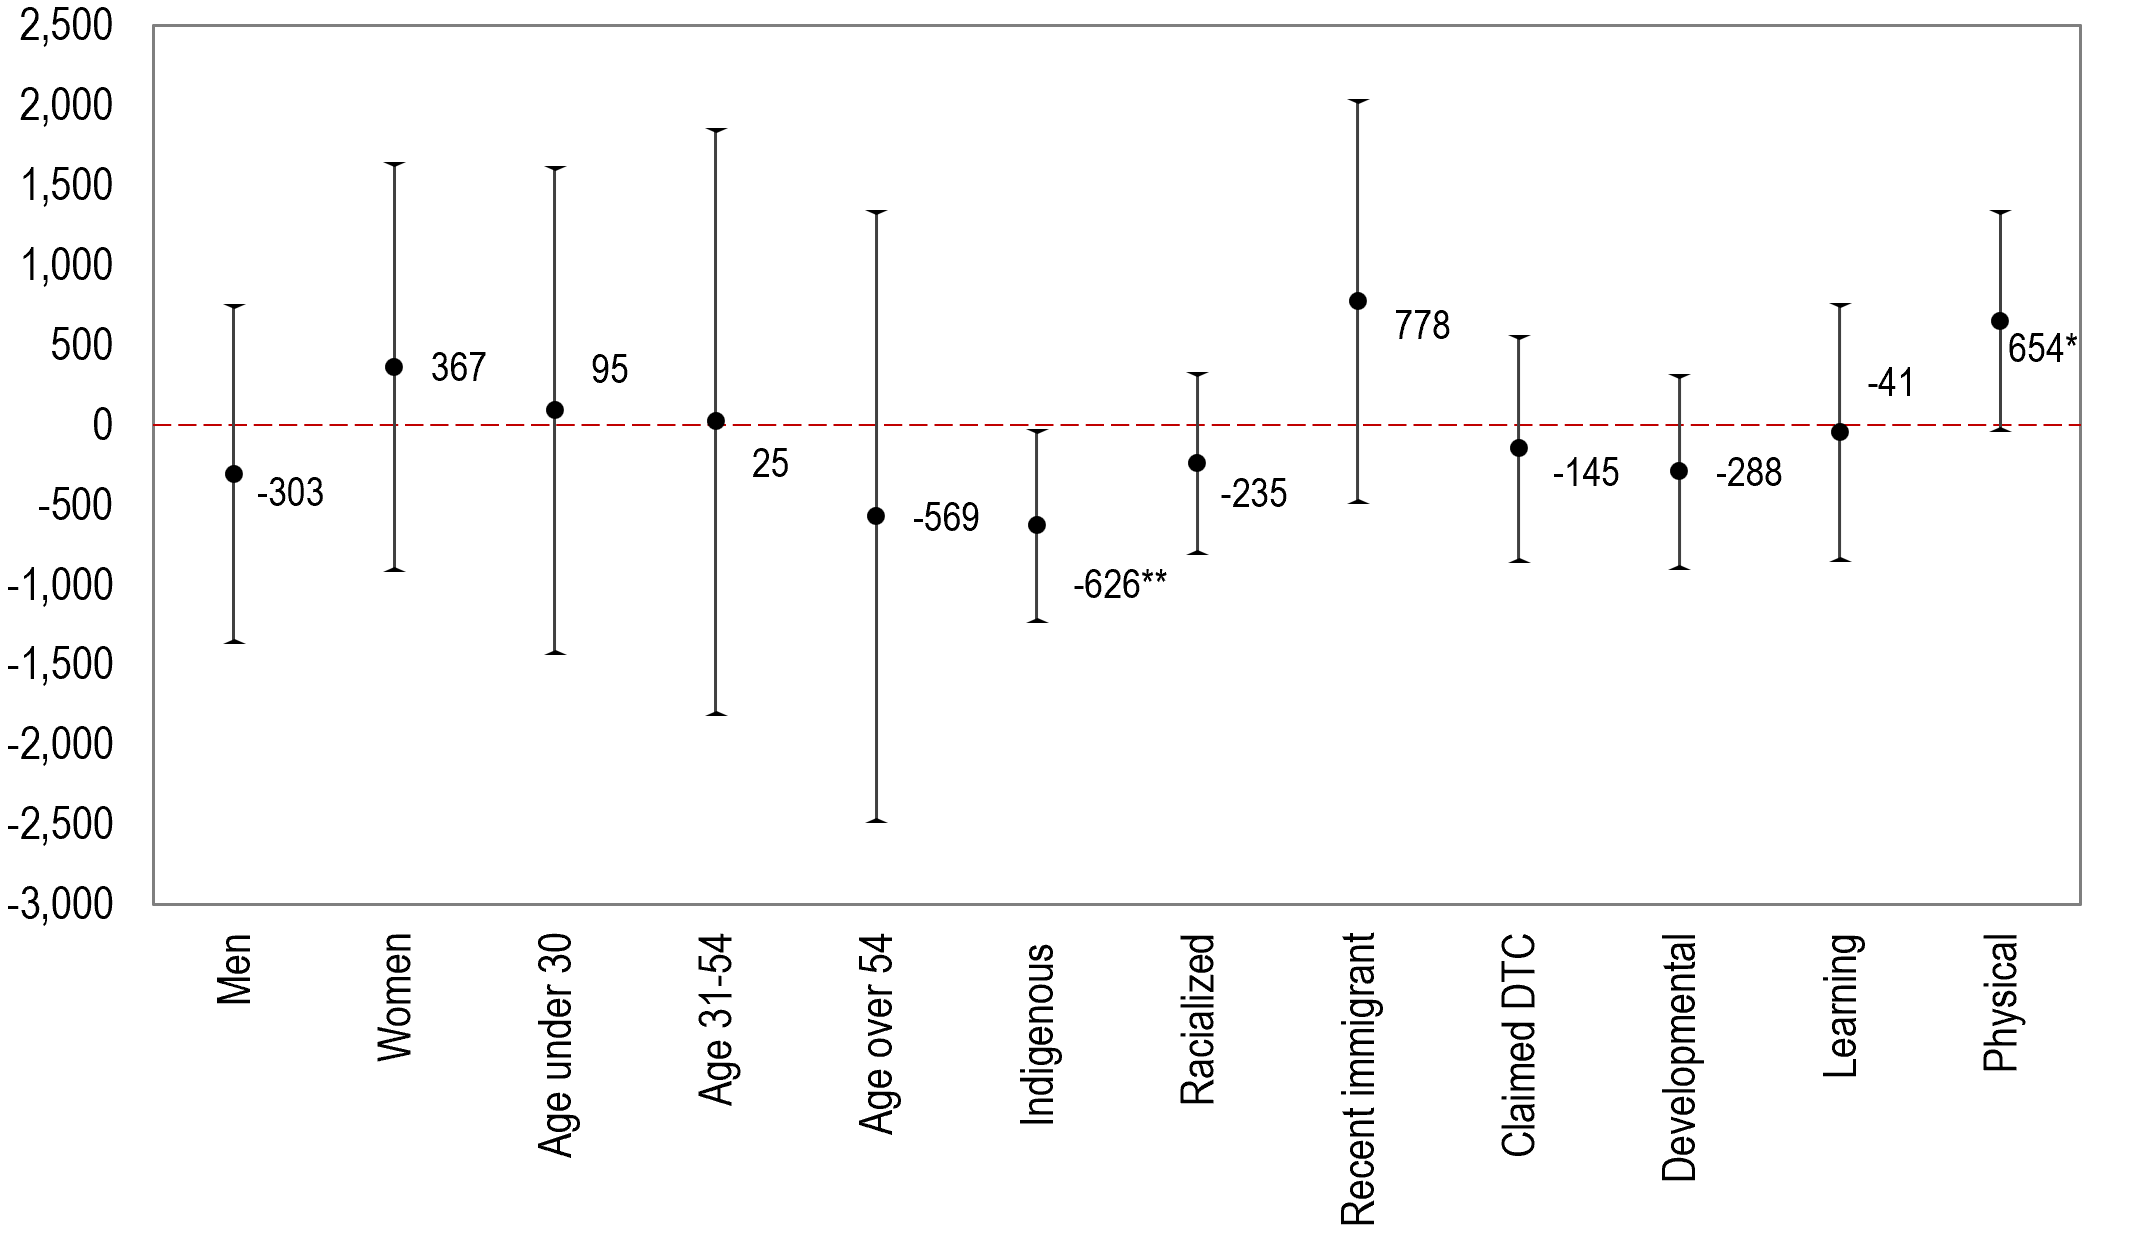
Figure 8: Text description
| Socio-demographic characteristic | deviation from average on employment earnings (dollar) |
|---|---|
| Overall average | 0 |
| Women | -303 (not statistically different from average) |
| Men | 367 (not statistically different from average) |
| Aged 30 or less | 95 (not statistically different from average) |
| Aged 31 to 54 | 25 (not statistically different from average) |
| Aged 55 or more | -569 (not statistically different from average) |
| Indigenous | -626** (statistically different from average) |
| Racialized | -235 (not statistically different from average) |
| Recent immigrant | 778 (not statistically different from average) |
| Claimed the Disability Tax Credit | -145 (not statistically different from average) |
| Developmental disability | -288 (not statistically different from average) |
| Learning disability | -41 (not statistically different from average) |
| Physical disability | 654* (statistically different from average) |
- Note: Significance level: ***1%, **5%, *10%
4.7 Robustness check
Appendix G presents detailed results based on propensity score matching combined with difference-in-difference (Rosenbaum & Rubin, 1983), an alternative estimation method.
Overall, the results are consistent across approaches. MCF estimates are generally similar in magnitude to the propensity score matching estimates. Although point estimates differed in some cases, the confidence intervals of the two methods overlapped.
5. Cost-benefit analysis
A cost-benefit analysis was conducted to assess the longer-term costs and benefits of the OFPD program. The analysis built from the net-impact analysis results presented earlier for the cohort of participants who started a program activity between April 2015 and March 2017. The costs and benefits observed over the 5-year post-participation period are then projected for an additional 5 years, resulting in a 10-year post-participation analysis window.
5.1 Methodology for calculating cost-benefit results
A cost-benefit analysis compares costs and benefits from the perspective of the individual (participant), the government, and society as a whole (which combines the individual and government perspectives). Following the prevailing approach in the evaluation literature (Heckman & Smith, 1999), the net social benefit was measured as the difference between the discounted costs and discounted benefits of the program. The cost-benefit analysis is based on quantifiable costs and benefits.
From the individual and government perspectives, the cost-benefit analysis considers impacts on the following:
- employment earnings (including foregone earnings)
- fringe benefits
- federal and provincial income taxes
- federal and provincial sales taxes
- employment insurance benefits and premiums
- social assistance benefits
- Canada Pension Plan (CPP) and Quebec Pension Plan (QPP) contribution
- public health care costs
With the exception of fringe benefits and sales taxes, all these impacts were estimated using quasi-experimental methods. Impacts on public health care costs were estimated based on administrative program data and average public health care cost data by income-quintiles from a report of the Canadian Institute for Health Information.Footnote 9
This analysis accounts for the direct program costs as well as the indirect costs arising from the marginal social cost of public fundsFootnote 10 (MSCPF; see for example Browning, 1987). To account for the MSCPF, the direct resource costs should be multiplied by a factor greater than 1, in order to capture the distortions arising from financing the program by raising tax revenue. Following the advice received from expert peer reviewers, the MSCPF is calculated as 20% of the program cost and subsequent impacts on sales taxesFootnote 11, income taxes as well as on EI and social assistance outlays.
The benefits and costs were calculated over a 10-year period after participation in the program and were subject to an annual discount rate of 5%. This discount rate applied to the 2015 to 2025 period and reflected the sum of an average inflation rate of 3% and of an average real interest rate of 2%, according to Statistics Canada.
Cost-benefit analysis estimates the following 4 indicators:
- Net Present Value (NPV): It represents the total net benefit to society, calculated as the total discounted benefits minus total discounted costs measured over the participation period.
- benefit-cost ratio: The benefit-cost ratio compares the total discounted benefits to society with the direct program costs incurred by the government. It indicates whether the benefits generated by the program exceed its costs.
- payback period: The payback period measures the amount of time required for cumulative discounted benefits to equal cumulative discounted costs. It indicates how long it takes for the program to "break even" from a societal perspective.
- social return: It is the ratio between the discounted net benefit to society and direct program cost to the government. This indicator shows the dollar value of net societal benefit generated when the government invests $1 in the program.
The objective of this analysis is to assess whether the economic benefits generated by the OFPD program outweigh the government's program spending. Specifically, it aims to address the following questions:
- Does the program generate net benefits for society 10 years after participation?
- How long does it take for the program to "break even" from a societal perspective?
- What is the net return to society per dollar of government investment after 10 years?
This analysis examines the discounted benefits and the costs of the OFPD program from 3 perspectives:
- individual: This perspective accounts for impacts on participants' earnings, including when taking part in the intervention (for instance, foregone earnings) and subsequent earnings outcomes relative to non-participants following the intervention (for instance, higher-earnings profile relative to non-participants)
- government: This perspective accounts for the direct costs of the intervention borne by governments, as well as the costs associated with tax distortion; it also includes the impacts on tax revenues and spending on income support programs resulting from changes in participants' post intervention earnings
- society: This perspective combines the individual and government perspectives
A key element of cost-benefit analysis is identifying how costs and benefits are distributed across perspectives. What is a benefit from one perspective is a cost from another. For example, a decrease in EI use is a reduction in income for the participants but constitutes a benefit from the government's perspective. A change represents a net gain to society only when benefits are not offset by costs elsewhere. For example, higher earnings increase participants' income without affecting government costs, whereas reduced EI benefits lower participants' income but benefit government, resulting in no net societal effect (changes shift costs or benefits between participants and governments). Table 8 provides the typical distribution of costs and benefits from the perspective of the individual, government, and society.
| Costs and Benefits | Individual Perspective | Government Perspective |
Society Perspective |
Estimation Method |
|---|---|---|---|---|
| Program cost | 0 | - | - | Cost estimates based on program expenditure data |
| MSCPF | 0 | - | - | 20% of the program cost, sales taxes, income taxes, impacts on EI and impacts on SA. |
| Foregone earnings | - | 0 | - | In-program net impacts on earnings. It captures the earnings foregone during participation |
| Employment earnings | + | 0 | + | Net impacts on earnings over five years post-program |
| Fringe benefits | + | 0 | + | Benefits from being employed include "fringe benefits" such as employer-paid health and life insurance as well as pension contributions. The rate used to calculate the fringe benefits was 15% of the net impacts on earnings |
| Federal and provincial income taxes | - | + | 0 | Net impacts on federal and provincial income tax rates |
| Federal and provincial sales taxes | - | + | 0 | Net impacts on earnings multiplied by the propensity to consume (97%), proportion of household spending on taxable goods and service (52%) and by the total average federal and provincial sales tax rate (11%) |
| Employment Insurance (EI) | -/+ | +/- | 0 | Net impacts on EI use during and after participation |
| Social Assistance (SA) | -/+ | +/- | 0 | Net impacts on SA during and after participation |
| Canada Pension Plan and Quebec Pension Plan contributions | -/+ | +/- | 0 | Net impacts |
| EI premiums | -/+ | +/- | 0 | Net impacts |
| Public Health Care Cost Savings | 0 | + | + | Net impacts |
5.1.1 Considerations and limitations
Cost-benefit analysis helps determine whether a program provides value for money and supports the allocation of limited public funds. The methodology for the cost-benefit analysis incorporates indirect health benefits associated with changes in earnings levels. These health benefits are reflected by estimating the change in public health care cost resulting from income-related changes in participants' health care utilization.
Overall, the cost‑benefit analysis accounted for most key costs and benefits. However, some important factors could not be included due to data limitations. For example, the analysis does not capture non‑quantifiable benefits such as reductions in crime or benefits to organizations, employers, and communities.
5.2 Cost-benefit analysis results
Figure 9 illustrates the costs and benefits of the overall OFPD program from the perspective of the government and the participant. The net social benefit (for the government and participant) is $7,271, which represents an average rate of social return of 131%, or 8% per annum over 12 years (2 years in-program and 10 years post-program). For participants, the total net benefits were $6,450, while for the government, the total net benefits were $821.
Overall, from a societal perspective, the program "breaks even" 3.4 years after participation. The break-even point corresponds to the moment when the direct program cost incurred by government generates an equal amount of net benefits to society.

Figure 9: Text description
| Category | From the government's perspective | From the participant's perspective |
|---|---|---|
| Program costs1 | -5,670 | - |
| Employment Insurance | -187 | +187 |
| Social assistance | +3,994 | -3,994 |
| Government deductions2 | -2,595 | -2,595 |
| Employment earnings | - | +12,852 |
| Health care cost savings3 | +89 | - |
| Total | +821 | +6,450 |
| Measure | Value |
|---|---|
| Total net social benefit (government plus individual over 10 years) | $7,271 |
| Social rate of return | 131% |
- Source: Administrative data - Labour Market Program Data Platform. Cohort of OFPD participants from April 2015 to March 2017, excluding participants in Self-Employment activities (n=7,591).
- Notes:
- Program costs include the program expenditures and the loss incurred by society when raising additional revenues, such as taxes to fund government spending.
- Government deductions include EI premium, Canada Pension Plan or Québec Pension Plan contributions and income and sales taxes. Employment earnings include fringe benefits (for example, employer-paid health insurance, pension contributions) and earnings lost during the time spent in the Program.
- Estimates based on administrative program data and average public health care cost data from a report of the Canadian Institute for Health Information. More details about the methodology can be found in the following technical report: Cost-benefit analysis - Incorporating public health care costs savings in the context of the labour market programs evaluation.
The social return is an indicator that measures the net benefits accruing to society per $1 allocated to a government program. As shown in Figure 10 below, all types of program activities yielded positive social returns over time. Overall, each $1 allocated to the OFPD program yielded a net return of $1.31 over a 10-year period following participation. Subsidized Work Experience activities yielded the highest net social return among all types of program activities.

Figure 10: Text description
| Type of program activity | Social return per $ invested |
|---|---|
| Overall OFPD | 1.31 |
| Skills for Employment | 2.38 |
| Subsidized Work Experience | 2.84 |
- Sources: Administrative data - Labour Market Program Data Platform. OFPD participants from the April 2015 to March 2017 cohort, excluding participants in Self-Employment activities (n=7,591)
- Notes:
- The cost-benefit results for Enhanced Employment Assistance Services were not presented. This is because the incremental impact results were almost equal to zero.
- The break-even point is reached when the amount of investment made by the government generates an equal amount of net benefit to society.
- A social return greater than 1.00 indicates that benefits exceed costs (the break-even point). All program activities shown have returns above 1.00, indicating positive net social benefits.
6. Conclusion
This study presented findings from quantitative analysis to support the fifth evaluation of the OFPD program. It included results from the cost-benefit analysis and the analysis of the net impact of the program on participants' labour market outcomes.
The net impact results show that program participation has a positive impact on participants' incidence of employment, and on their employment earnings (relative to similar non-participants). While the impacts vary by type of intervention, overall OFPD participants earned annually on average $1,180 more than similar non-participants over the 5-year post-program period. OFPD participants also had an incidence of employment 3.7 pp. higher than similar non-participants on average over the 5-year post-program period.
These findings are consistent with the literature and previous evaluation studies of labour market programs employing similar techniques and methodologies, including an analysis of the 2011-2012 cohorts of participants. Overall, results suggest that the OFPD facilitates the transition of persons with disabilities into the labour market, with associated positive long-term impacts.
This evaluation is the first to report net impact results produced using the MCF machine learning approach. In addition to estimating average program impacts, MCF supports the analysis of heterogeneity across socio‑demographic groups and the distribution of impacts at the individual level, providing a more nuanced interpretation of results.
Results from group analysis show that all socio-demographic groups showed average positive net impact on employment outcomes. However, some variations were observed for certain groups. Specifically, individuals aged 30 years or younger, racialized individuals, and those with learning or developmental disabilities, showed below-average impacts on the incidence of employment. In contrast, individuals aged 55 and older showed above-average impacts on the incidence of employment. Regarding employment earnings, Indigenous individuals saw below-average impacts, while those with physical disabilities showed above-average impacts. These findings suggest that program impacts vary across socio-demographic characteristics, highlighting that some groups may face barriers to securing and maintaining employment.
The study also included a cost-benefit analysis to inform value for money considerations. Results indicate that the OFPD program yielded a net positive return on investment over the 10-year post participation period. From a societal perspective, benefits outweigh their associated costs in 3.4 years. Overall, over a 10-year period following the intervention, each dollar invested in the OFPD program yields $2.31 in total benefits, equivalent to a net return of $1.31.
Appendix A: Propensity score distribution and common support region for overall OFPD
The figures below show the distribution of estimated probabilities of OFPD participation for participants and non-participants. As shown in these graphs, the overlap in propensity scores indicates the proportion of non-participants and participants that were successfully matched, that is, the two matched groups overlap in terms of their characteristics. These matched participants are within the 'common support area', that is an area where two matched groups share similar characteristics.

Figure 11: Text description
Distribution of estimated propensity scores for Overall OFPD participants and non‑participants
Histogram comparing the distribution of estimated propensity scores (probability of participation) for OFPD participants and non-participants. The horizontal axis shows probability values from 0 to 1. The left vertical axis shows counts of non-participants, while the right vertical axis shows counts of participants.
Non-participants (shown in light shaded bars) are heavily concentrated at very low probabilities, mostly between 0.0 and 0.2, with counts decreasing rapidly as probability increases.
Participants (shown in dark blue bars) are more widely distributed across the range, with notable concentrations between approximately 0.2 and 0.7, and some extending up to about 0.9.
There is overlap between the two groups. Vertical dashed lines near the extremes indicate the minimum and maximum propensity score bounds.
Overall, the chart shows that participants tend to have higher propensity scores than non-participants, though there is a region of overlap to build credible analysis.

Figure 12: Text description
Distribution of estimated propensity scores for Wage Subsidy participants and non‑participants
Histogram showing the distribution of estimated propensity scores (probability of participation) for Wage Subsidy participants and non-participants. The horizontal axis ranges from 0 to 1, representing probability of participation. The left vertical axis shows counts of non-participants, and the right vertical axis shows counts of participants.
Non-participants (displayed as light shaded bars) are highly concentrated at very low probabilities, primarily between 0.0 and 0.1, with counts dropping sharply beyond 0.2 and becoming nearly zero at higher values.
Participants (shown as dark blue bars) are more spread out across the distribution, with most observations between approximately 0.05 and 0.5, and fewer observations extending up to about 0.6.
There is overlap between participants and non-participants. A vertical dashed line near 0.8 marks the maximum of the common support range.
Overall, the chart indicates that Wage Subsidy participants tend to have higher estimated propensity scores than non-participants, although both groups are concentrated at relatively low probabilities.

Figure 13: Text description
Distribution of estimated propensity scores for Skills for Employment participants and non‑participants
Histogram displaying the distribution of estimated propensity scores (probability of participation) for Skills for Employment participants and non-participants. The horizontal axis shows probabilities from 0 to 1. The left vertical axis represents counts of non-participants, and the right vertical axis represents counts of participants.
Non-participants (shown as light shaded bars) are almost entirely concentrated at very low probabilities, mainly between 0.0 and 0.05, with counts dropping to near zero beyond 0.1.
Participants (shown as dark blue bars) are also concentrated at low probabilities but are more spread out, with most values between approximately 0.02 and 0.2. A small number of participant observations extend further, with sparse values reaching up to about 0.5.
Overlap between participants and non-participants occurs primarily in the very low probability range, roughly between 0.02 and 0.1. A vertical dashed line near 0.5 indicates the maximum of the common support region.
Overall, the chart indicates that both groups have low estimated probabilities of participation, but participants tend to have slightly higher propensity scores and a wider distribution than non-participants.

Figure 14: Text description
Distribution of estimated propensity scores for Enhanced Employment Assistance Service participants and non‑participants
Histogram showing the distribution of estimated propensity scores (probability of participation) for Enhanced Employment Assistance Service participants and non-participants. The horizontal axis ranges from 0 to 1. The left vertical axis represents counts of non-participants, and the right vertical axis represents counts of participants.
Non-participants (displayed as light shaded bars) are concentrated at lower probabilities, primarily between 0.0 and 0.4, with counts steadily decreasing as probability increases and very few observations above 0.7.
Participants (shown as dark blue bars) are concentrated at higher probabilities, mostly between approximately 0.5 and 1.0, with the highest densities between about 0.7 and 0.9.
There is moderate overlap between the two groups, mainly in the mid-range from about 0.4 to 0.7, where both participants and non-participants are present.
Overall, the chart shows a clear separation between groups: non-participants are concentrated at lower propensity scores, while participants are concentrated at higher scores, with a middle range where the distributions overlap.
Appendix B: Covariates used in MCF model
| Variable | Description |
|---|---|
| vismin_b | Binary indicator for whether the individual is racialized or not. |
| aboriginal_b | Binary indicator for whether the individual identifies as Indigenous |
| immigration_freq | Binary indicator for whether the individual is recent 5-years immigrant or not. |
| reported_dtc | Binary indicator for whether the individual claimed the Disability Tax Credit (DTC). |
| Gender | Indicator for the individual's biological sex. |
| Province | Indicator for the individual's province of residence |
| Start year | Indicator for the year in which the individual started their intervention. |
| SelectionInterval_ | Indicator for the quarter in which the individual started their intervention. |
| disability_status_1 | Binary indicator for whether the individual has developmental disabilities. |
| disability_status_2 | Binary indicator for whether the individual has learning disabilities. |
| disability_status_4 | Binary indicator for whether the individual has physical disabilities. |
| age | The numerical age of each individual. |
| Pre-program earnings | The numerical 1-5 years pre-program total employment earnings of each individual. |
| Pre-program social assistance | The numerical 1-5 years pre-program social assistance use of each individual. |
Alternative text
Variable: vismin_b
Description: Indicates whether the individual identifies as a member of a racialized group.
Variable: aboriginal_b
Description: Indicates whether the individual identifies as Indigenous.
Variable: immigration_freq
Description: Indicates whether the individual immigrated to Canada within the previous 5 years.
Variable: reported_dtc
Description: Indicates whether the individual claimed the Disability Tax Credit (DTC).
Variable: Gender
Description: Indicates the individual's sex
Variable: Province
Description: Indicates the individual's province of residence.
Variable: Start year
Description: Indicates the year in which the individual began participating in the intervention.
Variable: SelectionInterval_
Description: Indicates the calendar quarter in which the individual began participating in the intervention.
Variable: disability_status_1
Description: Indicates whether the individual has a developmental disability.
Variable: disability_status_2
Description: Indicates whether the individual has a learning disability.
Variable: disability_status_4
Description: Indicates whether the individual has a physical disability.
Variable: age
Description: Age of the individual, in years.
Variable: Pre-program earnings
Description: Total employment earnings received by the individual during the 1 to 5 years before participating in the program.
Variable: Pre-program social assistance
Description: Total social assistance benefits received by the individual during the 1 to 5 years before participating in the program.
Note:
For indicator variables, a value of 1 indicates "yes" and a value of 0 indicates "no".
| Outcomes | Variables deleted due to feature selection |
|---|---|
| Employment earnings | 4-year pre-program use of social assistance |
| Incidence of employment | 4-year pre-program use of social assistance |
| EI benefits | None |
| Social assistance benefits | None |
Alternative text
Variable removed through feature selection for outcome model
The following variables were excluded by feature selection in the Modified Causal Forests model:
- employment earnings model: Pre-program social assistance uses during the 4th year before program participation.
- employment incidence model: Pre-program social assistance uses during the 0 to 4th year before program participation.
- Employment Insurance (EI) benefits model: No variables were removed through feature selection.
- social assistance benefits model: No variables were removed through feature selection.
Appendix C: Detailed socio-demographic characteristics results
| Action Plan | EEAS | WS | SFE | SE | Total |
|---|---|---|---|---|---|
| Participants | 47% | 39% | 10% | 4% | 100% |
| Start year | EEAS | WS | SFE | SE | Overall |
|---|---|---|---|---|---|
| FY2015/16 | 52% | 33% | 36% | 30% | 42% |
| FY2016/17 | 48% | 67% | 64% | 70% | 58% |
| Gender | EEAS | WS | SFE | SE | Overall |
|---|---|---|---|---|---|
| Female | 37% | 39% | 40% | 54% | 39% |
| Male | 57% | 54% | 57% | 44% | 55% |
| Other/Not declared/decline | 5% | 7% | 3% | 2% | 6% |
| Age group | EEAS | WS | SFE | SE | Overall |
|---|---|---|---|---|---|
| 30 years or younger | 56% | 55% | 45% | 15% | 53% |
| 31-54 years old | 35% | 37% | 43% | 68% | 38% |
| 55 years and over | 9% | 8% | 12% | 17% | 9% |
| Disability type | EEAS | WS | SFE | SE | Overall |
|---|---|---|---|---|---|
| Agility or physical | 11% | 6% | 8% | 14% | 9% |
| Developmental / Intellectual | 19% | 19% | 8% | 2% | 18% |
| Hearing | 3% | 3% | 4% | 4% | 3% |
| Learning | 14% | 15% | 12% | 7% | 14% |
| Mental health | 29% | 33% | 54% | 21% | 33% |
| Motor skills | 4% | 7% | 4% | 15% | 5% |
| Speaking | 1% | 2% | 1% | 0% | 1% |
| Visual | 3% | 2% | 1% | 3% | 2% |
| Other | 14% | 11% | 7% | 17% | 12% |
| Missing | 2% | 2% | 2% | 18% | 2% |
| Marital status | EEAS | WS | SFE | SE | Overall |
|---|---|---|---|---|---|
| Married or common-law | 12% | 12% | 13% | 42% | 13% |
| Widow / divorced or separated | 7% | 7% | 10% | 17% | 8% |
| Single | 70% | 73% | 63% | 34% | 69% |
| Missing / unknown | 12% | 8% | 13% | 7% | 10% |
| Socio-demographic characteristic | EEAS | WS | SFE | SE | Overall |
|---|---|---|---|---|---|
| Indigenous | 11% | 11% | 13% | 11% | 11% |
| Racialized | 18% | 13% | 20% | 14% | 16% |
| Recent immigrants | 2% | 1% | 2% | 2% | 2% |
| Disability tax credit claimant status | EEAS | WS | SFE | SE | Overall |
|---|---|---|---|---|---|
| Claimed disability tax credit (DTC) | 26% | 24% | 15% | 21% | 24% |
| Province | EEAS | WS | SFE | SE | Overall |
|---|---|---|---|---|---|
| Alberta | 17% | 5% | 9% | 9% | 11% |
| British Columbia | 9% | 18% | 37% | 17% | 16% |
| Manitoba | 4% | 1% | 9% | 17% | 4% |
| New Brunswick | 6% | 3% | 6% | 0% | 5% |
| Newfoundland and Labrador | 2% | 2% | 3% | 0% | 2% |
| Nova scotia | 3% | 8% | 5% | 7% | 5% |
| NWT | 0% | 0% | 0% | 1% | 0% |
| Ontario | 41% | 27% | 26% | 7% | 33% |
| Prince Edward Island | 0% | 2% | 2% | 0% | 1% |
| Quebec | 9% | 28% | 2% | 28% | 17% |
| Saskatchewan | 8% | 4% | 1% | 15% | 6% |
| Yukon | 0% | 1% | 1% | 0% | 1% |
| Income groups | EEAS | WS | SFE | SE | Overall |
|---|---|---|---|---|---|
| $0 - $9,999 | 90% | 90% | 87% | 75% | 89% |
| $10,000 - $19,999 | 6% | 7% | 8% | 7% | 7% |
| $20,000 - $29,999 | 2% | 2% | 3% | 4% | 2% |
| $30,000 - $44,999 | 1% | 1% | 1% | 3% | 1% |
| $45,000 - $59,999 | 0% | 0% | 1% | 2% | 0% |
| $60,000+ | 0% | 0% | 0% | 9% | 1% |
| Benefit type | EEAS | WS | SFE | SE | Overall |
|---|---|---|---|---|---|
| Received EI 1 year Prior | 2% | 4% | 3% | 6% | 3% |
| Received SA 1 year Prior | 49% | 50% | 47% | 27% | 48% |
| Intervention Type | Percentage |
|---|---|
| Enhanced employment assistance services | 13% |
| Wage subsidies | 18% |
| Skills for employment | 14% |
| Self-employment | 7% |
| Total | 15% |
Appendix D: Distribution of participants across different disability types by intervention, gender and age
| Disability type | WS | SFE | SE | EEAS | Total |
|---|---|---|---|---|---|
| Speaking | 56% | 4% | 1% | 39% | 100% |
| Motor skills | 47% | 6% | 10% | 36% | 100% |
| Developmental / Intellectual | 43% | 4% | 1% | 53% | 100% |
| Learning | 41% | 8% | 2% | 48% | 100% |
| Mental health | 40% | 16% | 2% | 42% | 100% |
| Hearing | 38% | 12% | 5% | 45% | 100% |
| Visual | 36% | 5% | 4% | 55% | 100% |
| Other | 34% | 6% | 5% | 55% | 100% |
| Agility or physical | 28% | 9% | 6% | 57% | 100% |
| Missing | 28% | 7% | 27% | 37% | 100% |
| All disability types (overall) | 39% | 10% | 4% | 47% | 100% |
| Disability type | Male | Female | Other | Total |
|---|---|---|---|---|
| Speaking | 68% | 29% | 3% | 100% |
| Developmental / Intellectual | 61% | 31% | 8% | 100% |
| Learning | 57% | 37% | 5% | 100% |
| Hearing | 54% | 40% | 6% | 100% |
| Agility or physical | 53% | 45% | 2% | 100% |
| Mental health | 51% | 44% | 5% | 100% |
| Motor skills | 51% | 41% | 8% | 100% |
| Visual | 48% | 45% | 6% | 100% |
| Missing | 53% | 38% | 8% | 100% |
| Other | 60% | 34% | 6% | 100% |
| All disability types (overall) | 55% | 39% | 6% | 100% |
| Disability type | 30 years or younger | 31-54 years | 55 years or older | Total |
|---|---|---|---|---|
| Developmental / Intellectual | 78% | 20% | 2% | 100% |
| Learning | 70% | 28% | 3% | 100% |
| Speaking | 68% | 25% | 7% | 100% |
| Mental health | 45% | 46% | 9% | 100% |
| Visual | 43% | 46% | 12% | 100% |
| Hearing | 38% | 45% | 17% | 100% |
| Motor skills | 29% | 53% | 18% | 100% |
| Agility | 24% | 51% | 24% | 100% |
| Physical | 18% | 53% | 30% | 100% |
| Other | 56% | 33% | 11% | 100% |
| Missing | 54% | 38% | 8% | 100% |
| All disability types (overall) | 53% | 38% | 9% | 100% |
Appendix E: Average treatment effects (ATE) for all individuals by intervention using Modified Causal Forest
| Indicators | Program start year | 1st year post-program | 2nd year post-program | 3rd year post-program | 4th year post-program | 5th year post-program | 5-year annual average post-program start year |
|---|---|---|---|---|---|---|---|
| Employment earnings ($) | 1,466*** | 1,746*** | 867** | 867** | 1,091*** | 1,042** | 1,635* |
| Incidence of employment (pp.) | 20.5*** | 11.9*** | 7.4*** | 8.8*** | 7.2*** | 6.9*** | 6.7*** |
| Indicators | Program start year | 1st year post-program |
2nd year post-program | 3rd year post-program | 4th year post-program | 5th year post-program | 5-year annual average post-program start year |
|---|---|---|---|---|---|---|---|
| Employment earnings ($) | -117 | 239 | -284 | -213 | 275 | 357 | 90 |
| Incidence of employment (pp.) | 9.9*** | 5.7** | 1.2 | 0.1 | 2.1 | 1.6 | 2.2 |
| Indicators | Program start year | 1st year post-program | 2nd year post-program | 3rd year post-program | 4th year post-program | 5th year post-program | 5-year annual average post-program start year |
|---|---|---|---|---|---|---|---|
| Employment earnings ($) | 2,082*** | 3,353*** | 2,767*** | 3,309*** | 2,904*** | 2,754*** | 3,151*** |
| Incidence of employment (pp.) | 33.0*** | 19.7*** | 14.2*** | 15.1*** | 11.4*** | 10.3*** | 14.2*** |
| Indicators | Program start year | 1st year post-program | 2nd year post-program | 3rd year post-program | 4th year post-program | 5th year post-program | 5-year annual average post-program start year |
|---|---|---|---|---|---|---|---|
| Employment earnings ($) | 280 | 2,129* | 1,279 | 1,579 | 1,108 | 2,920* | 1,855* |
| Incidence of employment (pp.) | 11.5*** | 5.9 | 3.9 | 5.9 | 7.1* | 6.7* | 4.1 |
Appendix F: Profile by group for overall OFPD
| Start Year | With developmental disabilities | Without Developmental disabilities | With Learning disabilities |
Without Learning disabilities |
Aged 30 or younger | Aged iver 30 | Aged between 31 and 54 | Not aged between 31 and 54 | Racialized | Not racialized | Indigenous | Not indigenous |
|---|---|---|---|---|---|---|---|---|---|---|---|---|
| FY2015 | 40% | 43% | 46% | 41% | 41% | 43% | 43% | 42% | 42% | 42% | 39% | 42% |
| FY2016 | 60% | 57% | 54% | 59% | 59% | 57% | 57% | 58% | 58% | 58% | 61% | 58% |
| FY2017 | 0% | 0% | 0% | 0% | 0% | 0% | 0% | 0% | 0% | 0% | 0% | 0% |
| Gender | With developmental disabilities | Without Developmental disabilities | With Learning disabilities |
Without Learning disabilities |
Aged 30 or younger | Aged over 30 | Aged between 31 and 54 | Not aged between 31 and 54 | Racialized | Not racialized | Indigenous | Not indigenous |
|---|---|---|---|---|---|---|---|---|---|---|---|---|
| Male | 61% | 54% | 57% | 55% | 60% | 50% | 50% | 58% | 55% | 55% | 57% | 55% |
| Female | 31% | 41% | 37% | 39% | 34% | 45% | 45% | 36% | 41% | 39% | 42% | 39% |
| Other/Not declared/decline | 8% | 5% | 5% | 6% | 6% | 5% | 5% | 6% | 3% | 6% | 1% | 6% |
| Age group | With developmental disabilities | Without Developmental disabilities | With Learning disabilities |
Without Learning disabilities |
Aged 30 or younger | Aged over 30 | Aged between 31 and 54 | Not aged between 31 and 54 | Racialized | Not racialized | Indigenous | Not indigenous |
|---|---|---|---|---|---|---|---|---|---|---|---|---|
| 31-54 years | 20% | 41% | 28% | 39% | 0% | 80% | 100% | 0% | 40% | 37% | 37% | 38% |
| 55 years and over | 2% | 11% | 3% | 10% | 0% | 20% | 0% | 15% | 9% | 9% | 6% | 9% |
| Disability type | With developmental disabilities | Without Developmental disabilities | With Learning disabilities |
Without Learning disabilities |
Aged 30 or younger | Aged over 30 | Aged between 31 and 54 | Not aged between 31 and 54 | Racialized | Not racialized | Indigenous | Not indigenous |
|---|---|---|---|---|---|---|---|---|---|---|---|---|
| Hearing | 0% | 4% | 0% | 3% | 2% | 4% | 3% | 3% | 3% | 3% | 2% | 3% |
| Speaking | 0% | 1% | 0% | 1% | 2% | 1% | 1% | 1% | 2% | 1% | 1% | 1% |
| Learning | 0% | 17% | 100% | 0% | 18% | 9% | 10% | 16% | 13% | 14% | 24% | 13% |
| Motor skills | 0% | 7% | 0% | 6% | 3% | 8% | 8% | 4% | 5% | 5% | 3% | 6% |
| Agility | 0% | 10% | 0% | 10% | 4% | 13% | 11% | 6% | 10% | 8% | 7% | 8% |
| Developmental / Intellectual | 100% | 0% | 0% | 20% | 26% | 8% | 9% | 23% | 14% | 18% | 16% | 18% |
| Mental health | 0% | 40% | 0% | 38% | 28% | 39% | 40% | 28% | 34% | 33% | 35% | 33% |
| Visual | 0% | 3% | 0% | 3% | 2% | 3% | 3% | 2% | 4% | 2% | 2% | 2% |
| Other | 0% | 15% | 0% | 14% | 13% | 12% | 11% | 13% | 12% | 12% | 8% | 13% |
| Physical | 0% | 1% | 0% | 1% | 0% | 1% | 1% | 0% | 1% | 0% | 0% | 1% |
| Missing | 0% | 3% | 0% | 3% | 2% | 2% | 2% | 2% | 2% | 2% | 1% | 3% |
| Marital status | With developmental disabilities | Without Developmental disabilities | With Learning disabilities |
Without Learning disabilities |
Aged 30 or younger | Aged over 30 | Aged between 31 and 54 | Not aged between 31 and 54 | Racialized | Not racialized | Indigenous | Not indigenous |
|---|---|---|---|---|---|---|---|---|---|---|---|---|
| Married or common-law | 4% | 15% | 9% | 14% | 4% | 24% | 23% | 8% | 19% | 12% | 11% | 14% |
| Widow / divorced or separated | 1% | 9% | 4% | 8% | 1% | 15% | 13% | 5% | 8% | 8% | 7% | 8% |
| Single | 84% | 65% | 76% | 68% | 82% | 53% | 57% | 76% | 64% | 70% | 70% | 69% |
| Missing/Unknown | 10% | 10% | 11% | 10% | 13% | 8% | 8% | 12% | 9% | 11% | 12% | 10% |
| Socio-demographic characteristic | With developmental disabilities | Without Developmental disabilities | With Learning disabilities |
Without Learning disabilities |
Aged 30 or younger | Aged over 30 | Aged between 31 and 54 | Not aged between 31 and 54 | Racialized | Not racialized | Indigenous | Not indigenous |
|---|---|---|---|---|---|---|---|---|---|---|---|---|
| Indigenous | 10% | 11% | 19% | 10% | 12% | 10% | 11% | 11% | 16% | 10% | 100% | 0% |
| Racialized | 13% | 17% | 15% | 17% | 16% | 17% | 17% | 16% | 100% | 0% | 23% | 15% |
| Recent immigrants | 0% | 2% | 1% | 2% | 1% | 3% | 3% | 1% | 8% | 1% | 0% | 2% |
| DTC claimant status | With developmental disabilities | Without Developmental disabilities | With Learning disabilities |
Without Learning disabilities |
Aged 30 or younger | Aged over 30 | Aged between 31 and 54 | Not aged between 31 and 54 | Racialized | Not racialized | Indigenous | Not indigenous |
|---|---|---|---|---|---|---|---|---|---|---|---|---|
| Reported DTC | 40% | 20% | 16% | 25% | 28% | 19% | 19% | 27% | 21% | 24% | 15% | 25% |
| Province/Territory | With developmental disabilities | Without Developmental disabilities | With Learning disabilities |
Without Learning disabilities |
Aged 30 or younger | Aged over 30 | Aged between 31 and 54 | Not aged between 31 and 54 | Racialized | Not racialized | Indigenous | Not indigenous |
|---|---|---|---|---|---|---|---|---|---|---|---|---|
| Newfoundland and Labrador | 2% | 2% | 1% | 2% | 2% | 2% | 2% | 2% | 0% | 2% | 1% | 2% |
| Prince Edward Island | 1% | 1% | 1% | 1% | 1% | 1% | 1% | 1% | 0% | 1% | 0% | 1% |
| Nova scotia | 5% | 6% | 8% | 5% | 6% | 4% | 5% | 6% | 3% | 6% | 8% | 5% |
| New Brunswick | 5% | 5% | 5% | 5% | 5% | 4% | 4% | 5% | 2% | 5% | 1% | 5% |
| Quebec | 20% | 16% | 11% | 17% | 18% | 14% | 15% | 17% | 6% | 19% | 1% | 18% |
| Ontario | 28% | 34% | 37% | 32% | 32% | 34% | 34% | 33% | 46% | 30% | 26% | 34% |
| Manitoba | 5% | 4% | 4% | 4% | 4% | 4% | 4% | 4% | 5% | 4% | 5% | 4% |
| Saskatchewan | 4% | 6% | 9% | 5% | 5% | 6% | 7% | 5% | 3% | 6% | 16% | 5% |
| Alberta | 15% | 11% | 8% | 12% | 14% | 9% | 9% | 13% | 15% | 11% | 18% | 10% |
| British Columbia | 16% | 16% | 13% | 16% | 12% | 20% | 19% | 13% | 18% | 15% | 18% | 15% |
| Yukon | 0% | 1% | 1% | 1% | 1% | 1% | 1% | 1% | 0% | 1% | 4% | 0% |
| NWT | 0% | 0% | 0% | 0% | 0% | 0% | 0% | 0% | 0% | 0% | 2% | 0% |
| Income group | With developmental disabilities | Without Developmental disabilities | With Learning disabilities |
Without Learning disabilities |
Aged 30 or younger | Aged over 30 | Aged between 31 and 54 | Not aged between 31 and 54 | Racialized | Not racialized | Indigenous | Not indigenous |
|---|---|---|---|---|---|---|---|---|---|---|---|---|
| $0 - $9,999 | 96% | 88% | 88% | 89% | 91% | 87% | 86% | 91% | 90% | 89% | 89% | 89% |
| $10,000 - $19,999 | 3% | 7% | 8% | 7% | 6% | 7% | 7% | 6% | 6% | 7% | 7% | 7% |
| $20,000 - $29,999 | 1% | 2% | 4% | 2% | 2% | 3% | 3% | 2% | 2% | 2% | 3% | 2% |
| $30,000 - $44,999 | 0% | 1% | 1% | 1% | 0% | 2% | 1% | 1% | 1% | 1% | 0% | 1% |
| $45,000 - $59,999 | 0% | 0% | 0% | 0% | 0% | 1% | 1% | 0% | 1% | 0% | 0% | 0% |
| $60,000+ | 0% | 1% | 0% | 1% | 0% | 1% | 1% | 0% | 1% | 1% | 1% | 1% |
| Benefit type | With developmental disabilities | Without Developmental disabilities | With Learning disabilities |
Without Learning disabilities |
Aged 30 or younger | Aged over 30 | Aged between 31 and 54 | Not aged between 31 and 54 | Racialized | Not racialized | Indigenous | Not indigenous |
|---|---|---|---|---|---|---|---|---|---|---|---|---|
| Received EI 1 year Prior | 2% | 3% | 4% | 3% | 2% | 5% | 5% | 2% | 1% | 3% | 3% | 3% |
| Received SA 1 year Prior | 61% | 46% | 43% | 49% | 44% | 54% | 56% | 43% | 48% | 48% | 51% | 48% |
Appendix G: Robustness check
| Intervention type | Method | Program-start year | 1 yr post-program | 2 yr post-program | 3 yr post-program | 4 yr post-program | 5 yr post-program | 5-year post-program annual average |
|---|---|---|---|---|---|---|---|---|
| Overall OFPD (n = 7,591) | PSM | 983*** | 1,476*** | 1,172*** | 1,033*** | 1,013*** | 1,169*** | 1,172*** |
| Overall OFPD (n = 7,591) | MCF | 965*** | 1,148*** | 1,127** | 1,062** | 1,092** | 1,482** | 1,180 |
| SFE (n = 767) | PSM | 188 | 1,392*** | 1,230** | 1,036* | 777 | 825 | 1,052** |
| SFE (n = 767) | MCF | 747 | 2,187** | 2,296** | 2,011* | 1,956 | 2,719* | 2,262** |
| WS (n = 3,063) | PSM | 2,481*** | 2,665*** | 2,048*** | 1,970*** | 1,864*** | 2,051*** | 2,120*** |
| WS (n = 3,063) | MCF | 2,392*** | 3,005*** | 2,331*** | 2,652*** | 2,009** | 1,939** | 2,489*** |
| EEAS (n = 3,761) | PSM | -232 | 396 | 333 | 176 | 136 | 172 | 243 |
| EEAS (n = 3,761) | MCF | -168 | 108 | -353 | -14 | 459 | 775 | 196 |
| Intervention type | Method | Program-start year | 1 yr post-program | 2 yr post-program | 3 yr post-program | 4 yr post-program | 5 yr post-program | 5-year post-program annual average |
|---|---|---|---|---|---|---|---|---|
| Overall OFPD (n = 7,591) | PSM | 18.1*** | 10.8*** | 7.6*** | 6.9*** | 6.9*** | 5.8*** | 7.6*** |
| Overall OFPD (n = 7,591) | MCF | 14.5*** | 8.2*** | 5.9*** | 4.0** | 5.9*** | 5.1*** | 3.7*** |
| SFE (n = 767) | PSM | 11.1*** | 9.3*** | 5.2** | 5.4*** | 7.7*** | 6.1** | 6.7*** |
| SFE (n = 767) | MCF | 11.9*** | 5.0 | 6.3* | 8.3** | 11.3*** | 9.6*** | 7.8*** |
| WS (n = 3,063) | PSM | 35.7*** | 18.7*** | 13*** | 10.9*** | 9.4*** | 6.4*** | 11.7*** |
| WS (n = 3,063) | MCF | 32.4*** | 18.0*** | 13.3*** | 14.3*** | 10.3*** | 9.7*** | 13.3*** |
| EEAS (n = 3,761) | PSM | 4*** | 3.9*** | 3.2*** | 3.8*** | 4.2*** | 4.2*** | 3.9*** |
| EEAS (n = 3,761) | MCF | 8.7*** | 6.7** | 1.0 | 1.0 | 1.0 | 2.4 | 2.6 |
| Intervention type | Method | Program-start year | 1 yr post-program | 2 yr post-program | 3 yr post-program | 4 yr post-program | 5 yr post-program | 5-year post-program annual average |
|---|---|---|---|---|---|---|---|---|
| Overall OFPD (n = 7,591) | MCF | -11 | 43 | 9 | 11 | 209 | 99 | 60 |
| SFE (n = 767) | PSM | 157** | -16 | 13 | -38 | 29 | 326 | 63 |
| SFE (n = 767) | MCF | 272* | 71 | -19 | 86 | 785* | 539 | 314* |
| WS (n = 3,063) | PSM | 18 | 311*** | 182*** | 122* | 266*** | -64 | 163*** |
| WS (n = 3,063) | MCF | 59 | 238** | 103 | 206 | 274 | 660** | 299** |
| EEAS (n = 3,761) | PSM | 60** | -56* | -132*** | -141** | -109 | -164* | -121*** |
| EEAS (n = 3,761) | MCF | -84 | -120 | -47 | -372*** | -320* | -321 | -248** |
| Intervention type | Method | Program-start year | 1 yr post-program | 2 yr post-program | 3 yr post-program | 4 yr post-program | 5 yr post-program | 5-year post-program annual average |
|---|---|---|---|---|---|---|---|---|
| Overall OFPD (n = 7,591) | PSM | 141** | 48 | 46 | 112 | 223** | 370*** | 160** |
| Overall OFPD (n = 7,591) | MCF | -188* | -345** | -509*** | -364** | -611*** | -355* | -376 |
| SFE (n = 767) | PSM | 53 | -20 | -155 | -212 | -127 | -318 | -166 |
| SFE (n = 767) | MCF | -489* | -536 | -1,250*** | -1,458*** | -1,734*** | -1,570*** | -1,295*** |
| WS (n = 3,063) | PSM | -167* | -504*** | -467*** | -406*** | -192 | 70 | -300*** |
| WS (n = 3,063) | MCF | -518*** | -659*** | -551** | -677** | -540* | -475* | -587*** |
| EEAS (n = 3,761) | PSM | 447*** | 491*** | 471*** | 559*** | 617*** | 710*** | 569*** |
| EEAS (n = 3,761) | MCF | 385** | 360 | 112 | 138 | 63 | -39 | 157 |
References
- Browning, E.K. (1987). Comparing monopoly and competition: The increasing‐cost case. Western Economic Association International, 25(3), 535-542.
- Cockx, B., Lechner, M., & Bollens, J. (2023). Priority to unemployed immigrants? A causal machine learning evaluation of training in Belgium. Labour Economics, 80, Article 102306. https://doi.org/10.1016/j.labeco.2022.102306
- ESDC (2023a). Gender-based analysis plus exploratory evaluation study on selected labour market programs. Employment and Social Development Canada.
- ESDC (2023b). Heterogeneous causal effects of labour market programs: A machine learning approach. Employment and Social Development Canada.
- Frölich, M. (2004), Programme evaluation with multiple treatments. Journal of Economic Surveys, 18(2), 181-224. https://doi.org/10.1111/j.0950-0804.2004.00001.x
- Heckman, J. J., Lalonde, R. J., & Smith, J. A. (1999). The economics and econometrics of active labor market programs. In O. Ashenfelter & D. Card (Eds.), Handbook of labor economics (Vol. 3, pp. 1865-2097). Elsevier. https://doi.org/10.1016/s1573-4463(99)03012-6
- Heckman, J., & Smith, J. (1999). The pre-program earnings dip and the determinants of participation in a social program: Implications for simple program evaluation strategies. The Economic Journal, 109(457), 313-348.
- Lechner, M. (2019). Modified causal forests for estimating heterogeneous causal effects (CEPR Discussion Paper No. 13430). Centre for Economic Policy Research. https://cepr.org/publications/dp13430
- Lechner, M. (2023). Causal machine learning and its use for public policy. Swiss Journal of Economics and Statistics, 159(1), 1-15.
- Lechner, M., & Mareckova, J. (2022). Modified causal forests. (arXiv:2209.03744). arXiv. https://arxiv.org/abs/2209.03744
- Rosenbaum, P. R., & Rubin, D. B. (1983). The central role of the propensity score in observational studies for causal effects. Biometrika, 70(1), 41-55. https://doi.org/10.2307/2335942
- Rubin, D. B. (1974). Estimating causal effects of treatments in randomized and nonrandomized studies. Journal of Educational Psychology, 66(5), 688-701. https://doi.org/10.1037/h0037350
- Wager, S., & Athey, S. (2018). Estimation and inference of heterogeneous treatment effects using random forests. Journal of the American Statistical Association, 113(523), 1228-1242.