
Building Understanding: The First Report of the National Advisory Council on Poverty
Alternate formats

Building understanding – The first report of the National Advisory Council on Poverty [PDF - 2.3 MB]
Large print, braille, MP3 (audio), e-text and DAISY formats are available on demand by ordering online or calling 1 800 O-Canada (1-800-622-6232). If you use a teletypewriter (TTY), call 1-800-926-9105.
On this page
- Executive summary
- Chapter 1 – Background
- Chapter 2 – Poverty in Canada
- Chapter 3 – National Advisory Council on Poverty engagement – What we heard
- Chapter 4 – Report on progress
- Chapter 5 – Covid-19: Marginalized populations and Canada's response
- Chapter 6 – Conclusions and recommendations
- Appendices:
Executive summary
In August 2018, the Government of Canada announced Opportunity for All – Canada's First Poverty Reduction Strategy. The Strategy included a commitment to the UN Sustainable Development Goal's target of reducing poverty by 20% by 2020 and 50% by 2030. Opportunity for All included the adoption of the Market Basket Measure (MBM) as Canada's Official Poverty Line and the creation of the National Advisory Council on Poverty (Council) to report on progress made toward the poverty reduction targets.
This is the first report of the National Advisory Council on Poverty. It continues Canada's discussion on poverty by bringing forward the voices of individuals with lived expertise of poverty. It details progress toward our poverty targets and recommends improvements to our poverty reduction efforts.
Poverty in Canada
Statistics Canada calculates the Market Basket Measure, Canada's Official Poverty Line, using data from the Canadian Income Survey. There is a 2-year lag between when Statistics Canada administers the survey and when the data becomes available. The most current statistics available are from 2018.
According to the data, 1 in 9 people in Canada live in poverty. Some groups have disproportionately high levels of poverty, including, unattached individuals, persons with disabilities, children, recent immigrants, persons in sole-caregiver families and First Nations People living on a reserve. The impacts of poverty are particularly profound for women and individuals who belong to more than one at-risk group. Statistics Canada reports other indicators of poverty on Canada's Poverty Dashboard in addition to the Market Based Measure. This includes food insecurity, housing and the percentage of people in deep poverty. However, federal survey data cannot always be disaggregated to enable reporting for some of the most marginalized and under-served individuals, including Indigenous people living on a reserve, racialized people and LGBTQ2S individuals.
What we heard
In March 2020, we began an engagement to hear from individuals with lived expertise of poverty. We believe it is important that the people most affected by decisions are able to inform those decisions. We also included service providers, government personnel and other interested parties in our consultations. We ended our engagement prematurely because of the COVID-19 pandemic. As a result, planned consultations in central and eastern Canada had to be cancelled. These consultations were to focus on racialized groups, persons with disabilities, LGBTQ2S individuals and children and youth. This report, therefore, is incomplete. We will address those shortcomings in next year's report.
We met over 200 individuals. They told us poverty is personal and that their identity, background, past experiences, health and other factors influence their experience of poverty. Regardless of differences, poverty leaves a lasting impact and imprint on the lives of those for whom it is, or was, a daily reality. We heard from individuals with lived expertise about their experiences living without income and lacking resources to maintain basic needs like food and shelter. In each of the communities we were struck by stories regarding the stigma of poverty and the guilt and shame associated with living in poverty. The experiences that were shared, told of discrimination and feelings of being invisible, devalued, or ignored, not only within society, but also when using services.
We asked individuals with lived expertise what works to decrease the impact of poverty. They emphasized the importance of having agency and choice. They also emphasized the need for programs that are based on mutual trust, are culturally safe and include wraparound supports to address the multiple and complex barriers many individuals and families living in poverty face. Participants stressed the need to invest in proven solutions, such as affordable housing, education and child care and to improve inclusion for marginalized populations and education and training for employers and service providers.
Report on progress
Between 2015 and 2018, the percentage of the population living below the official poverty line decreased by 21.5%. There were reductions in poverty in every province. If the progress is continued and sustained, the Government will meet its poverty reduction target of a 20% decrease by 2020. Despite the overall decrease in people living below the official poverty line, there has been an increase in food insecurity, a decrease in literacy and numeracy and a small rise in unmet housing needs. In addition, those living in poverty are further below the poverty line. These findings indicate that more must be done to reduce poverty in Canada.
We are unable to adequately report on how equitable poverty reduction has been. There were decreases in poverty in all groups measured by Canada's Official Poverty Line. However, data limitations make it impossible to assess in detail whether progress has been observed for some of the most marginalized groups, including racialized populations, persons with disabilities and LGBTQ2S individuals.
COVID-19
A few weeks after we started collecting evidence for this report, all that we knew about poverty would rapidly change due to COVID-19. The full effects of the crisis on Canadians living in poverty will not be known for some time. This includes how it will affect poverty rates and Canada's efforts towards meeting its poverty reduction goals. The COVID-19 pandemic continues to unfold and the government's response continues to evolve.
We do know, however, that the pandemic has exposed gaps and vulnerabilities in our social safety net, particularly in the Employment Insurance program. It has made it impossible to ignore the harsh realities that the most marginalized members of our society face every day.
Joblessness puts pressure on many Canadian families, particularly those family types that were already at higher risk for living in poverty. The sudden closure of most in person supports and services for marginalized Canadians left many people with nowhere to turn to for the essential services relied on.
The pandemic has created an environment for change. Rather than simply returning to the pre-pandemic status quo, we can instead develop a more equal, healthy, purposeful and resilient society. This would involve building more responsive systems that include targeted policies for at-risk populations and are at a level that is sufficient to keep people out of poverty.
Recommendations
As a council, we have been tasked with reporting on the Government of Canada's progress and to continue a national dialogue on poverty. We have also chosen to offer some recommendations based on our experience over the past year.
- The federal government's Poverty Reduction Strategy is already showing promising results in meeting Canada's commitment to reduce poverty by 20% by the year 2020. From 2015 to 2018, the overall poverty rate in Canada fell from 14.5% to 11% of people living under Canada's Official Poverty Line. The Government of Canada has invested in a number of areas that help to reduce poverty. These include current and planned investments in the National Housing Strategy, Reaching Home, the acquisition fund, infrastructure, disability benefits, as well as the Multilateral Early Learning and Child Care Framework and supports for before school and after school clubs. However, the overall poverty rate, while moving in the right direction, does not tell the whole story. To appreciate the multi-dimensional nature of poverty, one must consider the entire poverty dashboard of indicators. It reveals that progress in certain areas has been slow or non-existent. Rates of food insecurity, unmet housing needs, and literacy and numeracy rates indicate a need for immediate action. In this context:
- the Government of Canada should continue with the implementation of the Poverty Reduction Strategy and with its current government-wide investments
- the Government of Canada should focus additional investments in 4 areas where progress is falling behind: food security, housing and homelessness, literacy and numeracy and the poverty gap
- As acknowledged throughout our report and in Opportunity for All – Canada's First Poverty Reduction Strategy, poverty in Indigenous communities is an outcome of colonialization and government policies. As a result, the Government of Canada has committed to a nation-to-nation, government-to-government and Inuit-Crown relationship with First Nations, Métis and Inuit. Based on the principles that those commitments were founded on, collaborative work is underway to reduce poverty in Indigenous communities. However, progress remains slow and poverty rates among Indigenous people living in urban, rural and remote settings remains very high compared to the general population
- The Government of Canada should take urgent action to support Indigenous leaders to reduce poverty in their communities and to ensure they have all the resources available to support their own people in their own way. We specifically recommend the co-development of Indigenous indicators of poverty, as committed to in the Poverty Reduction Strategy, the co-development of a range of Indigenous poverty reduction strategies such as distinctions-based housing strategies, as committed to in the National Housing Strategy and commitments made through the Indigenous early learning and child care agreements
- The data necessary to be able to report on Indigenous people should be made available to report on by our next progress report in 2021
- We heard that the experience of poverty is different for everyone and is influenced by identity, background, past experiences, health, privilege and many other factors. However, data limitations mean that marginalized populations are often uncounted or undercounted for in the Government of Canada's statistics. Our assessment and reporting for this report were hampered by our inability to disaggregate data. We saw that many people were excluded or silenced through a failure to collect data, to ask inclusive questions, or to engage with them in program and policy development. The silencing of their voices leaves those who are the most marginalized and underserved out of the conversation
- All Statistics Canada and federal population-based surveys should ask inclusive questions and provide inclusive response options on women and gender equity, Indigenous heritage, immigration/refugee status, race/ethnicity, disability, prior or current institutionalization, sexual orientation and gender identity, to allow for routine disaggregation of data to support better decision making and reporting of poverty disparities
- The Government of Canada should work with stakeholders and communities to ensure that any new survey questions and response options regarding race, gender identity and sexual orientation are inclusive and that the questions reach the populations that are currently not captured
- We heard from individuals with lived expertise of poverty that discrimination, racism, anti-Black racism and stigma are among the main causes of poverty. Persons with disabilities, immigrants, refugees, ethno-cultural and racialized groups, LGBTQ2S individuals and many others remain at a high risk of living in poverty compared to the general population
- The Government of Canada should incorporate an equity lens when it reviews, develops and implements strategies, policies and programs. It should ensure Canada's poverty reduction efforts work as well for those at the highest risk as for everyone else and meets the unique needs of marginalized populations, including immigrants, refugees, ethno-cultural and racialized groups, persons with disabilities, LGBTQ2S individuals and people experiencing homelessness. The Government should also use available data to transparently report on the use of the equity lens and the outcomes
- During the pandemic, the Government of Canada moved quickly to fill gaps in the social safety net and to provide direct support to families and individuals. Early data indicates that women, youth, children, less educated workers, recent immigrants, racialized individuals, informal workers who do not have a job with benefits and temporary employees on short-term contracts with no job security have been hardest hit by the economic impacts of the COVID-19 pandemic. There was an emphasis on providing low barrier, broad-based support and with less onerous application processes. At present, there is a unique opportunity to consider the lessons learned from this crisis and to rebuild and recover in such a way that capitalizes on opportunities for a more vibrant, resilient and sustainable economy while improving both the social safety net and proactive initiatives to prevent poverty by creating supportive social environments across the life course
- The Government of Canada should collaborate with provinces and territories to build on its COVID-19 response and strengthen existing strategies, programs and policies to ensure a coordinated robust social safety net in Canada by collectively providing income support that is at least at the level of Canada's Official Poverty Line
- We recommend that benefits be streamlined and simplified to make them low barrier, easier to access and easy to tailor to individual needs
Dedication
We dedicate this 2020 progress report to all those courageous people who shared their stories, successes and struggles with the Council in the hope that we would in turn share them across Canada. You are at the heart of this report. Thank you for your time, insight and resilience.
Message from the Chair
It is my honour and pleasure to present, on behalf of the National Advisory Council on Poverty (NACP) our 2020 report on the progress of Opportunity for All – Canada's First Poverty Reduction Strategy. Consistent with our values, throughout this report, we seek to bring forward the diverse voices of over 200 individuals with lived expertise that we had the privilege of hearing from during our engagement sessions; we look at the big picture and shed light on the structural barriers that keep people from exiting poverty; and, we prioritize equity, inclusion and compassion in our analysis and recommendations.
Poverty is scary, it means something different to everybody, to some it is a loss of freedom and good choices, to others it is hungry bellies or sleeping rough, not being able to buy your daughter a Barbie, or to always be worried about making rent. You probably all have your own definition. Poverty is a soul crushing daily reality for far too many individuals across Canada.
The Council recognizes that poverty reduction and ultimately eradication – requires strong partnerships. When efforts at all levels are aligned, complimentary and interwoven positive policies can lead to successful and sustainable programs. Poverty can't simply be solved, we must learn our way out of it, which is what the Council set out to do.
In March 2020 members of NACP began a coast to coast-to-coast engagement dialogue on poverty. We had the privilege of hearing from individuals with lived expertise, stakeholders and service providers in Surrey, Abbotsford, Vancouver, Yellowknife, Edmonton, Prince Albert, Saskatoon and Winnipeg about their experiences of poverty and their efforts toward poverty reduction.
We witnessed amazing resilience, mental fortitude and deep caring along the way. Beautiful souls, who shared their journey, their hardships and their triumphs. These incredible people dedicate themselves to supporting each other in their communities through the never-ending grind of poverty.
Unfortunately, mid-way through these engagement sessions, the world changed dramatically. The COVID-19 pandemic forced the Council to postpone visits to central and eastern Canada. As a result, there are many voices, perspectives and stories missing from this document. In this context, this report is about the government's progress towards poverty reduction since the release of Opportunity for All, but it is also about the changes COVID-19 has forced upon us and how we move forward as a country from this crisis to build back a better "next normal" that doesn't leave anyone behind, because much like our collective response to COVID-19, none of us are safe, until we are all safe.
Thank you,
Scott MacAfee
Chapter 1 – Background
Poverty defined
According to Opportunity for All – Canada's First Poverty Reduction Strategy, poverty is the condition of a person who is deprived of the resources, means, choices and power necessary to acquire and maintain a basic level of living standards and to facilitate integration and participation in society. As a council, we agree with this broad definition of poverty. We also feel that a more comprehensive definition would highlight the feelings of disempowerment, disconnection from society and lack of control that characterise poverty. This is in line with the United Nations definition of poverty. A comprehensive definition of poverty reminds us that poverty reduction is about more than making sure that people have enough money to buy healthy, nutritious food or to secure safe housing. Poverty reduction is about ensuring that all people living in Canada have the right resources to be healthy and to thrive, to feel included and to feel they have control of their lives.
Global efforts to reduce poverty
The United Nations has led efforts to set poverty reduction targets at a global level through the Sustainable Development Goals. These goals aim to reduce the proportion of people living in poverty by half by 2030, with an overall goal of no poverty. The Government of Canada has committed to achieving this goal and has developed a Poverty Reduction Strategy, Opportunity for All, to help reach it.
Opportunity for All – Canada's First Poverty Reduction Strategy
Opportunity for All – Canada's First Poverty Reduction Strategy was designed to bring together new and existing government investments and to set the foundation for future government investments in poverty reduction.
National Advisory Council on Poverty Progress Report 2020
Created as part of Opportunity for All, the National Advisory Council on Poverty brings together a diverse group of 10 dedicated, passionate and knowledgeable members from across Canada. We are individuals with lived expertise, leaders, experts, academics and practitioners from across the field of poverty reduction. Visit the National Advisory Council on Poverty website for additional information about our members and our terms of reference. This is our first report on progress.
Chapter 2 - Poverty in Canada
Number of people living in poverty
Statistical data can provide important information for decision-making about the number of people living in poverty, the populations that are at highest risk, the impact of government interventions and whether things are improving or not over time. In this chapter, we will provide a brief snapshot of poverty in Canada, using Canada's Official Poverty Line.
As a council, we heard from those with lived expertise that poverty is a constant struggle. We also heard that the experience of poverty varies from person to person; it does not have 1 definition and no 2 people experience poverty the same way. It is influenced by a person's identity, background, past experiences, health, privilege and other factors. As a result, capturing the diverse and deeply challenging experience of living in poverty through data alone is not possible. Statistics alone cannot tell us about what it means to live in poverty.
Marginalized groups
Throughout this report we refer to a number of populations that are underserved, marginalized, over looked and that face high levels of discrimination, racism and stigma. These include Indigenous people, immigrants, refugees, individuals who identify as members of ethno-cultural, Black and other racialized populations, LGBTQ2S people, persons with disabilities, people experiencing homelessness, children and youth in care, people living in institutions and people living in remote areas. When we refer to marginalized groups, these are the people we are referring to.
How poverty is measured
Although an Individual's income level and poverty experiences are not the same, income level is often used as a proxy measure for poverty. With the passing of the Poverty Reduction Act in June 2019, Canada's official measure of poverty, Canada's Official Poverty Line, was entrenched into law. Canada's Official Poverty Line is based on the Market Basket Measure (MBM), which is based on the cost of a basket of goods and services that individuals and families require to meet their basic needs and achieve a modest standard of living in communities across the country.
What we know about poverty in Canada
A note on data: Poverty rates based on Canada's Official Poverty Line are estimated using results from the Canadian Income Survey, Canada's official source of poverty statistics. The Canadian income Survey is an annual survey. It has a standard 2-year lag between the end of a reference year and when the results become available. The following section of the report is based on the most current statistics available, which come from the 2018 Canadian Income Survey that was published in February 2020 and updated in September 2020 to reflect the re-based MBM – referred to as the 2018-base MBM. The economic impact of the COVID-19 pandemic on poverty rates will be reflected in the 2020 Canadian Income Survey, which will not be available until February 2022.
The poverty rate in 2018 was 11% based on Canada's Official Poverty Line. This means that 3.98 million Canadians, or 1 in 9, were living in poverty in 2018. In order to reduce poverty to meet the targets set out in Opportunity for All – Canada's First Poverty Reduction Strategy and to ensure that poverty reductions measures are equitable and reach the most underserved and marginalized Canadians, it is important to understand who the 3.98 million Canadians living in poverty are.
Poverty is more likely to affect some groups than others. Factors such as sex, gender identity, family composition, immigration status, disabilities, institutionalization, exposure to violence, racism, anti-Black racism, ableism, discrimination, homophobia, transphobia and location all play a role. Because of colonialism, past and present, Indigenous people are at high risk.
Marginalized groups face economic barriers, racism and discrimination and are more likely to live in poverty. Unfortunately, as shown in the table below, the Canadian Income Survey does not capture the experience of many of these subpopulations.
| Group | Number in poverty | Poverty rate |
|---|---|---|
| Overall | 3,983,000 | 11.0% |
| Unattached individuals (18 to 64 years old) | 1,428,000 | 34.6% (males) 36.7% (females) |
| People in sole-caregiver families | 417,000 | 28.6% (female-led) 14.1% (male-led) |
| Recent immigrants | 445,000 | 26.0% (0 to 4 years in Canada) 14.4% (5 to 9 years in Canada) |
| Indigenous people living off reserve | 153,000 | 19.5% |
| Persons with disabilities | 1,364,000 | 16.6% |
| Women | 1,987,000 | 10.9% |
| Children (0 to 17 years) | 748,000 | 10.8% |
| Indigenous people living on reserve | Data not available | Data not available |
| LGBTQ2S individuals | Data not available | Data not available |
| Racialized communities | Data not available | Data not available |
- Source: Canadian Income SurveyFootnote 1
Focusing on 1 identifier (such as gender, race or disability) allows us to consider how poverty affects different people in different ways. However, people are varied and complex. These identifiers are overlapping and multiple, and failing to consider these intersections gives us an incomplete understanding of poverty. Many of the most marginalized and vulnerable people in Canadian society are those who face intersecting barriers based on their ethnicity, disabilities, sexual orientation, gender, and age. A more comprehensive measure of poverty would highlight much more nuance. This would enable governments to better understand at risk groups and develop policies to support the most marginalized people. For this reason, it is so important to be able to disaggregate data. Below we have identified those groups with the highest incidence of poverty, as illustrated in the table above.
Women
In 2018, for the first time, the poverty rate for women (10.9%) was lower than the rate for men (11.1%). Although at first glance this looks positive, the Market Basket Measure is based on economic family and not individual income. Further examination of the data indicates that the income gap between men and women persists and is most pronounced during child rearing years when women are significantly more likely than men to stay home, particularly while their children are pre-schoolers. Moreover, the median hourly wage for women has been consistently lower than that for men over the past decade. In 2009, the median hourly wage for women was $3.93 less than men and this gap had increased to $4.00 in 2019.
Further, although the poverty rate among women has improved, the poverty rate among women with intersecting identifiers (such as immigrant women, women of colour, Indigenous women and women with disabilities) magnifies the risk of poverty.
Family composition
Family composition can influence poverty. Families with children, especially those in sole-caregiver families, unattached individuals and youth aging out of care, are at high risk of poverty.
In 2018, the poverty rate among children aged 0 to 17 years was 10.8%. Although the poverty rate among children was below the national average, children from families with other intersecting identifiers (for example sole-caregivers, immigrants, refugees, individuals who identify as members of Black, ethno-cultural and other racialized populations, Indigenous people living on or off reserve) continue to experience higher poverty rates. For instance, the poverty rate among people in sole-caregiver families is 26.3% compared to 7.5% among couple families with children under 18 years of age. For families with children under 18 years of age, the poverty rates were higher for those where the head of the economic family was Indigenous (19.4%), a recent immigrant (in Canada for less than 10 years) (21.1%), or an immigrant (13.9%).
There has been little Canadian research on what happens to youth when they leave the child welfare system. However, the limited data that is available indicates that youth leaving care are particularly marginalized and underserved. A 2017 paper by the Child Welfare Political Action Committee asserts that the majority of youth who age-out of care live in poverty and are more likely to experience homelessness.
In 2018, unattached individuals had the highest rate of poverty in Canada. The poverty rate among unattached male and females aged 18 to 64 years was 34.6% and 36.7%, respectively.
Indigenous people
Poverty among Indigenous people is unique in Canada. Indigenous people have faced a long history of racism and discrimination, and much of the poverty among Indigenous people in Canada is the result of colonialism and government programs and policies over more than a century.
For this reason, addressing Indigenous poverty requires different policy responses and tools. The forced separation of Indigenous people from their land, culture, and community, and the legacy of Indian Residential Schools has led to ongoing trauma and intergenerational poverty for Indigenous people.
We do not have sufficient data on poverty among Indigenous people and low-income estimates for Canada's Official Poverty Line are not currently available for people living on a reserve or in the territories. But we do know that living conditions on a reserve, and statistics on income, educational attainment and employment outcomes suggest poverty is much higher among Indigenous people living on reserves than off reserves.
We also know that, in 2018, 19.5% of Indigenous people living off a reserve were in poverty. There were significant differences in the poverty rate for Metis people (14.2%) and Inuit (15.8%) compared to First Nations (24.4%) people.
Marginalized groups
Marginalized groups face numerous barriers to social inclusion and accessing employment, housing and services. These lead to a greater risk of poverty.
Recent immigrants (meaning those who have lived in Canada less than 10 years) may face discrimination, racism, difficulty having their educational and professional credentials recognized, language barriers and difficulty building social networks when they arrive in Canada. In 2018, 26.0% of immigrants who had been in Canada for 4 years or less and 14.4% of immigrants who had been in Canada for 5 to 9 years were living in poverty.
Persons with disabilities face discrimination and other barriers to education and employment. As a result, they face a very high risk of living in poverty. Further, Canada's Official Poverty Line may not fully capture the additional costs that persons with disabilities often have. In 2018, 16.6% of persons with disabilities were living in poverty. Poverty rates were the highest for individuals with mental or psychological disabilities (25.0%) or a cognitive disability (24.7%). Poverty rates for persons with disabilities were particularly high for unattached individuals (excluding seniors) (49.5%), female sole-caregivers (34.7%), Indigenous people living off reserve (31.8%) and immigrants who landed in Canada less than 10 years ago (27.2%).
Persons with disabilities were also overrepresented in deep income poverty. In 2018, of the 1,973,000 people whose family disposable income is below 75% of Canada's Official Poverty Line, 666,000 were a persons with disabilities, meaning that around 30% of people in deep poverty had a disability.
Data for racialized and LGBTQ2S individuals is not available in the Canadian Income Survey and so poverty rates based on Canada's Official Poverty Line are not available for these groups. However, what data is available elsewhere indicates that poverty rates among these groups are higher than the national average.
Data from the 2016 census indicates that 20.6%, or approximately 1.58 million, racialized individuals were living in poverty in 2015, while the poverty rate of non-racialized individuals was 10.6%.
Black populations and racialized people face systemic racism, anti-Black racism and discrimination, which have resulted in unequal health, social and financial outcomes. Available data from the 2016 Census indicates that the poverty rate among people from racialized communities is more than double the national poverty rate.
Many LGBTQ2S individuals experience discrimination and stigma throughout their lives and often face isolation and alienation, identity-based family conflict and related challenges. There is very little data on low income among LGBTQ2S individuals. Information regarding sexual orientation and gender identity is not collected through the Canadian Income Survey or many other Statistics Canada surveys. However, the limited data that is available suggests that LGBTQ2S individuals are at a high risk of being in low income, isolation and social exclusion. Some LGBTQ2S individuals are more likely to experience discrimination, violence, homelessness and poverty than others. Research shows that LGBTQ2S youth disproportionately represent 20% to 40% of the approximately 40,000 youth that experience homelessness in Canada every year (Abramovich, 2012). Racialized LGBTQ2S individuals experience homelessness at disproportionate rates.
Regional poverty
Finally, people living in Canada face a higher risk of living in poverty depending on where they live. Because of differences in provincial economies, social policies and demographics, poverty rates vary by province. In 2018, the poverty rate under Canada's Official Poverty Line ranged from 9.4% in Alberta to 13.3% in Nova Scotia. Differences are also frequently observed between urban and rural areas.
What more we need to learn about people in poverty in Canada
What we do not know about people living in poverty is just as important as what we do know. Federal surveys often collect demographic information so that data can be disaggregated by age and sex. However, information about poverty among some of the most vulnerable and marginalized groups continues to be limited because:
- many of the most underserved people (such as those in institutions or the homeless) are often not part of survey target populations
- the sample size of many surveys is too small to allow for disaggregation for smaller population groups
- questions related to race, ethnicity, sexual orientation and gender identity are often not asked of survey respondents
Moreover, low income estimates based on Canada's Official Poverty Line are not currently available for people living in the territories or on a reserve. Statistics Canada is currently working with territorial governments to develop a Market Basket Measure in the 3 territories.
This means that data on poverty in Canada is incomplete and that we do not have information about low income rates among some of the most vulnerable and marginalized groups in Canada.
Chapter 3 – National Advisory Council on Poverty engagement – What we heard
Objectives of engagement with people with lived expertise of poverty
- Better understand the experiences, perspectives and priorities of people living in poverty
- Share people's experiences and lived expertise to illustrate the many different faces of poverty and to motivate a broader social movement for change
- Understand further actions that are needed better support people to leave poverty
We began a coast to coast-to-coast engagement on poverty in March 2020. The purpose of the engagement was to continue a dialogue on poverty that was started when the Government of Canada developed Opportunity for All – Canada's First Poverty Reduction Strategy. It was also to listen to and to better understand the challenges that individuals with lived expertise of poverty are facing. We sought to hear from Canadians living in diverse contexts about their experiences, opinions, perspectives and ideas related to poverty reduction and building a more inclusive country.
Above all, we undertook this engagement with the goal of elevating the voices of those who are experiencing or who have experienced poverty. The Council considers it not only important, but also a right for people affected by decisions to inform those decisions. Given the right information, people affected by poverty are in the best position to describe their experience and the programs, policies or other solutions that work.
We had the privilege of hearing from individuals with lived expertise, stakeholders and service providers about their experiences of poverty and their efforts to move out of poverty. We met with people in Surrey, Abbotsford, Vancouver, Yellowknife, Edmonton, Prince Albert, Saskatoon and Winnipeg. (A full list of organizations we spoke to is included in Appendix B). Unfortunately, before we could visit other parts of Canada, the COVID-19 pandemic forced us to suspend all further engagement sessions. As a result, this chapter is incomplete and must remain so. Many voices are missing, not just from regions of the country that we were not able to travel to, but also from youth and children and people with different life experiences and perspectives including, people who identify as LGBTQ2S individuals, persons with disabilities, racialized people and refugees.
The absence of these voices leaves a significant gap. The voices that are missing from this particular report are the same voices that are so often missing or silenced and that are missing from the data as noted in the previous chapter. They are often the most marginalized and their voices and experiences are not often valued by society overall. They are people who, because they are living in poverty, have a limited ability to effect change and make choices in their own lives. It was for this reason that we wanted to hear directly from them. We deeply regret that we were not able to complete the engagement process we started. We are committed to hearing from these voices and sharing their expertise and stories when it is once again safe to gather.
What poverty means to you
Please note: Throughout the engagements, participants shared that poverty is individual. As we did not get to hear the individual experiences of some of the most marginalized groups in our society, we want to emphasize that the experience of poverty described here does not reflect everyone's experience of poverty. In particular, the voices of racialized Canadians, LGBTQ2S individuals, persons with disabilities, refugees and asylum seekers, people living in institutions, children and youth are missing from this document and therefore so are their experiences.
We asked individuals in each location to respond to the question: "What does poverty mean to you?" The discussion that we had with each of the individuals and groups is highlighted below and informed the development of our report and a deeper understanding of poverty.
Overwhelmingly, we heard that the experience of poverty is different for everyone. It is influenced by identity, background, past experiences, health, privilege and many other factors. Throughout the engagement we were struck by the diversity of experience of those living in poverty.
"[Poverty is] just barely surviving, and never getting to live."
- Participant with lived expertise in Winnipeg, Manitoba
Some described poverty as a lack of income. Others described poverty as lacking the resources needed to maintain their own and their family's basic needs, such as food and shelter. Some participants shared that poverty felt like an identity and described being treated poorly because of it. Many mentioned feeling that the system made them feel invisible or like they did not exist and that they were ignored.
We also heard from many participants that poverty is a constant struggle. Some elements of this struggle identified by participants were:
- having to make impossible choices (such as between buying food or paying rent)
- spending hours waiting in lines to access resources, doing things specifically to survive (such as sex work, begging)
- living with the stigma of being poor
- living in a constant state of fear, of not knowing what comes next, being isolated from the community and never being comfortable in the present
- physical pain and struggle: of being frozen cold, of having swollen feet and being unable to put on shoes because of this
"To me, poverty is struggling to survive."
-Participant with lived experience from Yellowknife, Northwest Territories
Systemic barriers and common challenges
While we heard that poverty is individual, we also heard about a number of systemic barriers, common challenges and sources of frustration. During the engagements, individuals with lived expertise and stakeholders working for community organizations described some of the key barriers that create and reinforce poverty. Stakeholders acknowledged that these issues, particularly discrimination and stigma, are problems that are deeply rooted in our society.
Challenges facing Indigenous people
"We are not poor by chance."
– Participant with lived expertise from Winnipeg, Manitoba
As noted in the previous chapter, the experience of Indigenous people has been shaped by colonization and historical and ongoing government policy and programs. While many of the challenges that Indigenous people face are similar to other people living in poverty, their causes, their challenges and their experiences are rooted in colonialism and, historical and ongoing racism and discrimination.
Indigenous participants spoke about racism and discrimination. They described racism as a major barrier to both securing employment and finding a place to rent. One participant shared that "…people [employers] do not want to take a chance on Indigenous people."
"Being an Aboriginal woman between 16 and 30 is dangerous. We go missing and no one bats an eyelash."
-Participant with lived expertise in Prince Albert, Saskatchewan
Many individuals shared their fears of losing their children (as in having their children removed and placed in foster care) and identified this as a significant source of anxiety. These fears are amplified in the context of multi-generational child removals due to policies of assimilation that were pursued by the Government. We heard from Indigenous women that they are disproportionately targeted by child protective services and that navigating the system to regain custody of their children is complex. One participant described this process as "a fight" and shared that her community was integral in helping her to regain custody of her child.
In the Northwest Territories, participants also noted that food insecurity was a major source of worry in their lives. We heard from stakeholders about extremely high costs of food and other basic necessities.
Discrimination and stigma
One of the most common barriers identified by individuals with lived expertise was discrimination because of their race, ethnicity, gender, sexual orientation, language spoken and other factors. Some people shared that the social stigmas and prejudice they experienced in their lives cause them to feel alone and isolated.
Intergenerational poverty
"Living pay cheque to pay cheque is learned."
-Participant with lived expertise
Many individuals with lived expertise described the trauma they experienced as children growing up in poverty. Because of what she went through when she was younger, one participant stated, "I was never a child."
One stakeholder shared that there is a multi-generational legacy of poverty and strong correlation between child homelessness and reduced educational outcomes, addiction, homelessness and poverty in adulthood. Another shared that he believes trauma - historical events that have deeply marked the individual's sense of self and their emotional well-being - is at the root of the majority of poverty. This is because most clients his organisation serves had experienced negative life events – whether in childhood or after – before experiencing poverty or homelessness.
Addictions
Some participants shared that addictions and substance use are a way to cope with events, anxiety, fear or trauma, but that addiction can "make you lose everything." In some cases, individuals need a space to safely use drugs (for example safe injection sites) and in other cases individuals need a place that is culturally safe and near their place of residence to get sober and receive supports for exiting addictions.
"Addiction gets you stuck in a rut."
-Participant with lived expertise in Prince Albert, Saskatchewan
We heard that there is a great deal of guilt and shame experienced by parents struggling with addictions. They felt there is nowhere to turn for help. With no money, mothers and fathers expressed that there are limited resources for their children. They expressed fear of losing their children as a consequence. Many of the individuals that we spoke with had histories of substance use or abuse and many were working hard to rebuild their lives.
Mental health
Many participants shared that they struggle or have a history of struggling with mental illness and mental health challenges, such as anxiety and depression. We heard that poverty exacerbates these challenges. They spoke of the cycle of mental health struggles leading to poverty which in turn leads to more mental health struggles. Many individuals shared that they cannot think about or plan for the future. That doing so causes them significant additional stress and often fear. Stakeholders identified that resources such as psychological therapy, safe injection sites and inclusive programming are very important to support those struggling with addictions, trauma and mental health challenges.
Exploitation
Newcomers to Canada with advanced skillsets, as well as individuals without post-secondary education and high school diplomas described witnessing or experiencing situations of exploitation. One participant shared seeing scams and illegal activity directed at job-seekers on popular job websites and that the scams deliberately target vulnerable people. Another participant described working for a company that laid him off and failed to pay him for the work he had completed. He noted that he found many of the same problems in Canada that led to him leaving his country of origin.
Women, children and child care
Women with lived expertise in poverty and stakeholder organizations all emphasized the need for housing, child care and access to services and extra curricular activities to improve the lives of children living in poverty. mothers are too afraid to ask for help or access services, given that they are at risk of losing their children to foster care if they admit they are struggling. Some stakeholders felt that there is stigma attached to people who are seen as "undeserving" of access to supports, for example, mothers with multiple children living in poverty. Stakeholders also highlighted the lack of funding for appropriate supports in shelters, such as childcare, support workers, counselling and other family supports.
Challenges of existing supports
During the engagements, many individuals with lived expertise described challenges they experienced in accessing a variety of supports that were often wholly inadequate. Alternatively, we also heard about services and supports that have been effective in increasing the resiliency of those living in poverty. It is important to hear about program successes and challenges directly from the people they are meant to serve. Participants shared a wealth of information about the challenges and effective solutions. Overwhelmingly, however, participants across engagements shared that dignity, choice and respect were key to transformative service delivery and provision.
Access to and adequacy of existing programs
Participants described that many of the existing benefits, particularly, social assistance, housing benefits and child care are simply inadequate and therefore make it impossible to get ahead.
Access to housing and housing benefits were raised very frequently in our engagements. Key issues raised include:
- lack of affordable and adequate housing as a key barrier to moving out of poverty
- rent that has become increasingly unaffordable
- long wait-lists for subsidized housing and other social housing programs
- multiple families living in one residence
- individuals staying in violent situations and trading sex in order to remain housed
- living conditions within the shelter system, for example overcrowding, lack of privacy, exposure to violence, sleeping on the floor, that do not allow homeless people to live with dignity - 1 participant described being denied access to a washroom to relieve herself
- underfunding prevents shelters from providing staff for 24 hours, which means that people have to leave the shelter, line up outside, sometimes for hours, and re-qualify every day
- the fear of losing housing while seeking treatment, or if kids were temporarily removed from the home
- being taken advantage of by landlords who do not take care of their rental properties and treat tenants poorly
- having had no choice but to move into rental properties that were severely damaged or had mould
"That's my worst fear, losing my place [home]. Then what?"
-Participant with lived expertise from Yellowknife, Northwest Territories
When you are homeless, you are part of the food chain of the street. You are always predator and prey."
-Participant with lived expertise from Vancouver, British Columbia
There were regional challenges with respect to housing too. In British Columbia, we heard that individuals in temporary housing are remaining there for lengthy periods of time because of a lack of other options for low cost housing. There are also limited resources to support individuals transitioning out of shelters. Many individuals live in fear of losing housing and shelters are overpopulated, while extreme weather conditions make sleeping outside very dangerous. In rural areas, housing can be crowded and resources, such as shelters or low income housing, simply do not exist. In Winnipeg, some people spoke of being pushed out of areas where gangs and street violence are rampant.
Food insecurity was another common theme. Common challenges include:
- regularly waking up hungry, not knowing where they will get their next meal
- food banks often having limits on the number of times families can access their resources
- a feeling of having to justify oneself or feeling judged when asking for help
- that available food is not always culturally appropriate or compatible with dietary restrictions
"[Poverty is being] hungry all the time."
-Participant with lived expertise in Prince Albert, Saskatchewan
Aside from food and housing, participants on social assistance described how the benefit amounts make it impossible to get ahead. One participant shared that, in her experience, "Welfare doesn't support you. It seems like it just wants to keep you [in poverty]."
"…I've been trying to get back to school for years. I want to go to university and become a paleontologist."
-Participant with lived expertise from Winnipeg, Manitoba
In addition, individuals across all engagements told us that they had a desire to access education, but that costs associated with education, including transportation, housing, supplies, accessible and affordable child care and tuition were barriers.
Finally, we heard from parents and family members that child care is a major barrier to accessing employment, housing and government services. We heard that individuals are forced to make impossible choices to ensure they can provide food and clothing for their family, afford rent and be able to provide children with a safe environment. We also heard that it can be difficult for new Canadians to access child care so that they can participate in essential language programs that can help with future employment.
Program coordination and systems navigation
The notion of the "poverty trap" came up in many of the engagement sessions. Participants shared stories that demonstrated how a lack of program and benefit coordination can prevent people from taking care of themselves or getting ahead. We heard, as a result, that many programs were not as supportive as they intended to be. Some had unintended negative consequences. For example, a participant commented that you can go to the food bank, but you have nowhere to cook if you are homeless. Those on social assistance or living in low-income described being unable to afford market rent and being stuck on a waitlist for affordable housing, which prevents them from being able to secure employment, which prevents them from being able to look after their children or secure child care and so on.
Some stakeholders shared that the lack of program coordination makes it difficult for people living in poverty, who already face many barriers, to seek and acquire the help they need. We heard that accessing government assistance was challenging and a substantial time investment, including:
- spending a lot of time navigating government websites to determine eligibility for various programs and services
- filling out extensive paperwork (which can be a barrier for many)
- waiting in long lines and visiting multiple sites
"It is a full-time job being homeless."
– Participant with lived expertise in Edmonton, Alberta
Participants at multiple engagement sessions said they feel as if they are constantly "jumping through hoops" and having to prove that they require financial support. Participants described:
- not feeling believed, which caused feelings of shame, frustration and hopelessness
- not accessing benefits at all, or having benefits taken away, which in many cases left them without necessary resources, such as housing
- feeling overwhelmed and afraid of the bureaucracy and not understanding the systems and the decision making process
- how the constant surveillance and moral judgments imposed upon them are unrealistic and harmful to the well-being of their family
- not being aware of all the programs and benefits that are available to them
- how information may not be accessible to people living in poverty because of barriers related to literacy, language and access to technology
Stakeholders spoke about the need for supports for life's transitions. They said that inadequate supports at key junctures in life (such as leaving prison, losing a job or starting a new one) can lead people into, or back into, poverty and homelessness. For example, one stakeholder shared that, while there are resources available to get tenants into their first home, there is a lack of supports in place to help people remain housed. Sometimes this means that, after becoming housed, vulnerable people fall into a cycle of homelessness. We also heard that although problems related to mental health, addictions, homelessness and poverty are often interrelated, these challenges are not always addressed concurrently, which can make it difficult to exit homelessness and poverty.
One-size-fits-all programs do not work
Stakeholders expressed concern that people living in poverty are treated as a homogenous group. In reality though, there are other intersecting issues like racism, anti-Black racism, sexism and stigma that can multiply the isolation and difficulties that individuals living in poverty experience. We heard from stakeholders that it is a major challenge to develop services that are responsive to diverse people's needs within programs and benefits systems that are designed for consistent application and standards.
Some participants also shared that they are rarely given choice or autonomy when seeking help. In Vancouver's Downtown Eastside, we heard that access to expedited housing and greater assistance was contingent upon guilty pleas in the Community Court. For example, participants spoke of struggling to live with significant restrictions on their personal choices in exchange for affordable housing and on-site support.
"We are not second-rate citizens. If you engage with us you will see how similar we are [to everyone else]."
– Participant with lived expertise from Surrey, British Columbia
Individuals who have experienced chronic homelessness shared that they are required to live under significant monitoring and with limited individual freedoms in exchange for housing. This focus on safety and compliance without supports to address long-term needs for increased autonomy, private housing, health, income and community integration does not set program participants up for success.
What works
We also asked participants what works. They emphasized the importance of giving agency and choice. This includes programs that are based on mutual trust and are culturally safe. They also emphasized that programs must include wraparound supports that address the multiple and complex barriers many individuals and families living in poverty face.
Participants stressed the need to invest in proven solutions, such asaffordable housing, education and child care, to improve access for marginalized populations. They also stressed the need for education and training for employers and service providers.
Chapter 4 - Report on progress
Progress under Canada's Official Poverty Line
Opportunity for All – Canada's First Poverty Reduction Strategy set 2 key poverty reduction targets: a 20% reduction in poverty by 2020 and a 50% reduction in poverty by 2030, relative to 2015 levels.
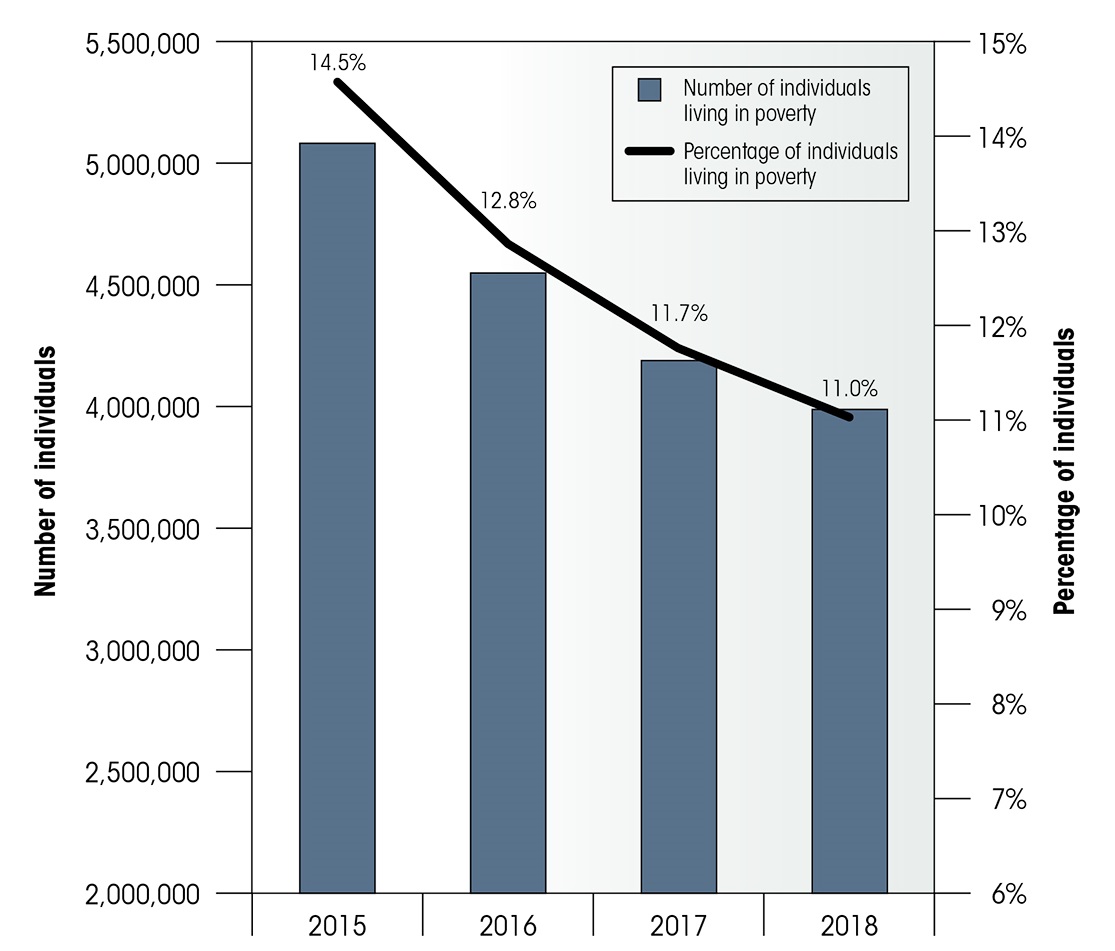
The poverty rate in Canada fell from 14.5% in 2015 to 11% in 2018. This represents a 24.1% reduction. These figures are based on the Official Poverty Line and the Market Basket Measure, however, it excludes data for the 3 territories. In 2018, 1.09 million fewer people were living in poverty than in 2015. However, this data is more than 2 years old and it remains unclear how the COVID-19 pandemic will affect poverty rates and trends.
- Source: Canadian Income Survey
Text description of Figure 1
| Year | 2015 | 2016 | 2017 | 2018 |
|---|---|---|---|---|
| Number of persons in poverty | 5,074,000 | 4,543,000 | 4,188,000 | 3,983,000 |
| Percentage of persons in poverty (%) | 14.5 | 12.8 | 11.7 | 11.0 |
Between 2015 and 2018, poverty, as measured by Canada's Official Poverty Line, fell across all provinces in Canada and for all population groups. This was captured using available Statistics Canada data. However, the size of this change varied across regions and marginalized groups.
Despite improvements in the overall poverty rates, some of the other indicators of poverty, including food insecurity, unmet housing needs and the average poverty gap ratio, stayed the same or worsened. Data limitations make it difficult to assess trends across these indicators for different marginalized groups. That makes it challenging to identify where additional investments would be most beneficial.
Trends for marginalized populations under Canada's Official Poverty Line
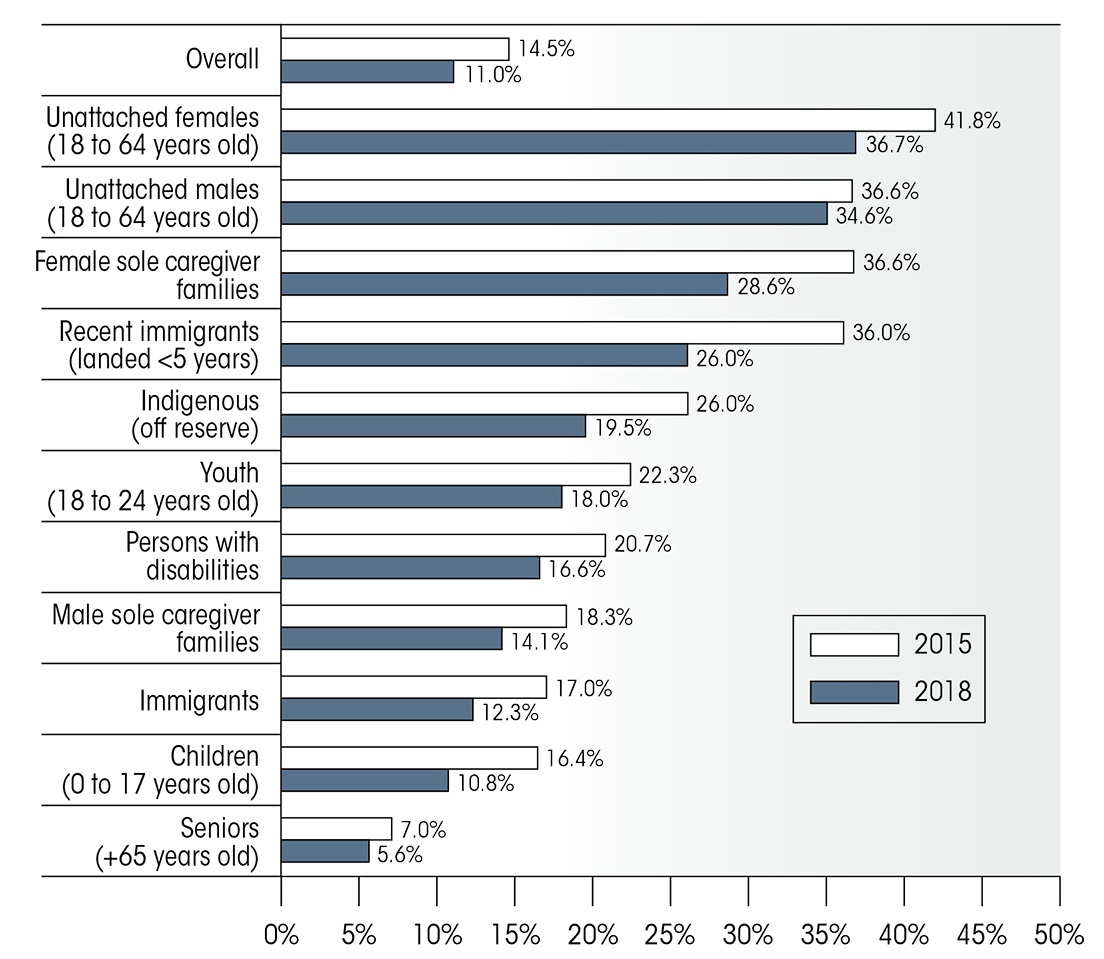
Between 2015 and 2018, the poverty rates for all groups that can be counted for using data from the Canadian Income Survey decreased. However, the poverty rate among many marginalized groups remained well above the national average. In particular, poverty rates remained persistently high (at over 30%) for both unattached male and female individuals over this period. In addition, although female-led sole-caregiver families saw a considerable decrease in their poverty rate over this period, they continued to be at high risk of living in poverty.
- Source: Canadian Income Survey
Text description of Graph 2
| Demographic group | Poverty rate (%) in 2015 | Poverty rate (%) in 2018 |
|---|---|---|
| Overall | 14.5 | 11.0 |
| Unattached females (18 to 64 years old) | 41.8 | 36.7 |
| Unattached males (18 to 64 years old) | 36.6 | 34.6 |
| Female sole caregiver families | 36.6 | 28.6 |
| Recent immigrants (landed <5 years) | 36.0 | 26.0 |
| Indigenous people (living off reserve) | 26.0 | 19.5 |
| Youth (18 to 24 years old) | 22.3 | 18.0 |
| Persons with disabilities | 20.7 | 16.6 |
| Male sole caregiver families | 18.3 | 14.1 |
| Immigrants | 17.0 | 12.3 |
| Children (0 to 17 years old) | 16.4 | 10.8 |
| Seniors (+65 years old) | 7.0 | 5.6 |
Regional trends
People across Canada experience poverty differently, as the country is very diverse. The Canadian provinces and territories exist in very different contexts; they have different economics and demographic realities. They also take difference approaches to their social programs and use a variety of social policies to achieve their policy objectives.
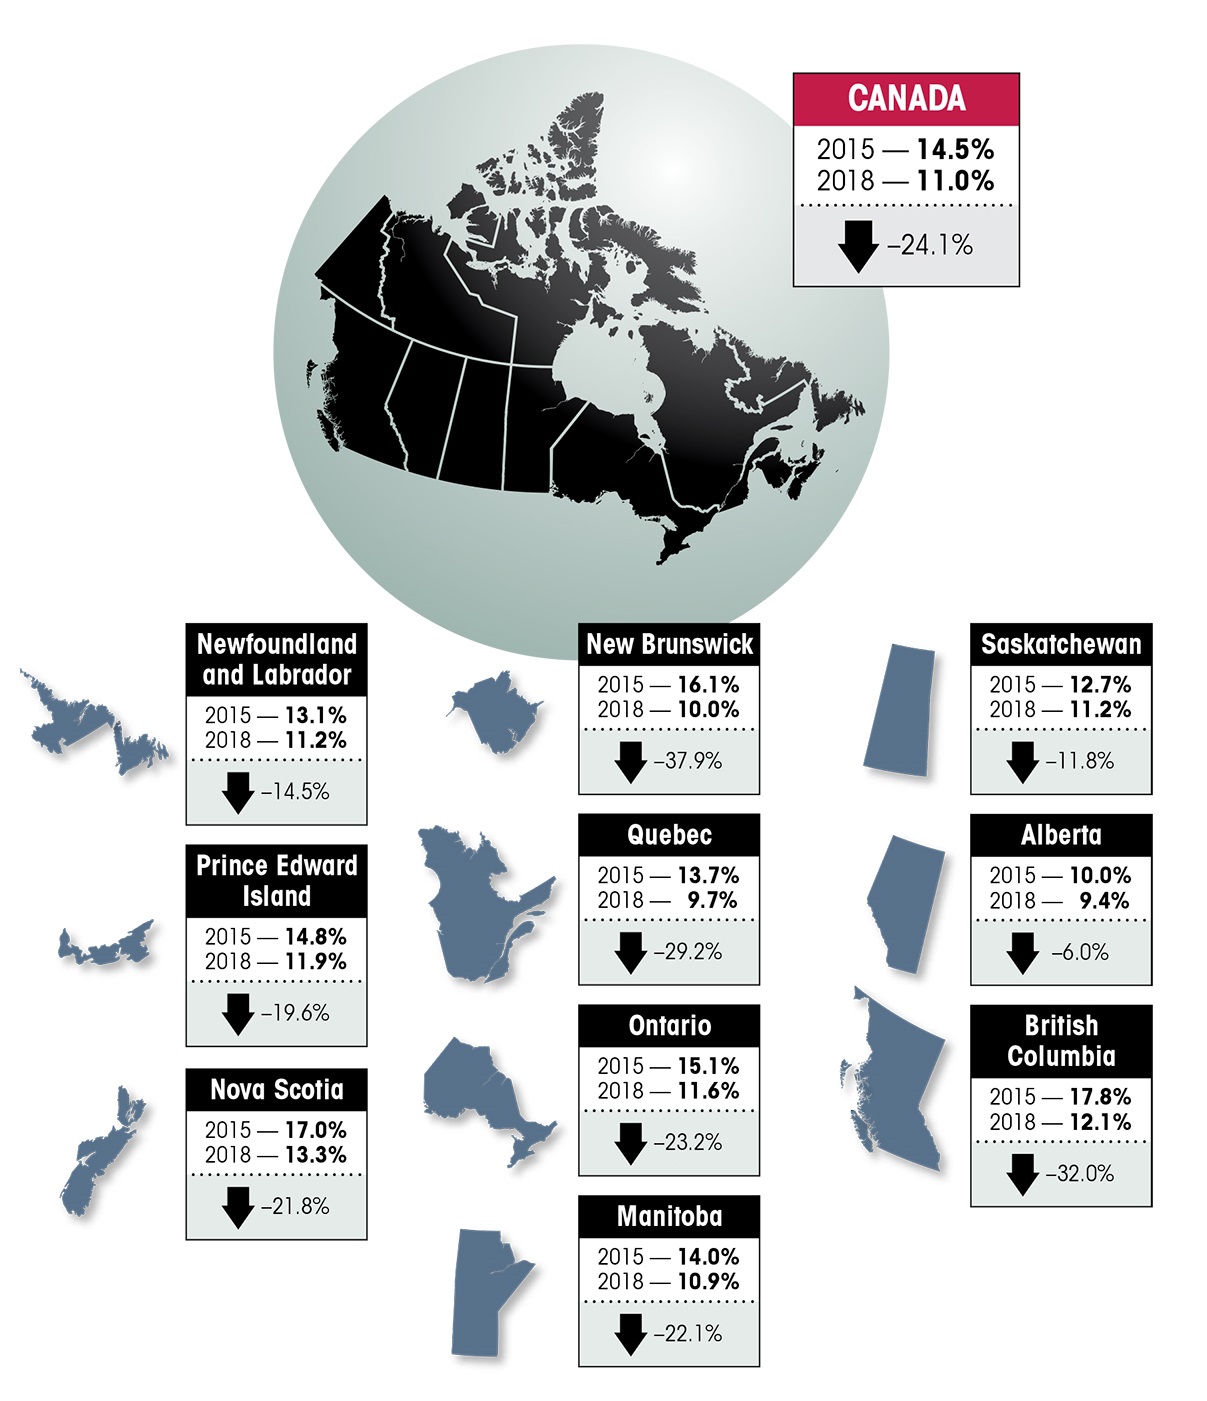
According to the Canadian Income Survey, which collects information on the income of Canadians living in the 10 provinces, in 2018, poverty was highest in Nova Scotia (13.3%) and lowest in Alberta (9.4%). Between 2015 and 2018, the poverty rate in each province was on a downward trend. Over this period, the largest decreases among provinces were in New Brunswick (37.9%) and British Columbia (32.0%) and the smallest decreases were in Alberta (6%) and Saskatchewan (11.8%). However, New Brunswick and British Columbia had higher poverty rates in 2015 than many of the other provinces, particularly Alberta and Quebec, whose poverty rates have remained below the national average during this period.
Between 2015 and 2018, the national poverty rate fell by more than 24%, from 14.5% to 11.0%. This represents roughly 1,091,000 fewer persons living below the poverty line in a four-year period. New Brunswick and British Columbia had the largest reductions in poverty (37.9% and 32.0% respectively).
- Source: Canadian Income Survey
Text description of Infographic
| Province | Poverty rate (%) in 2015 | Poverty rate (%) in 2018 | Percent decrease between the 2015 and 2018 rates (%) |
|---|---|---|---|
| Canada | 14.5 | 11.0 | -24.1 |
| Newfoundland and Labrador | 13.1 | 11.2 | -14.5 |
| Prince Edward Island | 14.8 | 11.9 | -19.6 |
| Nova Scotia | 17.0 | 13.3 | -21.8 |
| New Brunswick | 16.1 | 10.0 | -37.9 |
| Quebec | 13.7 | 9.7 | -29.2 |
| Ontario | 15.1 | 11.6 | -23.2 |
| Manitoba | 14.0 | 10.9 | -22.1 |
| Saskatchewan | 12.7 | 11.2 | -11.8 |
| Alberta | 10.0 | 9.4 | -6.0 |
| British Columbia | 17.8 | 12.1 | -32.0 |
Progress on multiple dimensions of poverty
Please note: Given survey and data limitations, it is not possible to report on poverty trends for territorial residents, LGBTQ2S people, Black and racialized populations, people living in institutions, children and youth in care, persons and children with a disability, homeless people or Indigenous people living on a reserve using Canada's Official Poverty Line. The exclusion or silencing of these marginalized populations through a failure to collect data excludes the most marginalized and underserved from the conversation and makes it difficult – if not impossible – to assess whether existing programs and policies are meeting the needs of these populations.
Recognizing the fact that poverty has many dimensions, in addition to Canada's Official Poverty Line, Opportunity for All established a dashboard of indicators that Canadians can use to track progress made across the many dimensions of poverty, such as housing, health, food security, literacy and numeracy. A summary of the progress made across these indicators is presented below in Table 2.
| Indicator | Reference period | Initial estimates | Latest estimates | Change (effect on poverty) | Data source |
|---|---|---|---|---|---|
| Deep income poverty (People with income below 75% of Canada's Official Poverty Line) |
2015 to 2018 | 7.4% | 5.4% | Decrease (positive) | Canadian Income Survey |
| Unmet housing needs (People who are in housing that is unaffordable, in need of major repairs, or unsuitable for the size and composition of the household) |
2011 to 2016 | 12.5% | 12.7% | Increase (negative) | Census |
| Chronic homelessness (People who experience homelessness for at least 6 months over the past year or have recurrent experiences of homelessness over 3 or more years) |
2016 to 2017 | 26,866 | 29,202 | Increase (negative) | National Homelessness Information System |
| Unmet health care needs (People 12 years and older who reported not receiving health care when they felt they needed it) |
2000 to 2001, and 2014 | 12.5% | 11.2% | Decrease (positive) | Canadian Community Health Survey |
| Food insecurity (Households that reported food insecurity) |
2011 to 2012 and2017 to 2018 | 8.3% | 8.7% | Increase (negative) | Canadian Community Health Survey |
| Indicator | Reference period | Initial estimates | Latest estimates | Change (effect on poverty) | Data source |
|---|---|---|---|---|---|
| Relative low income (People who had less than half the median after-tax income) |
2015 to 2018 | 14.2% | 12.3% | Decrease (positive) | Canadian Income Survey |
| Bottom 40% income share (Percentage of total after-tax income that went to the bottom 40% of the income distribution) |
2015 to 2018 | 20.2% | 20.8% | Increase (positive) | Canadian Income Survey |
| Youth not in employment, education or training (People aged 15 to 24) |
2015 to 2018 | 10.9% | 10.1% | Decrease (positive) | Labour Force Survey |
| Low literacy (Indicates limited ability in understanding, using, reflecting on and engaging with written text which enables basic participation in society – 15 years old) |
2015 to 2018 | 10.7% | 13.8% | Increase (negative) | Program for International Student Assessment |
| Low numeracy (Indicates limited ability in communicating, using and interpreting mathematics in daily life – 15 years old) |
2015 to 2018 | 14.4% | 16.3% | Increase (negative) | Program for International Student Assessment |
| Indicator | Reference period | Initial estimates | Latest estimates | Change (effect on poverty) | Data source |
|---|---|---|---|---|---|
| Real median hourly wageFootnote 2 (The real hourly wage at which half the population has a higher wage and half the population has a lower wage – 2019 constant dollars) |
2015 to 2019 | $23.63 | $24.04 | Increase (positive) | Labour Force Survey |
| Average poverty gap (For those living below the poverty line, the poverty gap ratio is the amount that the person's family disposable income is below the poverty line, expressed as a percentage of the poverty line) |
2015 to 2018 | 31.8% | 33.4% | Increase (negative) | Canadian Income Survey |
| Asset resilience (People who had enough savings to maintain well-being for 3 months) |
2005 to 2012 | 46.2% | 51.2% | Increase (positive) | Survey of Financial Security |
| Low income entry rates (Proportion of people who entered low income in the second year out of those who were not in low income in the first year) |
2014 to 2015 fiscal year to 2016 to 2017 fiscal year | 4.1% | 4.1% | No change | Longitudinal Administrative Databank |
| Low income exit rates (Proportion of people who exited low income in the second year out of those who were in low income in the first year) |
2014 to 2015 fiscal year to 2016 to 2017 fiscal year | 27.5% | 27.9% | Increase (positive) | Longitudinal Administrative Databank |
Summary of indicator trends
Although poverty as measured by Canada's Official Poverty Line has fallen between 2015 and 2018, there are some dimensions of poverty tracked under the strategy where a lack of progress was observed or where the data trends indicate things may be getting worse.
Specifically, at the general population level, there has been a decrease in food security and a small rise in unmet housing needs. In addition, the average poverty gap (or average shortfall from the poverty line for those living in poverty) has increased. Literacy and numeracy both decreased.
Food insecurity
Food insecurity measures the number of Canadian households that do not have enough money to purchase or access a sufficient amount and variety of food to live a healthy lifestyle.
Between 2011 to 2012 and 2017 to 2018, food insecurity increased from 8.3% to 8.7% in Canada. In 2017 to 2018, food insecurity was highest in the territories, particularly in Nunavut, where 49.4% experienced food insecurity.
Food insecurity was also high among female (25.1%) and male (16.3%) sole-caregiver families with child(ren). Data is not available to look at trends across marginalized populations; however, available data for 2017 to 2018 indicates Indigenous households (22.8%) and racialized households (10.3%) were more likely than non-Indigenous households (7.7%) and white households (7.0%) to be food insecure.
We heard during engagements that food insecurity is a major stressor and a huge part of the constant struggle of living in poverty. Food insecurity is a key indicator of poverty - it is a clear sign that individuals and families are unable to meet their basic needs - and the trends observed under this indicator of the past decade suggests that additional investments are required in this area.
Unmet housing needs
Unmet housing needs captures those Canadians who are in housing that is unaffordable (more than 30% of before-tax household income); in need of major repairs; or unsuitable for the size and makeup of a family.
Between 2011 and 2016 (the last year for which there is data available), there was a small increase in the rate of those experiencing unmet housing needs from 12.5% to 12.7%. In fact, there has not been an improvement in the percentage of the population with unmet housing needs over the past decade and a half. Further, the overall rate disguises key differences in unmet housing needs among subpopulations. As shown in Table 3, in 2016, more than 20% of recent immigrants, people in sole-caregiver families and unattached individuals had unmet housing needs.
| Group | 2011 | 2016 | Change |
|---|---|---|---|
| Overall | 12.5% | 12.7% | +0.2 |
| Sole-caregiver families | 28.4% | 27.0% | -1.4 |
| Recent immigrants (landed <5 years) | 29.6% | 26.6% | -3.0 |
| Unattached individuals (<65 years old) | 19.6% | 20.4% | +0.8 |
| Indigenous people living off reserve | 19.0% | 18.3% | -0.7 |
| Immigrants | 17.0% | 17.8% | +0.8 |
| Seniors (65+ years old) | 13.7% | 14.0% | +0.3 |
| Couples with children | 7.2% | 6.9% | -0.3 |
- Source: CensusFootnote 3
We heard during engagements that a lack of affordable and adequate housing is a key barrier to moving out of poverty. Many participants described having no choice but to stay in places that were unhealthy or unsafe because they had nowhere else to go. The stagnation of this indicator shows that additional investments in housing for low income Canadians are required.
Average poverty gap ratioFootnote 4
This indicator measures the average shortfall below Canada's Official Poverty Line for those living in poverty.
Between 2015 and 2018, the average poverty gap ratio increased from 31.8% in 2015 to 33.4% in 2018. This trend was observed in every province and across demographic groups. However, as shown in Table 4, the size of the average poverty gap ratio and the rate of change varied among subpopulations. This indicates that, although the percentage of people living in poverty has declined, on average, those living in poverty had income that fell further below the poverty line in 2018 compared to 2015. Low income male sole-caregivers and unattached males saw their income going further below the poverty line between 2015 and 2018. The lack of progress under this indicator makes clear that more must be done to help the most marginalized in our society from falling further behind.
| Groups | 2015 | 2018 | Change |
|---|---|---|---|
| Overall | 31.8% | 33.4% | +1.6 |
| Unattached (single) males (18 to 64 years old) | 43.8% | 46.5% | +2.7 |
| Unattached (single) females (18 to 64 years old) | 46.2% | 43.9% | -2.3 |
| Indigenous people living off reserve | 33.1% | 36.8% | +3.7 |
| Recent immigrants (landed <10 years) | 33.4% | 35.1% | +1.7 |
| Male sole-caregiver family | 27.3% | 32.1% | +4.8 |
| Couples with children | 24.5% | 26.8% | +2.3 |
| Female sole-caregiver family | 29.3% | 25.8% | -3.5 |
- Source: Canadian Income Survey
Summary of multi-dimensional poverty trends for marginalized populations
Our analysis of multi-dimensional poverty trends among marginalized populations was hampered by our inability to disaggregate data. In particular, indicators tracked under the dashboard, in most cases, cannot be disaggregated to look at the experience of Indigenous people, LGBTQ2S individuals, racialized populations and persons with disabilities. This is particularly concerning, given that available data indicates that there are significant differences in the experiences of subpopulations.
Trends by age group
Children (0 to 17 years old)
Although children are less likely to live in poverty than ever before, literacy and numeracy among teenagers aged 15 years is worsening. Between 2015 and 2018, the low literacy rate increased from 10.7% to 13.8% and low numeracy from 14.4% to 16.3%. In other words, an increasing number of young people do not have the necessary reading, writing and math skills to participate fully in society.
Because literacy and numeracy are essential skills for accessing opportunities that allow individuals to excel in life – from education and skills development to securing quality employment – this trend is concerning and suggests more must be done to support young people in acquiring the skills they need to succeed.
Youth (18 to 24 years old)
Generally, multi-dimensional poverty trends among youth aged 18 to 24 years were moving in the desired direction between 2015 and 2019. For all indicators for which data was available, except for the average poverty gap, the situation for youth could be considered to have improved. In particular, there was a positive increase observed in the percentage of youth that were in education, employment or training from 89.1% to 89.9% between 2015 and 2019.
Seniors (65+ years old)
Although the poverty rate for seniors remains low, the elderly are more likely to be living near the poverty line (incomes within 10% of the threshold). Further, relative low income for unattached seniors is high and increasing under the Low Income Measure. This indicates that seniors earn less on average – and increasingly so – than the average Canadian.
Trends by family type
Trends for unattached adults and people in sole-caregiver families are generally moving in the same direction as they are for the general population. However, for certain family types, particularly when they are female-led, remain at very high risk compared to the general population across many indicators of multi-dimensional poverty. In contrast, couples with children are frequently at lower risk than the general population.
| Indicator | Overall | Unattached adults (18 to 64 years old) | Sole-caregiver families | Couples with children |
|---|---|---|---|---|
| Deep income poverty (Source: 2018 Canadian Income Survey) |
5.4% | 25.1% (females) 24.9% (males) |
11% (female-led) 7.7% (male-led) |
2.8% |
| Unmet housing needs (Source: 2016 Census) |
12.7% | 20.4% | 27% | 6.9% |
| Unmet health needs (Source: 2014 Canadian Community Health Survey) |
11.2% | 14.0%Footnote 5 | 15.1% | 10.9% |
| Food insecurity (Source: 2017 to 2018 Canadian Community Health Survey) |
8.7% | 12.1% (females)Footnote 6 12% (males)Footnote 7 |
25.1% (female-led) 16.3% (male-led) |
6.7% |
| Relative low income (Source: 2018 Canadian Income Survey) |
12.3% | 28.6% (females) 26.3% (males) |
33.2% (female-led) 14.8% (male-led) |
8.4% |
| Low income entry rate (Source: 2016 to 2017 Longitudinal Administrative Databank) |
4.1% | 6.2% | 9.6% | 3.4% |
| Low income exit rate (Source: 2016 to 2017 Longitudinal Administrative Databank) |
27.9% | 22.3% | 24.6% | 37.0% |
Trends by subpopulation
Disaggregated data is not available on any of the indicators tracked under the Poverty Reduction Strategy for Indigenous people living on a reserve or LGBTQ2S individuals. A limited amount of data is available on immigrants, Indigenous people living off reserve, persons with disabilities, and racialized populations.
As shown in the table below, the available data indicates that these subpopulations, as well as women are at higher risk of living in multi-dimensional poverty than the general population.
| Indicator | Overall | Women | Recent immigrants (landed <10 years) | Indigenous people (living off reserve) | Persons with disabilities | Racialized populations |
|---|---|---|---|---|---|---|
| Deep income poverty (Source: 2018 Canadian Income Survey) |
5.4% | 5.2% | 10.6% | 11.6% | 8.1% | Not available |
| Unmet housing needs (Source: 2016 Census) |
12.7% | 28.0% (female-led households) | 23.5% (Recent immigrant-led households) |
18.3% (Indigenous-led households) |
Not available | 20.1% (Racialized-led households) |
| Unmet health needs (Source: 2014 Canadian Community Health Survey) |
11.2% | 12.4% | 11.3% | Not available | Not available | 11.5% |
| Food insecurity (Source: 2017 to 2018 Canadian Community Health Survey) |
8.7% | 9.2% | 12% | 22.8% | Not available | 10.3% |
| Median hourly wage (Source: 2019 Labour Force Survey) |
$24.04 | $22.00 | $20.00 | $25.53 | Not available | Not available |
| Relative low income (Source: 2018 Canadian Income Survey) |
12.3% | 12.8% | 20.1% | 20.1% | 20.2% | Not available |
| Bottom 40% income share (Source: 2018 Canadian Income Survey)Footnote 8 |
40% | 41.1% | 55.4% | 46.9% | 51.1% | Not available |
Aspirational data
While they provide important information about multi-dimensional poverty, from our point of view, the dashboard could be adapted to present a more holistic picture of the experience of poverty in Canada. In particular, we believe that indicators of children's well-being, mental health, social inclusion, and security and violence would help strengthen the existing dashboard. Currently, there is a limited data available to report on these dimensions of poverty. However, we have identified a few data sources and indicators that provide some important information about how Canadians are doing in these areas.
We recommend that data for these indicators be collected regularly by Statistics Canada, and be added to the dashboard of indicators tracked under the poverty reduction strategy on the Dimensions of Poverty Hub.
Indicators for Indigenous people
Given that Indigenous people experience poverty in different and unique ways, we also want to highlight the importance of co-developing Indigenous indicators of poverty, as committed to in the Poverty Reduction Strategy. Without consistent information on the experience of poverty in diverse Indigenous communities, Indigenous leaders and governments face challenges in making evidence-informed policy decisions for poverty reduction. Moreover, the current classification of Indigenous people as "First Nations, Inuit and Métis" does not represent the reality of the different communities. It is also important to reiterate that most Statistics Canada surveys do not collect information on Indigenous people living on a reserve and so available statistics, including under Canada's Official Poverty Line, do not capture the experiences of a large proportion of Indigenous people in Canada.
Chapter 5 – Covid-19: Marginalized populations and Canada's response
The COVID-19 pandemic continues to unfold, and the Government's response continues to evolve. The full effects of the crisis on Canadians living in poverty, including how it will affect poverty rates and Canada's efforts towards meeting its poverty reduction goals, will not be known for some time. As such, this chapter is not meant to be an exhaustive discussion of the impact of COVID-19 on marginalized populations and Canada's response. It is meant to:
- briefly discuss the realities that the pandemic has had a disproportionate impact on those populations
- capture our experiences with the pandemic as stakeholders, practitioners, academics and service providers
- highlight the need for data to properly measure disparities and outcomes
- look at key lessons learned from the Government's response
Crowdsourcing data from a Statistics Canada Survey on the impact of COVID-19 on Canadians in May and June 2020 suggests that the difficulty of meeting financial obligations or essential needs has risen to a greater extent among Indigenous participants than among non-Indigenous participants.
Impact on marginalized Canadians
Available data and our experiences in the field indicate that the pandemic has affected all Canadians, but not equally. We have seen that the pandemic has exacerbated many of the challenges marginalized populations were already facing and that they have borne the brunt of its negative health, well-being and financial impacts.
Populations living in or near poverty face disproportionate negative financial and health impacts
Overall, populations living in or near poverty before the pandemic have been more affected financially by the pandemic. Low wage and precarious workers saw their employment rates drop most severely at the onset of the pandemic. Among those groups for which data was available, women, youth (aged 15 to 24) and recent immigrants were most affected at the onset of the crisis because they are more likely to hold less secure, non-standard jobs in hard-hit industries such as accommodation and food services (Statistics Canada, April 2020 Labour Force Survey). Early data also indicates that the COVID-19 pandemic may negatively affect women with children as they have assumed additional caregiving responsibilities (for example with day care and school closures) and are therefore more likely to work reduced hours or miss work due to these responsibilities.
In addition, racialized individuals, especially South Asian, Arab and Black Canadians, have also been severely impacted by employment losses (Statistics Canada, July 2020 Labour Force Survey). Although employment has rebounded, employment disparities among these groups have persisted (Statistics Canada, August 2020 Labour Force Survey).
There is also evidence that the mental and physical health of low income and marginalized populations have been disproportionately affected by the pandemic. For example, over half of participants with long-term conditions and disabilities have reported that their mental health is worse than before the pandemic (Statistics Canada Crowdsourcing Survey, 2020). In addition, a Statistics Canada study on the impact of COVID-19 on racialized individuals showed that this population has experienced poorer mental health outcomes than white participants during the crisis. In addition, public health agencies in Montréal and Toronto have found that COVID-19 active cases and deaths are more likely to be in low income neighbourhoods; Socio-demographic data from public health authorities in Toronto and Peel indicate that racialized populations are overrepresented in COVID-19 cases.
The closure of in person supports and services disproportionately impacted marginalized people
We heard during engagements that many marginalized Canadians face challenges navigating the existing benefit structure and accessing benefits and services. As front-line service providers, throughout the pandemic, many of us saw first-hand that the sudden closure of most in person supports and services for marginalized Canadians left many people with nowhere to turn to for the essential services upon which they relied. We saw that schools and child care facility closures presented unique challenges for low income families and children. Many low-income families lack access to technology, the internet or other resources to participate in learn-at-home activities. And, we saw that people experiencing homelessness were being pushed to sleep in the streets or in tents as shelter capacity was reduced to prevent the spread of COVID-19. It quickly became apparent to us that the closure of in-person supports and services disproportionately impacted marginalized populations, although it remains to be seen what the long-term impacts of these closures may be.
What we need to know about the impact on marginalized Canadians
Although it is clear that the COVID-19 pandemic has disproportionately impacted marginalized Canadians and amplified challenges faced by those living in poverty, there is still a lot that we do not know. As the crisis continues to evolve, there is a need for additional data and information to properly measure disparities and outcomes related to COVID-19. The collection of race-based and otherwise disaggregated COVID-19 case data by several provinces and public health authorities is a promising start. So is the addition of questions about visible minority status to the Statistics Canada's Labour Force Survey. However, to better understand who is most vulnerable to COVID-19, socio-demographic and race-based data should be collected across all jurisdictions. National surveys should collect information to allow decision-makers to better understand the differential impacts of COVID-19 on diverse populations.
Federal government response for marginalized Canadians
The Government of Canada responded quickly to mitigate the economic impacts of closing most non-essential businesses with a suite of measures aimed at protecting Canadians who were unable to work due to COVID-19. Among all of the federal investments made in response to COVID-19, the Canadian Emergency Response Benefit (CERB) was the largest COVID-19 emergency support directed toward individuals and families. It provides an income replacement ($2,000 over a 4-week period, initially for a maximum of 16 weeks, then extended twice for an additional 12 weeks) to employed, recently laid off and self-employed individuals who were directly affected by COVID-19.
Through the CERB, the Government of Canada was able to distribute funds to a large number of unemployed individuals in a short time frame. As of mid-September 2020, applications from 8.8 million applicants had been received and processed. This was achieved in large part because the application process was kept simple to make the benefit low-barrier and easy to access.
The introduction of the CERB raised questions about the adequacy of current benefits. The CERB was developed in part because many people who found themselves unemployed or unable to work as a result of the pandemic would not have been eligible for Employment Insurance. This speaks to an increasing misalignment between federal programming and the type of employment that many Canadians find themselves in (for example part-time, contract or temporary positions). The Government acknowledged this in the 2020 Speech from the Throne, in which it was stated that "the pandemic has shown that Canada needs an Employment Insurance system for the 21st century, including for the self-employed and those in the gig economy."
Moreover, although the flat monthly rate of $2,000 provided through the CERB was just enough to keep most individuals and families from falling below Canada's Official Poverty Line (see Appendix C), it is more generous than what many claimants would receive on EI, provincial and territorial social assistance programs and disability benefits. This raises serious questions about the adequacy of current benefits for some of Canada's most marginalized populations.
It is also notable that government funding for the middle class came largely through direct payments to individuals (the CERB) and that support for businesses was provided largely through a direct wage subsidy. However, support for marginalized Canadians was withheld from them and instead provided to organizations who support them. This continues to perpetuate a perception of blame and mistrust of the poor and takes away choice and control from marginalized individuals. It also left many low income people with nowhere to turn when frontline service organizations were forced to close.
Lessons learned for promoting recovery
Not only has the pandemic pushed governments to react quickly to support individuals affected by it, it has prompted us to think about how existing social security nets serve marginalized populations. The collective experience of the pandemic presents an opportunity for all Canadians to rethink how to better support marginalized populations and to identify ways of creating more supportive environments to prevent poverty in the first place. The initial government response to COVID-19 created the sense that all Canadians were in the crisis together. Most importantly, it included broad, low-barrier supports. As a council, we believe that it is important the Government continue to provide low-barrier support to all Canadians. We need to avoid returning to the type of supports that further marginalize some.
The pandemic has created an environment for change. Rather than simply returning to the pre-pandemic status quo, we can instead develop a more equal, healthy, purposeful and resilient society. This would involve collecting data to better understand how COVID-19 is impacting disparities and outcomes among diverse populations. And it would require building more responsive systems that include targeted policies for at-risk populations and are at a level that is sufficient to keep people out of poverty, allowing for greater autonomy, dignity and an opportunity for all.
Chapter 6 – Conclusion and recommendations
The Government of Canada's Poverty Reduction Strategy has set an overall target of reducing poverty by 20% by 2020 and by 50% by 2030. The Government is on track to meet its overall goal. Recognizing the multi-dimensional nature of poverty, in addition to these broad targets, the Government has also identified a number of indicators to measure progress towards its poverty reduction goals. As a council, we have been tasked with reporting on the Government's progress and we have been asked to continue a national dialogue on poverty. We also feel compelled to offer some recommendations.
The engagements we undertook were emotional and intense. During the engagements, we heard that more must be done to pull people out of poverty. We also heard that there needs to be strong supports and systems in place to keep individuals and families from falling into poverty in the first place.
Due to disruptions caused by the COVID-19 pandemic and the lack of data disaggregation, the experience of poverty described here does not fully reflect the marginalized groups. We have worked to make sure we reflect their experiences and voices through existing research and statistics to the best of our ability. However, we had a difficulty doing this to our satisfaction because our data sets often did not allow for disaggregation of results for different socio-demographic groups. We will prioritize hearing from a broader range of voices in future engagements. We will also prioritize understanding the full effects of COVID-19 on Canadians living in poverty, including how the crisis will affect poverty rates and Canada's efforts toward meeting its poverty reduction goals.
The data available indicates that progress is being made towards reaching the poverty reduction targets. However, this progress has not been even. Marginalized groups are more likely to experience poverty due to systemic issues, discrimination, racism, anti-Black racism, homophobia and transphobia. More needs to be done to prevent people from experiencing poverty, food insecurity, social exclusion and chronic homelessness. Recent progress toward poverty reduction, including the poverty rate for women falling to lower than the poverty rate for men for the first time in 2018, could be threatened by the impacts of the pandemic.
We heard that poverty is a full-time job for many people and that it strips them of their dignity and the ability to make choices about their own lives. In order to address this, the Government must adopt policy-making that is trauma-informed, creates a sense of trust and safety and provides choice and agency to empower those living in poverty. With this in mind, to meet the needs of the most disadvantaged members of our society and ensure progress towards the Government's target to reduce poverty in Canada by 50% by 2030, we present our main findings and make the following recommendations.
Recommendations
- The federal government's Poverty Reduction Strategy is already showing promising results in meeting Canada's commitment to reduce poverty by 20% by the year 2020. From 2015 to 2018, the overall poverty rate in Canada fell from 14.5% to 11% of people living under Canada's Official Poverty Line. The Government has invested in a number of areas that help to reduce poverty, including current and planned investments in the National Housing Strategy, Reaching Home, the acquisition fund, infrastructure, disability benefits, the Multilateral Early Learning and Child Care Framework and supports for before- and after-school clubs. However, the overall poverty rate, while moving in the right direction, does not tell the whole story. To appreciate the multi-dimensional nature of poverty, one must consider the entire poverty dashboard of indicators. It reveals that progress in certain areas has been slow or non-existent. Rates of food insecurity, unmet housing needs, homelessness, and literacy and numeracy rates indicate a need for immediate action. In this context:
- the Government of Canada should continue with the implementation of the Poverty Reduction Strategy and with its current government-wide investments
- the Government of Canada should focus additional investments in 4 areas where progress is falling behind: food insecurity, housing and homelessness, literacy and numeracy and the poverty gap
- As acknowledged throughout our report and in Opportunity for All – Canada's First Poverty Reduction Strategy, poverty in Indigenous communities is an outcome of colonization and government policies. As a result, the Government of Canada has committed to a nation-to-nation, government-to-government and Inuit-Crown relationship with First Nations, Inuit and Métis. Based on the principles that those commitments were founded on, collaborative work is underway to reduce poverty in Indigenous communities. However, progress remains slow and poverty rates among Indigenous people in urban, rural and remote settings remains very high compared to the general population
- The Government of Canada should take urgent action to support Indigenous leaders to reduce poverty in their communities and to ensure they have all the resources available to support their own people in their own way. We specifically recommend: the co-development of Indigenous indicators of poverty, as committed to in the Poverty Reduction Strategy; the co-development of a range of Indigenous poverty reduction strategies such as distinctions-based housing strategies, as committed to in the National Housing Strategy; and commitments made through the Indigenous early learning and child care agreements
- The data necessary to be able to report on Indigenous people should be made available to report on by our next progress report in 2021
- We heard that the experience of poverty is different for everyone and is influenced by identity, background, past experiences, health, privilege and many other factors. However, data limitations mean that marginalized populations are often uncounted or undercounted for in the Government of Canada statistics. Our assessment and reporting for this report were hampered by our inability to disaggregate data. We saw that many people were excluded or silenced through a failure to collect data, to ask inclusive questions, or to engage with them in program and policy development. The silencing of their voices leaves those who are the most marginalized and underserved out of the conversation
- All Statistics Canada and federal population-based surveys should ask inclusive questions and provide inclusive response options on women and gender equity, Indigenous heritage, immigration/refugee status, race/ethnicity, disability, prior or current institutionalization, sexual orientation and gender identity, to allow for routine disaggregation of data to support better decision making and reporting of poverty disparities
- The Government of Canada should work with stakeholders and communities to ensure that any new survey questions and response options regarding race, gender identity and sexual orientation are inclusive and that the questions reach the populations that are currently not captured
- We heard from individuals with lived expertise of poverty, that discrimination, racism, anti-Black racism and stigma were among the main causes of poverty. Marginalized groups remain at a high risk of living in poverty compared to the general population
- The Government of Canada should incorporate an equity lens when it reviews, develops and implements strategies, policies and programs. It should ensure Canada's poverty reduction efforts work as well for those at the highest risk as for everyone else and meet the unique needs of marginalized populations, including, immigrants, refugees, ethno-cultural and racialized groups, persons with disabilities, LGBTQ2S individuals and people experiencing homelessness. The Government should also use available data to transparently report on the use of the equity lens and the outcomes
- During the pandemic, the Government of Canada moved quickly to fill gaps in the social safety net and to provide direct support to families and individuals. Early data indicates that women, youth, children, less educated workers, recent immigrants, racialized individuals, informal workers who do not have a job with benefits and temporary employees on short-term contracts with no job security have been hardest hit by the economic impacts of the COVID-19 pandemic. There was an emphasis on providing low barrier, broad-based support and with less onerous application processes. At present, there is a unique opportunity to consider the lessons learned from this crisis and to rebuild and recover in such a way that capitalizes on opportunities for a more vibrant, resilient and sustainable economy while improving both the social safety net and proactive initiatives to prevent poverty by creating supportive social environments across the life course
- The Government of Canada should collaborate with the provinces and territories to build on its COVID-19 response and strengthen existing strategies, programs and policies to ensure a coordinated robust social safety net in Canada by collectively providing income support that is at least at the level of Canada's Official Poverty Line
- We recommend that benefits be streamlined and simplified to make them low-barrier, easier to access and easy to tailor to individual needs
Appendices
Appendix A – Glossary of terms
- Assimilation
- Process by which the Government of Canada forced Indigenous people to adopt the beliefs, languages and customs of Canadian society, resulting in the loss of Indigenous language and culture in the process.
- Canada's Official Poverty Line
- See Market Basket Measure.
- Co-development
- Process where 2 or more parties come together to jointly develop or create something.
- Cultural safety
- An approach that considers how social and historical contexts, as well as structural and interpersonal power imbalances, shape interactions and experiences.
- Disaggregated data
- Refers to information that has been summarized and then broken down into component parts or smaller units of data usually to reveal trends, patterns and insights.
- Discrimination
- The unjust or prejudicial treatment of different categories of people, especially on the grounds of race, age, sex, gender identity and sexual orientation.
- Equity lens
- A process of analyzing or diagnosing the impact of the design and implementation of policies on underserved and marginalized individuals and groups, and to identify and potentially eliminate barriers.
- Food insecurity
- The inability to acquire or consume an adequate diet quality or sufficient quantity of food in socially acceptable ways, or the uncertainty that one will be able to do so.
- Food security
- A measure of the availability of healthy food and individuals' ability to access it.
- Gender identity
- Gender identity is a person's subjective experience of their own gender. It is a deep internal feeling of whether they identify as female, male, genderqueer, or anywhere along the gender spectrum. A person's gender identity may be the same as or differ from the sex assigned to them at birth.
- Homophobia
- Irrational fear of or prejudice against individuals who are or perceived to be gay, lesbian, bisexual and other non-heterosexual individuals.
- Inclusion
- Eliminating relational sources of bias by ensuring that identity group status is unrelated to access to resources, creating expectations and opportunities for heterogeneous individuals to establish personalized cross-cutting ties and integrating ideas across boundaries in joint problem solving.
- Indigenous
- Throughout this land, First Peoples represent many communities, languages, traditions, cultures and individuals. We have endeavoured to honor those communities and people by representing them throughout the document in the essence of the words we have chosen. We acknowledge that we could not effectively reference and carry the stories of ALL of this land's First Peoples. The report is limited in using the broad definition of "Indigenous" to capture the unique beauty and nuance of these communities and people.
- Individuals with lived expertise
- People who have experienced or are currently living in poverty and are able to share their knowledge, thoughts and opinions to help inform the development of policies, procedures and programs.
- Intergenerational poverty
- Poverty experienced by several generations of the same family.
- Intersectionality
- The complex, cumulative way in which the effects of multiple forms of discrimination combine, overlap, or intersect especially in the experiences of marginalized individuals or groups.
- LGBTQ2S
- Acronym that stands for lesbian, gay, bisexual, transgender, queer, questioning and 2-spirit people.
- Low Income Measure
- The Low Income Measure defines low income as being below a fixed percentage of income. A household is considered low income if its income is below 50% of median household incomes.
- Marginalized population
- A group of people that are excluded from full participation in society and/or have a feeling of being insignificant or unimportant.
- Market Basket Measure (MBM)
- A measure of low-income based on the cost of a specific basket of goods and services representing a modest, basic standard of living. It includes the costs of food, clothing, footwear, transportation, shelter and other expenses for a reference family of 2 adults aged 25 to 49 and 2 children (aged 9 and 13).
- Multi-dimensional poverty
- A recognition that poverty is not simply a lack of income, but that it includes all of the consequences that come with lacking income, including poor health, unsafe housing conditions and lack of access to food.
- Sexual orientation
- How a person identifies to whom they are sexually and romantically attracted to (for example lesbian, gay, bisexual and heterosexual).
- Social safety net
- A collection of services provided by the state or other institutions to improve the lives of individuals and families experiencing – or at risk of experiencing – poverty.
- Sole-caregiver (or lone-parent) family
- Refers to a parent who is not married and does not have a partner, who is bringing up a child or children.
- Stigma
- Strong feelings of disapproval that most people in a society have about something, especially when this is unfair.
- Systemic barriers
- Policies, practices or procedures that result in some people receiving unequal access or being excluded.
- Transgender
- A term used to describe people whose gender identity does not match with the sex they were assigned at birth. Transgender is also used as an umbrella term and can encompass those who identify as genderqueer, gender fluid and whose gender identities challenge gender norms.
- Transphobia
- Feelings of rage, hate and disapproval toward people who identify as transgender or non-binary. Transphobia can be manifested in numerous ways, such as verbally, emotionally and through physical attacks.
Appendix B – Organisations and stakeholders that attended the engagement sessions
British Columbia
- Conni Bagnall
- Elizabeth Fry Society of Greater Vancouver
- Lookout Housing & Health Society
- Options Community Services Society, Gateway and Parkway Shelters, Safepoint Consumption Site
- Sources Community Resources Society
- CitySpaces Consulting
- Ellendale Treatment Facility (Elizabeth Fry) (Women with Lived Expertise of Poverty)
- City of Surrey Social Planner, City of Abbotsford Homeless Coordinator
- Fraser Regional Aboriginal Friendship Centre Association (FRAFCA)
- Surrey Urban Indigenous Leadership Committee
- Bloom Group
- Downtown Community Court
- Indigenous Community Legal Clinic
- First Call
- MOSAIC
- Urban Core
- JustKids
- First United Church
- Tsow Tun Le Lum Society
Northwest Territories
- Interdepartmental Working Group on Poverty (Department of Justice, Health and Social Services, Northwest Territories Health and Social Services Authority, Education Culture and Employment, Municipal and Community Affairs and Northwest Territories Housing Corporation)
- Premier
- Minister of Education, Culture and Employment
- Minister of Health and Social Services; Persons with Disabilities; Status of Women
- Minister of Municipal and Community Affairs, NWT Housing Corporation, Homelessness
- Native Women's Association
Alberta
- Boyle Street Community Drop-In Centre
- End Poverty Edmonton (Bent Arrow, Right at Home, Brentwood Housing, University of Alberta, Indigenous Elders, Multicultural Family Resource Society, City of Edmonton, Edmonton Community Foundation, Hasco Development Corporation, Edmonton Community Development Company, Edmonton Social Planning Council, Boyle Street Community Services, United Way, City Counsellors, MLA)
- C5 Community Hub – Stakeholders (Bent Arrow, Boyle Street Community Services, Edmonton Mennonite Centre for Newcomers, Norwood Child & Family Resource Centre, Terra Centre for Teen Parents)
Saskatchewan
- Homeward Bound and Kindred Spirit
- Lighthouse Supported Living
- Friendship Inn
Manitoba
- United Way Winnipeg
- Winnipeg Poverty Reduction Council
- Employer Consortium
- Winnipeg Harvest
- Main Street Project
- Build and Social Enterprise Centre
- Westside Children's Resource Centre
- Merchant's Corner
- Aboriginal Youth Opportunities
- City of Winnipeg
- Social Planning Council
- SEED Winnipeg Inc.
- University of Manitoba (student)
- Make Poverty History Manitoba
- Aboriginal Council of Winnipeg
- Lived Experience Circle
- Food Matters Manitoba
- Government of Manitoba
Appendix C – Estimated monthly disposable income for families receiving the CERB compared to thresholds under Canada's Official Poverty Line
| Estimated monthly disposable income for families receiving the CERB compared to threshold under Canada's Official Poverty Line | Unattached individual living in Toronto, Ontario with an annual income of $20,000 | Sole-caregiver with 1 child under 6 years old living in Halifax, Nova Scotia with an annual income of $25,000 | Couple with 2 children aged 8 and 12 living in rural Manitoba with an annual income of $35,000 |
|---|---|---|---|
| Estimated income replacement from CERB after tax | ~$1,700/month | ~$1,700/month | ~$3,400/month |
| Estimated benefits (Canada Child Benefit, GST/HST, Canada Workers Benefit and provincial benefits) | $125.31/month | $729.33/month | $536.35/month |
| Estimated monthly disposable income | $1,825.30/month | $2,429.33/month | $3,936.35/month |
| Threshold under Canada's Official Poverty Line (2018) | $1,753/month | $2,228/month | $3,008/month |
Appendix D – Surveys
Please note: The following populations are usually excluded from most Statistics Canada surveys: LGBTQ2S individuals, youth who have aged out of foster care, individuals recently out of prison, people experiencing homelessness and non-status immigrants.
Canadian Community Health Survey (CCHS)
Survey information
Target population: People 12 years of age and over in all provinces and territories.
Excluded groups: Persons living on reserves and other Indigenous settlements in the provinces, full-time members of the Canadian Forces, the institutionalized population and households in extremely remote areas with very low population density.
Frequency: Yearly.
Years available: 2018, 2017, […], 2001.
Disaggregation
Sample size: 130,000 individuals (120,000 aged 18+ and 10,000 aged 12 to 17).
Characteristics: Sex, age, living arrangement, Indigenous status, immigration status and disabilities.
Canadian Income Survey (CIS)
Survey information
Target population: People in all provinces and territories.
Excluded groups: Persons living on reserves and other Indigenous settlements in the province, the institutionalized population and households in extremely remote areas with very low population density.
Frequency: Yearly.
Years available: 2018, 2017, […], 2012.
Disaggregation
Sample size: 56,000 households.
Characteristics: Sex, age, economic family type, Indigenous status, immigrations status and disabilities.
Census of Population
Survey information
Target population: Entire Canadian population (including Canadian citizens, landed immigrants and non-permanent residents and their families living with them in Canada).
Excluded groups: Foreign residents and homeless individuals.
Frequency: Every 5 years.
Years available: 2016, 2011, 2006, 2001,…
Disaggregation
Sample size: 14.1 million households in 2016.
Characteristics: Sex, age, census family, Indigenous status, immigration status, race and disabilities.
Labour Force Survey (LFS)
Survey information
Target population: People 15 years of age and over in all provinces and territories.
Excluded groups: Persons living on reserves and other Indigenous settlements in the provinces, full-time members of the Canadian Forces, the institutionalized population and households in extremely remote areas with very low population density.
Frequency: Monthly and yearly.
Years available: 2019, 2018, […], 1976.
Disaggregation
Sample size: Up to 56,000 households per month.
Characteristics: Sex, age, Indigenous status, Immigration status and race (since 2020).
Longitudinal Administrative Databank (LAD)
Information
Target population: Individuals who filed a federal tax return.
Excluded groups: Individuals not filing a tax return.
Frequency: Annual.
Years available: 2016 to 2017, 2015 to 2014, […], 1992 to 1993.
Disaggregation
Sample size: Around 75% of Canadian tax filers.
Characteristics: Sex, age and immigration status.
Point-in-Time Count (PiT)
Survey information
Target population: Homeless individuals in shelters or on the street.
Excluded groups: Individuals experiencing hidden homelessness (who access accommodation but have no immediate prospect of permanent or stable housing).
Frequency: Yearly, depending on communities.
Program on International Student Assessment (PISA)
Survey information
Target population: Students who were 15 years of age and attending any form of schooling in the 10 provinces.
Excluded groups: Schools on reserves and schools for which it would be infeasible to administer the survey (such as home schooling and special needs schools).
Frequency: 3 years.
Years available: 2018, 2015, […], 2003.
Survey of Financial Security (SFS)
Survey information
Target population: Families across the 10 provinces.
Excluded groups: Families in the territories, those living on reserves or other Indigenous settlements, official representatives from foreign countries living in Canada and their families, members of religious and other communal colonies, members of the Canadian Forces living in military bases, people living in residences for senior citizens and institutionalized individuals.
Frequency: 3 years.