
Transforming our Systems: the 2022 Report of the National Advisory Council on Poverty
From: National Advisory Council on Poverty
Alternate formats

Large print, braille, MP3 (audio), e-text and DAISY formats are available on demand by ordering online or calling 1 800 O-Canada (1-800-622-6232). If you use a teletypewriter (TTY), call 1-800-926-9105.
List of tables
- 5.2 Table: Poverty rate reduction by jurisdiction, 2019 and 2020
- 5.3 Table: Number of people in poverty and corresponding poverty rate by demographic group, 2019 and 2020
- 5.6 Table: Poverty rate reduction by demographic group, 2015, 2019 and 2020
- 5.6.a. Table: Poverty rate reduction by demographic group, 2015, 2019 and 2020 – Dimension: Sex
- 5.6.b. Table: Poverty rate reduction by demographic group, 2015, 2019 and 2020 – Dimension: Age
- 5.6.c. Table: Poverty rate reduction by demographic group, 2015, 2019 and 2020 – Dimension: Economic family type
- 5.6.d. Table: Poverty rate reduction by demographic group, 2015, 2019 and 2020 – Dimension: Disability type (aged 16 to 65)
- 5.6.e. Table: Poverty rate reduction by demographic group, 2015, 2019 and 2020 – Dimension: Immigrants – years since landed (aged 25 to 64)
- 5.6.f. Table: Poverty rate reduction by demographic group, 2015, 2019 and 2020 – Dimension: Indigenous identity (aged 16+) (off-reserve and outside the territories)
- 5.7 Table: Poverty rates among racialized people by sex, 2020
- 5.8 Table: Poverty rates among racialized people by age, 2020
- 5.9 Table: Number and percentage in poverty by race, 2020
- 5.10 Table: Poverty rates among recent immigrants (aged 25 to 64), 2020
- 5.11 Table: Deep poverty among people with disabilities (aged 16+), 2020
- 5.12 Table: Highest and lowest annual welfare income among provinces and gaps with respect to Market Basket Measure thresholds and Deep Income Poverty Thresholds, 2020
- 5.13 Table: Poverty rates by economic family type and sex, 2020
- 5.14 Table: Poverty rates by economic family type and sex for racialized individuals, 2020
- 5.15 Table: Child poverty rates by age for all children, 2020
- 5.16 Table: Child poverty rates by age for racialized children, 2020
- D.1 Table: Summary of multi-dimensional poverty indicator trends – Dignity
- D.2 Table: Summary of multi-dimensional poverty indicator trends – Opportunity and inclusion
- D.3 Table: Summary of multi-dimensional poverty indicator trends – Resilience and security
- D.4 Table: Labour market indicators by immigration status and sex (aged 25 to 54), 2021
- D.5 Table: Labour market indicators for landed immigrants by educational attainment (aged 25 to 54), 2021
- D.6 Table: Labour market indicators for those born in Canada by educational attainment (aged 25 to 54), 2021
- D.7 Table: Labour market indicators by Indigenous status and educational attainment (aged 25 to 54), 2021
- D.8 Table: Labour force characteristics by visible minority group, three-month moving averages, monthly, unadjusted for seasonality (aged 25 to 54), 2021
Message from the Chair
It is once again my honour and pleasure to present the National Advisory Council on Poverty’s 2022 report on the progress of Opportunity for All – Canada’s First Poverty Reduction Strategy.
This year the Council sought out deep conversations on a wide range of issues. We hosted 7 conversations with more than 1,000 people across the country about the underlying and overlapping causes and impacts of poverty. We then hosted a series of 8 small group sessions where people with lived expertise of poverty could share their personal stories. We heard about the struggle, resilience, frustration, and perseverance that is poverty in Canada. Those conversations and the insights that the participants shared are the foundation of this report.
This year we collectively talked about all things poverty. This included the reality of inadequate benefits that are hard to access; our shredded social safety net; troubling transitions through systems; underpaid employment and challenges with system navigation.
These conversations stressed the need for affordable and accessible child care, housing and food; secure work, a living wage, adequate benefits, and access to mental health services.
We talked about structural challenges, including deep discrimination within systems and beneath broader society, structural violence, gender discrimination and health inequity.
This included conversations about the need to ensure that community emergency planning for things like pandemics, climate change and conflict is centred on those made most marginal.
We discussed exclusion, missed or stolen opportunities and the loss of hope that living in poverty can lead to.
We heard about the constant search for stability, safety and security; the slippery slope that injury, illness, or addiction can have; the frustration of not being able to access supports early when things are clearly not working. We heard about the importance of prevention to support people before they are in crisis.
There was a sense that people are constantly being blamed or punished for being poor. Then they feel ashamed for trying to change their circumstances—whether asking for help, receiving help or leaving help.
Overall we spoke about the systems underpinning our social safety net. We heard that they are antiquated, challenging to navigate, racist and in many cases ineffective. They are also complex, interconnected and woven deeply into our culture. This means that changing one system will require re-examining them all, including our own perceptions and values. This feels big and overwhelming but can and must be done.
To start making these necessary changes, we must ask ourselves as a society why we accept that some of our fellow Canadians must live in poverty. Shouldn’t we instead strive for the best version of Canada, where not one of us lives in poverty, where we all live with dignity, equity, and opportunity?
Sincerely,
Scott MacAfee
Executive summary
In our first 2 annual reports, we have sought to better understand the systems that make up Canada’s social safety net and the role they play in creating, sustaining and perpetuating poverty. This year, we are taking that understanding to look for concrete ways to transform the social safety net and build a more equitable, just and poverty-free country.
This is an extraordinary year. For the first time, we have low-income statistics from year one of the pandemic. This data allows us to better understand the impact of the pandemic on incomes and other indicators of poverty. It provides us with an opportunity to understand the impact and outcome of the significant investments made to mitigate the impact of the pandemic.
According to data from the Canadian Income Survey (CIS), the overall poverty rate, as measured by Canada’s Official Poverty Line (the Market Basket Measure or MBM), fell from 14.5% in 2015 to 10.3% in 2019 and 6.4% in 2020. This means that Canada has met both its interim target of reducing poverty by 20% by 2020, relative to 2015 levels, and of reducing poverty by 50% by 2030, 10 years ahead of time. However, as the report shows, the full story of poverty in Canada is more nuanced.
In 2020 and 2021, the Government of Canada spent billions of dollars on new and existing programs to support Canadians affected by the pandemic. Many of these measures were temporary and focussed on income replacement for individuals who were not able to work because of individual COVID-19 health impacts or the related public health measures.
We know that the pandemic did not impact everyone equally. Groups made most marginal were more likely to face adverse health and economic impacts. The pandemic is not over and we still have yet to see its long-term affects. As the Government of Canada continues to phase out emergency supports, populations made most marginal will face renewed precarity amid rising inflation, the high cost of living and long-term impacts of the pandemic—such as long COVID and increased rates of disability, mental health problems, and delays in the education and development of children and youth.
Throughout our engagement sessions we heard again about the challenges facing many people and families, including inadequate income (benefits/supports and employment income); difficulty accessing benefits and supports; and racism and discrimination that permeate our systems and broader society.
We have decided that in this report it is important to reiterate some of our previous recommendations. We feel strongly that the recommendations we have made in our first 2 reports will not only help the Government of Canada reach its overall poverty reduction goals, but that they will also help to build a more equitable and just society. Our recommendations seek to not just move people above Canada’s Official Poverty Line, but to create a society where all people are supported before they are in crisis, and to build an environment where people can thrive, not merely survive. We also did not shy away from recommendations that require bold, systemic change. Some of our recommendations will require creative solutions or new ways of doing things. We recognize that, but believe they are too important to ignore.
1. Poverty reduction with First Nations, Inuit and Métis people
We recommend that:
- the Government of Canada take urgent action to implement the calls to action of the Truth and Reconciliation Commission and the calls for justice from Reclaiming Power: The Final Report of the National Inquiry into Missing and Murdered Indigenous Women and Girls
- the Government of Canada re-commit to co-development of any new and existing poverty reduction measures
- the Government of Canada continue to work with First Nations, Inuit and Métis people to improve data collection to allow for the evaluation of poverty reduction investments and supports for Indigenous people. In particular, this can help to provide a baseline to evaluate new measures, including Bill C-92, An Act respecting First Nations, Inuit and Métis children, youth and families
2. Establish an income floor above the Official Poverty Line
- The Government of Canada work with the provinces and territories to establish, by 2030, an income floor above Canada’s Official Poverty Line, whether it be through employment income, income supports including social assistance, new or existing targeted supports, or a combination of the 3
We also recommend that:
- the Government of Canada lead by example by working to establish a living wage in all federally regulated work places by 2030
- the Government of Canada introduce worker protections through the Canada Labour Code to address precarious work
- the Government of Canada accelerate and expand existing work on targeted benefits and supports for populations with disproportionately high rates of poverty. For example, the Government of Canada should accelerate work on the Canada Disability Benefit and ensure it provides income and employment supports that prevent persons with disabilities from falling below Canada’s Official Poverty Line. The Government of Canada should also consider targeted supports for other high-risk and underserved populations, for example, youth from care
- the Government of Canada strengthen existing and new benefits and supports that provide assistance with and improve housing, food security, health and mental health, employment and skills training, and other indicators of poverty beyond income. Both income and non-income supports have an essential role to play in sustainable poverty reduction and improved quality of life
3. Reduce poverty by at least 50% by 2030 for populations made most marginal
- The Government of Canada commit to reducing poverty by at least 50% by 2030 for all populations made most marginal
To this end, we recommend:
- the Government of Canada commit to developing and resourcing a plan to reduce current inequalities in poverty
- the Government of Canada accelerate the collection, analysis, application of and access to disaggregated data for all populations made most marginal to support evidence-based decision making and reporting of disparities. For example, Statistics Canada should accelerate work to introduce inclusive gender and sex questions and response options to key data sources on socioeconomic conditions, such as the Labour Force Survey and Canadian Income Survey
4. Early intervention and prevention of child and youth poverty
- The Government of Canada identify children and youth most at risk of the intergenerational impacts of poverty and address these impacts through benefits and programs focused on early intervention and prevention
Drawing on the recommendations for Canada of the United Nations Committee on the Rights of the Child, the Council endorses that:
- the Government of Canada establish an independent National Commissioner for Children and Youth. The role of the Commissioner would be to focus on children and youth who are made most marginal. Their role could include:
- identifying which children and youth are most at risk of poverty and why they are at risk
- bringing the voice of those with lived expertise in poverty to the design and development of supports and services for children and youth
- ensuring that the rights of children and youth are considered and protected in all federal policies, services, laws and practices
- examining some of the structures that are placing children and youth at high risk
5. Increase awareness of, access to and availability of government benefits and supports
- The Government of Canada increase awareness of, access to and availability of government benefits and supports as an essential tool in poverty reduction. The Government of Canada should also increase investments in sustained core funding for non-profit and community-based organizations that support Canadians living with low incomes, including those that (could) serve as systems navigators for individuals and families trying to access government benefits and supports
We also recommend that:
- the Government of Canada increase the incidence of tax filing through automatic tax filing for Canadians with low incomes, followed by implementation of automatic enrolment in other benefits and programs, particularly those that are income-tested
- the Government of Canada put people with lived expertise of poverty at the centre of design, implementation and evaluation of its policies, programs and services. Populations made most marginal should be included in the development, design and review of supports that meet their specific challenges and needs
Chapter 1 – Introduction
Transforming our Systems: The 2022 Report of the National Advisory Council on Poverty meets our mandate commitments by providing:
- an update on Canada’s progress toward meeting its poverty reduction targets
- recommendations that could help the Government of Canada continue its progress toward reaching its poverty reduction targets
Transforming our Systems builds on our previous reports, Building Understanding: The First Report of the National Advisory Councilon Poverty and Understanding Systems: The 2021 Report of the National Advisory Council . In Building Understanding, we examined the complex nature of poverty in Canada. Understanding Systems looked at the factors and structures that keep people in poverty. To provide recommendations for an inclusive, resilient and sustainable path forward, this third report examines:
- progress towards implementing the recommendations from our first 2 reports
- what has helped us reach our poverty reduction targets
- what it will take to maintain this progress
- who has been left behind in this process
A note on poverty rate estimates
As is customary with the Canadian Income Survey (CIS) and other household surveys, when revised population estimates become available following post-census coverage studies, survey weights are updated retroactively to better reflect overall population counts. This was the case with the 2020 CIS release, which also published revised poverty estimates for years prior to 2020. As a result, the CIS poverty estimates for years 2015 to 2019 referenced in this report will be slightly different from those referenced in previous reports.
Progress on poverty reduction
Meeting the 2030 poverty reduction targets
The first 2 annual reports of the National Advisory Council on Poverty noted that by 2019 Canada had met and passed its interim aim of a 20% reduction in poverty by 2020 but that progress in poverty reduction had not been equitable. The release of the 2020 Canadian Income Survey (CIS) data shows that there was a further drop in poverty rates during the first year of the pandemic. According to the data, the overall poverty rate, as measured by Canada’s Official Poverty Line, fell from 10.3% in 2019 to 6.4% in 2020. This means that by 2020 Canada met its target of reducing poverty by 50% by 2030, 10 years ahead of time. However, the full story of poverty in Canada is more nuanced. Inequities in poverty reduction continue and meeting poverty reduction targets does not mean that poverty reduction will be maintained.
In 2020, the Government of Canada spent billions of dollars on new and existing programs to support Canadians affected by the pandemic. Many of these measures, such as the Canada Emergency Response Benefit (CERB), were temporary. As governments move to phase out emergency supports, some groups will face renewed precarity. New pressures such as the longer-term impacts of the pandemic, growing income and social inequality and issues of affordability may also impact poverty rates in the years to come.
Groups made most marginal
Throughout this report, we refer to a number of populations that are underserved, overlooked and that face high levels of discrimination, racism and stigma. When we refer to groups made most marginal, these are the people to whom we are referring, including:
- First Nations, Inuit and Métis people
- immigrants
- refugees
- women
- children and youth in care
- people with disabilities
- 2SLGTBQ people
- people who:
- are experiencing homelessness
- are living in institutions
- are involved in the criminal justice system
- are living in remote areas
- identify as members of ethno-cultural groups, Black and other racialized communities
While the numbers are important, they do not tell the whole story. We must also understand poverty through the narratives and testimonies of those experiencing it. Our previous reports stressed the importance of targeting poverty reduction efforts to those “furthest behind first.” This is in line with Canada’s commitment to the United Nations’ 2030 Agenda for Sustainable Development. We must continue to listen to the voices of those living in poverty. Our efforts should address those most impacted, including those who have multiple marginalized identities and children and youth suffering from intergenerational poverty and trauma. We must also address the legacy of colonialism, racism, ableism, sexism, homophobia, transphobia and all other forms of discrimination and stigma.
Reaching Canada’s poverty targets means reaching them for everyone, but especially those made most marginal by our society. Finally, it is crucial that Canada’s poverty reduction efforts are sustainable.
Discrimination
Throughout the report, when we reference discrimination, we are talking about the unjust or prejudicial treatment of different categories of people. We are referring to all forms of discrimination: sex, age, gender identity or expression, sexual orientation, race or ethnicity, immigration status or place of origin, family status or composition, disability, institutionalization, and exposure to violence.
Progress on recommendations
Summary of past recommendations
Recommendations from Building Understanding: The First Report of the National Advisory Council on Poverty
- Continued poverty reduction efforts and investments, as well as increased funding in 4 key areas: food insecurity, housing and homelessness, literacy and numeracy, and the poverty gap
- Urgent action to tackle Indigenous poverty with more specific measures
- Increased data disaggregation to better account for and give a voice to marginalized populations
- Applying an equity lens in policy-making
- Streamlining and coordination of benefits and bringing a level of support that is at least at Canada’s Official Poverty Line
Recommendations from Understanding Systems: The 2021 Report of the National Advisory Council on Poverty
- Indigenous prosperity through truth, reconciliation and renewed relationships. (Implementing the calls to action from both the Truth and Reconciliation Commission of Canada and Reclaiming Power and Place: The Final Report of the National Inquiry into Missing and Murdered Indigenous Women and Girls)
- Building equity through programs, supports and benefits. (Inclusive data collection and commit to reducing poverty by 50% by 2030 for marginalized populations)
- Dignity through enhanced access and improved service design and provision. (Simplify the delivery of programs and supports for all people)
- Develop robust systems and structures focused on early intervention and poverty prevention
- Employment income and income support. (Ensure a coordinated and robust social safety net in Canada by collectively providing income support that is at least at the level of Canada's Official Poverty Line)
The full recommendations from Building Understanding and Understanding Systems can be found in Appendix A.
Progress on Government of Canada’s commitments and investments
Since Understanding Systems was released, the Government of Canada has made a number of investments that we expect will have an impact on poverty reduction, including:
- reaching agreements with all 13 provinces and territories and with First Nations, Inuit and Métis communities to build an affordable Canada-wide early learning and child care system
- increasing the length of Employment Insurance (EI) sickness benefits from 15 to 26 weeks, as of summer 2022, to better support those with longer-term illness (Department of Finance Canada, 2022)
- expanding the Canada Workers Benefit to support one million more low-income workers (Department of Finance Canada, 2021)
- increasing regular Old Age Security (OAS) payments for pensioners aged 75 and older by 10% as of July 2022 (Employment and Social Development Canada, 2021)
In addition, the Government of Canada has announced a number of commitments in Budget 2022 that will help address poverty. We encourage the Government of Canada to implement the following measures as quickly as possible:
- increase funding for affordable housing through Reaching Home, the Rapid Housing Initiative, the National Housing Co-Investment Fund, and other initiatives to help address housing and homelessness issues
- increase funding to support the implementation of An Act respecting First Nations, Inuit and Métis children, youth and families to address disparities in the child and family services system
- create a national dental care program for low-income Canadians, with coverage for children under 12 years of age starting in late 2022, to address a gap in services for low-income Canadians
- create a new anti-racism strategy and national action plan on combatting hate to ensure Black and racialized Canadians and religious minorities can fully participate in the Canadian economy
- develop a national school food policy to address food insecurity among children (Department of Finance Canada, 2022)
A more complete list of Government of Canada commitments and investments can be found in Appendix B.
Progress made on data collection and surveys
Since Understanding Systems was released, the Government of Canada has made progress on the collection of disaggregated data to support better decision-making and reporting on poverty. Disaggregated data includes collecting data and creating categories that account for the individual experiences of specific groups.
Last year, Canada became the first country in the world to collect and publish data on gender diversity in its national census. The 2021 Census included a question on gender and added precision to the sex question to allow individuals to indicate their sex “at birth.” These changes follow the introduction of inclusive gender and sex questions on most Statistics Canada health and social surveys in previous years.
As of July 2020, the Labour Force Survey includes a question on racialized status. The 2020 CIS collected and published poverty data for racialized communities for the first time. Taken together, these updates could contribute to better understanding the poverty rates of racialized people in Canada. Collecting data is a good first step. Now the Government of Canada needs to use it to ensure that its poverty reduction efforts promote equity by reaching populations made most marginal.
Statistics Canada and Employment and Social Development Canada continue to collaborate to develop a Northern Market Basket Measure (MBM-N) that will allow official poverty rates to be calculated for Yukon and the Northwest Territories. Work to develop an MBM for Nunavut is also ongoing.
Where progress is still needed
Despite progress in a number of areas where the Council has made recommendations, areas remain where we recommend the Government of Canada act to meet poverty reduction targets more broadly, but also to create a more equitable society. Many people do not have access to secure work with a living wage and portable benefits. The Government of Canada needs to look for ways to prevent precarious work, ensure protections, and help people access benefits without gaps when they need it most—for example, when they lose their job or their benefits, or are suffering from poor mental or physical health. In many cases, benefits remain below Canada’s Official Poverty Line, trapping people in poverty. Additionally, benefits remain difficult to access for many people. We will speak to this further in our recommendations.
Transforming systems
Forging an inclusive and resilient path forward
The benefits of a strong social safety net permeate outwards and ripple through families and communities.
Throughout our engagement sessions for this report, we heard that we must transform our systems, and our society as a whole, if we want to meet our poverty reduction targets and eliminate poverty. The reasons people fall into and remain in poverty are complex and systemic. At the same time, we know what the chronic problems are. Over and over, we heard about drivers of poverty, such as:
- inadequate employment income and income supports
- the growth of precarious work
- rising unaffordability due to inflation
- the ongoing marginalization and vulnerability of groups through discrimination and exclusion
We also heard repeatedly about the lack of effective strategies to prevent poverty:
- a broken social safety net
- inaccessible benefits and supports
- governments and other organizations that do not work together
We heard of differential treatment because of systemic racism, and that some within our systems and the wider public hold prejudiced views about those living in poverty. These beliefs and assumptions strip people of dignity and agency over their lives. They perpetuate the myth that some people are unworthy or undeserving and undermine anti-poverty strategies.
We know that the pandemic has been eye-opening. We learned that no matter who you are or how “safe” you are, poverty is not too far away. Many people who considered themselves fully independent would not have endured without government support. We also quickly saw that the pandemic exacerbated pre-existing inequities, with populations made most marginal more likely to face lost income, risk of serious illness or death, and challenges accessing affordable housing, food and other essential services.
The pandemic responses also showed us that as a country we could do things differently and better. Data shows that increasing eligibility for benefits, providing greater income support and targeting populations made most marginal had a real and positive impact on poverty rates.
The pandemic provided us with a real world, large-scale pilot project of what a more substantial and inclusive social safety net could look like. Of course, this does not mean that no one was left behind. Some of the populations made most marginal could not access adequate supports and fell further behind, as the bulk of supports were available only to those in the labour market. Also, while many people’s incomes went up, other indicators of poverty worsened, such as food and housing insecurity. We must learn from the successes and failures of the last 2 years to rebuild a social safety net that works for everyone.
The true safety net is the communities we build and bring together.
Effective and equitable poverty reduction will require a whole-of-society commitment to rebuild and maintain systems that leave no one behind. People who rely on our existing systems—which were specifically designed to help them—have told us that those systems often hurt them instead. We need to prioritize effective poverty reduction. We need to ensure that we reduce disparities by focusing on those furthest behind. At the same time, poverty does not begin and end with government income benefits. There needs to be cooperation and coordination between all orders of government to ensure that:
- people who are in full-time work are not left in poverty
- people who are receiving benefits are not in poverty
- programs which are set up to prevent people falling into poverty or to help pull people out of poverty work equitably and reach those furthest behind
This requires the active engagement of many groups in Canada, including employers, civil society, community and government.
Chapter 2 – What we heard: Challenges
Background
Engagement to inform the development of this report took part in 2 stages. Between February and April 2022, the National Advisory Council on Poverty held 7 virtual engagement sessions with over 1000 stakeholders, including people with lived expertise in poverty (a full list of Stakeholder groups that participated can be found in Appendix C). These sessions encouraged cross-sectoral conversations on the following topics:
- The future of work: From precarity to security
- From communities, by communities: Grassroots responses to poverty
- The poverty trap, chronic and transient poverty
- Transitions in and out of support systems: poverty prevention, early interventions, and targeted supports
- The future of health and poverty: Building resiliency, equity and justice
- Future-proofing the social safety net
- Climate change and poverty: Addressing vulnerabilities, creating resiliency
Phase 2 was a series of small group conversations with people with lived expertise in poverty. While poverty can affect anyone, we know that certain populations are far more likely to experience vulnerability to poverty, discrimination and exclusion. Often these same voices are missing from official narratives and data. The goal of this year’s engagement sessions was to foster an environment where individuals from diverse backgrounds and communities could share their ideas and experiences while connecting and breaking siloes in poverty reduction. We also made a concerted effort to reach new populations. For the first time, we heard from children and youth about their thoughts on poverty.
These sessions allowed us to speak directly to people with lived expertise in poverty so they could share with us their experiences, challenges and what has worked and not worked for them. These sessions were a key piece of our engagement. Over the last 3 years, we have tried to share the voices, expertise and experiences of some of the individuals made most marginal in our society. We are grateful to them. Their knowledge, expertise and personal circumstances are the backbone of this chapter and are woven throughout the entire report.
When voices are amplified and stories are heard it normalizes the story without desensitizing us […] when people are given their voice and own their story, the community comes around them.
However, we were not able to reach everyone. There are many layers of vulnerability, and we understand that some people are fearful of sharing their story or are unable to do so. We will continue to find ways to include the voices of those made most marginal by our society at the centre of our work. The remainder of the chapter provides a summary of some of the key themes and highlights that emerged from the discussions. The richness and diversity of what we heard is difficult to capture in a concise manner, but we feel it is important to share the stories, experiences and voices of the people with whom we engaged, in their own words. These expressions do not necessarily reflect our own thoughts, feelings or beliefs. In some cases, data backs the opinions we heard. In other cases, there may not be adequate data to support them. Either way, this summary aims to present what we heard in an authentic and honest way.
Complexity and intersectionality
We have tried to capture a vast amount of information and organize it in a meaningful way. However, we believe that it is essential to reflect fully the needs of those in deepest poverty. People with multiple, intersecting vulnerabilities are significantly more likely to be living in poverty with complex needs. Addressing one issue, or parts of an issue, will not be enough. Therefore, while many solutions are offered below, nothing can replace a comprehensive approach that puts people at the centre and addresses their interwoven and complex needs as a whole.
Systemic challenges
There were many significant and specific challenges raised throughout the engagement sessions. Overall, the systemic challenges we heard about fall into 3 main themes:
- inadequate income (benefits/supports and employment income)
- access challenges and barriers to take-up of benefits/supports
- racism and discrimination
We continued to hear that income benefits and employment income fall short of people’s needs. People who rely on government supports are made marginal and left in precarious situations. This is either by design or due to the unintended consequences of their implementation. Vulnerability is built into the system.
People with lived expertise in poverty described their experiences trying to access supports within a tangle of different systems. They described the systems as fragmented, cumbersome and operating in silos. Trying to navigate the systems left them feeling overwhelmed, stripped of their dignity, and dehumanized.
Participants spoke about systems that are built for particular groups and a particular type of person. That person tends to be white, male, heterosexual, cisgender and born in Canada. This means that many people are left to navigate systems that were not built for them. These systems perpetuate discrimination and create challenges for many groups.
We heard clearly that the poverty reduction is a government responsibility first, but not exclusively. Employers, non-profit organizations and people in general all have a role to play, with the government’s leadership.
Income from minimum wage employment and government benefits is not sufficient to lift people out of poverty
Poverty isn’t only about income, but it is always about income.
Income adequacy is the primary issue
The social safety net begins with income stability.
The overarching theme throughout the sessions was income adequacy. Whether it is minimum wage, gig or precarious employment, or government benefits, those who are living in poverty do not have sufficient income. People spoke passionately about the mental weight of not being able to meet their basic needs. Rising prices due to record inflation and housing costs are further straining many individuals and families. This is especially true for those living in poverty or close to it. There is a sense that prices keep going up but wages and social assistance rates do not. People spoke about the stress that this causes and described the situation as “scary.”
Poverty is not a choice. Nobody chooses this. We all want better things for ourselves and for our children.
Income support is a fundamental part of our social safety net in Canada. However, we heard that the support, particularly social assistance, is woefully inadequate. Benefits are not lifting people above poverty, but rather are keeping them there. There was a strong consensus that government benefits should be at or above the poverty line, not below it.
The MBM is not designed for people to thrive.
There is also a sense that the Government of Canada has enough money to solve these problems, but not the will to do it. Many of the necessary support systems exist, but the amount of supports needs to be increased and the systems improved. Participants acknowledged the significant impact of the Canada Child Benefit, but mentioned that they wanted to see programs like it and Employment Insurance (EI) expanded. EI can be difficult to access, as many people do not work a sufficient number of hours to qualify. Many families are forced into poverty while on parental leave, even when receiving EI. We heard the view that supports are inadequate on purpose, to drive people to enter the labour market. However, low-paid work is precarious and does not provide sufficient compensation for meeting basic needs. This type of work also rarely provides benefits, like sick leave, dental and extended health benefits.
The consistent missing link is political will.
First-person experience – Maternity and parental benefits: Starting life in poverty
Many of the participants shared their experiences of accessing maternity and parental benefits. While employees are able to access up to 18 months of parental leave to care for their babies, the reality is that many families living with low incomes are not able to make ends meet on their EI benefits. EI provides a maximum amount of $638 per week (2022). However, only people that have $60,300 of insurable earnings receive this. Someone with $30,000 of insurable earnings would get a maximum of $317 a week (55% of $30,000, on a weekly basis). This is below current poverty thresholds and insufficient to meet a family’s needs. Parents are often forced to choose between continuing to work rather than taking parental leave, and living in poverty. For many families, the first year of a child’s life is therefore a life in poverty.
The social safety net is broken
I now envision the social safety ‘net’ as shredded fishnet stockings.
We heard from participants that the social safety system has not kept up with social, economic and labour market changes. It also intervenes with too little, too late. Instead, the social safety net should empower and support people before they are in crisis. As we have learned from the pandemic, systems also need to be nimble and inclusive to respond to shocks. To do this, however, they also need proper investments. We need to break down siloes to make systems more accessible, seamless and responsive to the complex needs of individuals and families. The social safety net should include every government department and it should allow everyone in society to feel safe.
Work is not always enough to reduce poverty
We can put anyone into a minimum wage job, but it doesn’t get you out of poverty.
Many people work but that doesn’t always provide them the means to survive.
Another consistent theme to emerge from the conversations is that work is no longer a guaranteed pathway out of poverty. Too many people are working in minimum wage jobs, precarious jobs and/or the gig economy. The pandemic exacerbated this situation. Minimum wage is insufficient for people to escape from poverty. Furthermore, low-wage employment— which people living in poverty are likely to get—often does not provide extended benefits, sick days or protections.
When can I afford to be ill or when can I afford to take care of my children?
Without extended benefits, it is hard to be healthy. Also, not having benefits limits the options of parents living in poverty. People reported feeling constantly anxious that they or their children would get sick and they would have to miss work.
Child care and caring for ill or elderly family members, and those with disabilities, can make work out of reach as well. People, particularly women, who are responsible for unpaid care work, often face challenges balancing their care responsibilities with paid employment. Women are often forced out of the labour market for care work. This results in a loss of benefits, loss of income, and can impact EI contributions (affecting insurable earnings). The high cost of care relative to low wages makes staying home more cost effective in many cases. The signing of early learning and child care agreements in all 13 provinces and territories is a promising development on this front.
We need better labour market systems and structures to again make employment a pathway out of poverty.
Clawbacks discourage transitioning to paid work
Clawbacks for people with disabilities can really end up destabilizing someone’s life.
Benefit clawbacks (deductions from or loss of eligibility for one support when receiving another) are a significant concern for many people living on a low income. Clawbacks (real or perceived) of wrap-around and income supports often have the unintended consequence of creating disincentives to work. People often fear the prospect of losing benefits such as social housing when they transition to work.
Stakeholders stressed the need for a social safety net that does not penalize people for working (or trying to work). Participants also noted the significant challenges for people with disabilities, particularly in jurisdictions where they face steep clawbacks of their employment income. This can destabilize their current situation and keep them in or instigate a future in poverty.
If you are getting support and make just a tiny bit of money you will lose the support.
First-person experience – Turning down a promotion: The cost of clawbacks
Clawbacks can take different forms. They can be dollar for dollar reductions of income benefits. They can also mean the loss of supports and services or of social housing.
One person shared the experience of receiving a promotion opportunity at work. The increase in pay would have resulted in earning just above the threshold for social housing. The loss of social housing far outweighed the benefits of the pay raise, so they turned down the promotion.
Unintended consequences can force people to make impossible choices
In addition to clawbacks, rules, eligibility requirements and program interactions can leave people feeling as though they have no choice. They also force people to make impossible choices. Many people shared that they felt as though the system was designed to make them fail. The rules are often complicated, counterintuitive or punitive.
For example, we heard that for certain types of addictions counselling, people are required to not be working while undergoing treatment. When someone finishes their counselling and achieves sobriety, they then face the challenge of unemployment. This can lead to homelessness.
Benefits and services are difficult to access
It’s an incredibly complex set of mismatched tools that governments have put together. It feels like you have to have a PhD to navigate it.
The social safety net is complex and inefficient
The things that are meant to be Canada’s social safety net—government income supports—they are all challenging to access and insufficient and keep people in poverty.
We heard that all of the programs and benefits that make up the social safety net are difficult to access. There are so many different support programs at the federal, provincial/territorial and municipal level, as well as services provided by the non-profit sector. Some of these overlap, but there are also gaps. This makes the system very complex and confusing. People miss out on benefits and supports, often because the system is too difficult to navigate, and they are discouraged.
One misstep and you won’t make it out.
Some of the specific access challenges that we heard include:
- the movement to online service delivery can be a barrier for those who lack computer literacy or cannot afford internet services or a computer (not all websites work with a cell phone)
- long waits for telephone help lines use up people’s limited cell phone minutes while they are waiting on hold
- difficulty finding programs that can help—there are potentially many programs, but the information is too vague or too much and overwhelming
- complicated forms take a long time to complete, and they sometimes require supporting documentation that takes additional time and money to get
- there is a long wait for a response after submitting the application
It’s just mind-blowing how many barriers there are.
In addition to being difficult to navigate, we heard that the current system wastes people’s time and energy. For example, we heard frustration about the government making people submit information that it already has, placing an unnecessary burden on individuals. We also heard that the government often seems too focused on eligibility. Too much money and time is spent making sure trivial abuses of the system do not occur. Meanwhile, people who do need support wind up falling through the cracks. All of that energy should be put into making sure that everyone who is eligible knows that they are eligible, and ensuring they access the supports to which they are entitled. A lot of money is unclaimed because people do not know how to access it. An income support system that leaves people living in poverty is inefficient and ineffective.
Nets are meant to catch or trap people. It’s a full-time job to navigate this so-called safety net. It takes up so much time and energy.
Physical and mental health and dental services are hard to access
Many participants shared their difficulties with accessing health services and described the impacts of this on their overall health and wellbeing. Some spoke about the challenges accessing a primary care provider, especially if they have multiple diagnoses, addictions issues or involvement in the criminal justice system. Others noted the challenges of accessing mental health services. Youth participants talked about the increase in mental health challenges caused by the pandemic and the associated public health measures.
My teeth are falling out of my head and there isn’t anything I can do about it.
Cost is a significant barrier to health services. Often, mental health and counselling services limit people to one free session and many are unable to pay for ongoing care. Dental care is simply unaffordable to many people. Medications are not always covered. One participant shared that they were eligible for a nebulizer for asthma, but not the medication that goes in it.
First-person experience – Failure to heal properly: The impact of an unaffordable healthcare system
While Canada is known for its free medical care, there are significant limits to the care and services that are offered at no cost.
One person with lived expertise in poverty shared the experience of an injury—a broken bone—resulting from violence. They were able to go the emergency room and receive care without any out-of-pocket expenses. However, the injury required follow-up care, including physiotherapy. The follow-up care required out-of-pocket payment and they were not able to pay for it. The injury never properly healed and resulted in chronic pain.
Racism and discrimination are pervasive and our systems replicate and perpetuate inequality
Equity is the process, equality is the outcome.
Racism and discrimination are pervasive in the social safety net
It is a tragedy that young Indigenous families have their children torn away from them not because they’re bad parents, but because they’re in poverty.
We heard that discrimination is built into our systems. Poverty rates are high for groups made most marginal. This demonstrates that the social safety net does not reflect the diversity of needs and does not work for these individuals and families. We also heard that there is a sense that First Nations communities do not have a social safety net.
Staff at many important access points and services lack the awareness and understanding required to work successfully and respectfully with individuals who are made most marginal. We heard this in particular for 2SLGBTQ youth and youth with disabilities. Infantilizing behaviour towards youth limits their input into how their lives or issues are treated. General attitudes towards people with disabilities, trans people and others are a barrier to their inclusion.
There is a lack of focus on mental health and addictions training.
Disaggregated data is essential for understanding the experience of groups made most marginal
The experience of poverty is disproportionately different across groups. Some populations face more disadvantages and challenges, and until recently, their experiences have been left to anecdotal evidence. As a result, previous change efforts did not recognize those disproportionate inequities.
Some participants suggested that poverty rates should be a measure of how municipal and provincial/territorial governments are performing. Disaggregated poverty and homelessness rates should be easily accessible to voters to better inform them and to help build political will.
First Nations, Inuit and Métis people need to be involved in program and policy design
In my community there’s a death every month. A lot of people don’t realize what […] Indigenous communities face.
Access to culturally appropriate services for First Nations, Inuit and Métis communities is a key aspect to delivering support. Applying for government programs is a burden for community-based organizations—often First Nations do not have the human resources capacity to do it. Participants spoke of the need for governments to discuss with First Nations before designing and implementing programs and policies. Often the government designs programs that, despite good intentions, do not reflect realities in First Nations communities—yet communities must adopt them and adapt to them. Instead, funding should be given directly to First Nations to design their own responses. Consideration should be given to creating a specific First Nations, Inuit and Métis poverty reduction strategy.
Some participants stressed that in First Nations, Inuit and Métis communities, colonialism is the cause of poverty. There was no such thing as poverty before colonialism. Traditional economies have been destroyed, putting First Nations, Inuit and Métis people at risk.
I think that we always need to be centering Indigenous nations and Indigenous sovereignty in these issues.
Colonial, western health systems do not serve everyone
First Nations, Inuit and Métis people experience an incredible depth of racism within the healthcare system that strongly deters them from accessing healthcare. When they leave their communities, they fall through the cracks in the healthcare system. To address gaps, we need to look at solutions from Indigenous perspectives. Services could better encompass spiritual and social aspects, not just medical/physical aspects of care.
Healthcare professionals must work to understand cultural differences. Interpretation and translation are often not available in the healthcare system. The root causes of poor health must be examined from the perspective of First Nations, Inuit and Métis people. The impact of colonialism underpins the social and economic marginalization and health inequalities that exist between Indigenous and non-Indigenous people.
Continued impact of the pandemic on youth
In our engagement sessions, many youth spoke about the impact that the pandemic has had on them, including challenges with online schooling. Some youth lacked a stable connection to the internet. Others spoke about different challenges, including:
- lack of connection to peers, including congregating with peers
- inability to ask their teachers questions or to have informal discussions with them after class
- trying to study/learn in overcrowded housing
- parents who were not able to help with homework
Children and youth faced a wide range of challenges. Many children faced disruptions to their development, for example through the closure of schools, extracurricular activities, camps etc. This also means disrupted access to nutrition, child development and health screenings, and a safe adult to speak with if needed. Older youth also spoke about disrupted pathways, as they lost or could not find jobs due to the pandemic (for example, losing income they counted on for school). Others faced challenges with online schooling. They continue to experience mental health challenges, including anxiety and depression. We are into the third year of disruption of both education and of the child wellness and protection systems embedded in the school system.
Poverty can lead to criminalization
Contact with the legal system is not a rare experience. In BC, over a 3 year period, 75% of low-income individuals experienced at least one everyday legal problem (a problem arising out of the normal activities of people's daily lives that has a legal aspect and has a potential legal solution). Consumer problems accounted for 43% of these (Sentis, 2018). Nationally, nearly half of all adults encountered a family or civil justice problem over that same reference period, meaning that almost all Canadians are expected to be confronted with a legal problem during their lifetime.
Poverty affects every aspect of how one experiences being accused and possibly convicted of a criminal offence. This includes the likelihood of being considered as a suspect, interactions with police, making bail (a decision affected by whether someone has a fixed address, is properly documented, has a job, etc.), plea decisions and sentencing.
Lack of representation is a significant issue. Lawyers are expensive and out of reach for many people living in poverty. People living in poverty often plead guilty because the alternative is too difficult for them. Public defenders are paid for a set amount of time and it limits the preparation and defense time for any case. This adds structural pressures to accept plea-bargaining and plea decisions. One woman shared the challenges of accessing legal aid. She noted that if she earned over $1600 dollars a month, she would lose her legal aid and her lawyers who were trying to fight for her life. She could not afford to pay for a lawyer, so she had to be sure to earn less than $1600 to keep her legal aid. At the same time, though, she had to show the court that she was a contributing member of society. Working full-time would improve her chances of demonstrating this.
If I worked to my ability I would lose my representation.
First-person experience – A vicious cycle: Meeting the conditions of a sentence
More than one participant shared with us the realities of trying to navigate the criminal justice system as a person living in poverty. In many cases the court imposes volunteer hours and/or counselling as part of a sentence. However, there are limited volunteer opportunities for someone with a criminal record, and counselling sessions have a fee. For many people living on a low income, this can result in a failure to complete the sentencing requirement, which in turn leads to their incarceration. This is due to poverty, not an individual’s unwillingness to comply.
Intimate partner violence can leave women vulnerable to poverty
Many female victims of domestic violence experience multiple episodes of poverty. Economic abuse in the home (preventing women from having paid employment, and/or controlling the money) has 2 consequences: creating invisible functional poverty for women and preventing women from fleeing the home.
When they do escape, women often remain financially dependent on their abusers, due to their reliance on alimony and child support. Abusers often use the family court system to continue economic and psychological abuse—for example, drawing out the court proceedings and/or withholding alimony and child support. The family court system is failing women, leaving many in poverty.
We also heard about the need for more of other types of supports. For example, there is a lack of female-only shelters in some jurisdictions; many women do not feel comfortable in mixed-gender shelters.
If I am a woman fleeing domestic violence, I don’t want to go into a mixed-gender shelter.
Chapter 3 – What we heard: Possible solutions
The conversations focused on many of the challenges caused by benefits and services that are inadequate and difficult to access. However, there were also significant discussions around the systems changes needed to address poverty in a meaningful way, especially for those who have been made most marginal.
System change is required to address poverty and challenges caused by unaffordability
We can’t make progress on any of these issues without making progress on all of these issues.
Provide income above the poverty line
There were many discussions about ways to achieve an income floor above the poverty line, below which no one could fall—whether they are working, receiving benefits, or both. Some suggestions include:
- expanding existing benefits and supports (for example: Canada Child Benefit, Canada Workers Benefit, Old Age Security, Guaranteed Income Supplement)
- a universal basic income
- a negative income tax model (a system which reverses the direction in which tax is paid for incomes below a certain level)
- a combination of both a living wage (from employment) and a basic income (government-provided support)
The idea that you can buy one less coffee in a month and you will get out of poverty is f*cking bullsh*t.
Universal basic income meets basic needs and allows people to participate in the labour force to the extent that they are able
What if we made sure everyone had enough to live well?
Participants noted that a universal basic income would help alleviate many of the existing system challenges, including:
- difficulties accessing EI
- needing to take time off from paid work to upgrade skills
- loss of benefits when leaving social assistance for employment
In addition, a guaranteed basic income would allow individuals to participate in the labour force to the extent of their ability. This would in turn free up funding and resources to devote to people with more complex needs.
Everyone wants to contribute. Nobody wants to feel like a burden.
A living wage is key to enabling working without poverty
Many people work but that doesn’t always provide them the means to survive.
Many people believe that a basic income alone is not the answer, but that it must go hand in hand with a liveable wage. They see the absence of a living wage as a crucial driver of poverty. A living wage is an important part of poverty reduction efforts. While participants agreed with the need for a living wage, there was discussion around who is responsible for it—employers or government. Some suggestions included employer incentives or a federal top-up benefit (to match the regional Market Basket Measure) to reach all Canadians.
Need to leave behind the charitable model and move to a human rights model
Participants spoke about how a human rights-based model would create accountability for governments. It would also shift the focus from a charity-based lens to treating and supporting people with the dignity that they deserve. People should not have to rely on charity to meet their basic human needs.Early intervention and upstream investments have a significant impact
Everything we do is all down river and reactionary.
Many participants spoke about the need for early, focussed and cohesive interventions for families in precarious situations. The social safety net often kicks in too late, when people are already in crisis. The focus should be on prevention, not just reaction. Helping people to thrive before they are in crisis is more effective, compassionate and humane. Support should continue until people’s situations are stabilized. Cutting off support too early can leave people in poverty, without resiliency, or make their exit from poverty inhumanely temporary.
We heard that there is a need for policy change to stop the revolving door of poverty, oppression, and trauma. Governments focus on short-term solutions. Preventive measures would improve health, social and economic outcomes in the longer run, as well as reduce costs associated with reactive interventions later. Participants also noted that the roots of poverty are not being addressed—colonialism, discrimination, mistrust, etc.
The healthcare system is one area where early intervention is critical and can help to address challenges related to intergenerational poverty. Poor health outcomes perpetuate themselves from generation to generation. It is much easier and more cost-effective to provide resources to families upstream, before they are in crisis or in transition.
Attention is given to those who need it the most— it’s prioritized. You don’t receive all the care you need until you’re in critical need.
Comprehensive wrap-around services are an essential part of the social safety net and an important poverty reduction tool
Poverty is generally the result of exclusion and a lack of supports.
Wrap-around supports are essential for people who are transitioning between benefits and employment
When your basic benefits of life are tied to an employer you don’t have much freedom of mobility.
Universal, portable benefits can help to alleviate some of the challenges when people are moving from a program like social assistance to employment, or for those working in the gig economy.
People have complex needs and require comprehensive supports, but those supports are provided in silos. Many participants noted that every point of access should be a doorway to all services, regardless of who the service provider is, and of what system they are a part. For example, someone accessing employment services could at the same time find out about other services and supports that may be helpful (for example, housing, health, food). Another example is for healthcare providers to provide links to available social services and supports. A more holistic approach and crossover between systems will help to break these silos. In short, we need to start with the person—what supports do they need and how do we ensure they receive them?
Individual support is essential
Need to start from the lens of what is beneficial to the individual.
Families and individuals have unique experiences, and they do not all find themselves in poverty for the same reasons. We cannot solve complex problems with simple, one-size-fits-all solutions. Targeted services and supports are the most effective. Social services need to be appropriately staffed. Caseloads are unmanageable. There is a tendency to focus more on immediate crisis than taking the time to think through and provide supports to help people to move out of social assistance programs.
As a person who experienced poverty, it doesn’t feel like you are living. You are in a survival mode.
Emotional supports can help protect mental health and safety as people are transitioning between systems
I wish there was more intentional and respectful discharges (from prisons, hospitals, addictions treatments) ... if you don’t have meaningful discharge plans ... if you don’t have some kind of intentional, respectful plan ... they will end up back in that system because they don’t have those supports.
There is a need for a softer, smoother and more thoughtful transition between systems. Many people go abruptly from having supports to receiving none. One underlying problem is a failure to recognize that these transitions often break up their informal positive social support systems. Governments and community groups need to help people establish or re-establish these networks, not just support them financially. People exiting a system (for example, the criminal justice and child welfare systems) need to be connected to new communities, new ways of living, and positive people.
Trauma-informed care is essential
It is so hard to share our private experiences when we don’t need to.
We heard that people often experience trauma as they move between systems, and that it is important that service providers are trauma-informed. Continuity of connection with caregivers can support children, youth and adults as they move through systems. A lack of trauma-informed care can make services re-traumatizing, and make people not want to access them. For example, some healthcare professionals do not have training in trauma-informed care. As a result, many people experiencing homelessness, mental health and/or addictions issues face stigma when accessing services. We must also consider intergenerational trauma (for example, because of colonialism). Children in families confronting these issues are also in need of supports.
Social prescribing offers a more holistic approach to caring for people
On a few occasions, participants raised the idea of social prescribing—prescribing non-medical treatments and referring people to community services that can help them connect with activities for their health and wellbeing. Examples include spending time in nature (with a park pass), fitness activities (with a recreational facility pass), and connecting people with affordable housing access to food, etc.
The non-profit sector is one of the most dynamic, responsive and resilient parts of our social safety net.
Community-based organizations need long-term, flexible, sustainable base funding to meet complex needs
NGOS are overworked and underserved.
It takes significant human and financial resources to provide targeted yet comprehensive services and supports for people with complex needs. However, funding is often specific to a program or service focused on meeting a single need (for example, employment or housing). This makes it more difficult for organizations to focus on the long-term preventive supports and services that are most effective and culturally safe. Narrowly focused programs compartmentalize solutions, but individuals have complicated needs that require broad and flexible responses.
We heard that community-based organizations and service providers should receive sustainable and equitable funding to offer a broader range of services. Trust is so important for people who are seeking supports. Community-based organizations have their trust, but not the resources to tailor their approaches to what people need.
For example, youth told us that community-based organizations have helped them with things like:
- school enrollment
- homework
- sports training, to help achieve goals
- summer volunteer opportunities
They also stressed the need for more availability of such services.
I am so used to just dreaming about having things but getting the support to be able to work towards my goals really helps.
Sustainable and sufficient funding would also allow organizations to pay decent wages and benefits to their staff. Many working in community-based or non-profit organizations are underpaid, and organizations must fundraise much of their budget. We heard that people working in community social services sometimes have to use foodbanks themselves. Female workers dominate this sector and often have lower incomes than in other areas. This, coupled with lesser access to benefits, means they are at greater risk of poverty in retirement.
The non-profit sector continues to take on increasing responsibility for people’s health, social and economic wellbeing. However, they do not receive adequate funding to do so. Whether it is an unintended consequence or by design, the current safety net relies a lot on non-profits.
Better collaboration is needed to ensure access to benefits and services
More coordination would be a great step forward.
Automatic enrolment can increase access to benefits
Participants emphasized the need for real efforts to simplify access to benefits and supports, including those that are dependent on filing personal income tax. We heard from many participants that lack of information, misinformation, complicated application forms and long processing times dissuade people from following through or deter them from applying to begin with. Many people expressed that automatic tax filing, automatic enrollment for programs and benefits, and automatic renewal could help to increase take-up of needed benefits and supports for which people are eligible and entitled. There is a belief that the Government of Canada has the necessary information to do this, and could therefore shift the burden from individuals, removing barriers for those made most marginal.
Systems navigators can be a vital tool for people navigating systems and transitioning between them
Navigators represent the dysfunction of the system—why do we have a system that needs navigators?
Systems are antiquated and complex. Eligibility criteria are rigid and hard to understand, even for workers, let alone individuals. In addition, the social safety net is not comprised of a single system, but multiple systems (health, social services, justice, child welfare, etc.) controlled by multiple levels of government. There are also supports and services provided by the non-profit sector. The lack of coordination between these systems causes some people give up when trying to access transition support. Without allies and advocates, navigating complex systems feels impossible. Navigators can help people access supports before a transition, so they do not need to transition in the first place. There is great demand for system navigators (those who have worked in various programs) who can advocate and assist with paperwork or establishing networks.
Literacy level and comprehension level are often low so people cannot understand the information provided or how to access services. The onus should be on the Government of Canada to facilitate access to programs. However, individuals in a liaison role can help participants with lower literacy or comprehension levels by using understandable and culturally appropriate language.
Despite significant support for systems navigators as a tool to increase benefit uptake, some pointed to the need for systems navigators as a problem in itself. They advocate for simplifying systems instead of adding more complexity through navigators.
Participants shared specific solutions for improved coordination including:
- community hubs as one-stop resources to help with communication and coordination
- public servants dedicated to work specifically with community-based organizations—this could take the form, for example, of a multi-agency helpline where people can learn about services from all levels of government and non-profit organizations
- systems mapping to help to identify how systems are connected and how they interact to create obstacles or unintended negative consequences
- wraparound services
- inclusion of families in supports for children and youth, for example allowing families to receive support to help reduce the level of youth homelessness (when it is safe to do so)
Information sharing can improve services for people experiencing poverty
It is traumatizing for people to have to retell (and relive) the reasons why they need help. Information sharing within and between governments can reduce this burden.
Privacy legislation can make it difficult to share information. We heard that people do not understand the legislation well. Therefore, they err on the side of less information sharing. This leads to people falling through the cracks. It was suggested that we develop a system that puts the control of information in the hands of people accessing supports, allowing them to easily share with government and service providers as needed.
Need to help those who are in deep poverty
How do I get out of it?
The social safety net currently helps those hovering close to the poverty line, but not those furthest behind. We have seen significant strides in poverty reduction, but they are not reaching all people equally. The Government of Canada needs to mobilize resources and deliver them to the most disadvantaged groups.
People with disabilities need targeted supports
The social safety net does not adequately address the needs of people with disabilities. Targeted supports are necessary. Benefits and supports often do not reflect the additional costs associated with living with a disability. For example, affordable and accessible housing is in short supply, to the detriment of those who need it.
We also heard about the high clawback rate of employment income that is often part of disability supports. These clawbacks limit the ability to work and earn additional income, trapping people in poverty.
Employment Equity is an effective tool and should be more broadly applied
For me, as a person with multiple disabilities, I think many employers are afraid to hire me. Sign language interpreters cost a lot to provide access. It seems we are cast aside and forgotten.
Many participants spoke about discrimination in the workforce. There is a strong business case to be made for a diverse workforce. However, employers may need an incentive to build a more diverse workforce and to provide employment that is more flexible. One of the most powerful tools for equity, fairness and racial justice is strong employment equity legislation. Employment equity needs to be applied federally, provincially/territorially and municipally, and existing frameworks need to be expanded to include 2SLGBTQ individuals. Equity programs/frameworks also need to be adequately resourced, monitored, audited and enforced as we "build back better." Employment equity can help foster greater labour market participation and all of the benefits that come along with it.
Children and youth in care need more supports
Every child coming in to the foster care system has trauma, even babies.
Once children and youth in care turn 18 and leave the child welfare system, they lose supports that are often not picked up by other programs for young adults. Addressing what a young person will need once they leave care is key to preventing poverty. It is also important to recognize that every child coming into the child welfare system has trauma, even babies. These traumas need to be addressed as early as possible. This will allow children and youth the best possible outcomes once they are out of the system. Importantly, wraparound supports and services should be in place to keep kids from being removed from their families in the first place. We heard about children who are removed from their parents as a result of living in poverty and placed into care. Participants stressed the need to support children’s families in the first place so they can stay together.
It is a tragedy that young Indigenous families have their children torn away from them not because they’re bad parents, but because they’re in poverty.
Participants also spoke to the need to provide supports not just for youth from care, but also children who leave their families (for example to escape violence or because of rejection for 2SLGBTQ youth). They require trauma-informed supports to avoid poverty, homelessness and further violence.
When you’re in care, you have so much trauma—I don’t think I lived my first ‘healthy’ year until I was 24—before that, I lived in a constant state of crisis.
Some participants noted that people living in institutions are stripped of their identities and given new ones by the system. They become a “youth in care.” As a result, their desires, needs and voices are less valuable than the views of social workers, staff, and the institutions themselves. Children and youth in care are blamed and punished for standing up for themselves, or for trying to escape the trauma and abuse that they are exposed to in care.
I’ve been so stigmatized to think that I’m less than because I was in care, I’m less than because I don’t have parents, I’m less than because of my mental health—I don’t feel like I am qualified to be someone.
Additionally, many participants stressed the need to provide supports to families before their kids are taken into care. They pointed to the contradiction of removing children from their families due to poverty, and then financially supporting them in care.
Poverty reduction will not work without affordable housing
Housing First approach helps people get back on their feet
Everything fell apart without housing.
There is a housing crisis, and if it is not addressed, poverty will not be addressed. Housing is the single greatest cost for individuals and families, and affordable housing is increasingly out of reach. A ‘housing first’ approach is important because, as one participant noted, “everything falls apart without housing.”
56 years old and homeless for the first time. I thought I would be dead within the week.
First-person experience – Housing: Safety is paramount
Living in poverty can often mean a lack of choices and a lack of mobility. Housing costs can leave people trapped in situations where they do not feel safe.
One participant shared that a fellow resident attacked them in their subsidized housing building. They feel unsafe and would like to move, but cannot afford to. As a result, they are living in fear and re-living the trauma every day.
Many participants described subsidized housing as a game changer. Without it, people would not be able to afford a place to live. Some would go without other basic needs to pay their rent. However, the quality and location of subsidized housing matters. Subsidized housing is often in the “worst” part of town, and safety can be an issue. Affordable social housing rules can be cumbersome, punitive and leave people in poverty. For example:
- in most jurisBls combined family income renders them ineligible for social housing
- this can have the consequence of deterring children from working, which inhibits their ability to earn and save money, and to develop work experience
- for these reasons, some stakeholders are trying to have this income excluded until age 20
- even one dollar earned over the limit can lead to eviction
- strict rules around family composition can force people to live without needed supports (for example, grandparents living in the home)
It is difficult enough to find affordable housing; finding affordable and accessible housing (for people with disabilities) is even harder. For example, we heard that people need to be carried into their homes (no ramps or elevators), or the layouts limit movement and/or bathing independently.
All it took was getting a concussion and I lost my place to live.
Participants spoke about the need to shift the focus to ensure that housing is not just a commodity, but also a necessity.
Access to culturally safe, affordable housing is the pre-condition to successful working employment.
Health and income are inextricably linked
There are multiple reasons for chronic, long-term poor health. However, we cannot ignore the impact of precarious housing, inadequate income, and the lack of other supports.
Social assistance rates are so low that no one can live a life that does not make them sick. Issues include sub-standard housing, unaffordable healthy food and lack of access to recreation, among others. While there are many different programs and interventions, broad progressive public policy has no rival. The Canada Child Benefit is a great example. People should be supported to make their own decisions about where they live and what they eat. There are 2 ways to do this: increase income (benefits and/or wages) or decrease expenses (for example, affordable housing and low-cost child care).
There is no rival to CCB, to people having the autonomy to make their own decisions.
People with lived expertise of poverty must be empowered and included in policy and program design
The thing that works the best in grassroots organizations is when the people—our neighbours—are leading the way and it’s their voices we are listening to.
Solutions for poverty reduction do not require us to reinvent the wheel. We often exclude those whose voices are most important by virtue of the barriers they face. Instead, we need to better understand the experiences and perspectives of people living in poverty. It is essential to build relationships and to enable opportunities for self-empowerment for people who are living in poverty, not to just simply “include” them. For example, youth participants expressed their frustrations that no one sought their opinions on any decisions related to their communities or related to pandemic responses.
We continue to hear about the dehumanizing and demoralizing nature of seeking help. This includes systems and supports that leave people feeling unworthy and stripped of their dignity. We heard that for many people living in poverty, the experience is all consuming and overwhelming—they are constantly in survival mode. There is a need to normalize public health and community-based prevention initiatives. People should not be stigmatized for participating in housing, food and other social programs. Also, the current scope of the system is too narrow. It needs to be as universal as possible and encompass things such as mental health services.
It’s like people in poverty are asking can you give a sh*t about us please?
In many instances, people with disabilities see ending their life as the only option. We must do more to fight for those who continue to be denied the fundamental human rights to which we are all entitled.
Participants with lived expertise shared a sense of hopelessness. They described a system that seems to trap them in poverty and that punishes them at every turn. Many people do not see a way out. At the most extreme end of this, some participants pointed to recent examples of people who are able to meet the extensive eligibility requirements related to illness, disease or disability turning to Medical Assistance in Dying (MAiD). They see it as a way out of a life of poverty with no escape. While there is no evidence that there is widespread use of MAiD for people living in poverty (and in fact it may be more difficult for those made most marginal to access) the recent stories speak to the level of desperation and hopelessness that people can feel. Others say it feels like governments are willing to provide better ways to die, rather than better ways to live.
It’s hard to be hopeful when its feels like there’s nothing to be hopeful for.
The inclusion of people with lived expertise in poverty is important for making better policy and program decisions, but also for promoting dignity. Services and supports need to promote dignity for the individuals and families accessing them. They must put people front and centre in their design and implementation. They should allow people to meet their needs and help build resiliency so people can thrive, in a way that is respectful and promotes wellbeing, respect and dignity.
When I didn’t feel dignified or validated, I felt I couldn’t move forward.
A statement by the Chief Commissioner of the Canadian Human Rights Commission on MAiD and systemic inequality
Following recent reports of an individual accessing Medical Assistance in Dying because they were unable to find housing that accommodated their disability, Chief Commissioner Marie-Claude Landry of the Canadian Human Rights Commission released the following statement:
Medical Assistance in Dying is intended to allow people the ability to die with dignity when science and medicine can offer no better alternative to alleviate unbearable suffering. Leaving people to make this choice because the state is failing to fulfill their fundamental human rights is unacceptable.
For many people with disabilities, systemic inequality results in inadequate access to services, which means that their fundamental rights continue to be denied and their dignity diminished. They cannot get the healthcare they need because of where they live. They cannot live in their community because the housing they need is not accessible. They cannot afford crucial medication.
Chapter 4 – COVID-19 pandemic and a post-pandemic world
Impact of the pandemic on communities made most marginal
In our previous annual reports, we have dedicated a chapter to the impact of the pandemic.
We have examined:
- how the pandemic exposed gaps in our existing societal supports
- the new challenges that it created
- some of the opportunities it has presented to do things differently
We have used alternate data sources and engagement with people with lived expertise in poverty and stakeholders to understand the impact of the pandemic.
This year, poverty estimates from 2020, the first year of the pandemic, are available via the 2020 CIS. This allows us to see the pandemic’s economic and socioeconomic consequences. It also lets us see the impact of the government benefits and supports on Canada’s poverty rate. Using the CIS, we examined how our systems responded.
Health impacts of COVID-19 disproportionately affected people at risk of poverty
As we have reported previously, COVID-19 disproportionately affected the populations made most marginal in many ways including:
- health outcomes
- infection rates
- morbidity rates
- loss of family members
- income loss
- employment loss
A Statistics Canada report that looked at social inequalities in COVID-19 deaths in Canada between January and August 2020 found significant inequalities in death rates for people living in large cities, as well as those living in:
- apartments
- lower income neighbourhoods
- neighbourhoods with more people who:
- belong to visible minority groups
- recently immigrated to Canada
- were born outside of Canada
- speak neither English nor French
The report concluded that Canadians living in vulnerable situations, including poverty, had higher COVID-19 death rates. These health inequities are unjust, unfair, and avoidable. They should be addressed through an equity approach that promotes healthy living and working conditions for all, regardless of income (Government of Canada, 2021).
Black, racialized and Indigenous people experienced worse COVID-19 health outcomes
A report by the Wellesley Institute and Ontario Health examined race-based data collected between June 26, 2020 and April 21, 2021, by Ontario public health units. The data showed that COVID-19’s impact was highly racialized. The analysis found that white Ontarians had the lowest rates of COVID-19 infection. Compared to white Ontarians, other racial groups had:
- higher rates of COVID-19 infection
- higher rates of COVID-19-related hospitalization
- higher rates of COVID-19-related critical illness
- a higher per capita death rate following COVID-19 infection (Wellesley Institute, 2021)
Data from First Nations people living on reserve also showed a 69% higher rate of infection with COVID-19 compared to the general population (Public Health Agency of Canada, 2021).
Systems that continue to perpetuate racism, ageism, sexism, homophobia and transphobia worsened the direct and indirect impacts of COVID-19 in Canada. Members of racialized communities are more likely to experience inequitable social and working conditions that increase the risk of COVID-19. This includes lower incomes, precarious employment, overcrowded housing and more limited access to health and social services (Public Health Agency of Canada, 2021). Precarious workers, who are disproportionately Black, Indigenous and racialized, were less likely to have sick leave. Living in crowded or inadequate housing made effective quarantining more difficult (Canadian Union of Public Employees, 2020).
The Public Health Agency of Canada has built a model for an equitable pandemic response. This includes adaptations to public health responses to make them work better for equity-seeking populations. It also includes work to improve the social determinants of health and allied factors such as socio-demographic data collection and use. The implementation of a comprehensive, community-informed, equity-focussed pandemic strategy in Toronto led to decreased disparities in COVID-19 infections. Hospitalizations also decreased for racialized populations. This demonstrated that it was possible to significantly diminish the inequitable impacts of the pandemic through thoughtful community-informed and data-driven approaches (McKenzie, 2021).
Economic impacts of pandemic
In March 2020, a series of international, federal, provincial, territorial and local public health measures was introduced in response to the pandemic. This included the closure of non-essential businesses and travel restrictions. These interventions changed economic activity and resulted in a shock to the Canadian labour market.
As with health impacts, the financial impacts of these measures were not felt equally. Earnings and employment losses tended to be concentrated among families and individuals with lower market income. For example, in 2020, the average market income for families and single individuals fell about 20% in the bottom quintile and 10% in the second-lowest quintile, while the upper quintile remained unchanged (Statistics Canada, 2022c). Additionally, many companies did very well before and throughout the pandemic, but did not pass on this this accumulated wealth to their workers. They cut jobs when they faced shrinking profits.
In response to losses in employment and earnings, the Government of Canada introduced a suite of new income benefits. The new pandemic response measures with the largest aggregate amounts transferred were the Canada Emergency Response Benefit (CERB), the Canada Recovery Benefit (CRB), and the Canada Emergency Student Benefit. The CERB design permitted broad access by Canadian workers and delivered a relatively high benefit to workers with labour market attachment. It was made available to individuals residing in Canada who were at least 15 years old and stopped working or had been working reduced hours due to COVID-19. Applicants were required to have incomes no less than $5,000 in 2019 or in the 12 months prior to the date of their application; and not have quit their job voluntarily. Applicants received $2,000 for an initial 4 week period and could reapply for additional periods, eventually extending to 28 weeks, for a maximum benefit of $14,000. The program covered the period from March 15 to September 26, 2020.
The new measures were in addition to augmented supports provided through existing Government of Canada programs such as the Canada Child Benefit (CCB), Old Age Security (OAS), the Guaranteed Income Supplement (GIS), and any temporary and one-time provincial and territorial benefits. As a result, the median government transfer to families and single individuals doubled from $8,200 in 2019 to $16,400 in 2020. This increase was primarily driven by pandemic response measures (Statistics Canada, 2022c).
CERB usage by particular groups
According to Statistics Canada, of all workers who earned at least $5,000 in 2019, approximately one-third (35.2%) received CERB payments in 2020. The percentage of workers receiving CERB payments amounted to 36.3% for women and 34.2% for men. Workers with relatively low annual earnings were the most likely to receive CERB payments in 2020. Of all workers who earned at least $5,000 in 2019 and who were in the bottom 10% of the employment income distribution, more than half (55.3%) received CERB payments in 2020 (Morissette et al., 2021).
There is some evidence that hardest-hit groups were more likely to get the CERB. However, we are unable to determine at this time the extent to which the CERB was equitably available to those who qualified and equitably met the needs of the hardest hit.
Impact of increased government benefits and transfers during the pandemic
The introduction of pandemic relief programs offered a de facto pilot project or real-time experiment on the impact of a widespread, low-barrier income benefit. According to Statistics Canada, the CERB, CRB and CESB provided approximately $82 billion in income support to 8.1 million Canadian families and single individuals in 2020. The median amount in pandemic income support received by these families and single individuals was $8,000 (Statistics Canada, 2022c).
What we saw from this large investment in relief benefits was a significant decrease in poverty rates in Canada, as measured by MBM. The measures were successful in keeping many Canadians from falling below Canada’s Official Poverty Line despite the widespread impacts on the labour market and business closures. In fact, they significantly lowered the official poverty rate in Canada. However, these were short-term measures and therefore the gains in poverty reduction are likely temporary.
Long-term and hidden impacts of the pandemic
When the pandemic first hit, governments were responding to an unprecedented situation and the responses evolved along with the pandemic. Some of these included the introduction of temporary economic benefits. Many jurisdictions introduced eviction moratoriums. People in some jurisdictions were temporarily housed in hotels and other makeshift shelters to promote greater physical distancing. We heard about people who were precariously housed—living in shelters or couch surfing—being returned home, even if those home situations were unsafe. Many services quickly pivoted to providing online and remote delivery. Others were closed. Court cases were delayed. Surgeries and other medical procedures were cancelled or delayed. Schools were closed and shifted to online learning. Where possible, workers shifted to telework. The long-term impacts of these changes have yet to be fully realized or understood.
Pandemic impacts on the healthcare system
An estimated 26,248 excess deaths were reported in Canada from March 2020 to mid-October 2021—5.8% more deaths than would be expected with no pandemic. Early in the pandemic, excess deaths occurred mainly among seniors with COVID-19. However, later there was an increase among younger Canadians as well, with many deaths caused by unintentional poisonings and overdoses. Life expectancy went down by 0.6 years—the largest single-year decline since 1921 (Statistics Canada, 2022a).
We know that many procedures, screenings and surgeries were delayed. Some people were unable to access medical appointments. As an example, modelling projections show that a 6-month delay in colorectal cancer screening could increase cases by 2,800 and deaths by 1,300, between the years 2020 and 2050 (McKenzie, 2021). We also have yet to fully understand the realities of long COVID and what effect it will have on the long-term health and wellbeing of those who suffer from it. Despite some of these unknowns, it is clear that the health impacts will be felt for a long time and are not fully understood.
We know—both anecdotally and through data—that the pandemic has had a significant impact on mental health. Mental health declines have not recovered to pre-pandemic levels. As of June 2021, 61% of Canadians reported very good or excellent mental health, compared with 67% in 2019. The decline is greater among women (-7.5 percentage points) than men (-4.0 percentage points) (Statistics Canada, 2022a).
Gendered impacts of the pandemic
The pandemic impacted men and women differently. While men are more likely to be infected and die from COVID-19, many of the other impacts are more likely for women and are especially felt by equity-seeking groups.
We heard throughout the engagement sessions about many of the burdens women have faced during the pandemic. This includes increased caregiving loads through school and child care closures, isolation periods and illness. Early in the pandemic, we began to understand the disproportionate toll of COVID-19 on the finances and career prospects of Canadian women. Female and youth-dominated industries like accommodation and food services were the hardest-hit by restrictions and lockdowns. Many women also suffered from a lack of child care as daycares and schools shut down in the pandemic’s early months (Labour Market Information Council, 2021).
In January 2021, employment among women was approximately 5.3% below February 2020 levels, compared to a drop of about 3.7% for men, according to a report from the Labour Market Information Council. Employment for women in low-earning occupations was 14% below pre-crisis levels, while their counterparts in high-earning jobs had fully recovered (Labour Market Information Council, 2021).
By March 2022, the employment gains for women aged 25–54 are concentrated in middle- and high-earning occupations, which have increased by more than 4% since the lows of 2020. Employment for women is up slightly in lower-paying occupations—0.5% above pre-pandemic levels (Labour Market Information Council, 2022). However, employment levels among lone parents with children under age 6 have shown little improvement over time, while mothers with school-aged kids (6–12 years) have had to cope with recurring shutdowns and challenges of homeschooling. Single women have faced recurring employment losses and heightened financial stress. Immigrant women workers were especially hard hit during the initial lockdown, a result of their over-representation in lower-wage jobs, shorter-tenure jobs, and being employed in the accommodation and food services sectors (Scott, 2022).
Pandemic impacts on people with disabilities
Statistics Canada undertook analysis on the impacts of the pandemic on people with disabilities. They noted differences in the effects of COVID-19 on their employment and income. Approximately one-third of surveyed participants with disabilities experienced a temporary or permanent job loss or reduced hours during the pandemic. One-quarter relied solely on disability benefits, while only 17% received CERB or CESB. To support people with disabilities, the Government of Canada provided a one-time $600 payment to those holding a valid Disability Tax Credit certificate to pay for “extraordinary expenses incurred by persons living with disabilities.” However, approximately one-third of participants reported that their household income had decreased, while more than half had difficulty meeting a financial responsibility (Statistics Canada, 2020).
Pandemic impacts on youth
Despite their relative lower risk from COVID-19 infection, youth have borne a disproportionate impact from the pandemic. According to a report in January 2021 by the Mental Health Commission of Canada, young people are particularly vulnerable to the disruptions the pandemic has caused. Many are being left behind in education, economic opportunities, health and wellbeing during a crucial stage of their development. According to the survey results, youth faced a number of challenges, including:
- feeling isolated and lonely (48%)
- closures of in-person schools and moving to remote learning (33%)
- limited access to mental health supports and other health-related supports (9%)
- fears of acquiring COVID-19 (for oneself or loved ones) (2%)
- lack of employment opportunities (1%)
- other challenges (6%) (Mental Health Commission of Canada, 2020)
A survey by SickKids hospital had similar findings, concluding that overall, children were faring mostly worse, and occasionally better, compared to their pre-pandemic selves (Cost et al., 2022).
Impact on 2SLGBTQ youth
2SLGBTQ youth are overrepresented among youth experiencing homelessness and experience significantly higher rates of mental health issues compared to heterosexual and cisgender youth. A survey of 61 2SLGBTQ youth experiencing homelessness and one-on-one interviews with 20 youth showed that youth have been significantly impacted by the pandemic in various ways. This includes experiencing poor mental health, such as suicidality, depression, anxiety, and increased substance use, and lack of access to health and social support services (Abramovich et al., 2021).
2SLGBTQ youth are overrepresented among youth experiencing homelessness and constitute 20–40% of the homeless youth population in North America. They experience significantly higher rates of mental health issues compared to heterosexual and cisgender youth across global contexts, due to stigma, discrimination, and identity-based rejection. Unique stressors faced by 2SLGBTQ youth during the pandemic include being forced to isolate at home with unsupportive and abusive family members due to a lack of alternative housing options. This can have devastating effects on these young people (Abramovich et al., 2021).
Impact of the pandemic on housing and homelessness
Early in the pandemic, steps were taken to address the immediate needs of people who were experiencing or at risk of homelessness. Temporary shelters were created in hotels and eviction moratoriums were introduced in many jurisdictions to protect groups made most marginal. These measures had some success early in the pandemic. However, eviction moratoriums have largely ended and temporary shelters in place during the height of the pandemic are closing. This forces many people out and onto the streets. Stakeholders across the country report seeing an unprecedented rise in people experiencing homelessness. This comes at the same time as increased housing costs and affordability challenges. These pandemic-related issues exacerbated existing challenges in housing.
Pandemic impacts on the criminal justice system
While overall crime levels decreased during the pandemic, there was a 7% increase between 2020 and 2021 in some crimes: assault, sexual assault, uttering threats, robbery, motor vehicle theft and shoplifting. There was also a 37% increase in police-reported hate crimes—718 more in 2020 than in 2019. This is the highest number since comparable data have been available, and it reflects crimes targeting Black, Asian, and Indigenous populations (Statistics Canada, 2022a).
Beyond 2020
While 2020 data offers an important understanding of the impacts of the pandemic and the government responses to it, the data has an approximate 2-year lag with respect to the publication date of this report. Despite what appears to be a success story and overall achievement of poverty reduction targets, we know there are significant challenges since 2020 that will likely have a negative impact on overall poverty reduction efforts.
Withdrawal of temporary benefits
The events of 2020 resulted in unprecedented impacts on the incomes of Canadian individuals and families. Swift government action provided financial relief to the population. As pandemic restrictions are being lifted and emergency benefits are phased out, the increase in government transfers and the decrease in poverty rates observed in 2020 are likely to be temporary (Statistics Canada, 2022c).
The Government of Canada’s response to the pandemic, most notably the CERB, was effective in keeping many Canadians above the official poverty line in 2020. This was demonstrated by the significant reduction in poverty rates. However, the pandemic continued to impact the labour market in 2021 and beyond. Public health restrictions fluctuated and employment in lower-paid industries remained affected. Some government pandemic income support programs were retooled, scaled back and withdrawn throughout 2021 and 2022 (Statistics Canada, 2022c). As a result, while the influx of income support was able to move people out of poverty in the short term, those gains are not likely sustainable beyond 2020. Results from the 2021 CIS, which will be available in 2023, will inform us of such changes.
Unintended consequences and clawback of temporary benefits
There have also been several issues raised with respect to unintended consequences of the rollout of the CERB. Some are causing unanticipated hardship in the lives of people with low income in 2021 and beyond. These include:
- recalculations of GIS – CERB receipt among the senior population resulted in partial, and in some cases full, reduction of GIS payments for nearly 90,000 low-income seniors (Campaign 2000, 2022)
- recalculations of refundable tax credits – CERB payments have factored into calculations for income programs such as the CCB and the CWB, resulting in lower payments to some families and individuals
- federal CERB repayment debt – Nearly half a million Canadians have been asked by the Canada Revenue Agency to provide proof of eligibility or to repay the CERB in full. Many of these people were, however, either confused about eligibility requirements, or are unable to obtain the necessary documentation to prove that they met eligibility criteria (Cullen, 2020)
- interactions with provincial and territorial income and disability assistance programs – Income assistance recipients who lost work applied for the CERB. Since the CERB was counted as earned income, it was clawed back from many social assistance and disability benefit recipients in part or in full, depending on the province or territory they lived in
- interactions with housing rent subsidies – In jurisdictions where income is calculated on a monthly basis, low-income earners who received CERB saw their rent subsidies decrease immediately, resulting in rent increases (as was the case for Toronto Community Housing residents). In jurisdictions where income is calculated annually, renters learned of decreases to subsidies this summer and fall (as is the case with the Rent Assist program in Manitoba) (Campaign 2000, 2022)
Since June 2020, a number of stakeholders, including Campaign 2000, have been calling on the Government of Canada for what they are calling a CERB amnesty for those living in poverty or near poverty. A CERB amnesty would amend the unintended consequences of that program, particularly for those who have been made most marginal.
Stakeholders are looking to the Government of Canada to:
- ensure that the CERB and the CRB payments do not result in clawback of the GIS and refundable tax credits such as the CCB and the CWB
- refund all lost benefit amounts related to CERB/CRB receipt and recalculate and apply the readjusted benefit amounts to the remainder of this benefit year
- cease pursuing people living on low incomes for repayments of the CERB and ensure that no payments are sought for the CRB
With the clawback of overpayments and the withdrawal of temporary income measures, we expect poverty rates to increase. With the end of eviction moratoriums and rising housing costs, huge numbers of people have been displaced. Many of the people facing financial hardship are hidden from poverty statistics. The impacts associated with the phase-out of emergency benefits such as the CERB, as well as those associated with recent increases in the cost of living, will be known with the results of the 2021 Canadian Income Survey. Results will be released in 2023.
Inflation and increasing unaffordability
Rising inflation could also have an impact on real incomes and income poverty rates in 2021. Prices continue to rise and strain households, especially those who are at risk of and living in poverty. Canada’s inflation rate was at a 30-year high in January 2022 (+5.1%). In January, annual price increases for both food (+5.7%) and shelter (+6.2%) were above the overall inflation rate. Grocery prices rose at their fastest yearly pace (+6.5%) since May 2009. Excluding gasoline, the consumer price index increased by 4.3% year over year in January, the largest yearly increase since the index became available in 1999 (Mokaya, 2022).
Consumer inflation has outpaced average wage growth since the spring of 2021. The annual increase in average hourly wages, adjusted for changes in composition of employment during the pandemic, was 2.7% in January. Unadjusted for these changes, average hourly wages rose 2.4%. (Statistics Canada, 2022a).
For families and individuals, this means that daily life is becoming increasing unaffordable. Since poverty thresholds are updated to take into account inflationary changes from year to year, some families currently living above the poverty line could fall below it. Throughout the engagement sessions, we heard from people who expressed fear about their futures. There was a real sense that wages and benefits were not keeping pace with rising costs and that people are worse off as a result.
Adjusting to a post-pandemic world
Through the government responses to the pandemic, we have seen that with enough investment, it is possible to reduce the number of people living in poverty. The temporary income measures introduced by the Government of Canada were effective in the short term, but there is no strategy to sustain them. They addressed income but not all dimensions of poverty, food insecurity, homelessness, low literacy and numeracy or others. As a result, despite the decrease in poverty level as measured by the MBM, half of the other poverty indicators seem to be on the rise. This includes unmet housing needs and food insecurity. As a result, we expect to see an increase in not just income measures of poverty, but also other non-income measures of poverty.
To achieve long-term poverty reduction, we need to focus on longer-term impacts. This includes protecting those made most marginal against future shocks through investment in people, communities and infrastructure improvements. This requires a focus on systems that are there to support people when they are in need.
While many of the health measures related to the pandemic have been lifted, COVID-19 is not over. It seems as though there is a societal and governmental push to return to pre-pandemic life. This includes lifting restrictions to protect the economy. In returning to pre-pandemic rules, we are accepting a certain level of risk and death due to COVID-19. As we have seen, the risk falls disproportionately to those who are made most marginal. These remain dangerous times for these groups. As a society, we cannot sacrifice people who are most at risk. For this reason, we must focus on harm reduction, poverty reduction and early intervention. Reducing the number of people who are in poverty will reduce the number of people at risk.
Impact of future events on groups made most marginal
As we saw with COVID-19, groups made most marginal are the most impacted by crisis and events like the pandemic. Racialized communities, immigrants, refugees, those working in low- paying front line jobs and living in crowded conditions were more likely to get sick from COVID-19 and have poor outcomes. First Nations, Inuit and Métis communities had higher death rates. While the pandemic will pass, there will continue to be shocks and global events that put people at risk. Throughout the engagement sessions, we heard how disasters will strike those in poverty the hardest. Communities made most marginal have fewer resources to draw on to protect against and mitigate the effects of shocks. Groups made most marginal are the least prepared, most precariously supported and therefore most impacted. Poverty is a full-time job and you cannot plan for the future when trying to survive the present.
Future-proofing and building resilience
We must act now to future-proof our systems and social safety net. We need to make sure that our systems are rebuilt to foster resilience and to ensure groups made most marginal have the support they need to withstand shocks. We need to rebuild the social safety net to intervene early to support people before they are in crisis. We need upstream support to keep people from falling into precarious situations and poverty in the first place. The burden must shift from individuals to building resilient systems that create the conditions for people to thrive.
Chapter 5 – Poverty in Canada and an update on progress
Poverty rates in Canada
According to Canada’s Official Poverty Line, the poverty rate in Canada fell to 6.4% in 2020. This represents a 3.9 percentage point decrease in the poverty rate between 2019 and 2020 and about 1.4 million fewer Canadians in poverty. It represents a decrease of 56% in the poverty rate compared to 2015 (14.5%), the baseline year for measuring results against Canada’s legislated poverty reduction targets. There were close to 2.7 million fewer people living in poverty in 2020 than in 2015.
A few notes on this year’s data
Canadian Income Survey
Poverty rates based on Canada’s Official Poverty Line are estimated using annual results from the Canadian Income Survey (CIS). CIS data has an approximate 2 year lag between a specific reference year and when the results become available. The following section of the report is based on the most current poverty statistics available. Those statistics come from the 2020 CIS, which was released on March 23, 2022.
Missing data
As noted in previous reports, poverty data for some populations is not available. We have noted throughout the chapter where data is either missing or cannot be disaggregated for certain groups. Some groups are under-surveyed or not surveyed at all. Annual poverty statistics are still missing for First Nations people living on reserve, people living in the territories, people experiencing homelessness and 2SLGBTQ people, among others.
Because of this, we looked for data sources other than the CIS to provide insight into the impacts of the pandemic. This includes annual and monthly statistics produced from the Labour Force Survey, census data, targeted studies, crowdsourcing surveys and public health data.
Impact of the pandemic
Data from the 2020 CIS and subsequent CIS cycles will reflect the economic impact of the pandemic on poverty rates. As we reported in the previous chapter, it is important to underscore that the events of 2020 had unprecedented impacts on the incomes of individuals and families in Canada. To a large degree, the changes observed in market income, government transfers and poverty rates in 2020 were temporary. The previous chapter examined the known impacts of the pandemic and tried to identify future and long-term impacts. This chapter will provide a snapshot of poverty in 2020, knowing that the results presented this year are outliers and should be understood within the broader response of various levels of government. The data presented here are just as much about the pandemic as about poverty. For these reasons, we have focussed on the populations who are made most marginal, and who struggled most during the pandemic.
How poverty is measured
The Poverty Reduction Act passed in June 2019 and created Canada’s Official Poverty Line, based on the Market Basket Measure (MBM). The MBM establishes poverty thresholds based on the cost of a basket of food, clothing, shelter, transportation and other items representing a modest, basic standard of living, across 53 regions in Canada. If a person’s or family’s disposable income is below the threshold for the region in which they live in a given year, they are considered to be living poverty. Unfortunately, MBM statistics are not currently produced for certain populations. This includes First Nations people living on reserve, people living in the territories, people living in institutions and people experiencing homelessness. The Government of Canada is currently developing a Northern Market Basket Measure (MBM-N) for the Yukon and the Northwest Territories. Work on an MBM for Nunavut is ongoing. The MBM-N under development will more accurately reflect the poverty line for northern communities. Work is also underway to co-develop distinctions-based Indigenous indicators of poverty and wellbeing.
Income level is a common proxy (substitution) for determining poverty status. While measures based on income are useful, income alone fails to quantify the true experience of living in poverty. There are many parts of the experience of poverty that it does not measure, such as social inclusion, power, autonomy and respect. Therefore, in addition to Canada’s Official Poverty Line, Opportunity for All: Canada’s First Poverty Reduction Strategy established a dashboard of several socioeconomic indicators. Although it is not comprehensive, the dashboard makes it possible to track progress made across several dimensions of poverty.
Poverty reduction targets
Opportunity for All sets specific poverty reduction goals for Canada: a 20% reduction by 2020 and a 50% reduction by 2030, relative to 2015. These goals are set in legislation and are a key commitment of the Strategy. The 2030 goal also reflects a commitment to the first United Nations Sustainable Development Goal to reduce by half the proportion of men, women and children of all ages living in poverty in all its dimensions.
On January 1, 2016, the 193 countries of the UN General Assembly officially began implementation of the 2030 Agenda for Sustainable Development, which is the United Nations' action plan to address urgent global challenges over the next 15 years. The plan is based on 17 sustainable development goals to be achieved by 2030.
The indicators that Opportunity for All uses to monitor progress in reducing poverty align with 6 other Sustainable Development Goals related to: food security; health and wellbeing; quality education; gender equality; inclusive and sustainable economic growth; employment and decent work; and reduced inequalities.
Progress under Canada’s Official Poverty Line
The substantial reduction in poverty in 2020 allowed Canada to reach its commitment under the 2030 Agenda for Sustainable Development to reduce poverty by 50% by 2030.
5.1 Graph: Number and percentage of persons under Canada’s Official Poverty Line
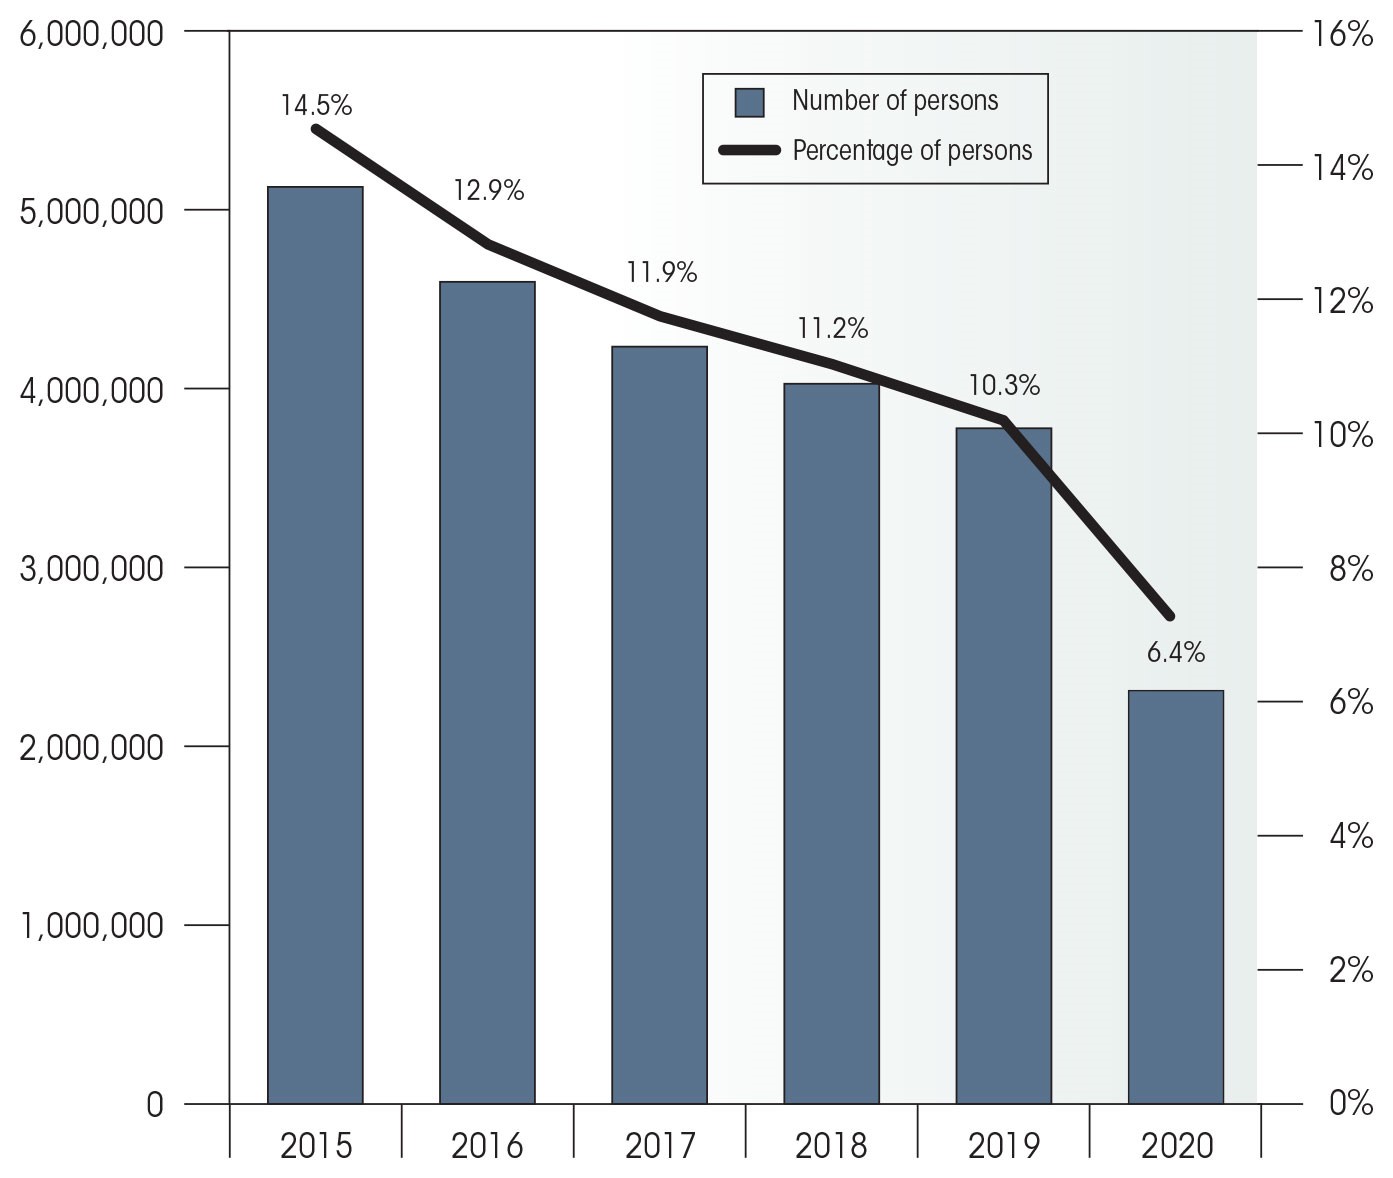
Source: Statistics Canada, Canadian Income Survey.
Text version – 5.1 Graph
| Year | Number of persons | Percentage of persons |
|---|---|---|
| 2015 | 5,044,000 | 14.5% |
| 2016 | 4,552,000 | 12.9% |
| 2017 | 4,260,000 | 11.9% |
| 2018 | 4,065,000 | 11.2% |
| 2019 | 3,793,000 | 10.3% |
| 2020 | 2,357,000 | 6.4% |
As noted previously, the significant decrease in the overall poverty rate observed between 2019 and 2020 is largely attributable to temporary pandemic response measures, such as government transfers (Statistics Canada, 2022c). According to CIS results, these temporary financial assistance measures more than offset pandemic-related declines in market income. They caused the median after-tax income of Canadian families and single individuals to increase from $62,400 to $66,800 between 2019 and 2020. Driven by pandemic response measures, the median government transfer for Canadian families and single individuals doubled from $8,200 in 2019 to $16,400 in 2020.
Source: Statistics Canada, Canadian Income Survey .
What we know about poverty in Canada
Poverty is multifaceted and affects some groups more than others. Discrimination continues to play a role, both collectively and individually. First Nations, Inuit and Métis people are at high risk of living in poverty due to the historical and ongoing affects of colonialism in Canada, including trauma, racism and discrimination. Groups made most marginal, including Black and other racialized populations, are also more likely to live in poverty due to economic barriers and all forms of discrimination.
To make lasting progress in reducing poverty, it is essential to understand:
- who is at risk of falling into poverty for the first time
- who remains in poverty
- who no longer lives in poverty but is at risk of slipping back into it
- the risk factors for each of these
This knowledge is essential to improving the social safety net and making it more equitable, so that it supports those most underserved and those made most marginal. Importantly, we need to prevent people from falling into poverty to begin with, not just do the minimum for those who have already fallen. The system should help people to be more resilient to future shocks.
The table below shows the number of people in poverty by demographic group in Canada.
Source: Statistics Canada, Canadian Income Survey.
*referred by Statistics Canada as persons designated as visible minorities.
Intersectionality
5.4 Infographic: Composition of the population of people with disabilities aged 18 to 64 intersecting with different marginalized groups, 2020
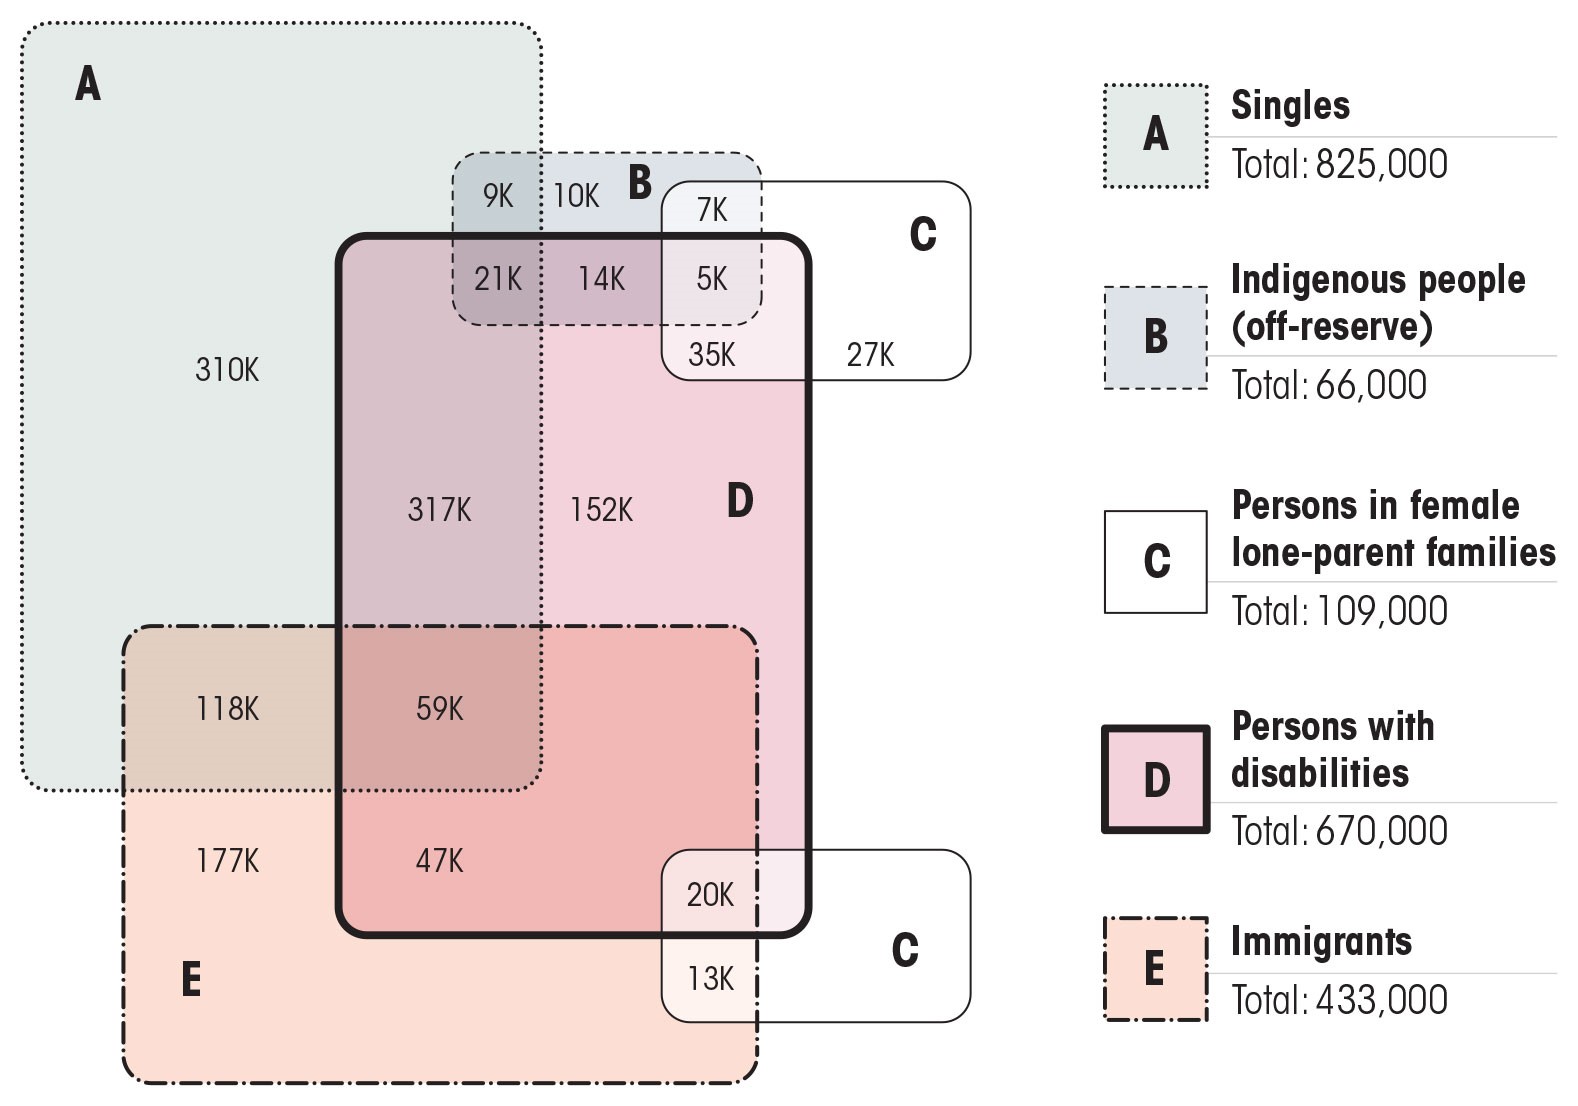
Note: Counts for the diagram above were estimated using weights from the disability component of the 2020 Canadian Income Survey, which allow for consistent comparisons of people with disabilities/people without disabilities belonging to various groups made most marginal. Counts for specific groups may differ from those published using the main CIS database. Components may not add to totals due to rounding.
Text version – 5.4 Infographic
Overlapping circles show the number of people with disabilities, aged 18 to 64, who also belong to one or more other marginalized groups. Boxes surrounding the circles show the number of people in each marginalized group.
| Intersections | Number living in poverty |
|---|---|
| single/people with disabilities | 317,000 |
| single/immigrants | 118,000 |
| single/immigrants/people with disabilities | 59,000 |
| immigrants/people with disabilities | 47,000 |
| people in female-led lone-parent families/people with disabilities | 35,000 |
| single/ First Nations, Inuit and Métis people (off reserve)/people with disabilities | 21,000 |
| immigrants/people with disabilities/people in female-led lone-parent families | 20,000 |
| First Nations, Inuit and Métis people (off reserve)/people with disabilities | 14,000 |
| immigrants/people in female-led lone-parent families | 13,000 |
| single/First Nations, Inuit and Métis people (off reserve) | 9,000 |
| First Nations, Inuit and Métis people (off reserve)/people in female-led lone-parent families | 7,000 |
| First Nations, Inuit and Métis people (off reserve)/people in female-led lone-parent families/people with disabilities | 5,000 |
| Characteristics | Number living in poverty |
|---|---|
| singles | 825,000 |
| people with disabilities | 670,000 |
| immigrants | 433,000 |
| people in female-led families | 109,000 |
| First Nations, Inuit and Métis people (off reserve) | 66,000 |
Intersectionality is a term used to describe the intersecting effects of categories such as race, class, gender, and other marginalizing characteristics that contribute to an individual’s social identity. It also refers to the complex ways in which the effects of multiple forms of discrimination combine, overlap, or intersect, especially in the experiences of individuals or groups made most marginal. Intersectionality provides a lens that examines the importance of considering an individual’s identities to more thoroughly understand and unpack an individual’s unique social experiences. Individuals simultaneously possess multiple social identities. These identities are formed through the experience of living and existing in different and sometimes overlapping groups based on factors such as race, culture and ability. For any individual, some social identities are marginalized due to discrimination, while others are not. The more marginalized identities a person has, the greater their risk of poverty. The figure below contains information available through the CIS data and illustrates how poverty rates vary according to different intersectional identities.
The figure below demonstrates a concrete example of the impact of intersectionality by looking at people with disabilities with multiple marginalized identities.
5.5 Graph: Poverty rates for intersections of disability and other marginalized groups (ages 16+), 2020
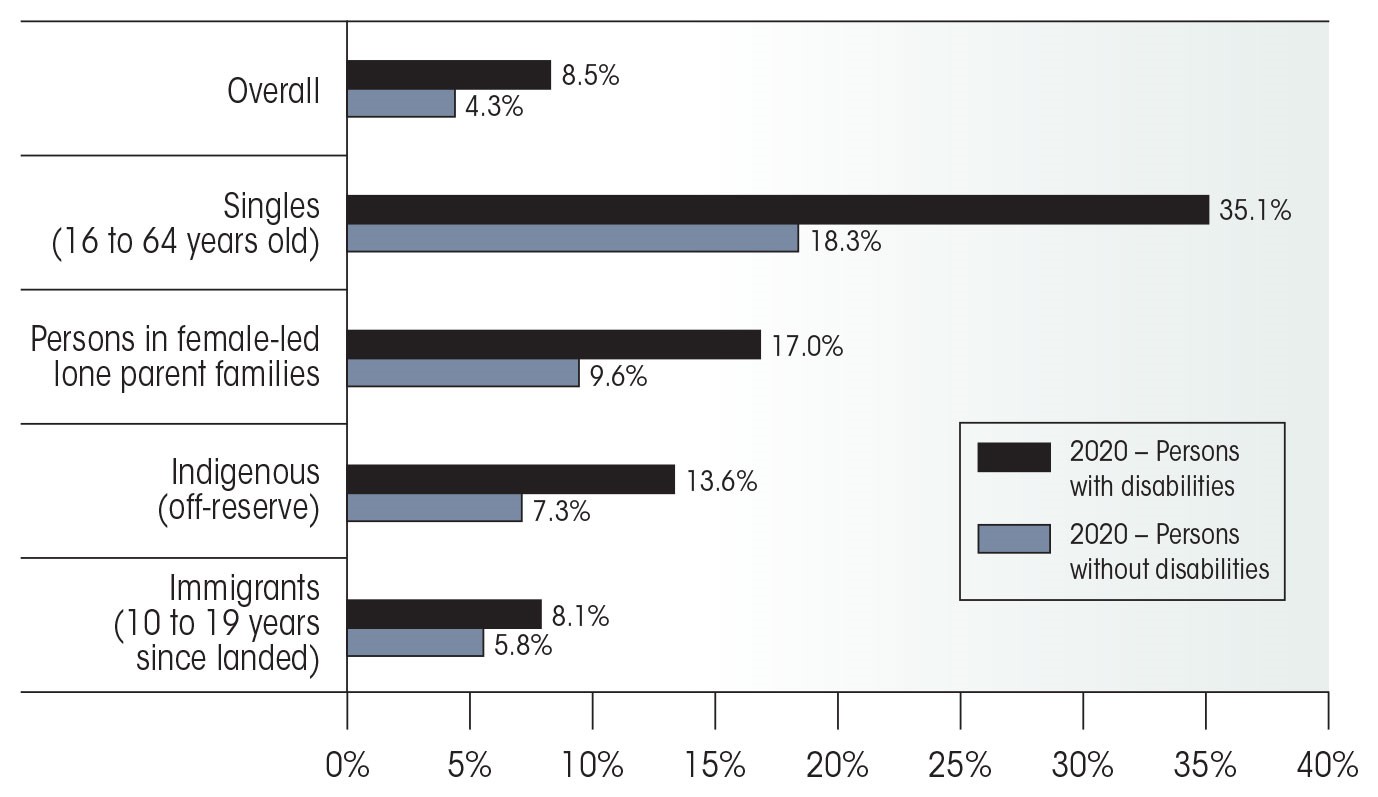
Source: Statistics Canada, Canadian Income Survey. Note: Percentages above were estimated using weights from the disability component of the 2020 Canadian Income Survey, which allow for consistent comparisons of people with disabilities/people without disabilities belonging to various groups made most marginal. Percentages for specific groups may differ from those published using the main CIS database.
Text version – 5.5 Graph
| Characteristics | People with disabilities | People without disabilities |
|---|---|---|
| Overall | 8.5% | 4.3% |
| Singles aged 16 to 64 | 35.1% | 18.3% |
| People in female-led lone parent families | 17.0% | 9.6% |
| First Nations, Inuit and Métis (off reserve) | 13.6% | 7.3% |
| Immigrants (10 to 19 years since landed) | 8.1% | 5.8% |
Poverty rates by demographic group
In 2020, the poverty rates decreased for all demographic groups defined by sex, age, family type, disability status, immigration status and Indigenous identity. However, the degree of reduction was not the same for everyone and certain groups face higher risks of living in poverty or face specific challenges. The availability of 2020 data provides an opportunity to examine the groups for whom poverty rates have not decreased as much and to see what impact the pandemic had on these same groups.
5.6 Table: Poverty rate reduction by demographic group, 2015, 2019 and 2020
Note: This table below has been modified to make it more accessible. The original version can be found in the PDF.
Source: Statistics Canada, Canadian Income Survey. Note: *2020 estimates for Inuit residing outside the territories could not be published because of a small sample.
Single individuals
Single individuals have historically been at a higher risk of living in poverty than other family types. Although the poverty rate for single people decreased to 20.9% in 2020 from 26.9% in 2019, their incidence of poverty remains significantly above the 2020 poverty rate for Canadians in families (3.4%).
Pandemic relief benefits increased the median government transfer almost threefold for all single people, rising from $2,900 in 2019 to $11,200 in 2020, providing much-needed support to those who had some labour force attachment. In the case of part-time/gig and low-income earners, the CERB and other benefits may have provided a higher income than their previous employment.
However, single people aged 18 to 64 continue to face important barriers. In 2020, and largely as a result of pandemic restrictions, most single people in this group who lived below the poverty line listed government transfers as their major source of income (68%). Furthermore, a substantial proportion (42%) reported not being in the labour force all year. Economic inclusion of single people in this demographic group will be key to making further progress in poverty reduction.
Racialized individuals
What do we mean by the term racialized people
Statistics Canada uses the term “visible minority” as defined by the Employment Equity Act. The Employment Equity Act defines visible minorities as "persons, other than Aboriginal peoples, who are non-Caucasian in race or non-white in colour."
In 2012, the United Nations warned Canada the term could imply that different ethnic groups share the same experiences; however, its use continues in the context of government statistics.
Increasingly, the term “racialized persons/communities/people” is replacing “visible minorities” because in many municipalities in Canada, the population of people who are non-white make up the majority of the overall population. In this report, the term “racialized people” refers to those people designated as a visible minority in Statistics Canada data collection.
Content
| Sex | Number in poverty | Poverty rate |
|---|---|---|
| Male | 404,600 | 8.1% |
| Female | 397,400 | 7.8% |
Source: Statistics Canada, Canadian Income Survey.
| Age | Number in poverty | Poverty rate |
|---|---|---|
| Under 18 | 151,200 | 6.6% |
| 18 to 24 | 168,200 | 14.7% |
| 25 to 64 | 438,600 | 7.8% |
| 65+ | 44,000 | 4.4% |
| All | 802,000 | 8.0% |
Source: Statistics Canada, Canadian Income Survey.
In 2020, the poverty rate of those who belonged to racialized communities was higher (8%) than that of those who did not (5.8%). Racialized people represent approximately 22% of Canada’s of Canada’s population according to the 2016 Census and are significantly overrepresented in poverty. In line with previous Council recommendations on increased data disaggregation, information on income and poverty for population groups designated as racialized individuals is available from the CIS for the first time for the reference year 2020. Because of this, no historical trend is available, but the data presented in this section will provide a baseline for future comparisons. Poverty rates among racialized communities varied widely and this can be further broken down in the data.
Source: Statistics Canada, Canadian Income Survey.
Recent immigrants and newcomers
In 2020, the poverty rate for recent immigrants aged 25 to 64 who arrived in Canada less than 10 years ago was 8.6% compared with 17.5% in 2019. This represents a 51% reduction of the poverty rate in this group. It is important to note that poverty rates remain high compared to the national average and many newcomers are from racialized communities. In addition, there have been fewer newcomers to Canada because of the pandemic. Therefore, the data on recent newcomers may partially be a result of the cohort effect.
While surveys track this data, we have heard that surveys in Canada historically and systemically failed to take the steps required to adequately survey this group in a culturally appropriate way. This may result in some limits on our ability to properly report on immigrants and newcomers.
| Years since immigration to Canada | Number in poverty | Poverty rate |
|---|---|---|
| 0 to 4 | 103,000 | 11.9% |
| 5 to 9 | 50,000 | 5.5% |
Source: Statistics Canada, Canadian Income Survey.
People with disabilities
According to the CIS, 761,000 people or 8.5% of people aged 16 and older with a disability lived below the poverty line in 2020. This is a reduction of 5.2 percentage points from the 2019 poverty rate of 13.7%. The poverty rate for people with disabilities in 2015 was estimated at 20.6%. As noted in the previous chapter, there were more limited emergency supports for people with a disability without labour force attachment, since they would not have qualified for the CERB. Many people with a disability living in families benefitted from family members receiving the CERB. Those with labour force attachment may have qualified as well.
Historically, people with a disability are more likely to live below the poverty line. This is especially true for those under the age of 65, as seniors (65+) with disabilities have access to the Old Age Security and the Guaranteed Income Supplement, which provide higher levels of support than most disability benefits. For example, the 2017 Canadian Survey on Disability found that senior women with severe disabilities had a median income of $19,520. This is greater than the median income of their working-age counterparts ($17,520).
Source: Statistics Canada, Canadian Income Survey. Note: deep poverty refers to having family disposable income that is less than 75% of the applicable MBM threshold or poverty line amount.
People who depend on benefits
For those who rely on them, government transfers (including benefits like provincial and territorial social assistance, Employment Insurance, the Canada Child Benefit, the Canada Workers Benefit, the Old Age Security and the Guaranteed Income Supplement) play an important role in lifting people out of poverty. However, the adequacy of certain benefits meant to keep people out of poverty has come under question.
Deep income poverty measures the percentage of individuals whose family disposable income is less than 75% of their applicable poverty line amount. According to the Maytree Foundation, 78% of household types eligible for social assistance across provinces would have had total welfare incomes that were below the deep income poverty threshold in 2020. This means that a large proportion of households that rely exclusively on social assistance and other government benefits lived not only in poverty, but in deep poverty.
Although there has been improvement since 2019, many of the improvements in adequacy in 2020 were due to one-off increases from pandemic-related payments, as well as a relatively low inflation rate during this time (Laidley & Tabbara, 2021). The table below highlights the highest and lowest total annual welfare incomes for different household types, the corresponding deep income poverty threshold for the specific geographic area, and the gap between the annual welfare income and deep income poverty:
Source: 2020 Welfare in Canada Report, Maytree Foundation.
*MBM thresholds above may not reflect 2020 official thresholds since the report estimated 2020 thresholds by increasing the 2019 levels in line with the consumer price index for each applicable city. “Welfare income” refers to the total income that households would receive from all government transfers, including provincial and territorial social assistance, refundable tax credits, child benefits and any other social assistance benefits.
The major investment in pandemic response measures caused a significant decrease in poverty rates in Canada, keeping many Canadians from falling into poverty despite the pandemic’s widespread impacts on the labour market and business closures. This is due in large part to the fact that the Canada Emergency Response Benefit (CERB), at $2,000 per month per person, was higher than Employment Insurance, social assistance rates and disability benefits in every province and territory.
However, individuals receiving benefits who did not have employment income above $5000 in 2019 or in the 12 months before applying were not eligible for the CERB. They continued to have higher poverty rates, as the temporary income benefits were designed as income replacement, not as a poverty reduction measure. People who did access the CERB without meeting the eligibility requirements must now repay the Government.
First Nations, Inuit and Métis people living in the territories
According to Statistics Canada, the pandemic has increasingly shed light on the pre-existing socio-economic inequities that affect Indigenous and non-Indigenous people. This includes historically higher prevalence of low income and poverty among First Nations, Inuit and Métis people. The historical and ongoing impacts of colonization, such as barriers to educational and economic opportunities, have perpetuated poverty among First Nations, Métis and Inuit people in Canada. Because of this, they may be reluctant to respond to surveys or to divulge information on their income or identity. As a result, existing estimates may not accurately gauge the socioeconomic barriers they face.
Among First Nations, Inuit and Métis people aged 16 and older living off reserve and outside the territories, about 89,000 (11.8%) were below the poverty line in 2020. This is a decrease of 6.8 percentage points from the 2019 rate (18.6%). Despite this decline, the poverty rate among First Nations, Inuit and Métis people remained approximately double that of non-Indigenous people (6.6%).
The poverty rate among First Nations people living off reserve was 15.2% in 2020, down from 22.8% in 2019. Among Métis, the poverty rate was 9.4%, down from 13.7% in 2019. Estimates for Inuit people could not be published because of a small sample.
Females
Sex and gender identity
“Sex” refers to biological attributes and is typically associated with chromosomes, hormone levels, and reproductive/sexual anatomy. Female, male and intersex are categories of sex. “Gender” refers to socially constructed roles, behaviours, expressions and identities of girls, women, boys, men and gender-diverse individuals. Gender identity is a person’s subjective experience of their own gender. A person’s gender identity may be the same as or different from the sex assigned to them at birth.
The majority of Statistics Canada surveys include a question regarding sex, which refers to sex designation (what is listed on a person’s government identification) rather than gender identity. The exclusion of gender identity questions makes it difficult to accurately measure the size of the transgender and gender-diverse population in Canada. Throughout this report, we use the terms “female” and “male” when referring to data due to limitations in data collection. “Men” and “women” are used when we refer to specific gender challenges. We recognize that the 2 designations are not equivalent.
Content
Female poverty rates have historically lagged behind their male counterparts. In 2020, the poverty rate gap between women (6.4%) and men (6.3%) nearly closed—in 2019, the poverty rates were 10.7 and 9.9 respectively. However, due to the unprecedented events associated with the pandemic, it is premature to draw conclusions based on these results. As we explored in the previous chapter, women have faced a disproportionate economic burden throughout the pandemic.
There are also factors that continue to obscure the poverty situation of females, because the poverty rate is based on household income, not individual income. Some females are living with abusive partners, have little income of their own, and would be in poverty and without access to basic amenities (food, shelter, etc.) if they ended these relationships.
According to the LFS, working females continue to face challenges with unequal pay. Median employee annual hourly wages in 2021 across all industries remained higher for males ($28.00) than for females ($24.40), representing a difference of $3.60 (Statistics Canada, Table 14-10-0064-01). In 2019, Statistics Canada published a study on the gender wage gap in Canada between 1998 and 2018. The study found that the 2 largest factors explaining the remaining gender wage gap in 2018 were the distribution of women and men across industries and women’s overrepresentation in part-time work. These were also the largest explanatory factors behind the gap in 1998 (Pelletier et al., 2019). In the context of the pandemic, women have also been disproportionately affected in the labour market as females frequently took on the caregiving role, which leads to fewer paid hours.
Source: Statistics Canada, Canadian Income Survey.
Source: Statistics Canada, Canadian Income Survey.
2SLGBTQ populations
For the first time, the 2021 Census included a question on gender allowing all cisgender, transgender and non-binary individuals to report this information. This makes Canada the first country to collect and publish data on gender diversity from a national census. This is a significant milestone and a step toward inclusivity.
The census question revealed that, of the nearly 30.5 million people in Canada aged 15 and older living in a private household in May 2021, 100,815 were transgender (59,460) or non-binary (41,355), representing 0.33% of the population in this age group. Proportions of transgender and non-binary people were higher among Generation Z (born between 1997 and 2006, 0.79%) and millennials (born between 1981 and 1996, 0.51%) than for Generation X (born between 1966 and 1980, 0.19%), baby boomers (born between 1946 and 1965, 0.15%) and the Interwar and Greatest Generations (born in 1945 or earlier, 0.12%) (Statistics Canada, 2022d).
However, there remain some challenges that may result in an underreporting. The Census is completed by a single person in each household and this may systemically underrepresent statistics on 2SLGBTQ people. One possible reason for this is that not all transgender and non-binary individuals are out to their family or people they live with and, when they are, there is an increased likelihood that resulting family conflict could lead to an omission by the survey respondent. Transgender and non-binary individuals are also overrepresented in populations experiencing homelessness and these individuals are not included in the Census.
Also, data on 2SLGBTQ populations remain unavailable in the Canadian Income Survey. Because of this, indicators such as poverty rates relative to Canada’s Official Poverty Line continue to be unavailable for these groups on an annual basis, leaving a gap in the data-driven picture of poverty in Canada. Asking inclusive gender questions in the Census is an important first step to getting the data needed to better understand the realities of 2SLGBTQ people. In the meantime, we continue to rely on alternate data sources.
Studies continue to demonstrate that 2SLGBTQ populations face higher poverty rates, especially among individuals who hold multiple marginalized identities. In 2018, 41% of 2SLGBTQ individuals in Canada had a total personal income of less than $20,000 per year, compared with 26% for non-2SLGBTQ (Prokopenko & Kevins, 2020). However, experiences and challenges, including poverty rates and homelessness, vary among 2SLGBTQ individuals, since the 2SLGBTQ population is not a homogeneous group. For example, bisexual individuals are overrepresented in the bottom income quintiles compared to lesbian, gay and heterosexual individuals (Statistics Canada, Table 13-10-0817-01).
A 2020 study concluded that transgender individuals were more likely to live in lower-income neighbourhoods compared to cisgender individuals (Abramovich et al., 2020). The study used administrative health data focused on health outcomes among transgender individuals in Ontario.
2SLGBTQ people also have poorer health outcomes and greater difficulty accessing the healthcare system. Those at the intersection of poverty and 2SLGBTQ face poorer health outcomes than other 2SLGBTQ people in Canada. Discrimination was an overarching finding that explained persistent associations between 2SLGBTQ status, poverty and health (Kinitz et al., 2022).
Children in lone parent families
The poverty rate for children (aged 0 to 17) was reduced by half in 2020—to 4.7%, from 9.4% in 2019. This represents approximately 332,000 fewer children living in poverty in 2020 compared to 2019 and a 71% decrease in the poverty rate from 2015 (16.3%). It is important to note that there was a one-time increase to the Canada Child Benefit in 2020. In addition to the other relief benefits like CERB, that likely played a role in bringing child poverty rates down in the first year of the pandemic. This is expected to be a short-term effect.
Child poverty is family poverty. Certain family types, including lone parent families and single individuals, have historically been at a higher risk of being in poverty than other family types. In 2020, the poverty rate for children in lone parent families dropped to 15.1% compared to 25.1% in 2019. Although the poverty rate dropped for this group, children in lone parent families remained at a much higher risk of living in poverty. Moreover, children living in female-led lone parent families continued to be more vulnerable to poverty (16.9%) than children living in couple families (3.0%) in 2020.
| Age | Number in poverty | Poverty rate |
|---|---|---|
| 0 to 5 | 104,200 | 4.5% |
| 6–12 | 137,200 | 4.8% |
| 13–17 | 91,200 | 4.8% |
| All | 332,600 | 4.7% |
Source: Statistics Canada, Canadian Income Survey.
| Age | Number in poverty | Poverty rate |
|---|---|---|
| 0 to 5 | 44,200 | 5.6% |
| 6-12 | 67,000 | 7.2% |
| 13-17 | 40,000 | 6.9% |
| All | 151,200 | 6.6% |
Source: Statistics Canada, Canadian Income Survey.
Children in care
There is little national data on people who have aged out of the child welfare system. Research from 2014 found that over 40% of youth experiencing homelessness in Canada have been involved with child welfare services, including foster care and group homes. This includes foster youth who:
- have aged out of the system
- those who left their placement due to negative experiences
- youth who returned home or went to live with immediate or extended family members (Gaetz, 2014)
A 2017 report prepared for Ontario’s Office of the Provincial Advocate for Children found that typical outcomes for youth who age out of care include:
- low academic achievement
- unemployment or underemployment
- homelessness and housing insecurity
- criminal justice system involvement
- early parenthood
- poor physical and mental health
- loneliness
The report also found that approximately 44% of children in care in Ontario complete high school (compared to an overall average of 81%). As many as 90% of children and youth in care may be on welfare within 6 months of aging out (Kovarikova, 2017).
We also know that some groups made most marginal remain overrepresented in foster care, such as First Nations, Inuit and Métis children and youth. As noted in our previous report, and according to the 2016 Census, 52.2% of children under 14 in foster care were First Nations, Inuit and Métis. New data and analysis on First Nations, Métis and Inuit people from the 2021 Census will be published in late 2022.
Despite the lack of data, we heard from a number of stakeholders and people with lived expertise of the child welfare system of the many challenges for children who are transitioning from care to adulthood. Many people described the child welfare system as a pipeline to both homelessness and poverty. They described a deep sense of homelessness for kids making those transitions. These first-hand experiences are shared in the “what we heard” chapter.
Single seniors
Supported by pandemic transfers provided through OAS and GIS and other emergency benefits for which they may have been eligible, seniors (aged 65+) also faced a lower incidence of poverty in 2020. The poverty rate among seniors decreased to 3.1% in 2020, compared to 5.7% in 2019. This represents 162,000 fewer seniors living in poverty in 2020 compared to 2019. Overall, this also represents a 56% decrease in the poverty rate from 2015, which was estimated at 7.1%.
Poverty reduction has not been equal among all seniors. Although the reduction was significant, single seniors continue to have higher poverty rates than those living in families. Among seniors living in families, the poverty rate fell from 3.3% in 2015 to 1.3% in 2020, while among single seniors, the poverty rate fell from 16.9% in 2015 to 7.4% in 2020.
Single female seniors living in poverty continue to outnumber single senior men. In 2015, 66% of all single seniors in poverty were women, decreasing slightly to 64% in 2020. The overrepresentation of single senior women is driven to a large extent by demographic factors, since the population of single female seniors outnumbers the population of single senior men.
Among the senior population, belonging to a racialized group also increases the risk of living in poverty. In 2020, the poverty rate of racialized seniors was estimated at 4.4% (representing 44,000 seniors), while the rate for non-racialized seniors was estimated at 2.9% (representing 163,000 seniors).
People involved in the criminal justice system
There is a lack of current statistics linking poverty and involvement in the criminal justice system. However, the sources that are available indicate that there is a high correlation between living in poverty and being incarcerated. Many people who have been incarcerated face multiple challenges, including low literacy, unemployment, a history of homelessness and/or mental health challenges.
Populations made most marginal face additional challenges within the criminal justice system. Most recently, a 2022 Auditor General report found that overall, Correctional Service Canada failed to address and eliminate the systemic barriers that persistently disadvantaged certain groups of offenders in custody that we identified in previous audits. It also failed to develop a plan for its workforce to better reflect the diversity of the offender population. As a result, Indigenous and Black offenders faced greater barriers to a safe and gradual reintegration into society than other incarcerated groups. The report also found that:
- disparities are present from the moment offenders enter federal institutions. The process for assigning security classifications—including the use of the Custody Rating Scale and frequent overrides of the scale by corrections staff—results in disproportionately high numbers of Indigenous and Black offenders being placed in maximum-security institutions. While the majority of offenders were released on parole before the end of their sentences, Indigenous and Black offenders remained in custody longer and at higher levels of security before release
- correctional programs are designed to prepare offenders for release on parole and support their successful reintegration into the community. Timely access to these programs was a problem for offenders. Correctional Service Canada had not adequately addressed this long standing situation. Access to programs declined even further during the pandemic. Of men serving sentences of 2 to 4 years who were released from April to December 2021, 94% had not completed the correctional programs they needed before they were first eligible to apply for day parole. This is a barrier to serving the remainder of their sentences under supervision in the community
- Correctional Service Canada’s efforts to support greater equity, diversity, and inclusion in the workplace fell short. Persistent barriers remain unresolved. Close to one quarter of management and staff had not completed mandatory diversity training a year after its deadline. Other issues include:
- Indigenous representation gaps among correctional officers across institutions
- Black representation gaps among program and parole officers at institutions with a high number of Black offenders
- gender representation gaps among correctional officers at women’s institutions
Progress on multiple dimensions of poverty
Summary of additional poverty indicators
Indicators transitioning to the Canadian Income Survey
Food insecurity and unmet healthcare needs were designated as key indicators in Opportunity for All – Canada’s First Poverty Reduction Strategy. Previously, food insecurity estimates were produced using various sources, including the Canadian Community Health Survey (CCHS), the Longitudinal International Study of Adults (LISA), and the Aboriginal Peoples Survey (APS).
Since 2019, for the reference year 2018, food insecurity and unmet healthcare needs estimates have been reported using data from the annual Canadian Income Survey.
Content
Despite a notable drop in overall poverty rates in 2020, half of the indicators of poverty in the dashboard have stayed the same or worsened since tracking began, including the following indicators:
- unmet housing needs
- chronic homelessness
- unmet healthcare needs
- food insecurity
- low literacy and numeracy
- median hourly wages
At this time, data limitations make it difficult to track and assess trends across all indicators for different groups made most marginal. Previous reports from the Council have outlined this disparity and sought to remediate data gaps through their recommendations. Although the breadth of data has increased and disaggregation on some racialized groups is available, significant gaps remain and creative solutions are needed.
Unmet housing needs
Housing is a basic human right and requirement for good health. According to the United Nations’ Universal Declaration on Human Rights, the right to housing is protected under international law, and Canada has endorsed such rights.
According to available census data, the proportion of households in core housing need increased slightly from 12.5% in 2011 to 12.7% in 2016. The most recent data are from 2016, with an update coming when the 2021 Census data is published in late 2022 (not available in time for this report). However, additional data on housing and homelessness is available through the 2018 Canadian Housing Survey (CHS). Published in 2020, the Survey sheds light on housing needs and experiences of Canadian households.
Unaffordable housing
Findings from the 2018 CHS showed that almost one-third (31%) of Canadian households lived in an inadequate or unaffordable or unsuitable dwelling and that approximately one-tenth (11.6%) were in core housing need Footnote 1. One-person households were more likely to be in core housing need (22%) than households with more than one person (less than 10%) . Households whose dwelling needed adaptations because a member of the household had a physical or mental disability, condition or illness had a higher risk of being in core housing need (21%) than households whose dwelling did not need adaptations (11%) (Claveau, 2020).
Social housing
Findings from the 2018 CHS also showed that renter households in social and affordable housing were largely living in one-person households (58%), and that women made up a higher proportion of renters than men in social and affordable housing overall (56% vs 44%). Meanwhile the racialized population (40%) and First Nations, Inuit and Métis peoples (9.4%) were overrepresented among renter households in social and affordable housing (Claveau, 2020).
Over one-tenth (13%) of reference persons of households living in social and affordable housing reported having experienced homelessness in the past—living in a homeless shelter, on the street, in parks, in a makeshift shelter or in an abandoned building in Canada (Claveau, 2020).
Housing and homelessness among groups made most marginal
Higher rates of homelessness among First Nations, Inuit and Métis communities are well documented and are associated with:
- systemic barriers to employment and education
- racial discrimination in the housing market
- the intergenerational effects of colonization and residential school experiences
In 2018, among Indigenous people responsible for housing decisions within their households, about 12% of the off-reserve First Nations population, 10% of Inuit and 6% of Métis people said that they had experienced unsheltered homelessness in the past. The corresponding proportion for non-Indigenous people was 2% (Statistics Canada, 2022b).
Sexual minorities were also at greater risk of unsheltered homelessness. In particular, among women responsible for housing decisions within their household, almost 8% of those with minority sexual orientations had experienced unsheltered homelessness in the past, compared with 2% of their heterosexual counterparts. Several factors could explain these results, including increased rates of family violence, discrimination and victimization (Statistics Canada, 2022b).
Food insecurity
This indicator measures the percentage of Canadians without enough money to purchase or access a sufficient amount and variety of food to live a healthy lifestyle. According to Canadian Income Survey data, food insecurity in Canada increased from 10.8% in 2019 (3.98 million) to 11.2% in 2020 (4.14 million) Footnote 2. This represents about 160,000 more people reporting food insecurity. Some groups face a higher risk of food insecurity—for example, people in lone-parent families (27.3%) and single people (14.4%).
Severe food insecurity has also risen in Canada, from 3.2% in 2019 to 3.6% in 2020. Among single people aged 65+, the rate increased from 1.7% in 2019 to 2.3% in 2020. Single people under age 65 continue to face a high severe food insecurity rate at 7.4% in 2020, which is more than twice the 2020 national rate.
High inflation rates experienced in 2021 and 2022 have increased the cost of living for many Canadian families and can be expected to increase food insecurity rates in 2021 and beyond.
Core housing need, food insecurity and poverty
To better understand the populations that are at the crossroads of low income, housing need and food insecurity, we have examined the intersections of the populations living below Canada’s Official Poverty Line who also report food insecurity and situations of core housing need. People experiencing all 3 of these are likely to be made most marginal.
The diagram below shows how these populations intersect using 2020 CIS data Footnote 3 :
5.17 Infographic: Intersections of Canadians reporting poverty, food insecurity and core housing need (% of Canada’s population), 2020

Source: Statistics Canada, Canadian Income Survey.
Text version – 5.17 Infographic
Overlapping circles show the number of people who report experiencing poverty, core housing need and food insecurity – either all 3 at the same time, 2 at the same time, or just one of them.
Source: Statistics Canada, Canadian Income Survey.
*Percentage values reflect the proportion of each group relative to the total population.
As shown, an estimated 387,000 Canadians fell under the poverty line and experienced both food insecurity and core housing need, representing 1% of the total population and 16.4% of the total population in poverty according to the Official Poverty Line (MBM).
A total of 709,000 people lived in poverty and core housing need only, representing 1.9% of the total population and 30.1% of the total population living in poverty. There were 273,000 people living in poverty and food insecurity only, representing 0.7% of the total population and 11.6% of the total population living in poverty.
People at the intersection of poverty, food insecurity and core housing need
Single non-senior people and people in single parent families were more likely to be represented at the intersection of poverty, food insecurity and core housing need than other family types in 2020 (40.8% and 22.8% respectively), compared to their shares of the overall population. In contrast, non-senior couples with children or without children were underrepresented at the intersection of the 3 indicators (14.3% and 8.4% respectively), compared to their proportion of the overall population.
5.18 Graph: Proportion of selected family types at the intersection of poverty, food insecurity and core housing need vs. their proportion of the total population, 2020
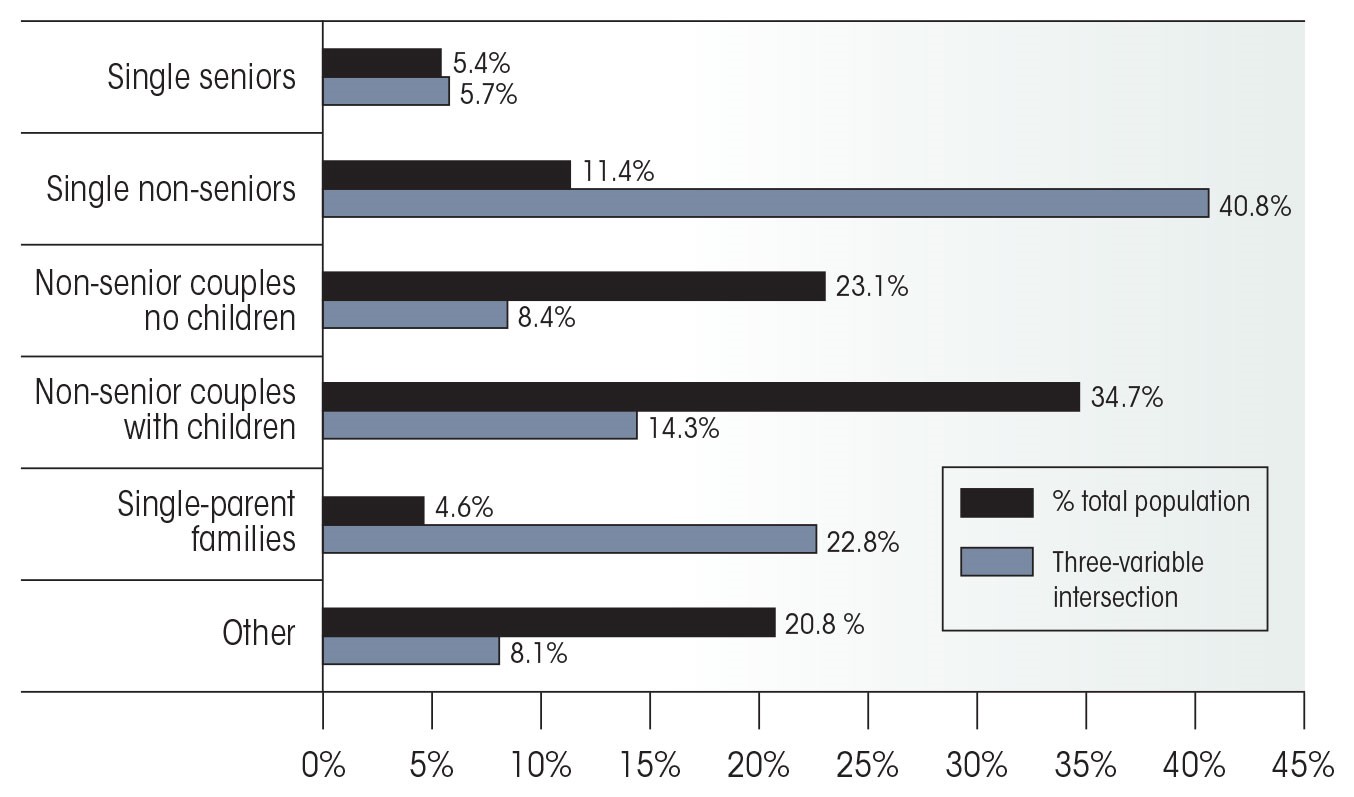
Source: Statistics Canada, Canadian Income Survey.
Text version – 5.18 Graph
People aged 25 to 64 were overrepresented in the intersection group compared to their share of the overall population (62.2% vs. 54.1%). This was also the case for individuals reporting being in poverty and food insecurity only (65.9%).
In general, seniors (65+) were underrepresented in the intersection group compared to their share of the total population (7.5% vs. 17.9%). However, seniors more frequently reported being in core housing need only relative to their share of the total population (34.7%).
Children (aged 0-17) and young adults (aged 18-24) were proportionally represented in the intersection group.
5.19 Graph: Proportion of selected age groups at the intersection of poverty, food insecurity and core housing need vs. their proportion of the total population, 2020
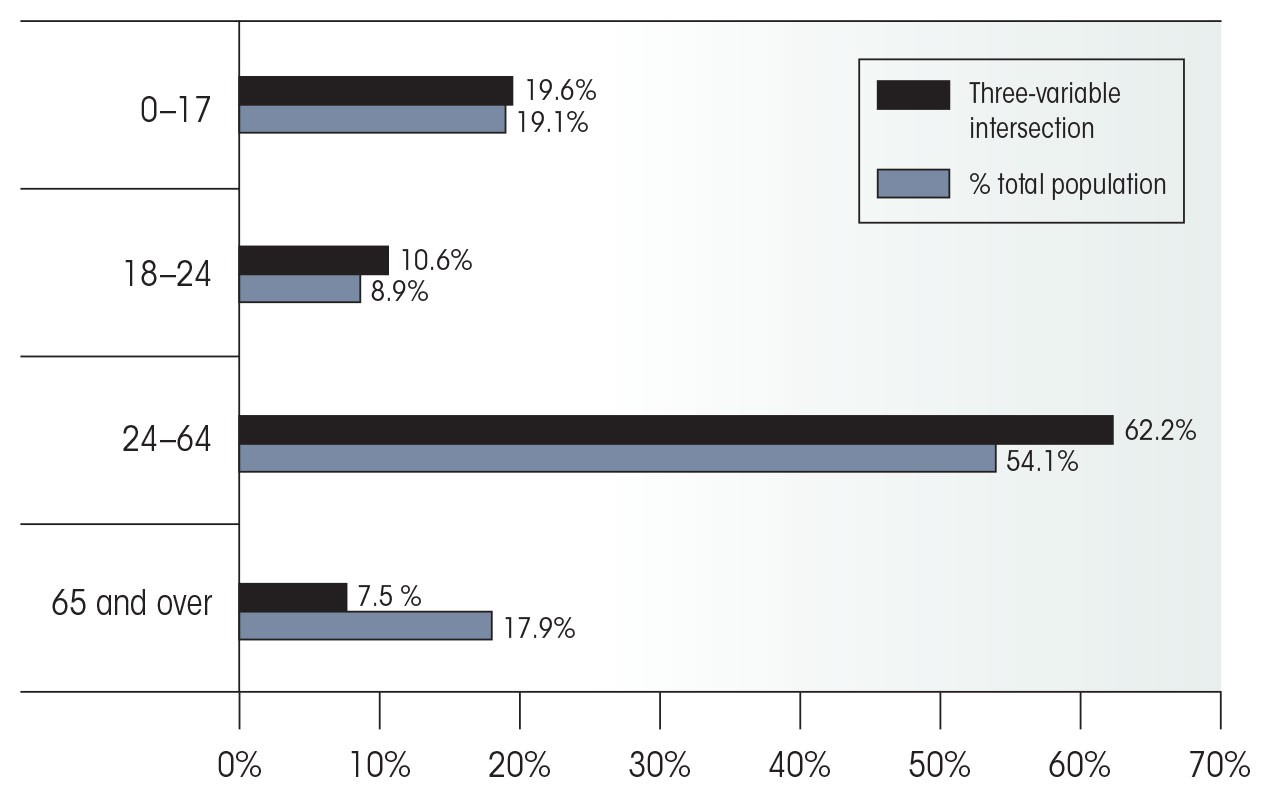
Source: Statistics Canada, Canadian Income Survey.
Text version – 5.19 Graph
| Characteristics | Percentage of total population | Percentage at 3-variable intersection |
|---|---|---|
| Ages 0 to 17 | 19.1% | 19.6% |
| Ages 18–24 | 8.9% | 10.6% |
| Ages 24–64 | 54.1% | 62.2% |
| Ages 65+ | 17.9% | 7.5% |
A look at the gender breakdown of people in the intersection group shows a slight overrepresentation of females compared to males (51.5% vs. 48.5%), compared to their share of the overall population (50.4% vs. 49.6%). A stronger overrepresentation of females was observed among people in core housing need and food insecurity who were not living below the Official Poverty Line (60.9% vs 39.1%).
Unmet health needs
This indicator measures the percentage of Canadians reporting that their healthcare needs were not met during the previous 12 months. Progress on this indicator means that more Canadians are able to receive healthcare when they need it.
The onset of the pandemic in 2020 made access to the healthcare system difficult for many population groups. Healthcare resources diverted to contain the pandemic and pandemic restrictions made it more difficult to access in-person healthcare services. According to data from the CIS, the population reporting unmet health needs increased to 7.2% in 2020, from 6.1% in 2019. The increase was larger for females than for males, moving from 5.3% to 6.3% for males and from 6.8% to 8.1% for females between 2019 and 2020. Females aged 25 to 34 reported the highest rate of unmet health needs, rising from 8.1% in 2019 to 10.2% in 2020.
It is important to note that the pandemic made 2020 a particularly difficult year to measure access to the healthcare system. Restrictions meant to reduce potential strains to emergency facilities limited access to the healthcare system for many Canadians. Data from subsequent years are required to provide a more accurate longer-term picture of broad healthcare system access during the pandemic.
Literacy and numeracy
The literacy and numeracy indicator measures the proportion of individuals who have a level of knowledge and skills in reading, writing and mathematics permitting them to participate fully in society. Strong literacy and numeracy skills significantly reduce the chances of falling into poverty.
In Canada, low literacy and numeracy has risen for 15-year-olds, moving respectively from 10.7% in 2015 to 13.8% in 2018 and from 14.4% in 2015 to 16.3% in 2018. There are also concerns about the impact of the pandemic on literacy and numeracy on youth as a result of school disruptions. However, these impacts may only be observable as more data become available in the next few years.
Median hourly wages
A meaningful discussion of median hourly wages is difficult for 2020. The extreme circumstances of the pandemic caused a significant decrease in hours worked for many people, which affects statistics on income distribution. The impact of the pandemic on market incomes is covered in the previous chapter.
Chapter 6 - Recommendations
In this third report on progress, we’ve decided that it is important to reiterate some of our previous recommendations. We feel strongly that the recommendations made in our first 2 reports will not only help the Government of Canada reach its overall poverty reduction goals, but also help to build a more equitable and just society. We have focussed on efforts that will help reach those who have been made most marginal. The recommendations seek not just to move people above Canada’s Official Poverty Line, but to create a society where all people are supported before they are in crisis. They seek to build an environment where people can thrive, not merely survive. Some of our recommendations remain largely unchanged from previous reports and we have made other recommendations more specific or precise.
We also did not shy away from recommendations that require bold, systemic change. We recognize that some will require creative solutions, but believe they are too important to ignore. We have heard about deep systemic challenges that require overhauling and the misalignment of the various systems that make up the social safety net. They often leave those made most marginal to fend for themselves and fall through the cracks. We are calling on all levels of government to work together to address these issues to bring about much needed change and to support people before they are in crisis. We know this is possible. The recent Early Learning and Child Care agreements provide a great example of governments working together to improve our systems.
We have listened to people with lived expertise in poverty and to stakeholders working in the field to learn from their first-hand experience. We have also examined the data from the first year of the pandemic to understand its impact and the associated responses. All of this informs our recommendations.
Groups made most marginal
Throughout this report, we refer to a number of populations that are underserved, made most marginal and overlooked and that face high levels of discrimination, racism and stigma. These include First Nations, Inuit and Métis communities; immigrants; refugees; individuals who identify as members of ethno-cultural, Black and other racialized communities; 2SLGBTQ people; people with disabilities; people experiencing homelessness; children and youth in care; people living in institutions; people involved in the criminal justice system; women; and people living in remote areas. When we refer to groups made most marginal, these are the people to whom we are referring.
1. Poverty reduction with First Nations, Inuit and Métis people
The ongoing impacts of colonialism, racism and discrimination continue to play a role in the disproportionately high rates of poverty among First Nations, Inuit and Métis people in Canada. During our engagement, we heard that they are forced to navigate systems that are not culturally appropriate or trauma-informed and do not reflect their realities. The result is often further marginalization and discrimination.
The Government of Canada has made commitments to resolve past and present injustices and inequities through a nation-to-nation, government-to-government and Inuit-Crown relationship with First Nations, Inuit and Métis peoples. Based on these principles, the following collaborative work is ongoing:
- co-developing Indigenous indicators of poverty
- co-developing an Urban, Rural and Northern Indigenous Housing Strategy
- co-developing a First Nations Data Governance Strategy
- increasing funding for trauma-informed and culturally appropriate Indigenous-led mental health services
- resourcing Indigenous child welfare laws, specifically An Act respecting First Nations, Inuit and Métis children, youth and families
- providing compensation for the legacy of harms to Indigenous children and families
The calls to action of the Truth and Reconciliation Commission of Canada and the calls to justice from Reclaiming Power and Place: The Final Report of the National Inquiry into Missing and Murdered Indigenous Women and Girls, respectively, also provide blueprints for concrete action to further truth, reconciliation and justice. Many of the calls to action directly and indirectly relate to poverty among First Nations, Inuit and Métis people.
Despite the breadth of government commitments, progress remains slow and poverty rates remain very high compared to the general population. It is also difficult to evaluate progress without regularly available and adequately disaggregated data on First Nations on- and off-reserve, Inuit and Métis communities across Canada. Urgent action is required to ensure that First Nations, Inuit and Métis people benefit equitably from all current and future progress in poverty reduction. The Council also recognizes that any program and policy design and implementation must be co-developed with First Nations, Inuit and Métis people. For this reason, we hesitate to recommend specific actions. Instead we have focussed on the principles of reconciliation and co-development, and calling for immediate implementation of the calls to action that have already been developed. Reaching Canada’s 2030 poverty reduction goals means reaching them for everyone, but especially for those who have been made most marginal through systemic discrimination and colonialism. To this end, the Council recommends that:
- the Government of Canada urgently implement the calls to action from the Truth and Reconciliation and the calls for justice from Reclaiming Power: The Final Report of the National Inquiry into Missing and Murdered Indigenous Women and Girls
- the Government of Canada re-commit to co-development of any new and existing poverty reduction measures
- the Government of Canada continue to work with First Nations, Inuit and Métis people to improve data collection to allow for the evaluation of poverty reduction investments and supports for Indigenous people. In particular, this can help to provide a baseline to evaluate new measures, including Bill C-92, An Act respecting First Nations, Inuit and Métis children, youth and families
2. Establishing an income floor above Canada’s Official Poverty Line
Inadequate income is a major driver of poverty, whether that income derives from work, government benefits or supports, or some combination of the 2. During our engagement, we heard from people with lived expertise of poverty about the fear and stress of not having enough money to make ends meet. With record inflation, the cost of housing, food and other necessities keeps going up, but wages and assistance rates do not.
Many participants said that work is no longer a guaranteed pathway out of poverty. This is especially true for precarious, low-paying jobs without benefits. We also heard that current levels of social assistance and income supports fail to lift people above Canada’s Official Poverty Line. Instead, many people expressed that inadequate supports trap people in poverty, through unintended program consequences and interactions, and clawbacks that seem to punish them when they try to get ahead.
The Government of Canada has made investments and commitments that will help address these issues. This includes mandating a $15-dollar minimum wage for all federally regulated workplaces, expanding the Canada Workers Benefit to extend support to an additional million people, and announcing plans for a Canada Disability Benefit, which would provide income and employment supports to working-age people with disabilities. However, as the cost of living continues to rise, we need accelerated action to lift groups with the highest rates of poverty above the Official Poverty Line.
During our engagement we heard many proposed solutions, including living wage, basic income, increases to existing programs or a combination of some or all of them. What they all had in common was the critical need to establish an income floor above the Official Poverty Line. At the same time, it is vital that we address indicators of poverty beyond income. Programs that assist with housing, food security, skills training, physical and mental healthcare and other essential services all contribute to poverty reduction and quality of life. Adequate income is essential, but it should go hand in hand with wraparound non-income supports. To this end, the Council recommends that:
- the Government of Canada work with the provinces and territories to establish an income floor above Canada’s Official Poverty Line by 2030, whether it be through employment income, income supports including social assistance, new or existing targeted supports, or a combination of the 3
We also recommend that:
- the Government of Canada lead by example by working to establish a living wage in all federally regulated workplaces by 2030
- the Government of Canada introduce worker protections through the Canada Labour Code to address precarious work
- the Government of Canada accelerate and expand existing work on targeted benefits and supports for populations with disproportionately high rates of poverty. For example, the Government of Canada should accelerate work on the Canada Disability Benefit and ensure it provides income and employment supports that prevent people with disabilities from falling below the Official Poverty Line. The Government of Canada should also consider targeted supports for other high-risk and underserved populations, for example, youth from care
- the Government of Canada strengthen existing and new benefits and supports that assist with and improve housing, food security, physical and mental health, employment and skills training, and other indicators of poverty beyond income. Both income and non-income supports have an essential role to play in sustainable poverty reduction and improved quality of life
3. Reducing poverty by at least 50% by 2030 for populations made most marginal
The Government of Canada’s target of a 50% reduction in poverty by 2030 is aligned with the United Nations Sustainable Development Goals. The Agenda for Sustainable Development includes a commitment to “leave no one behind” and “reach the furthest behind first.” While the overall poverty rate has decreased significantly since 2015, this progress has not been equal. Some groups continue to face disproportionately higher levels of poverty than the general population.
Many of these groups are also underrepresented or missing entirely from official poverty data. The collection, analysis and application of inclusive and disaggregated data on populations made most marginal play a key role in developing targeted, evidence-based policies and programs that will help reduce inequity in poverty reduction. Disaggregated data should also be widely accessible, to allow for information sharing and data linkages across government and community-based organizations, and accountability to the public.
The Government of Canada has committed to the implementation of the Disaggregated Data Action Plan, which seeks to fill data gaps on children and youth, gender and sexual orientation, immigrants, First Nations, Inuit and Métis people, people with a disability, seniors and racialized individuals. Some progress has been made as part of this effort. For instance, the 2021 Census added inclusive question and response options on gender and sex, while the Labour Force Survey and the Canadian Income Survey have begun collecting and publishing disaggregated data on racialized populations. However, many data gaps persist, making it difficult to assess our progress in reaching the 2030 poverty reduction targets for populations made most marginal. Urgent action on data disaggregation is needed so targeted policies can address gaps and lift those furthest behind out of poverty before 2030. Drawing on our previous recommendations, the Council recommends that:
- the Government of Canada commit to reducing poverty by at least 50% relative to 2015 levels by 2030 for all populations made most marginal
To this end, we recommend:
- the Government of Canada commit to developing and resourcing a plan to reduce current inequalities in poverty
- the Government of Canada accelerate the collection, analysis, application of and access to disaggregated data for all groups made most marginal to support evidence-based decision making and reporting of disparities. For example, Statistics Canada should accelerate work to introduce inclusive gender and sex questions and response options to key data sources on socioeconomic conditions, such as the Labour Force Survey and the Canadian Income Survey
4. Early intervention and prevention of child and youth poverty
Adverse childhood experiences significantly influence the trajectory of an individual’s life, including educational attainment, employment prospects, future health and wellbeing, and interactions with the criminal justice system. The trauma associated with child and youth poverty can last a lifetime and be passed on to subsequent generations. Ending child and youth poverty now can help stop the cycle of intergenerational poverty.
During our engagement, we heard that young people are particularly vulnerable to the disruptions caused by the pandemic. This is especially true of specific cohorts of children and youth from populations with the highest rates of poverty. Children and youth in these groups already face intersecting barriers to full inclusion in society. The potentially long-term impact of delays in development and education, large declines in youth employment and mental health challenges will compound their vulnerability to poverty.
The Council recognizes that the Government of Canada has made significant progress in reducing the overall rate of poverty for children and youth under 18. In 2015, the child poverty rate was 16.3%; in 2020, it dropped to 4.7%. Targeted programs such as the Canada Child Benefit and the creation of a nationwide Early Learning and Child Care System will both continue to have a positive impact on child and youth poverty. Access to affordable, high- quality early learning and child care supports parents, and mothers in particular. It is key to advancing gender equality, given that the responsibility of caring for children falls disproportionately to women. This responsibility can impact their ability to participate in paid work or go to school.
Despite the significant investment in children and families and the relatively low rate of poverty for children, there remain some children who are at high risk of living in poverty and the adverse outcomes associated with growing up in poverty. Throughout the engagement process, we heard about specific cohorts of children and youth who are made most marginal and who remain more likely to live in poverty. These are also the children and youth who were most likely to face negative impacts from the pandemic. These include 2SLGBTQ youth, racialized children and youth; First Nations, Inuit and Métis children and youth; youth in rural and remote areas; children in lone-parent families; children and youth in and from care; children and youth with disabilities; children of parents with severe mental illness; children exposed to abuse or intimate partner violence; children and youth whose parents have precarious immigration status; and children and youth whose parents are involved in the criminal justice system. Children in families with multiple vulnerabilities are particularly at risk for adverse outcomes and intergenerational poverty.
Recognizing that children and youth are often poor because their families are poor, supports for children must reach families made most marginal. Policies and programs aimed at early intervention with specific targets for at-risk groups can help support their healthy transition into adulthood, and to reduce the intergenerational impact of poverty. Holistic wraparound supports that involve families, schools, healthcare providers and communities are essential to create strong and safe environments, helping to avoid crises and trauma in the first place. No child should ever be taken from their family because of poverty. Supports also need to be in place for children and youth who do not have family support, including those experiencing abuse, those who have been rejected by their families and those in care. Children and youth currently experiencing poverty need individualized, supportive and sustainable pathways out of poverty. To this end, the Council recommends that:
- the Government of Canada identify children and youth most at risk of the intergenerational impacts of poverty and address these impacts through benefits and programs focused on early intervention and prevention
Drawing on the United Nations Committee on the Rights of the Child’s recommendations for Canada, the Council endorses that:
- the Government of Canada establish an independent national commissioner for children and youth. The role of the commissioner would be to focus on children and youth who are made most marginal. Their role could include:
- identifying which children and youth are most at risk of poverty and why they are at risk
- bringing the voices of those with lived expertise in poverty to the design and development of supports and services for children and youth
- ensuring that the rights of children and youth are considered and protected in all federal policies, services, laws and practices
- examining some of the structures that are placing children and youth at high risk, in order to keep them from falling through the cracks
5. Increasing awareness of, access to and availability of government benefits and supports
Due to the intersectional nature of poverty, individuals and families often rely on numerous benefits, supports and services, provided by different levels of government and the non-profit sector. Usually each of these benefits, services and supports has its own application process. In other words, there is not a single entry into “the social safety system.” Furthermore, the application forms are complicated and often require supporting documents, and additional appointments and fees are frequently necessary to get these documents. Finally, income testing is often required to confirm eligibility, which requires individuals and families to file personal income tax each year. In short, during our engagement, we heard that our current social safety net is complex, difficult to access, inefficient, outdated and inadequate. Navigating this fragmented and complicated maze can be traumatizing for people who have already been made most marginal in society.
This presumes that people are aware of and understand the benefits, supports and services available. However, lack of understanding, misinformation and fear of clawbacks, among other things, may dissuade people from initiating the application process to begin with.
Many people spoke of the discrimination built into our systems. The social safety net was designed for a specific type of person and does not reflect the diverse needs of populations today. Services are not always culturally appropriate or trauma-informed. Systemic discrimination prevails—racism, colonialism, ageism, sexism, homophobia and transphobia. We heard repeatedly that those who rely on these supports do not feel that they have meaningful input in their design or implementation. This further strips people of agency over their own lives.
Many community-based organizations try to help individuals and families navigate the system to access the benefits and supports they require. There needs to be better integration of community-based organizations with the formal health and social care systems. However, we heard from countless organizations that they lack the financial capacity to provide this resource to the extent that it is needed. Funding is often short-term and project-based.
The Government of Canada has made a number of commitments and investments to reduce barriers to accessing benefits and supports. The Reaching All Canadians initiative works to increase benefit uptake among Canadians made most marginal through interventions such as proactive enrollment, bundling services and form simplification. Automatic enrollment was introduced for Old Age Security, followed by automatic enrollment for the Guaranteed Income Supplement based on income tax filing. Service Canada employs citizen service officers who provide in-person or virtual support to clients who face barriers to accessing services and those with complex needs.
Despite this progress, very real barriers remain for populations made most marginal. The most recent report form the Office of the Auditor General found that there is not “an approach for ensuring a seamless service experience for hard to reach clients accessing certain benefits.” The report also noted that without a comprehensive action plan the Government of Canada will continue to struggle to reach the populations it is targeting.
The long-term solution should be to redesign our social safety net to be inclusive, to provide adequate income and non-income supports, and be able to withstand unexpected social, economic, health and natural shocks. At the same time, immediate action is required to help those currently living in poverty, or at risk of falling into poverty, to access benefits and supports. Building on our previous recommendations, the Council recommends that:
- the Government of Canada increase awareness of, access to and availability of government benefits and supports as an essential tool in poverty reduction. The Government of Canada should also increase investments in sustained, core funding for non-profit and community-based organizations that support Canadians living with low incomes, including those that (could) serve as systems navigators for individuals and families trying to access government benefits and supports
We also recommend that:
- the Government of Canada increase the incidence of tax filing through automatic tax filing for Canadians with low incomes, followed by implementation of automatic enrolment in other benefits and programs, particularly those that are income-tested
- the Government of Canada put people with lived expertise of poverty at the centre of design, implementation and evaluation of its policies, programs and services. Populations made most marginal should be included in the development, design and review of supports that meet their specific challenges and needs
References
- Abramovich, A., Pang, N., Moss, A., Logie, C.H., Chaiton, M., Kidd, S., & Hamilton, H. (2021, September 21). Investigating the impacts of COVID-19 among LGBTQ2S youth experiencing homelessness. PLoS One, 16(9):e0257693. https://doi.org/10.1371/journal.pone.0257693
- Abramovich, A., de Oliveira, C., Kiran, T., Iwajomo, T., Ross, L. E., & Kurdyak, P. (2020). Assessment of Health Conditions and Health Service Use Among Transgender Patients in Canada. JAMA Network Open 3(8):e2015036. https://doi.org/10.1001/jamanetworkopen.2020.15036
- Campaign 2000. (2022, February 4). February 7, 2022: CERB Amnesty Day of Action. https://campaign2000.ca/cerb-amnesty-day-of-action/
- Canadian Union of Public Employees. (2020, September 16). COVID-19’s impact on Indigenous, Black and racialized communities. https://cupe.ca/covid-19s-impact-indigenous-black-and-racialized-communities
- Claveau, J. (2020, October 2). The Canadian Housing Survey, 2018: Core housing need of renter households living in social and affordable housing. Income Research Paper Series (Catalogue no. 75F0002M). Government of Canada, Statistics Canada. https://www150.statcan.gc.ca/n1/pub/75f0002m/75f0002m2020003-eng.htm
- Cost, K. T., Crosbie, J., Anagnostou, E. et al. (2022, April). Mostly worse, occassionally better: impact of COVID-19 pandemic on the mental health of Canadian children and adolescents. Eur Child Adolesc Psychiatry 31. https://doi.org/10.1007/s00787-021-01744-3
- Cullen, C. (2020, December 14). CRA sent 441,000 ‘education letters’ to Canadians who may have to repay CERB benefits. CBC News. https://www.cbc.ca/news/politics/cerb-covid-coronavirus-pandemic-1.5840550
- Department of Finance Canada. (2022, April 7). Budget 2022: A Plan to Grow Our Economy and Make Life More Affordable. Government of Canada. https://budget.canada.ca/2022/home-accueil-en.html
- Department of Finance Canada. (2021, June 30). Government expands Canada Workers Benefit to support one million more Canadians [News release]. Government of Canada. https://www.canada.ca/en/department-finance/news/2021/06/government-expands-canada-workers-benefit-to-support-one-million-more-canadians.html?msclkid=eb765185c6fa11ec87d412d9531e5998
- Employment and Social Development Canada. (2021, July 7). Date announced for $500 one-time payment, and Old Age Security to be automatically increased by almost $100 over the coming year [News release]. Government of Canada. https://www.canada.ca/en/employment-social-development/news/2021/07/date-announced-for-500-one-time-payment-and-old-age-security-to-be-automatically-increased-by-almost-100-over-the-coming-year.html?msclkid=255194f3c6fe11ecab052915735fc5b8
- Gaetz, S. (2014). Coming of Age: Reimagining the Response to Youth Homelessness in Canada. Canadian Observatory on Homelessness: The Homeless Hub. https://homelesshub.ca/comingofage
- Government of Canada. (2021). Social inequalities in COVID-19 deaths in Canada. https://health-infobase.canada.ca/covid-19/inequalities-deaths/index.html
- Kinitz, D. J., Salway, T., Kia, H., Ferlatte, O., Rich, A. J., & Ross, L. E. (2022, February). Health of two-spirit, lesbian, gay, bisexual and transgender people experiencing poverty in Canada: a review. Health Promotion International 37(1). https://doi.org/10.1093/heapro/daab057
- Kovarikova, J. (2017, April 24). Exploring Youth Outcomes After Aging-Out of Care. Office of the Provincial Advocate for Children and Youth. https://cwrp.ca/sites/default/files/publications/en/report-exploring-youth-outcomes.pdf
- Labour Market Information Council. (2021, March). Women in Recessions: What Makes COVID-19 Different? LMI Insight Report no. 39. https://lmic-cimt.ca/publications-all/lmi-insight-report-no-39/
- Laidley, J., & Tabbara, M. (2021, December). Welfare in Canada, 2020. Maytree. https://maytree.com/wp-content/uploads/Welfare_in_Canada_2020.pdf
- McKenzie, K. (2021, April 7). Socio-demographic data collection and equity in COVID-19 in Toronto. The Lancelet, 34(100812). https://doi.org/10.1016/j.eclinm.2021.100812
- Mental Health Commission of Canada. (2020). Lockdown Life: Mental Health Impacts of COVID-19 on Youth in Canada. Government of Canada, Health Canada. https://www.mentalhealthcommission.ca/wp-content/uploads/drupal/2021-02/lockdown_life_eng.pdf
- Mokaya, M. (2022, May 20). Consumers Feel the Pinch of Higher Prices. The Conference Board of Canada. https://www.conferenceboard.ca/insights/featured/canadian-economics/consumers-feel-the-pinch-of-higher-prices?utm_source=ec&utm_medium=email&utm_campaign=EQT22MAY20&mkt_tok=MDk0LUVHRi02MzkAAAGEgWZ7lrM7taALTbSh8ot6aOUh7mZa7GVgGhMb53Neu3DpAjcP_CFpP2b1ZIhRj9W0V7VpJemJigBL3NmubLOazGZEPCuxBS3X4jAFNRET1CQ
- Morissette, R., Turcotte, M., Bernard, A., & Olson, E. (2021, June). Workers receiving payments from the Canada Emergency Response Benefit program in 2020. StatCan COVID-19: Data to Insights for a Better Canada (Catalogue no. 45-28-0001). Government of Canada, Statistics Canada. https://www150.statcan.gc.ca/n1/pub/45-28-0001/2021001/article/00021-eng.htm
- Pelletier, R., Patterson, M., & Moyser, M. (2019, October 11). The gender wage gap in Canada: 1998 to 2018. Labour Statistics: Research Papers (Catalogue no. 75-004-M). Government of Canada, Statistics Canada. https://www150.statcan.gc.ca/n1/pub/75-004-m/75-004-m2019004-eng.htm#correction-notice
- Prokopenko, E., & Kevins, C. (2020). Vulnerabilities related to COVID-19 among LGBTQ2+ Canadians. StatCan COVID-19: Data to Insights for a Better Canada (Catalogue no. 45-28-0001). Government of Canada, Statistics Canada. https://www150.statcan.gc.ca/n1/pub/45-28-0001/2020001/article/00075-eng.htm
- Public Health Agency of Canada. (2021, February 21). The CPHO Sunday Edition: The Impact of COVID-19 on Racialized Communities. Government of Canada. https://www.canada.ca/en/public-health/news/2021/02/cpho-sunday-edition-the-impact-of-covid-19-on-racialized-communities.html
- Scott, K. (2022, May). A Bumpy Ride: Tracking women’s economic recovery amid the pandemic. Canadian Centre for Policy Alternatives. https://policyalternatives.ca/sites/default/files/uploads/publications/National%20Office/2022/05/Bumpy%20ride_final.pdf
- Sentis. (2018). Everyday Legal Problems[Deck]. Prepared for the Legal Services Society. https://legalaid.bc.ca/sites/default/files/2019-03/lssEverydayLegalProblems07_2018.pdf
- Statistics Canada. (2022, March 10). COVID-19 in Canada: A Two-year Update on Social and Economic Impacts. Government of Canada. https://www150.statcan.gc.ca/n1/pub/11-631-x/11-631-x2022001-eng.htm
- Statistics Canada. (2022, March 14). Study: A portrait of Canadians who have been homeless. The Daily. Government of Canada. https://www150.statcan.gc.ca/n1/daily-quotidien/220314/dq220314b-eng.htm
- Statistics Canada. (2022, March 23). Canadian Income Survey, 2020. The Daily. Government of Canada. https://www150.statcan.gc.ca/n1/daily-quotidien/220323/dq220323a-eng.htm
- Statistics Canada. (2022, April 27). Canada is the first country to provide census data on transgender and non-binary people. The Daily. Government of Canada. https://www150.statcan.gc.ca/n1/daily-quotidien/220427/dq220427b-eng.htm
- Statistics Canada. (2020, August 27). Impacts of COVID-19 on persons with disabilities. The Daily. Government of Canada. https://www150.statcan.gc.ca/n1/daily-quotidien/200827/dq200827c-eng.htm
- Wellesley Institute. (2021, August). Tracking COVID-19 through race-based data. https://www.wellesleyinstitute.com/wp-content/uploads/2021/08/Tracking-COVID-19-Through-Race-Based-Data_eng.pdf
Appendix A - Recommendations from previous reports of the National Advisory Council on Poverty
Recommendations from Understanding Systems: The 2021 Report of the National Advisory Council on Poverty
- Indigenous prosperity through truth, reconciliation and renewed relationships
- All signatories of the Indian Residential Schools Settlement agreement immediately implement the recommendations from the Truth and Reconciliation Commission of Canada
- The Government of Canada implement the recommendations from Reclaiming Power and Place: The Final Report of the National Inquiry into Missing and Murdered Indigenous Women and Girls
- Building equity through programs, supports and benefits
- All Statistics Canada and federal population-based surveys should ask inclusive questions and provide inclusive response options on women and gender equity, Indigenous heritage, immigration/refugee status, race/ethnicity, disability, prior or current institutionalization, and sexual orientation and gender identity, to allow for routine disaggregation of data to support better decision making and reporting of disparities
- While working towards its overall poverty reduction goals, the Government of Canada should endeavor to reach those furthest behind first. To this end, the Government of Canada should commit to reducing poverty by 50% in 2030 for populations made most marginal, including Black populations, 2SLGBTQ people, Indigenous people, and persons with a disability. The Government of Canada should also specifically name and focus on Black populations, 2SLGBTQ people, Indigenous people, and persons with a disability within existing and new Government of Canada strategies, initiatives, and supports
- Dignity through enhanced access and improved service design and provision
- Governments work to simplify the delivery of programs and supports for all people through enhanced coordination, improved low barrier access, and better coverage based on need. Specifically, we recommend that governments implement community feedback mechanisms that involve people with lived expertise in poverty in the development, implementation, evaluation and on-going evolution of policy, programs and services. Governments should collect disaggregated program data to demonstrate and improve equitable access and uptake programs and services
- That the Government of Canada implement automatic enrollment for federal benefits to ensure that people are accessing the supports and services that could keep them out of poverty. Automatic tax-filing is one mechanism that can help with this
- Develop robust systems and structures focused on early intervention and poverty prevention
- The Government of Canada move to quickly implement all announced supports and benefits that have been publicly committed to. These significant investments (Canada-Wide Early Learning and Child Care System, Canada Disability Benefit, Canada Workers Benefit and the National Housing Strategy including Reaching Home) will both lift people out of poverty, and help prevent future generations from falling into poverty
- The Government of Canada increase investments in the important social programs and benefits that allow people to meet their needs and keep them from falling into poverty. This includes investments in transportation, health, mental health, food security, educational attainment, skills development, support for families, and for people going through transition periods
- Employment income and income support
- The Government of Canada should collaborate with provinces and territories to build on its COVID-19 response and strengthen existing strategies, programs and policies. This would ensure a coordinated and robust social safety net in Canada by collectively providing income support that is at least at the level of Canada's Official Poverty Line
- That the Government of Canada take a leadership role in both providing and incentivizing better employment opportunities for marginalized groups, including Indigenous people, racialized individuals, immigrants, refugees, youth, persons recently institutionalized and persons with a disability
- The Government should continue to lead by example by implementing its existing commitments and pursue providing a minimum wage that is above Canada’s Official Poverty Line (for full-time work) while consistently pursuing equitable employment practices. It should also use its influence including contract, grants and contributions and employment supports to encourage all employers to implement equitable employment and wage policies
- That the Government of Canada should increase access to employment benefits (such as, employment insurance and paid sick leave) for self-employed workers, workers in the gig economy and part-time workers
Recommendations from Building Understanding: The First Report of the National Advisory Council on Poverty
- Continued poverty reduction efforts and investments, as well as increased funding in 4 key areas (food insecurity, housing and homelessness, literacy and numeracy, and the poverty gap)
- The Government of Canada should continue with the implementation of the Poverty Reduction Strategy and with its current government-wide investments
- The Government of Canada should focus additional investments in 4 areas where progress is falling behind: food security, housing and homelessness, literacy and numeracy, and the poverty gap
- Urgent action to tackle Indigenous poverty with more specific measures
- The Government of Canada should take urgent action to support Indigenous leaders to reduce poverty in their communities and to ensure that they have all the resources available to support their own people in their own way. We specifically recommend the co-development of Indigenous indicators of poverty and wellbeing, as committed to in the Poverty Reduction Strategy; the co-development of a range of Indigenous poverty reduction strategies such as distinctions-based housing strategies, as committed to in the National Housing Strategy; and commitments made through the Indigenous early learning and child care agreements
- The data necessary to be able to report on Indigenous people should be made available to report on by our next progress report in 2021
- Increased data disaggregation to give better account for and give a voice to marginalized populations
- All Statistics Canada and federal population-based surveys should ask inclusive questions and provide inclusive response options on women and gender equity, Indigenous heritage, immigration/refugee status, race/ethnicity, disability, prior or current institutionalization, and sexual orientation and gender identity, to allow for routine disaggregation of data to support better decision-making and reporting of poverty disparities
- The Government of Canada should work with stakeholders and communities to ensure that any new survey questions and response options regarding race, gender identity and sexual orientation are inclusive and that the questions reach the populations that are currently not captured
- Applying an equity lens in policy-making
- The Government of Canada should incorporate an equity lens when it reviews, develops and implements strategies, policies and programs. It should ensure that Canada’s poverty reduction efforts work as well for those at the highest risk as for everyone else and meet the unique needs of marginalized populations, including immigrants, refugees, ethno-cultural and racialized groups, persons with disabilities, 2SLGBTQ individuals and people experiencing homelessness. The Government should also use available data to transparently report on the use of the equity lens and the outcomes
- Streamlining and coordination of benefits and bringing a level of support that is at least at Canada’s Official Poverty Line
- The Government of Canada should collaborate with provinces and territories to build on its COVID-19 response and strengthen existing strategies, programs and policies to ensure a coordinated robust social safety net in Canada by collectively providing income support that is at least at the level of Canada’s Official Poverty Line
- We recommend that benefits be streamlined and simplified to make them low-barrier, easier to access and easy to tailor to individual needs
Appendix B - Progress on the Government of Canada’s commitments and investments
Since the release of Understanding Systems, the Government of Canada made a number of key proposals and commitments that would help address the recommendations below.
Indigenous prosperity through truth, reconciliation and renewed relationships
- Addressing the legacy of harms to Indigenous children and families
On January 4, 2022, $40 billion agreements in principle were announced by the Government of Canada, which provide compensation for First Nations children on reserves and in Yukon who were removed from their homes, and those impacted by the Government’s narrow definition of Jordan’s Principle, including their parents and caregivers
Budget 2022, which received royal assent on June 23, announced additional investments of more than $4.7 billion to support communities coping with the legacy of harms to Indigenous children and families
- Meeting the needs of First Nations children through Jordan’s Principle
Budget 2022 proposes to provide $4 billion over 6 years, starting in 2021–22, to ensure First Nations children continue to receive the support they need through Jordan’s Principle
- Implementing Indigenous child welfare legislation
Budget 2022 proposes to provide $87.3 million over 3 years, starting in 2022–23, to enable Indigenous communities to continue to work with the Government of Canada and the provinces and territories to support the implementation of Indigenous child welfare laws, including An Act respecting First Nations, Inuit and Métis children, youth and families
- Addressing the legacy of residential schools
Budget 2022 proposes to provide $209.8 million over 5 years, starting in 2022–23, to increase the support provided to communities to document, locate, and memorialize burial sites at former residential schools; to support the operations of and a new building for the National Centre for Truth and Reconciliation; and to ensure the complete disclosure of federal documents related to residential schools
Other related funding announcements include:
- $10.4 million to support the appointment of a special interlocutor to collaborate with Indigenous peoples and make recommendations to strengthen federal laws and practices to protect and preserve unmarked burial sites
- $5.1 million to ensure RCMP can support community-led responses to unmarked burial sites
- $25 million to support the digitization of documents related to the federal Indian Day School System, to ensure survivors and all Canadians have meaningful access
- $25 million to support the commemoration and memorialization of former residential school sites
- Providing high-quality healthcare in remote First Nations reserves
Budget 2022 proposes to invest $268 million in 2022–23 to continue to provide high-quality healthcare in remote and isolated First Nations communities
- Mitigating the impacts of the pandemic on Indigenous communities and organizations
Budget 2022 proposes to invest an additional $190.5 million in 2022–23 for the Indigenous Community Support Fund to help communities and organizations mitigate the ongoing impacts of the pandemic
- Distinctions-based mental health and wellness
Budget 2022 proposes to provide $227.6 million over 2 years, starting in 2022–23, to maintain trauma-informed, culturally-appropriate, Indigenous-led services to improve distinctions-based mental health and wellness strategies
- Ending long-term and short-term drinking water advisories in First Nations communities
Budget 2022 proposes to provide $398 million over 2 years, starting in 2022–23, to support community infrastructure on reserve
- Investing in housing for Indigenous communities
Budget 2022 proposes to provide a further $4 billion over 7 years, starting in 2022–23, to accelerate work in closing Indigenous housing gaps
- Launching an Urban, Rural, and Northern Indigenous Housing Strategy
Budget 2022 proposes to invest $300 million over 5 years, starting in 2022–23, to co-develop and launch an Urban, Rural, and Northern Indigenous Housing Strategy
- Implementing the United Nations Declaration on the Rights of Indigenous Peoples Act
Budget 2022 proposes to provide $65.8 million over 5 years, starting in 2022–23, and $11 million ongoing, to accelerate work to meet legislated requirements of the United Nations Declaration on the Rights of Indigenous Peoples Act, including the co-development of an action plan with Indigenous partners
Building equity through programs, supports and benefits
- A federal LGBTQ2 action plan
Budget 2022 proposes to provide $100 million over 5 years, starting in 2022–23, to support the implementation of the forthcoming federal LGBTQ2 action plan, to address discrimination on the basis of sexual orientation, gender identity, or gender expression which results in persistent health, social and economic inequities for 2SLGBTQ individuals
- Launching an Anti-Racism Strategy and National Action Plan on Combatting Hate
Budget 2022 proposes to provide $85 million over 4 years, starting in 2022–23, to support the work underway to launch a new Anti-Racism Strategy and National Action Plan on Combatting Hate. This funding will support community projects that ensure that Black and racialized Canadians and religious minorities have access to resources that support their full participation in the Canadian economy, while raising awareness of issues related to racism and hate
- Supporting Black Canadian communities
Budget 2022 proposes to provide $50 million over 2 years, starting in 2022–23, for the Supporting Black Canadian Communities Initiative, to empower Black-led and Black-serving community organizations
- Enhancing legal aid for Canadians made most marginal
Budget 2022 proposes to provide $60 million in 2023–24 to increase the federal contribution to criminal legal aid services in order to support access to justice for Canadians who are unable to pay for legal support
- Piloting a Menstrual Equity Fund
Budget 2022 proposes to provide $25 million over 2 years starting in 2022–23 to establish a national pilot project for a Menstrual Equity Fund that will help make menstrual products available to Canadians in need
Dignity through enhanced access and improved service design and provision
- One-time grant for Guaranteed Income Supplement recipients who received pandemic benefits
In April 2022, the Government of Canada will provide a one-time grant for Guaranteed Income Supplement and Allowance recipients who saw a reduction or lost their benefits since July 2021 due to receiving pandemic payments in 2020
- Enhancing the National Housing Co-Investment Fund
According to Budget 2022, the National Housing Co-Investment Fund will take lessons from the Rapid Housing Initiative and will be made both more flexible and easier to access, with contributions that are more generous and faster approvals
- Increasing Old Age Security
As of July 2022, regular Old Age Security payments for people aged 75 and older will increase by 10 per cent
Develop robust systems and structures focused on early intervention and poverty prevention
- Establishing a Canada-wide early learning and child care system
The Government of Canada reached agreements with all provinces and territories, as well as with Indigenous partners, to build a Canada-wide early learning and child care system. By the end of 2022, Canadian families will see their child care fees reduced by an average of 50%. By 2025–26, the average child care fee for all regulated child care spaces across Canada will be $10 a day
- Early Learning and Child Care Infrastructure Fund
Budget 2022 proposes to provide $625 million over 4 years beginning in 2023–24 for an Early Learning and Child Care Infrastructure Fund
- Developing a National School Food Policy
Over the next year, the Minister of Agriculture and Agri-Food and the Minister of Families, Children and Social Development will work with provinces, territories, municipalities, Indigenous partners and stakeholders to develop a National School Food Policy and to explore how more Canadian children can receive nutritious food at school
- Developing a national dental care plan
Budget 2022 proposes to provide funding of $5.3 billion over 5 years, starting in 2022–23, and $1.7 billion ongoing, to provide dental care for low-income Canadians. This will start with children under 12 in 2022, and then expand to under youth under 18, seniors, and people living with a disability in 2023, with full implementation by 2025. The program would be restricted to uninsured Canadians with a household income of less than $90,000 annually, with no co-payments for those under whose income is under $70,000
- Extending the Rapid Housing Initiative
Budget 2022 proposes to provide $1.5 billion over 2 years, starting in 2022–23, to extend the Rapid Housing Initiative, creating at least 6,000 new affordable housing units, with at least 25% of funding going towards housing projects focused on women
- Accelerating the National Housing Co-Investment Fund
Budget 2022 proposes to advance $2.9 billion in funding, on a cash basis, under the National Housing Co-Investment Fund, to accelerate the creation of up to 4,300 new units and to repair up to 17,800 units for Canadians who need them most
- One-time payments to those facing housing affordability challenges
Budget 2022 proposes to provide $475 million in 2022–23 to provide a one-time $500 payment to those facing housing affordability challenges. The specifics and delivery methods will be announced at a later date
- Launching a Co-operative Housing Development Program
Budget 2022 proposes to reallocate $500 million in funding on a cash basis from the National Housing Co-Investment Fund to launch a new Co-operative Housing Development Program aimed at expanding co-op housing in Canada
- Supporting affordable housing in the North
Budget 2022 proposes to provide $150 million over 2 years, starting in 2022–23, to support affordable housing and related infrastructure in the North
- Doubling funding for Reaching Home
Budget 2022 proposes to provide $562.2 million over 2 years, beginning in 2024–25, to continue providing doubled annual funding for Reaching Home
- Conducting research on eliminating chronic homelessness
Budget 2022 proposes to provide $18.1 million over 3 years, starting in 2022–23, to conduct research on what further measures could contribute to eliminating chronic homelessness
Employment income and income support
- Expanding the Canada Workers Benefit
The Canada Workers Benefit was expanded through raising the threshold for eligibility and raising the income threshold for eligibility for the maximum benefit. This expansion will help lift 100,000 low-income Canadians out of poverty
- Lengthening Employment Insurance sickness benefits
As of summer 2022, the length of Employment Insurance sickness benefits will increase from 15 to 26 weeks
- Implementing an employment strategy for people with disabilities
Budget 2022 proposed to provide $272.6 million over 5 years to support the implementation of an employment strategy for people with disabilities through the Opportunities Fund
Appendix C - Organizations that participated in engagement sessions
Below is a list of organizations and First Nations that indicated that they would like to attend one or more of our virtual engagement sessions. Due to the overwhelming response we received, we are not able to confirm actual attendance. This list does not include individuals who attended without affiliation to an organization, politicians or public servants.
The Council encourages organizations to contact it to correct any errors or omissions.
Email: EDSC.CCNP-NACP.ESDC@hrsdc-rhdcc.gc.ca
Alberta
- Alberta Native Friendship Centres Association
- Alberta Policy Coalition for Chronic Disease Prevention
- Boys & Girls Clubs Big Brothers Big Sisters of Edmonton & Area
- Brown Bagging for Calgary's Kids
- Business and Professional Women’s Club of Alberta
- C5 Edmonton
- Calgary Alternative Support Services Inc.
- Calgary Housing Company
- Calgary Immigrant Women’s Association
- Canada In Progress
- Calgary Reads
- Salvation Army Centre of Hope
- Cumming School of Medicine – University of Calgary
- e4c
- Edmonton Mennonite Centre for Newcomers
- Fetal Alcohol Support Society
- Food Banks Alberta
- Further Education Society of Alberta
- FuseSocial
- Independent Living Resource Centre of Calgary
- Inner City Health and Wellness Program – Royal Alexandra Hospital
- KMJ Coaching and Consulting
- Métis Settlements of Alberta
- Momentum
- Norwood Child and Family Resource Centre
- Okotoks Family Resource Centre
- Public Interest Alberta
- Poverty Talks!
- Safe Community Wood Buffalo
- Sage Seniors Association
- School of Public Health – University of Alberta
- Simon House Recovery Centre
- Synergy Promotions
- Support Through Housing Team
- United Way Alberta Capital Region
- United Way Calgary and Area
- Vibrant Communities Calgary
- Wired2Hire ReBoot
- Women In Need Society of Calgary
- YMCA of Northern Alberta
- Youth Central
British Columbia
- Abel Wear Inc.
- Aboriginal Housing Management Association
- Alexandra Neighbourhood House
- British Columbia Assembly of First Nations
- British Columbia Civil Liberties Association
- BC Poverty Reduction Coalition
- BC’s Office of the Human Rights Commissioner
- The Bloom Group Community Services Society
- Burnaby Neighbourhood House
- Circle of Indigenous Nations Society
- Community Legal Assistance Society
- Disability Alliance BC
- Family Support Institute
- First Call Child and Youth Advocacy Society
- First Nations Health Authority
- First United Church Community Ministry Society
- Gabriola Health Care Foundation
- Gordon Neighbourhood House
- Greater Vancouver Association of the Deaf
- Greater Victoria Housing Society
- Interior Health
- Island Health
- Kootenay Boundary Supported Recovery Program
- Langley Senior Resources Society
- Living Wage for Families BC
- Métis Nation British Columbia
- Mothers Matter Centre
- New Westminster Community Poverty Reduction Committee
- North Burnaby Neighbourhood House
- Northern Health
- Parkgate Society Community Services
- People for a Healthy Community
- posAbilities Employment Service
- PovNet
- Prisoners’ Legal Services
- Richmond Cares, Richmond Gives
- Seniors Outreach & Resource Centre
- Shoestring Initiative – University of Victoria
- Society of Organized Services
- South Vancouver Neighbourhood House
- YMCA of Greater Vancouver
Manitoba
- Assembly of Manitoba Chiefs
- University Health Service – University of Manitoba
- E.A.G.L.E. Urban Transition Centre
- Harvest Manitoba
- The Kinship & Foster Family Network of Manitoba
- Make Poverty History Manitoba
- Portage la Prairie Community Revitalization Corporation
- Resource Assistance for Youth
- SEED Winnipeg
- United Way Winnipeg
National
- 4-H Canada
- Alliance for Equality of Blind Canadians
- Assembly of First Nations
- Atkinson Foundation
- Basic Income Canada
- BGC Canada
- Black Youth Helpline
- Breakfast Club of Canada
- Campaign 2000
- Canada Without Poverty
- Canadian Association of Nurses for the Environment
- Canadian Association of Social Workers
- Canadian Cancer Society
- Canadian Career Development Foundation
- Canadian Child Care Federation
- Canadian Foundation for Economic Education
- Canadian Hard of Hearing Association
- Canadian Labour Congress
- Canadian Red Cross
- Canadian Union of Public Employees
- Canadian Unitarian Council
- Canadian Volunteers United in Action Society
- Canadian Women's Foundation
- CanAge
- Caregiver Crosswalk Inc.
- Centre for Health Science and Law
- Centre for Social Innovation
- Child and Youth Permanency Council of Canada
- Christian Horizons
- Citizens for Public Justice
- Coalition for Healthy School Food
- Cooperation Canada
- Community Food Centres Canada
- Congress of Aboriginal Peoples
- Disability Without Poverty
- Egale Canada
- Eviance: The Canadian Centre of Disability Studies
- Les Femmes Michif Otipemisiwak / Women of the Métis Nation
- Food Banks Canada
- Foundations for Social Change
- Frontier College
- Habitat for Humanity
- HelpSeeker Technologies
- Inclusion Canada
- Income Security Advocacy Centre
- Institute for Research and Development on Inclusion and Society
- Institute for Research on Public Policy
- The Institute of Fiscal Studies and Democracy
- Inuit Tapiriit Kanatami
- Jane Goodall Institute of Canada
- Katimavik
- Learning Disabilities Association of Canada
- Maple Leaf Centre for Action on Food Security
- March of Dimes Canada
- Maytree
- McConnell Foundation
- National Farmers Union
- National Pensioners Federation
- Pauktuutit Inuit Women of Canada
- Prosper Canada
- Public Service Alliance of Canada
- St. Leonard’s Society of Canada
- Skills Canada
- Spinal Cord Injury Canada
- Tamarack Institute
- UBI Works
- UNICEF Canada
- Unifor
- VHA Home HealthCare
- Volunteer Canada
- Women's Economic Council
- Youth in Care Canada
- YMCA Canada
New Brunswick
- Ability New Brunswick
- Business Community Anti-Poverty Initiative (BCAPI)
- Conseil provincial des personnes d'ascendance africaine au Nouveau-Brunswick
- Greater Moncton Homelessness Steering Committee
- Harvest House Atlantic
- Human Development Council
- Multicultural Association of the Greater Moncton Area
- Multicultural Association of Fredericton
- Partners For Youth Inc. / Alliance Pro-jeunesse
- Regroupement féministe du Nouveau-Brunswick
- Réseau d’inclusion communautaire de la Péninsule acadienne
- The Saint John Newcomers Centre
- United Way Central New Brunswick
- United Way Saint John
- Post Secondary Homelessness Research Network – University of New Brunswick
- YMCA of Greater Moncton
Newfoundland and Labrador
- End Homelessness St. John's
- EmpowerNL
- InclusionNL: Employer Support Services
- Kids Eat Smart Foundation
- Newfoundland and Labrador Federation of Labour
- Thrive Community Youth Network
Northwest Territories
- La Fédération franco-ténoise
- Status of Women Council of the Northwest Territories
Nova Scotia
- Caregivers Nova Scotia
- Community Coalition to End Poverty in Nova Scotia
- Community Links Nova Scotia
- Dalhousie University
- Disability Rights Coalition of Nova Scotia
- Nova Scotia Health
- Nova Scotia League for Equal Opportunities
- Peaceful Places
- United Way Cape Breton
- United Way Halifax
- YMCA of Cumberland
- YMCA of Greater Halifax/Dartmouth
- YWCA of Halifax
Nunavut
- Nunavut Tunngavik Foundation
- Qajuqturvik Community Food Centre
Ontario
- Action ontarienne contre la violence faite aux femmes
- AdvantAge Ontario
- Alliance to End Homelessness Ottawa
- Alzheimer Society of Toronto
- Anishinabek Employment and Training Services
- Association of Local Public Health Agencies
- Autism Ontario
- Bernard Betel Centre
- Bootcamps for Change – University of Waterloo
- Bridges Community Health Centre
- Caledon Community Services
- Caledon Parent-Child Centre
- Carlington Community Health Centre
- Centretown Churches Social Action Committee
- Chiefs of Ontario
- Christian Cultural Association of South Asians
- Colour of Poverty – Colour of Change
- Connecting Women with Scarborough Services
- Conseil de la coopération de l'Ontario
- Cornwall SDG Human Services Department
- Daily Bread Food Bank
- DeafBlind Ontario Services
- Dixie Bloor Neighbourhood Centre
- East Scarborough Storefront
- Eastern Ontario Health Unit
- l’Équipe psycho-sociale
- Family Services Toronto
- Family Support Network for Employment
- First Work – Ontario’s Youth Employment Network
- Flemingdon Health Centre
- For Youth Initiative
- Good Jobs for All Coalition
- Hamilton Community Food Centre
- Hamilton Regional Indian Centre
- Haven Toronto
- Huron Perth Public Health
- Humana Community Services
- Immigrant Women Integration Program
- Jessie’s Centre
- The Journey Neighbourhood Centre
- Life After Fifty
- Literacy Council York-Simcoe
- LiveWorkPlay
- The Local Community Food Centre
- London Environmental Network
- Métis Nation of Ontario
- Metro Toronto Movement for Literacy
- MIAG Centre for Diverse Women & Families
- St. Michael’s Homes
- MindYourMind
- Mississauga Food Bank
- Native Child and Family Services of Toronto
- The Neighbourhood Group Community Services
- New Circles Community Services
- Niagara Folk Arts Multicultural Centre
- Nipissing District Housing Corporation
- No. 9 Gardens
- Northwestern Ontario Municipal Association
- NPAAMB Indigenous Youth Employment & Training
- Open Policy Ontario
- Ontario Children’s Advancement Coalition
- Ontario Council of Agencies Serving Immigrants
- Ontario Native Welfare Administrators' Association
- Ontario Network of Injured Workers Groups
- Ontario Trillium Foundation
- The Opening Doors Project – Canadian Mental Health Association
- Operation Come Home
- Parents partenaires en éducation
- Parkdale Activity Recreation Centre
- Parkdale Food Centre
- PARO Centre for Women's Enterprise
- PATH Employment Services
- The Raw Carrot
- Renfrew County Child Poverty Action Network
- Roots to Harvest
- Safe City Mississauga
- Sandy Hill Community Health Centre
- Sault College Employment Solutions
- School of Epidemiology and Public Health – University of Ottawa
- School of Public Policy – Carleton University
- Seaway Valley Community Health Centre
- Simcoe Muskoka Workforce Development and Literacy Network
- Six Nations of the Grand River
- StepStones for Youth
- Social Planning Council of Ottawa
- Social Planning and Research Council of Hamilton
- South Asian Legal Clinic of Ontario
- South Asian Women's Centre
- TD Centre of Learning
- Thunder Bay Indigenous Friendship Centre
- Thunder Bay Poverty Reduction Strategy
- Times Change Women’s Employment Service
- Toronto Metropolitan University
- Toronto Neighbourhood Centres
- Toronto Public Library
- Tropicana Community Services
- United Way Centraide Stormont, Dundas & Glengarry
- United Way Elgin Middlesex
- United Way Greater Toronto
- United Way Niagara
- Unity Health Toronto
- University of Toronto
- University of Windsor
- The Vanier Institute of the Family
- Waterloo Crime Prevention Council
- The Well – La Source
- Willowdale Community Legal Services
- Workers’ Health and Safety Legal Clinic
- Working For Change
- Working Skills Centre
- YMCA of Northeastern Ontario
- YMCA of Southwestern Ontario
- YWCA of Niagara Region
- YWCA of Toronto
Prince Edward Island
- Actions Femmes Î.P.É
- Native Council of Prince Edward Island
- Prince Edward Island Association for Community Living
- PEI Citizen Advocacy
- ResourceAbilities
Québec
- Action populaire Rimouski-Neigette
- Agence Ometz
- L'Arc-en-Ciel
- Association du troisième âge
- L’Association québécoise de défense des droits des personnes retraitées et préretraitées
- Atlas – Centre de pédiatrie sociale en communauté de Côte-des-Neiges
- Carrefour Jeunesse-Emploi L'Assomption
- Carrefour solidaire Centre communautaire d’alimentation
- Cirque Hors Piste – Foundation of Greater Montréal
- CJE Marguerite-d’Youville
- Clinique Droit de cité
- Collectif petite enfance
- Comité consultatif de lutte contre la pauvreté et l'exclusion sociale
- Dans la rue
- Le Dépôt centre communautaire d’alimentation
- Fondation Lucie et André Chagnon
- J-Aur Services
- Le Groupe d'aide et d'information sur le harcèlement sexuel au travail de la province de Québec inc.
- Moisson Mauricie – Centre-du-Québec
- Moisson Montréal
- Montreal Children's Hospital
- Mouvement Action-Chômage de Montréal
- Mouvement autonome et solidaire des sans-emploi
- Observatoire québécois des inégalités
- Les Petits Frères - la grande famille des personnes âgées seules
- Le Phare des AffranchiEs
- Prévention CDN-NDG
- Proche Aidance Québec
- PS. Jeunesse – Destination avenir
- Regroupement des organismes spécialisés pour l'emploi des personnes handicapées
- Regroupement des Sans-Emploi
- Réseau FADOQ
- Réseau SOLIDARITÉ itinérance du Québec
- Service budgétaire de La Baie et du Bas-Saguenay
- Service de la diversité et de l'inclusion sociale – Montréal
- Table régionale de concertation des personnes aînées du CDQ
- Townshippers’ Association
- L’Université du Québec à Montréal
Saskatchewan
- Battlefords Agency Tribal Chiefs Inc.
- Federation of Sovereign Indigenous Nations
- Métis Nation Saskatchewan
- North Saskatchewan Independent Living Centre
- Saskatchewan Association of Immigrant Settlement and Integration Agencies
- Saskatchewan Indian Institute of Technologies
- Saskatoon Poverty Reduction Partnership
- YMCA of Saskatoon
Yukon
- Fetal Alcohol Syndrome Society Yukon
- Kwanlin Dün First Nation
- Les EssentiElles
- Yukon Anti-Poverty Coalition
Appendix D - Additional data tables
| Indicator | Reference period | Initial estimates | Latest estimates | Change to indicator | Potential effect on poverty reduction | Data source |
|---|---|---|---|---|---|---|
| Real median hourly wageFootnote 4 (The hourly wage at which half the population has a higher wage and half the population has a lower wage – 2020 constant dollars) |
2015 to 2021 | $23.81 | $26.00 | increase | positive | Labour Force Survey |
| Average poverty gap (For those living below the poverty line, the poverty gap ratio is the amount that the person’s family disposable income is below the poverty line, expressed as a percentage of the poverty line) |
2015 to 2019 | 31.8% | 31.7% | decrease | positive | Canadian Income Survey |
| Asset resilience (People who had enough savings to maintain wellbeing for 3 months) |
2016 to 2019 | 66.6% | 67.1% | increase | positive | Survey of Financial Security |
| Low income entry rates (Proportion of people who entered low income in the second year out of those who were not in low income in the first year) |
2014–15 to 2018–19 | 4.1% | 3.9% | decrease | positive | Longitudinal Administrative Databank |
| Low income exit rates (Proportion of people who exited low income in the second year out of those who were in low income in the first year) |
2014–15 to 2018–19 | 27.5% | 29.5% | increase | positive | Longitudinal Administrative Databank |
Source: 2021 Labour Force Survey, table 14-10-0085-01.
Source: 2021 Labour Force Survey, table 14-10-0087-01.
Source: 2021 Labour Force Survey, table 14-10-0087-01.
Source: 2021 Labour Force Survey, table 14-10-0359-01.
Source: March 2022 Labour Force Survey, table 14-10-0373-01.