
Blueprint for Transformation: the 2023 Report of the National Advisory Council on Poverty
On this page
- List of abbreviations
- List of tables
- Dedication
- Message from the Chair
- Executive summary
- Chapter 1 - Introduction
- Chapter 2 - What we know
- Chapter 3 - What we heard
- Chapter 4 - What now: A call to action
- References
- Appendix A - Recommendations from previous reports of the National Advisory Council on Poverty
- Appendix B - Progress on the Government of Canada's commitments and investments
- Appendix C - Organizations that participated in engagement sessions
- Appendix D - Other data tables
Alternate formats

Blueprint for Transformation: the 2023 Report of the National Advisory Council on Poverty [PDF - 1.6 MB]
Large print, braille, MP3 (audio), e-text and DAISY formats are available on demand by ordering online or calling 1 800 O-Canada (1-800-622-6232). If you use a teletypewriter (TTY), call 1-800-926-9105.
List of abbreviations
- 2SLGBTQ+
- 2-spirit, lesbian, gay, bisexual, transgender, queer or questioning
- CERB
- Canada Emergency Response Benefit
- CIS
- Canadian Income Survey
- CPP
- Canada Pension Plan
- EI
- Employment Insurance
- GBA+
- gender-based analysis plus
- GST/HST
- goods and services tax/harmonized sales tax
- IRCC
- Immigration, Refugees and Citizenship Canada
- MBM
- Market Basket Measure
- MBM-N
- Northern Market Basket Measure
- NEET
- not in employment, education or training
- NHS
- National Housing Strategy
- PiT
- point in time
- PRS
- Opportunity for All – Canada’s First Poverty Reduction Strategy
- QoL
- Quality of Life
- SDGs
- United Nations Sustainable Development Goals
List of tables
- Table 1 – Poverty rate change by province and territory, 2020 to 2021 and 2015 to 2021
- Table 2 – Poverty rate changes by demographic group, 2020 to 2021 and 2015 to 2021
- Table 3 – Gap between estimated annualized minimum wage income (after deducting income tax and EI and CPP contributions) for full-time minimum wage earners and MBM thresholds – 2021
- Table 4 – Highest and lowest annual welfare income among provinces and gaps with respect to Market Basket Measure (MBM) thresholds, 2021
- Table 5 – Market Basket Measure (MBM) Thresholds for the MBM reference family, 12-month change average of the 53 MBM regions in the provinces, 2015 to 2022
- Table 6 – Change in persons living in a household that experienced moderate or severe food insecurity by selected demographic groups, 2020 and 2021
- Table 7 – Summary of multi-dimensional poverty indicator trends – Dignity
- Table 8 – Summary of multi-dimensional poverty indicator trends – Opportunity and Inclusion
- Table 9 – Summary of multi-dimensional poverty indicator trends – Resilience and Security
- Table 10 – Number of people in poverty and poverty rate by demographic group, 2015, 2020, and 2021
Dedication
The National Advisory Council on Poverty dedicates our 2023 progress report to all those people who selflessly shared their stories of success and struggle, with the hope that their expertise will enable better systems for everyone. You are the thread that binds this report.
Message from the Chair
I am pleased to present, on behalf of the National Advisory Council on Poverty, our 2023 report on the progress of Opportunity for All – Canada’s First Poverty Reduction Strategy (PRS). For this report, we engaged in person for the first time since the start of the pandemic. We discovered that the reality of poverty in 2022 and 2023 is very different from how it was in 2020.
This year we heard about many of the same challenges from all different corners of the country, including:
- housing
- food security
- transportation
- mental health supports
- racism
- discrimination
- wages
- income support
- stigma
These barriers and the way they cruelly interconnect continue to limit the individual and collective potential of our country. Now more than ever, we must give voice to the experiences of people living in poverty. We must follow their lead as we seek long-term, sustainable solutions for our future.
We commend and thank all those people, organizations and institutions that dedicate themselves to reducing poverty. Poverty reduction is a huge undertaking that requires a multi-pronged approach to be engaging, effective and equitable. We feel strongly that it is possible to decrease poverty, as we have seen it. The pandemic can act as a turning point if we, as a society, let it. We saw firsthand how quickly people can come together and how systems can shift swiftly for the better.
We must, as a country, continue to take audacious, strategic action so that everyone in Canada has the opportunity and means to thrive. We think that our recommendations offer a realistic blueprint for sustainably reducing poverty and building a more equitable country.
We don’t know what poverty will look like in the future. However, unless we all act together, we think that those who are made most marginal will continue to bear the brunt of societal challenges, such as:
- climate change
- housing
- health
- employment
- addiction
- food security
- loneliness and social isolation
In some cases, we as a society need to do things in a different way. In other cases, more of what is already being done is needed. Either way, governments must continue to act courageously for Canada and all those living here.
Thank you,
Scott MacAfee
Chair, NACP
Executive summary
The past 3 years have been unprecedented in recent history. The COVID-19 pandemic disrupted our health, economic and social systems in massive ways. The public health, education, social services and employment sectors had no choice but to adapt. In some cases, these adaptations revealed new ways of doing things. In other cases, temporary measures were dropped. These changes greatly affected household incomes, government transfers and wages. Society will feel the impacts of the pandemic for years to come. The impacts were not only related to health and incomes. There were some deliberate choices that made people more marginalized. Some people also used the responses to the economic and health impacts of the pandemic to drive people apart. We can see this with hatred, discrimination and vile political discourse that is increasingly directed at specific groups of people who are already made marginal.
While COVID-19 still threatens communities in Canada and around the world, the public health measures have largely been lifted. Temporary economic measures have also ended. At the same time, Canada is also dealing with high inflation and rising interest rates. These issues are making it challenging for many people to meet their basic needs. This contributed to rising poverty rates in 2021. Estimates also suggest further increases in 2022. There is a 1.5-year lag in the availability of annual poverty statistics. This means the impacts of the rising cost of living have only begun to show up in the data. However, rising costs and the removal of temporary pandemic benefits in 2020 and 2021, are likely to have contributed to increasing poverty rates in 2022.
Society can learn many lessons from the pandemic. An important one is the need to adapt existing measures to meet the needs of those made most marginal. Despite low-barrier access, emergency income benefits still often did not reach those made most marginal. There was an overall message of “building back better.” However, we think the focus should be on “building back fairer.”
This year, we held our first in-person engagement sessions since the COVID-19 pandemic alongside targeted virtual sessions. This allowed us to gain firsthand knowledge of poverty in 2022 and uncover policy levers that would change the reality. It has been a privilege to speak to people with lived expertise of poverty, stakeholders, community organizations and experts in their fields. The overall themes that we heard largely reinforce what we have heard in past years, namely:
- income inadequacy and impact of the rising cost of living
- the need to make equity and inclusion a priority
- challenges faced by specific populations made most marginal
- challenges accessing benefits and services
We continued to hear about the inadequacy of income and income supports. The adequacy of employment income and government income support programs have not kept pace with demand for workers. This is happening during a period of low unemployment rates and high corporate profit-taking. Inflation and increases in the cost of living have made the inadequacy worse. Rising food and housing costs have led more people living in Canada to struggle to get by. Increasing interest and borrowing rates, expensive rents and low housing stock are exacerbating the existing housing crisis country-wide.
Discrimination and racism continue to play a big role in creating and perpetuating poverty. Interventions will continue to create or reinforce inequity, specifically the economic, political, social and health disparities of racialized people, unless equity issues are the focus.
Throughout our engagement sessions, we heard about the specific challenges faced by many of the populations made most marginal. While there were many commonalities, some challenges are specific to each population. We also heard about a lack of targeted and specific supports for many groups made marginal. These are populations that disproportionally experience:
- poverty
- food insecurity
- houselessness
- low wages
- poor mental health
- higher levels of chronic disease
- isolation and loneliness
As in past years, we continued to hear about how hard accessing benefits and services is for many people. We particularly heard this from people with multiple identities within marginalized communities. We heard that we need to increase benefits and reduce the administrative burden of access. Low-barrier, increased benefits were provided early in the pandemic, and they had a real material impact on communities.
Data from the 2021 Canadian Income Survey (CIS) show an increase in the overall poverty rate compared to 2020. This is the first time since the Poverty Reduction Strategy was implemented that the poverty rate increased. In 2021, there were about 405,000 more people living in poverty than in 2020. Canada’s overall poverty rate rose by 1.0 percentage point to 7.4%, up from 6.4% in 2020. This is equal to a 15.6% increase in the poverty rate between 2020 and 2021. Although this number is up from 2020, there were 2.3 million fewer people living in poverty compared to 2015. The overall poverty rate in 2021 was close to half the level recorded in 2015.
Over the past 3 years, this Council has made several recommendations that have identified important areas of government action intended to reduce poverty. These recommendations were made by examining existing data and engaging extensively with:
- people with lived expertise of poverty
- stakeholders
- community and advocacy organizations
- academics and experts in the field
This advice also builds on the expertise and experience of the Council members. For this reason, we have chosen to use this report to urge the Government of Canada to take urgent action in the following 5 areas. We strongly believe that these recommendations, implemented collectively, would create a stronger, simpler, more equitable and proactive safety net. They will help reduce poverty, support those who need it most and create a more equitable and inclusive society.
Urgent action to decrease First Nations, Inuit and Métis poverty
The Council believes that the fact that colonial practices, racist policies and programs, and discrimination have created and perpetuated poverty in First Nations, Inuit and Métis communities is egregious and shocking. Despite recent investments towards reconciliation, the Government of Canada must continue to work to earn the trust of First Nations, Inuit and Métis people to make much needed progress in reducing poverty for Indigenous people.
Dignity, equity, and inclusion
We know that some groups have been made most marginal through racism and discrimination. The Government of Canada must continue to support equity-enabling efforts (Canada Disability Benefit, Black Entrepreneurs, Indigenous Early Learning and Child Care). It must also challenge any and all discriminatory ideologies that impede equity in policy development and programming.
Income adequacy
We have heard consistently every year that existing government benefits and minimum wage are insufficient to meet people’s needs. Record inflation rates and increases in the cost of living have made this much worse.
The Government of Canada should work with the provinces and territories to establish, by 2030, an income floor above Canada’s Official Poverty Line, whether it be through employment income, income supports including social assistance, new or existing targeted supports or a combination of the 3.
Increasing access to benefits and services
We continue to hear that our current social safety net is complex, difficult to access, inefficient, outdated, inadequate and stigmatizing. Navigating this fragmented and complicated maze can be traumatizing for people who have already been made most marginal in society.
The Government of Canada should streamline benefits to make them low-barrier, easier to access and more responsive to individual needs.
Prevention and protection
Poverty reduction efforts often primarily focus on lifting people out of poverty. However, we stress the need to invest in keeping people from falling into poverty in the first place.
Chapter 1 – Introduction
Where we started
Canada's First Poverty Reduction Strategy and the creation of the National Advisory Council on Poverty
In 2018, the Government of Canada released Opportunity for All – Canada's First Poverty Reduction Strategy ("the PRS"). The PRS set a vision and foundation for future government investments in poverty reduction. This foundation included:
- establishing an official measure of poverty, Canada's Official Poverty Line, based on the Market Basket Measure
- setting concrete poverty reduction targets to reduce poverty by 20% by 2020 and 50% by 2030, relative to 2015 levels. In 2015, the poverty rate was 14.5%, representing over 5 million Canadians living in poverty
- creating a National Advisory Council on Poverty (established in 2019) to:
- advise the Government on poverty reduction
- report publicly on the progress made toward meeting the targets every year
- foster a national dialogue on poverty reduction
- passing the Poverty Reduction Act, which entrenches the targets, Canada's Official Poverty Line, and the Council in law
Building relationships
Over the years, the Council has cultivated a strong network of persons with lived expertise of poverty, community leaders, experts, academics and practitioners working to end poverty in Canada. The pandemic shortened the Council's in-person engagement in 2020, but we adapted by adopting first a virtual, then a hybrid approach. Since then, we have spoken to more than 1000 people on poverty-related issues that matter to them most. We are grateful for their time and willingness to share their knowledge, experiences, and advice. We strive to honour what we heard in our reports and recommendations.
Investments in poverty reduction since 2018
Since the release of the PRS in 2018, the Government of Canada has made significant investments with expected impacts on poverty reduction. We recognize that these are important investments and encourage the Government to continue with their prompt implementation. These include investments for Canada-wide:
- affordable, accessible and quality early learning and child care
- dental care for low-income Canadians
- enhanced targeted benefits such as the Guaranteed Income Supplement, Old Age Security, Canada Child Benefit and Canada Workers Benefit
- targets for reducing housing need and homelessness in the National Housing Strategy
- Disaggregated Data Action Plan for more representative data collection and enhanced statistics on diverse populations
The Government of Canada likewise announced several commitments in Budget 2023 that we hope will positively impact poverty. These include commitments to:
- increase funding to implement the National Action Plan to End the Tragedy of Missing and Murdered Indigenous Women and Girls
- expand the Canadian Dental Care Plan and establish an Oral Health Access Fund to address health gaps among vulnerable populations and reduce barriers to access
- increase funding to develop the Canada Disability Benefit and investments in building the capacity of disability organizations
- increase the eligibility for automatic tax filing through the File My Return program and pilot a new automatic tax filing service for vulnerable Canadians
A more complete list of Government of Canada commitments and investments is available in Appendix B.
Groups made most marginal
Throughout our reports, we refer to specific groups that are underserved and overlooked. These groups face structural and systemic barriers, violence and discrimination, racism, homophobia, transphobia, sexism, ableism, and colonialism. This makes them more likely to live in poverty. When we refer to groups made most marginal, these are who we are referring to (in alphabetical order):
- 2-spirit, lesbian, gay, bisexual, transgender, queer or questioning (2SLGBTQ+) people
- Black and other racialized communities
- children and youth in care
- First Nations, Inuit and Métis people
- people who are experiencing houselessness
- people who are involved in the criminal justice system
- people who are living in institutions (such as long-term care homes)
- people who are living in rural and/or remote areas
- people who have emigrated to Canada
- people with disabilities
- people with refugee status or who are undocumented or non-status
- women
Intersectionality
Poverty is multi-faceted, and it affects some groups more than others. Intersectionality refers to the complex and cumulative ways in which the effects of these multiple forms of discrimination combine, overlap or intersect, especially in the experiences of groups made most marginal.
Individuals simultaneously have multiple social identities which all contribute to their unique experiences in society. These identities are formed through experiences of living and existing in different and sometimes overlapping groups based on:
- race
- ability
- class
- gender
- sexuality
- age
- other marginalizing characteristics
For any person, certain social identities may be marginalized due to discrimination, while others are not. The greater number of marginalized identities a person has, the greater their risk of poverty.
Building an equitable and resilient social safety net and system means including everyone in poverty reduction efforts. Equity needs to be a priority when developing policies and programs aimed at reducing poverty. Otherwise, we will continue to leave those made most marginal behind.
Taking stock of progress in poverty reduction
The last 4 years saw significant progress in poverty reduction as well as vast societal disruption. The COVID-19 pandemic revealed serious gaps in our social safety net. Groups made most marginal were more likely to face severe health, social and economic outcomes. Some individuals and families who were not vulnerable to poverty before required help to get by.
Early in the pandemic, the Government of Canada provided unprecedented income support to individuals and families. These supports intended to replace income due to the employment disruptions caused by pandemic responses. However, they also had an impact on poverty reduction. We reported on this in the 2020 report.
However, the emergency response measures did not help everyone equitably. Certain groups made most marginal were not entitled to these benefits at all. For example, new labour market entrants or lower income earners may not have met the minimum earned income threshold to qualify for the Canada Emergency Response Benefit (CERB). Some people faced benefit clawbacks because their incomes temporarily increased. Others must now pay back benefits for which they belatedly learned they did not qualify. Minimum wage earners, among other groups, may have fewer assets and savings to repay any benefits they received. At the same time, they continue to pay for necessities during a cost-of-living crisis.
Despite these shortcomings, emergency benefits significantly lowered poverty rates, which were already on a steady decline since 2015. These response measures have since ended. Rising inflation and cost of living are causing renewed precarity across Canada. We see this through poverty rates that increased for the first time since the PRS was introduced.
Further, we as a council have consistently stressed that progress in poverty reduction has not been equitable. Groups made most marginal continue to face:
- structural and systemic barriers in our society
- violence
- discrimination
- racism
- homophobia
- transphobia
- sexism
- ableism
- colonialism
Many of these groups are underrepresented in or absent from our poverty data. Many are also underserved or unserved by government benefits and supports. Reasons for this include barriers to access or stringent eligibility criteria. For example, the tax system is used to determine income-tested benefits. However, we know that the tax filing rate for racialized people is lower. Reaching Canada's poverty reduction targets is not enough if those furthest behind do not benefit equitably from our progress.
Our previous reports and recommendations
In our past 3 reports, the Council made recommendations on how to reduce poverty in Canada. These recommendations are based on what the Council heard during engagement with persons with lived expertise of poverty, stakeholders, community organizations and experts in the field, and qualitative and quantitative data. The recommendations align along 5 broad themes. In short, the Council recommended that the Government of Canada:
- take urgent and immediate action to reduce poverty among First Nations, Inuit and Métis people, including through co-development of Indigenous indicators of poverty
- address income inadequacy by establishing an income floor above Canada's Official Poverty Line, whether it be through employment income, income supports, new or existing targeted supports, or a combination of the 3
- develop targeted policies and programs that create greater equity, including a commitment to reduce poverty by at least 50% by 2030 for groups made most marginal, and collect and use disaggregated data on these groups to ensure programs reach those who need them most
- increase awareness of, access to and availability of government benefits and supports; ensure persons with lived expertise of poverty are at the centre of design, implementation and evaluation of these policies
- strengthen efforts in early intervention and prevention of poverty with a focus on groups made most marginal, especially children and youth; provide sustainable support for organizations working on the frontlines in this field
The Council reaffirms our past recommendations and continues to call for their urgent implementation. The full list of recommendations is in Appendix A.
Where we are now
What we heard
"There's no hope. The cost of living is too high, rent is too high. Inflation is making everything worse."
In fiscal year 2022 to 2023, the Council held in-person engagement sessions. These took place in Abbotsford, Huntington, Montreal, Ottawa, Regina, Surrey, Toronto, Salaberry de Valleyfield, and Vancouver. The Council also held virtual small-group sessions with participants from across the country. We spoke with diverse groups of people. This included persons with lived expertise of poverty, community organizations and practitioners, academics and other stakeholders. For the first time, we also met with youth in person. We spoke about their thoughts on and experiences of poverty.
This year we noted a growing sense of hopelessness and desperation. Persons with lived expertise of poverty and service providers alike told us that things seem worse now than they were before and during the first years of the pandemic. We heard that people are worried about the rising cost of living and inflation. More people are in crisis, and these crises are more visible in our communities. Many communities lack stable employment opportunities, decent and affordable housing, food, child care, transportation, health care, and other necessary infrastructure for individuals to thrive. We heard that community organizations and their staff are overworked and demoralized. They lack the resources to help everyone who needs it.
In our past engagements, stakeholders expressed optimism around the influx of more inclusive and generous pandemic benefits. Many expressed hope that the lesson of the pandemic would be that we can and must work together to do things in a different way. This year, we heard that instead of coming together as a society, people are pulling away. We heard that those experiencing poverty are feeling more othered.
We heard that chronic issues are becoming more acute. These include inadequate income, unmet housing needs and houselessness, food insecurity and worsening physical and mental health, among others. We heard that groups made most marginal continue to have disproportionately high rates of poverty. We also heard that systemic violence and discrimination, racism, colonialism, homophobia, transphobia, ableism, sexism and structural barriers remain serious issues. The lasting impacts of the pandemic and the worsening economic situation are putting added pressures on everyone. This is especially true for those in deep poverty and those at risk of falling into poverty.
What the data says
The Council's first 3 reports noted that between 2015 and 2020, poverty rates in Canada were decreasing. Last year, we reported that according to Canada's Official Poverty Line, the poverty rate fell from 14.5% in 2015 to 6.4% in 2020. As a result, Canada reached its goal of reducing poverty by 50% by 2030, 10 years ahead of time.
However, as we emphasized in our last report, 2020 was an outlier. Temporary pandemic response measures played an outsized role in rapidly declining poverty rates. Existing and new pressures, including record high inflation and a cost-of-living crisis, mean that our poverty rate is increasing. We also know that poverty reduction has not been equitable. Certain groups made most marginal continue to face disproportionately high rates of poverty.
Data from the 2021 Canadian Income Survey (CIS) show an increase in the poverty rate compared to 2020. This is the first time since the PRS was implemented that poverty increased. In 2021, there were about 405,000 more people living in poverty than in 2020. Canada's overall poverty rate rose by 1.0 percentage point to 7.4%, up from 6.4% in 2020. This is equal to a 15.6% increase in the poverty rate between 2020 and 2021. Although this number is up from 2020, there were 2.3 million fewer people living in poverty compared to 2015. This represents a decrease of 49.0% in the poverty rate compared to 2015 (14.5%).
Where we are going
Upcoming challenges
"We will work towards the reduction of poverty, but we support the 100% elimination of poverty in this country."
Since it started, the Council has endeavored to focus on the chronic causes and consequences of poverty in Canada. However, we could not fully explore some issues with increasing challenges in our reports thus far. We encourage the next iteration of the Council to pursue these issues deeply. We also encourage them to identify how poverty is embedded into certain social structures and explore effective solutions. Some, but not all, of these issues are listed below.
Longstanding issues
Inequalities in poverty
Our current systems perpetuate existing inequalities. This contributes to disproportionately higher poverty rates among groups made most marginal. Targeted approaches should try to address specific issues facing specific groups made most marginal. These approaches should acknowledge their unique contexts and risk factors for poverty. This is in line with Canada's commitment to the United Nations Sustainable Development Goals (SDGs). The SDGs endeavour to "leave no one behind" and "reach the furthest behind first".
Health and poverty
Health and poverty are inextricably linked. The pandemic brought this into stark relief. People living in poverty were disproportionately represented among the people who died from COVID-19 and experienced significant excess mortality. We do not yet know the scale of long-term and potentially permanent effects on people's physical and mental health. Beyond COVID-19, we know that the social determinants of health, including low income and experiences of discrimination, among others, contribute to continued health inequities.
Housing crisis
The Council has heard repeatedly that the housing crisis is getting worse. Rising rents, interest rates and a lack of affordable housing is putting pressure on people living in poverty. It has also put pressure on those living on middle incomes. Service providers spoke to a significant rise in houselessness and encampments. Many called for an increase in housing offering wraparound supports to address individuals' complex and unique needs.
Climate change and poverty
Globally, people living in poverty are most likely to experience the negative impacts of climate change. Canada continues to face extreme weather linked to climate change. It is vital that our efforts address resiliency and protect those most at risk.
Contextual issues
Inflation and high cost of living
Globally, we are in an inflationary period. There is a rising cost of living, especially for essentials such as food and housing. The full impacts of inflation on poverty are yet to be fully realized. The worsening economic situation continues to put pressures on those already living in poverty and those on the margins. It is even putting pressure on those living on middle incomes.
Strained frontline services
During its recent engagement, the Council heard that frontline workers and service providers are struggling. Many organizations in the voluntary sector reported underfunding and high case loads. They are often providing services and supports beyond their mandates, to compensate for gaps and/or growing complex needs. As the pandemic has progressed, so have feelings of burnout and labour shortages in essential services. This includes shortages in primary and emergency care and early childhood education.
"We keep returning to the system. Everything goes back to the incapacity of the system to help people."
Transforming our Systems: The 2022 Report of the National Advisory Council on Poverty, was tabled in Parliament on October 17, 2022. This coincided with the International Day for the Eradication of Poverty. Our report spoke to decreases in the poverty rate since 2015. However, we now know that some of these gains were temporary. Urgent action is needed for Canada to meet its 2030 poverty reduction targets as a steppingstone to eradicating poverty.
The Council has made a series of recommendations over the past 3 years. We are taking this opportunity to reiterate them. In a time of growing disparities, it is imperative that we come together to take bold action. We believe our recommendations are more salient than ever to address the challenges we face as a society.
We urge the Government of Canada to strengthen existing benefits and supports and invest in new ones that target those furthest behind first. Many of our systems alienate the people who need them most. Individuals in poverty have complex and intersecting needs. There is a sense that greater efforts are made towards safeguarding our social safety net from fraud or from those deemed undeserving, than expanding and reimagining it so that it protects everyone.
One of our engagement participants said: "While poverty is not only about income, it is always about income." We agree. People need adequate income to thrive in Canada. Working together, all levels of government, the private sector and civil society have a role to play. At the same time, we cannot neglect non-income factors, including access to:
- adequate and affordable housing
- transportation
- food
- physical and mental health supports
- education
- opportunities for civic participation
- culture
- leisure
We need to create an environment which fosters social inclusion.
Chapter 2 – What we know
Notes about data
How poverty is measured
The Poverty Reduction Act (2019) established an Official Poverty Line for Canada based on the Market Basket Measure (MBM). According to the MBM, poverty thresholds are based on the cost of a basket of food, clothing, shelter, transportation and other items representing a modest, basic standard of living. The current MBM establishes thresholds for 53 different geographic regions in the provinces, which can be adjusted to families of different sizes. When a person's or family's disposable income is below the threshold for the size of their family in a particular region, they are considered to be living in poverty.
The Northern Market Basket Measure (MBM-N) for the Yukon and Northwest Territories uses similar methodology to the MBM. However, it accounts for adjustments needed to reflect life in these territories. Statistics Canada officialised the MBM-N for the Yukon and Northwest Territories in 2022 (Devin, Gustajtis, & McDermott, 2022). The creation of the MBM-N starts to fill a major gap in our poverty statistics.
Poverty statistics are not produced for people living in Nunavut at this time. However, work is ongoing to develop an MBM-N for Nunavut.
Missing data for certain populations
First Nations, Inuit and Métis people
Official poverty statistics are missing for First Nations people living on reserve, persons living in Métis settlements and persons living in settlements across the Inuit Nunangat. This is a significant data gap for Indigenous people in Canada. For this reason, these groups are not equitably present in the data chapter. However, from the existing data, we know that Indigenous people are at a higher risk of living in poverty. The Government of Canada is working with First Nations, Inuit and Métis people to co-develop distinctions-based Indigenous indicators of poverty and wellbeing. Despite this, serious gaps still exist.
We consider the limited availability of social and economic indicators for Indigenous people to be problematic. We have repeatedly noted the need for the Government of Canada to work with Indigenous people to reconcile the shameful legacy of colonial practices. These practices have caused high levels of poverty among First Nations, Inuit and Métis people. We continue to call on Canada to undertake actions of reparation. Further, we call on Canada to restore Indigenous people to their rightful economic, political and social place.
Other groups made most marginal
The following groups are under-surveyed or not surveyed at all:
- people living in institutions
- 2SLGBTQ+ people
- people seeking asylum
- people with refugee status
- people with temporary protected status
- people experiencing houselessness
Thus, MBM and poverty statistics are also missing for these groups. We know from available evidence, including from engagement sessions, that these groups are made most marginal and are most underserved. These groups and the individuals within them have unique experiences of poverty. This further emphasizes the need to collect data and publish indicators that capture these experiences. Their inclusion would allow measurement of the impact of policies between and within groups. This would help build understanding as to whether policies are equally benefiting those made most marginal. This would inform equitable policy and program design and implementation.
We also recognize that poverty rates and the impact of poverty are different among children of different ages. They also differ between children at different stages of development and children of families with multiple marginalized identities. Experiencing poverty in childhood can have significant long-term consequences for children. Poverty disrupts the present and future well-being of children as well as the future well-being of Canada. Poverty statistics are not available for children belonging to some groups made most marginal. For example, information on disability status, Indigenous identity and immigration status is only collected or disseminated for persons aged 16 years or older. This data is important for understanding and addressing existing gaps and inequities in poverty reduction efforts. It is also important for preventing child poverty.
Poverty statistics for racialized groups have only been available since the 2020 Canadian Income Survey (CIS). Thus, we cannot measure progress in poverty reduction for racialized groups relative to the targets established in 2015.
Canadian Income Survey (CIS)
Poverty rates based on Canada's Official Poverty Line are estimated using annual results from the CIS. The CIS data has an approximate 15-month lag between a specific reference year and when the results become available. The most current poverty statistics come from the 2021 CIS. Data for Canada's provinces was released on May 2, 2023.
Indicators of poverty
Income is often used to measure poverty. But income alone fails to capture the full experience of living in poverty. The PRS established a dashboard of several indicators related to poverty. The dashboard is not comprehensive but allows progress to be tracked across several dimensions of poverty.
Tables 7 to 10 in Appendix D summarize the progress made on each of the poverty indicators since 2015. We have highlighted several indicators that align with the themes we heard in our engagement sessions throughout the chapter.
Data limitations make it difficult to track trends across all indicators of poverty for groups made most marginal. We have outlined this disparity in our past reports and made recommendations to remediate data gaps for these groups.
Comparing 'What we heard' and the data
The poverty landscape in Canada is not constant. It can change rapidly. We rely on both quantitative data from the CIS and qualitative data from engagement. This helps us understand all aspects of poverty in Canada. Of note, our engagement sessions for this report took place in fall 2022 and winter 2023. This means that there may be differences between what we heard and what the 2021 data supports. We believe that data from the 2022 and 2023 CIS will better align with what we heard this year. In the interim, we have used relevant 2022 data from alternate sources to help us better understand and more accurately reflect the themes discussed during our engagement.
Poverty rate trend in Canada
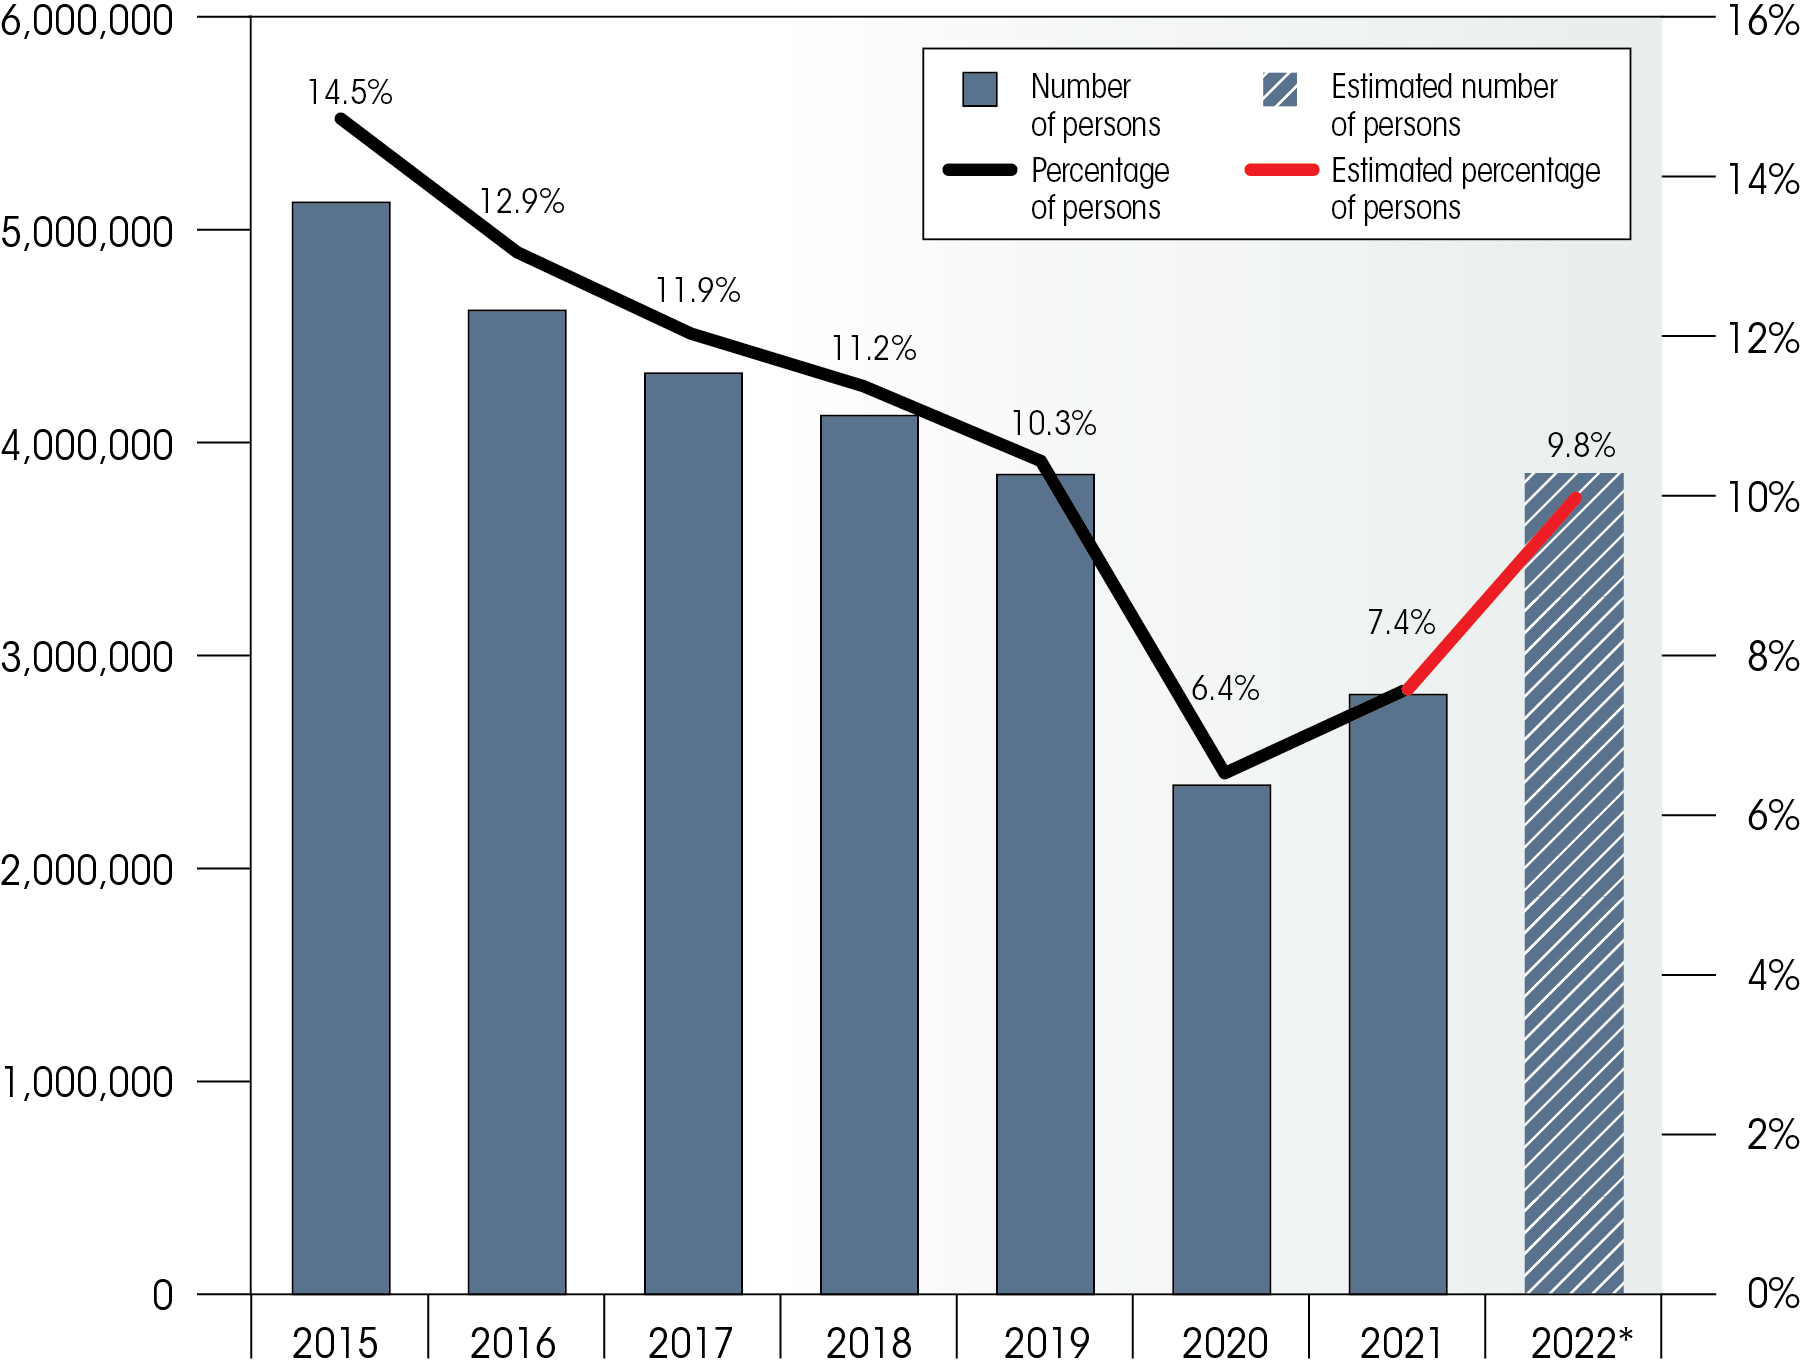
In 2015, the baseline year for measuring progress on the legislated poverty reduction targets, Canada's overall poverty rate was estimated to be 14.5%. From 2015 to 2019, the poverty rate trended downwards steadily. It decreased to 12.9% in 2016, 11.9% in 2017, 11.2% in 2018, and 10.3% in 2019. In 2020, there was a large decrease in the overall poverty rate, which dropped to 6.4%. In other words, Canada's overall poverty rate had decreased by 56% compared to 2015. This meant Canada had reached its commitment under the 2030 Agenda for Sustainable Development to reduce poverty by 50% by 2030. However, the large decrease in poverty in 2020 was primarily the result of temporary COVID-19 emergency benefits. The graph below shows these trends as well as the official poverty rate for 2021. We have also chosen to discuss projected trends by including the provisional poverty rate for 2022. This allows us to better contextualize what we heard during our engagement.
Text description of Graph 1
| Year | Number of persons in poverty | Percentage of persons in poverty |
|---|---|---|
| 2015 | 5,044,000 | 14.5% |
| 2016 | 4,552,000 | 12.9% |
| 2017 | 4,260,000 | 11.9% |
| 2018 | 4,065,000 | 11.2% |
| 2019 | 3,793,000 | 10.3% |
| 2020 | 2,357,000 | 6.4% |
| 2021 | 2,762,000 | 7.4% |
| 2022* | 3,794,000 (Estimated) | 9.8% (Provisional) |
- Source: Statistics Canada, Canadian Income Survey, Table 11-10-0135-01 Low income statistics by age, sex and economic family type.
- Note: * The provisional poverty rate shown for 2022 is an estimate based on modeling (Heisz & Gustajtis, 2023). We estimated the number of persons living in poverty in 2022 using the 2022 provisional poverty rate and the average of the 2022 quarterly population estimates for Canada's provinces (author's calculation). Official poverty rate estimates for 2022 will be available with the release of the 2022 CIS in 2024.
Poverty in Canada in 2020
As we cautioned in our last report, the large decrease in the overall poverty rate in 2020 was an anomaly. It was influenced by the unprecedented temporary increase in government transfers that year. In 2020, the median government transfers received by families and unattached individuals increased to $17,000 (Statistics Canada, 2023h). This is up significantly from $8,500 in 2019. The temporary income supports available during the pandemic more than offset income losses caused by COVID-19 emergency closures. As a result, median after-tax income of families and unattached individuals living in Canada increased from $64,500 in 2019 to $69,000 in 2020 (a 7% increase). Also, average disposable income per household in the bottom income quintile was estimated to have risen from $25,633 in 2019 to $33,024 in 2020, a 29% increase (Heisz & Gustajtis, 2023). This growth in income protected vulnerable individuals and families from falling into poverty. It also helped bring many people above the Official Poverty Line. It is important to keep this context in mind when considering 2020 data and making comparisons to 2021 data.
Official Poverty Rate for 2021 and provisional poverty rate for 2022
Despite maintaining the overall downward trend in poverty since 2015, the phasing out of the COVID-19 income supports alongside higher inflation and increasing cost of living mean that the large reduction in poverty in 2020 was not sustained in 2021. It is anticipated that the poverty rates for 2022 will increase even further.
In 2021, close to 2.8 million people living in Canada were below Canada's Official Poverty Line (Statistics Canada, 2023h). There were about 405,000 more people living in poverty in 2021 than in 2020. Between 2020 and 2021, Canada's overall poverty rate rose by 1.0 percentage point to 7.4%. This is equal to a 15.6% increase in the poverty rate between 2020 and 2021. Compared to 2015, there were close to 2.3 million fewer people living in poverty in Canada in 2021. This is a decrease of 49.0% in the overall poverty rate compared to 2015 (14.5%). Notably, the 2021 poverty rate is still below the pre-pandemic poverty rate (10.3% in 2019).
The year 2021 is the first time since the PRS was implemented that the poverty rate increased compared to the previous year. Modelling conducted by Statistics Canada suggests that the poverty rate will increase again in 2022. It is anticipated that it will increase to a level approaching the pre-pandemic rate of 10.3% in 2019 (Heisz & Gustajtis, 2023). The 2022 provisional poverty rate was estimated to be 9.8%. This would still represent a decrease of 32.4% compared to 2015 (14.5%). This provisional poverty rate is a prediction. It is based on annual data from the Consumer Price Index and average household disposable income (bottom quintile) for only part of 2022. Official poverty rates estimated using 2022 CIS data will be released in 2024.
Regional poverty trends for 2021
Between 2020 and 2021, the poverty rate increased across all provinces except for New Brunswick (-11.8%) and Prince Edward Island (-2.6%). On the other hand, the poverty rate increased the most for Alberta (+41.8%) and Saskatchewan (+35.8%). Compared to 2015, poverty has decreased the most for Quebec (-61.5%) and the least for Alberta (-17.0%). The table below summarizes the changes in poverty rates by province and territory between 2020 and 2021 and 2015 and 2021.
| Province/Territory | Poverty rate (%) 2015 | Poverty rate (%) 2020 | Poverty rate (%) 2021 | % change 2020 to 2021 | % change 2015 to 2021 |
|---|---|---|---|---|---|
| Canada* | 14.5% | 6.4% | 7.4% | +15.6% | -49.0% |
| Newfoundland and Labrador | 13.0% | 7.0% | 8.1% | +15.7% | -37.7% |
| Prince Edward Island | 15.7% | 7.6% | 7.4% | -2.6% | -52.9% |
| Nova Scotia | 16.8% | 7.7% | 8.6% | +11.7% | -48.8% |
| New Brunswick | 16.2% | 7.6% | 6.7% | -11.8% | -58.6% |
| Quebec | 13.5% | 4.8% | 5.2% | +8.3% | -61.5% |
| Ontario | 15.1% | 6.8% | 7.7% | +13.2% | -49.0% |
| Manitoba | 14.1% | 6.8% | 8.8% | +29.4% | -37.6% |
| Saskatchewan | 12.2% | 6.7% | 9.1% | +35.8% | -25.4% |
| Alberta | 9.4% | 5.5% | 7.8% | +41.8% | -17.0% |
| British Columbia | 18.6% | 7.6% | 8.8% | +15.8% | -52.7% |
| Northwest Territories** | No data | 10.2% | 15.0% | +47.0% | No data |
| Yukon** | No data | 8.8% | 7.7% | -12.5% | No data |
- Source: Statistics Canada, Canadian Income Survey.
- Notes:
- *The percentage of persons living in poverty in Canada does not include the territories.
- **The percentage of persons living in poverty was estimated using the Northern Market Basket Measure (MBM-N) for the Yukon and Northwest Territories. The estimates for the provinces and Canada use the MBM. No estimate of poverty is available for Nunavut at this time.
Poverty in the Yukon and Northwest Territories
For the first time, we are able to report on poverty estimates for the Yukon and Northwest Territories. In 2021, poverty rates in these jurisdictions were estimated to be higher than the national average (7.4%). The poverty rate was 7.7% for the Yukon and 15.0% for the Northwest Territories. In 2021, Indigenous people made up about 22% of the population in the Yukon and 50% in the Northwest Territories (Statistics Canada, 2023e). High poverty rates in these territories are consistent with what we have heard about continued discrimination through colonial practices and racist policies and programs that make it more likely for Indigenous people to live in poverty.
Poverty trends in Canada by demographic group
Between 2020 and 2021, poverty rates increased for most demographic groups. However, poverty decreased for non-senior singles under age 65 and some racialized groups including persons identified as South Asian, Filipino, Latin American, and Southeast Asian. Notably, the poverty rate for non-senior singles remains among the highest of any demographic group at 26.2% in 2021. On the other hand, poverty rates increased the most for:
- seniors (aged 65 and older) (+80.6%)
- those identified in the "other racialized persons" group (+80.0%)
- persons in male-led lone parent families (+61.1%)
- people identified as Black (+53.3%)
According to Statistics Canada, the increase in the poverty rate for seniors is largely attributable to the decrease in COVID-19 benefits after 2020 (Statistics Canada, 2023h).
Compared to 2015, poverty has decreased for all demographic groups for which 2015 data is available. Despite this, the decrease has not been equal across groups. Relative to 2015 levels, poverty rates have decreased the least for:
- seniors (-21.1%)
- non-senior singles (-32.6%)
- persons in male-led lone parent families (-38.6%)
Importantly, the poverty rate for seniors has been among the lowest of all demographics groups throughout 2015 to 2021. Over the same time, the poverty rate among persons living in male-led lone parent families has been much lower than the poverty rate among persons living in female-led lone parent families. The table below compares the change in poverty rates between 2020 and 2021 and between 2015 and 2021 for specific demographic groups. Table 10 in Appendix D shows the number of people in poverty by demographic group for 2015, 2020 and 2021.
| Group | Poverty rate (%) 2015 | Poverty rate (%) 2020 | Poverty rate (%) 2021 | % change 2020 to 2021 | % change 2015 to 2021 |
|---|---|---|---|---|---|
| Overallᶧ | 14.5% | 6.4% | 7.4% | +15.6% | -49.0% |
| Males | 14.1% | 6.3% | 7.0% | +11.1% | -50.4% |
| Females | 14.8% | 6.4% | 7.7% | +20.3% | -48.0% |
| Singles (under age 65) | 38.9% | 27.3% | 26.2% | -4.0% | -32.6% |
| Male singles (under age 65) | 36.5% | 25.4% | 24.2% | -4.7% | -33.7% |
| Female singles (under age 65) | 41.9% | 29.7% | 28.8% | -3.0% | -31.3% |
| Children aged 0 to 17 | 16.3% | 4.7% | 6.4% | +36.2% | -60.7% |
| Children aged 0 to 2 | 17.4% | 4.2% | 5.3% | +26.2% | -69.5% |
| Children aged 3 to 5 | 18.5% | 4.8% | 6.8% | +41.7% | -63.2% |
| Children aged 6 to 11 | 16.7% | 4.8% | 6.8% | +41.7% | -59.3% |
| Children aged 12 to 17 | 14.2% | 4.7% | 6.2% | +31.9% | -56.3% |
| Seniors (aged 65+) | 7.1% | 3.1% | 5.6% | +80.6% | -21.1% |
| Persons in lone parent families | 32.8% | 13.5% | 16.1% | +19.3% | -50.9% |
| Persons in male-led lone parent families | 18.9% | 7.2% | 11.6% | +61.1% | -38.6% |
| Persons in female-led lone parent families | 36.4% | 15.0% | 17.2% | +14.7% | -52.7% |
| Indigenous people living off reserve (aged 16+) | 26.2% | 11.8% | 13.9% | +17.8% | -46.9% |
| Indigenous people living on reserve | not collected | not collected | not collected | not collected | not collected |
| 2SLGBTQ+ persons | not collected | not collected | not collected | not collected | not collected |
| Persons with disabilities (aged 16+) | 20.6% | 8.5% | 10.6% | +24.7% | -48.5% |
| Immigrants (aged 16+)ᶧᶧ | 17.5% | 6.8% | 8.1% | +19.1% | -53.7% |
| Recent immigrants (10 years or less) aged 16+ | 28.3% | 8.6% | 10.3% | +19.8% | -63.6% |
| Very recent immigrants (5 years or less) aged 16+ | 34.9% | 11.2% | 12.0% | +7.1% | -65.6% |
| Racialized personsᶧᶧᶧ | not collected | 8.0% | 9.5% | +18.8% | not collected |
| South Asian | not collected | 7.5% | 7.0% | -6.7% | not collected |
| Chinese | not collected | 9.6% | 11.7% | +21.9% | not collected |
| Black | not collected | 7.5%* | 11.5% | +53.3% | not collected |
| Filipino | not collected | 3.6%* | 2.9%* | -19.4% | not collected |
| Arab | not collected | 10.0%* | 12.8%* | +28.0% | not collected |
| Latin American | not collected | 8.7%* | 6.8%* | -21.8% | not collected |
| Southeast Asian | not collected | 10.3%* | 9.1%* | -11.7% | not collected |
| Other racialized persons** | not collected | 8.0% | 14.4% | +80.0% | not collected |
| Persons living in institutions | not collected | not collected | not collected | not collected | not collected |
| Persons who were formerly incarcerated | not collected | not collected | not collected | not collected | not collected |
- Source: Statistics Canada, Canadian Income Survey, Table 11-10-0090-01 Poverty and low-income statistics by disability status; Table 11-10-0093-01 Poverty and low-income statistics by selected demographic characteristics; Table 11-10-0136-01 Low income statistics by economic family type.
- Notes:
- ᶧThe estimated poverty rates in this table only include data from Canada's provinces.
- ᶧᶧReferred to by Statistics Canada as people who are, or have been, landed immigrants in Canada. Canadian citizens by birth and non-permanent residents (persons from another country who live in Canada and have a work or study permit, or are claiming refugee status, as well as family members living here with them) are not considered landed immigrants.
- ᶧᶧᶧReferred to by Statistics Canada as persons designated as visible minorities.
- *Statistics Canada indicates that these data should be used with caution.
- **Other racialized persons includes racialized groups not included elsewhere and persons who identified as more than one racialized group.
2021 poverty rate among specific demographic groups and groups made most marginal
Data from the 2021 CIS show continued high rates of poverty among groups made most marginal. In particular, single or unattached persons (all ages) had a poverty rate of 21.9% compared to 4.4% for persons in families. The poverty rate among persons in lone-parent households was 16.1%. Persons living in female-led lone parent households were more likely to live in poverty (17.2%) than those in male-led lone parent households (11.6%). Among people aged 16 and older, the poverty rate was about twice as high for Indigenous people (13.9%) compared to non-Indigenous people (7.4%). The poverty rate among racialized groups (9.5%) was higher than that for non-racialized groups (6.5%). Of racialized groups, poverty rates were highest for persons identified as Arab (12.8%), Chinese (11.7%), and Black (11.5%).
Factors driving the increasing poverty rate
As noted above, the poverty rate in Canada increased from 6.4% in 2020 to 7.4% in 2021. According to analyses from Statistics Canada, the poverty rate is expected to continue increasing in 2022. It is expected to approach a level near the pre-pandemic rate of 10.3% in 2019. Incomes failing to keep pace with the rising cost of living is likely to drive this expected upward trend in the poverty rate.
Incomes in 2021
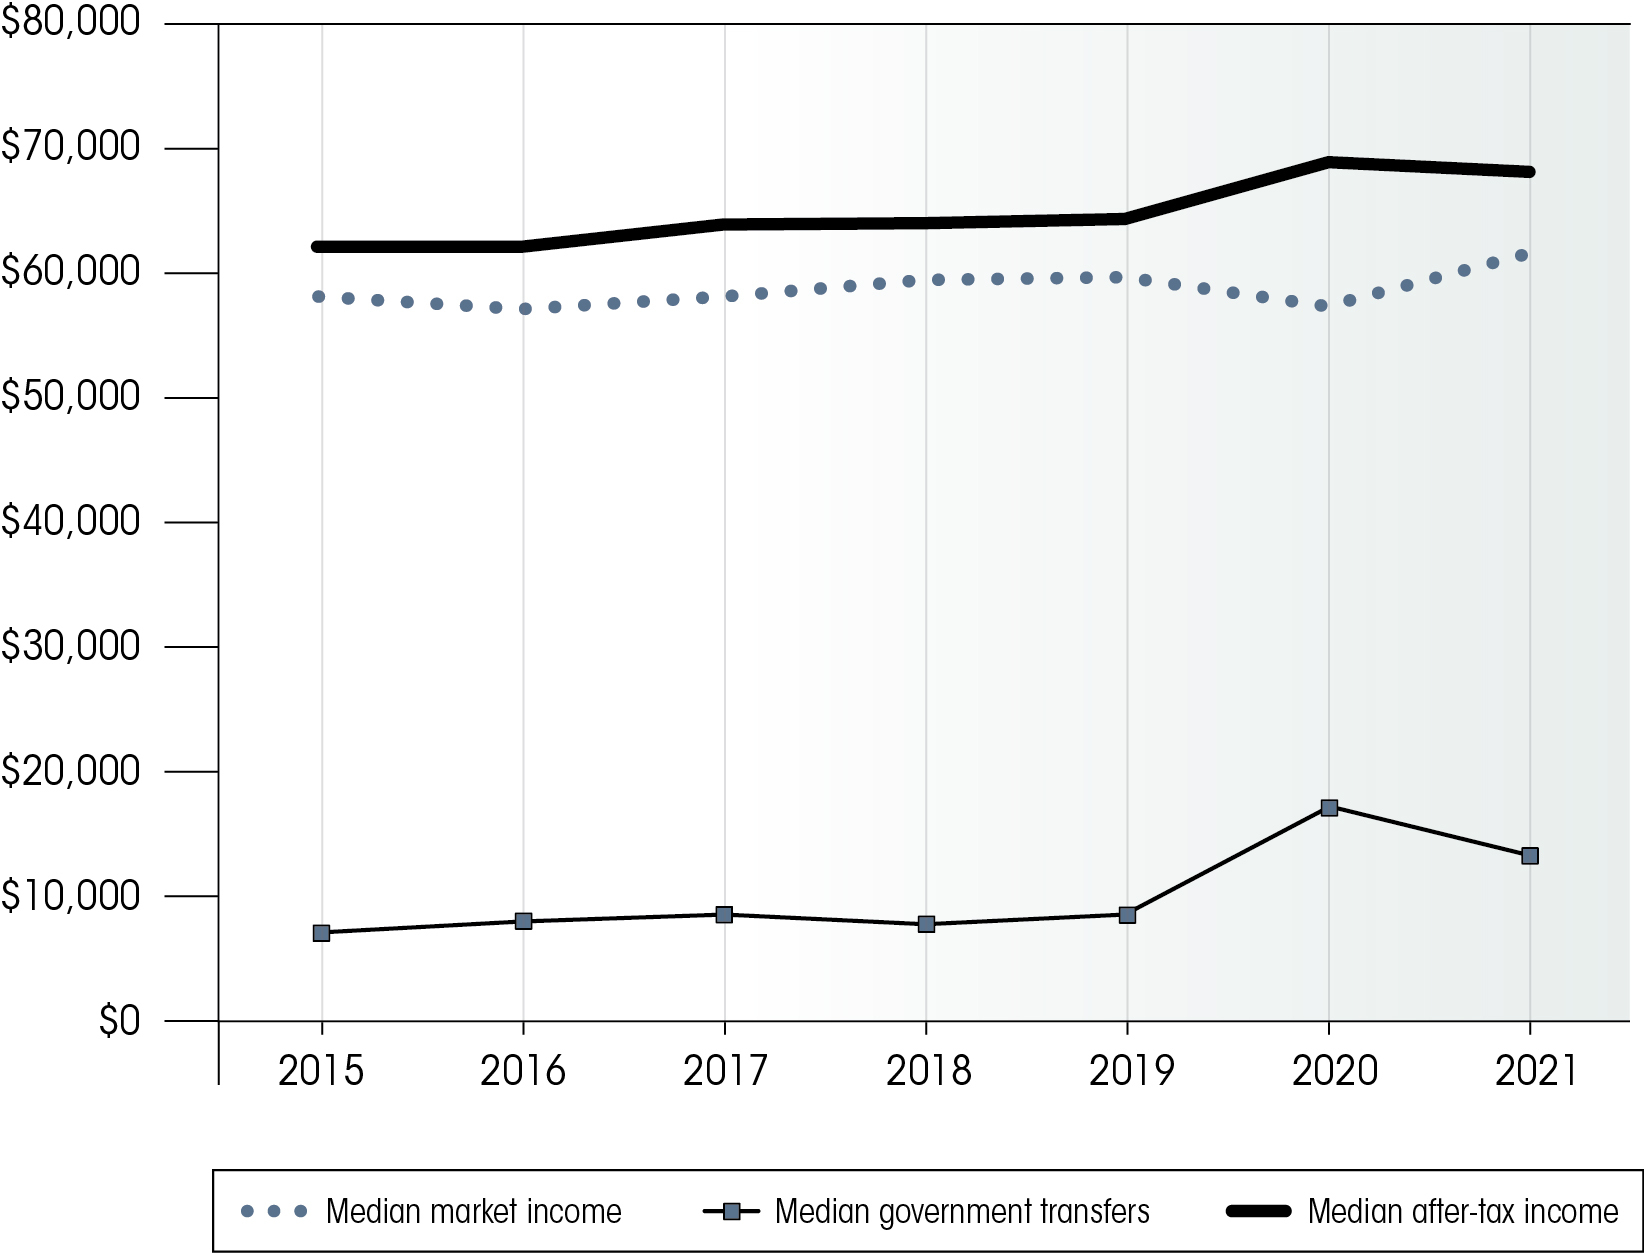
The median market income of families and unattached persons rose from $57,500 in 2020 to $61,700 in 2021. This represented an increase of 7.3% in 2021, which erased the decrease observed between 2019 and 2020. On the other hand, the total COVID-19 benefits received by people living in Canada decreased by 68% in 2021. This decreased the median government transfer for families and unattached individuals from a historical high of $17,000 in 2020 to $13,300 in 2021. The 2021 median transfer was still higher than in 2019 ($8,500). This reflected the continued presence of the Canada Recovery Benefit, Canada Recovery Sickness Benefit, and Canada Recovery Caregiving Benefit. These benefits continued to give support to many Canadians into the 2021 calendar year.
Text description of Graph 2
| Year | Median market income | Median government transfers | Median after-tax income |
|---|---|---|---|
| 2015 | $58,200 | $7,100 | $62,400 |
| 2016 | $57,300 | $8,000 | $62,400 |
| 2017 | $58,200 | $8,300 | $63,900 |
| 2018 | $59,500 | $7,700 | $64,100 |
| 2019 | $59,600 | $8,500 | $64,500 |
| 2020 | $57,500 | $17,000 | $69,000 |
| 2021 | $61,700 | $13,300 | $68,400 |
- Source: Canadian Income Survey, Statistics Canada, Table 11-10-0190-01 Market income, government transfers, total income, income tax and after-tax income by economic family type.
- Notes: Market income is the sum of earnings (from employment and self-employment), net investment income, private retirement income and items under other income. After-tax income refers to income from all sources including government transfers minus income tax.
Median Hourly Wage – An indicator of poverty tracked under the PRS
This indicator measures the hourly wage at which half of the population has a higher wage and half has a lower wage. The median hourly wage (in 2022 constant dollars) decreased from $28.70 in 2020 to $27.76 in 2021 and to $27.00 in 2022 (Statistics Canada, 2023a). The pandemic caused significant employment losses in lower-pay sectors, such as accommodation services and retail. This significantly changed the distribution of wages in 2020 and to some extent, in 2021. Changes in the median hourly wage between 2020 and 2022 need to be considered in this context.
Minimum wage and gap to Official Poverty Line
Being employed does not always mean that people make enough money to support themselves. Even working full-time, those making minimum wage may live below the poverty line, without the addition of government benefits. This brings into question the adequacy of minimum wage rates across Canada. It also emphasizes how important accessible benefits are for people living below the poverty line. The table below shows examples of estimated annualized minimum wage incomes (after deducting income tax and EI and CPP contributions) for a person working full-time and earning the federal minimum wage as well as the highest (British Columbia) and lowest (Saskatchewan) provincial minimum wages in 2021. In this example, minimum wage was inadequate for keeping a full-time worker earning minimum wage above the 2021 Official Poverty Line for their region.
The example calculation used minimum wage rates that were in effect at the end of 2021 for each province. However, the minimum wage rates changed throughout the year. For example, the federal minimum wage ($15.00) came into effect on December 29, 2021. The minimum wage for Saskatchewan increased from $11.45 to $11.81 on October 1, 2021. The minimum wage for British Columbia increased from $14.60 to $15.20 on June 1, 2021. Thus, in our example, even if a person had earned the higher end-of-year minimum wage in their province for the entire year, it would have still been inadequate to keep them out of poverty.
| MBM region | 2021 MBM threshold for 1 person (Official Poverty Line) | Minimum wage* | Estimated annualized minimum wage income after non-discretionary deductions for 2021 (full-time)** | 2021 gap between estimated annualized minimum wage income and MBM threshold for 1 person (Official Poverty Line) |
|---|---|---|---|---|
| Ottawa-Gatineau (Ontario-part) | $25,178 | $15.00 | $22,765 | -$2,413 |
| Regina, Saskatchewan | $23,741 | $11.81 | $18,803 | -$4,938 |
| Vancouver, British Columbia | $25,942 | $15.20 | $23,344 | -$2,598 |
- Notes:
- *The MBM threshold for 1 person for the Ottawa-Gatineau (Ontario-part) region was used as a point of comparison for the federal minimum wage. The federal minimum wage applies only to workers in federally regulated sectors.
- **Estimated annualized minimum wage incomes (full-time) were calculated by multiplying each jurisdiction's minimum hourly wage by 35 hours per week and by 52 weeks per year and subtracting estimated income taxes and social security contributions (EI and CPP). This basic calculation shows example incomes for full-time workers earning minimum wage. It does not factor in tax credits, federal, provincial, or territorial supports, or other forms of income.
Some groups who have a higher risk of experiencing poverty are more likely to work in minimum wage jobs. In 2018, of those working in minimum wage jobs:
- 58.8% were women
- 52.3% were between the ages of 15 to 24
- 30.7% were permanent residents (referred to as landed immigrants by Statistics Canada in the Labour Force Survey)
- 25.7% were unattached (single) persons and lone parents (Dionne-Simard & Miller, 2019)
Deep income poverty – An indicator of poverty tracked under the PRS
Deep income poverty measures the percentage of individuals whose family disposable income is less than 75% of the applicable poverty line for their family size. In Canada, the percentage of persons living in deep income poverty increased from 3.0% in 2020 to 3.6% in 2021.
Social assistance and gap to Official Poverty Line
Social assistance provides support of last resort to persons lacking the means to pay for basic or essential needs. In this section, welfare income refers to income from all government transfers, including basic provincial and territorial social assistance, refundable tax credits, child benefits, and any other specific social assistance benefits, as defined by the Maytree Foundation.
According to analyses conducted by the Maytree Foundation, 80% of household types eligible for maximum social assistance benefits across the provinces would have had total welfare incomes below the deep income poverty threshold in 2021 (Laidley & Tabbara, 2022). This means that a large proportion of households that rely only on social assistance and other government transfers lived in deep poverty. The table below shows the highest and lowest total annual welfare incomes relative to the applicable Official Poverty Line for different household types.
| Example household type (Scenario)* | Jurisdiction | Applicable Official Poverty Line (MBM threshold)** | Total annual welfare income | Gap to MBM threshold | % of MBM threshold |
|---|---|---|---|---|---|
| Single person (lowest) | Moncton, NB | $22,404 | $7,499 | -$14,905 | 33% |
| Single person (highest) | Montreal, QC | $21,529 | $12,968 | -$8,561 | 60% |
| Single person with a disability (lowest) | Calgary, AB (BFE)ᶧᶧ | $25,910 | $11,195 | -$14,715 | 43% |
| Single person with a disability (highest) | Calgary, AB (AISH)ᶧᶧ | $25,910 | $21,164 | -$4,746 | 82% |
| Single parent, 1 child (lowest) | Halifax, NS | $34,175 | $21,134 | -$13,041 | 62% |
| Single parent, 1 child (highest)ᶧ | Montreal, QC | $30,447 | $24,532 | -$5,915 | 81% |
| Single parent, 1 child (highest)ᶧ | Charlottetown, PEI | $33,050 | $26,639 | -$6,411 | 81% |
| Couple, 2 children (lowest) | Moncton, NB | $44,808 | $27,177 | -$17,631 | 61% |
| Couple, 2 children (highest) | Montreal, QC | $43,058 | $39,659 | -$3,399 | 92% |
- Source: 2021 Welfare in Canada, Maytree Foundation.
- Notes:
- *For the analysis, the head of all households were assumed to be fully "employable," except for the single person with a disability (as reflected in program eligibility definitions). It was also assumed that the households had no earnings, so they were eligible to receive the maximum rate of social assistance.
- **Poverty thresholds for 2021 were estimated by increasing 2020 thresholds in line with the CPI for each applicable city. Thus, MBM poverty thresholds may not reflect 2021 official thresholds.
- ᶧSingle parent, 1-child households in Montreal and Charlottetown were both designated as the highest welfare incomes. Each was 81% of their corresponding MBM threshold.
- ᶧᶧAISH refers to Alberta's Assured Income for the Severely Handicapped program. BFE refers to Alberta's Barriers to Full Employment program.
Analyses by the Maytree Foundation also show that phasing out temporary COVID-19 supports worsened the depth of poverty experienced by households receiving social assistance. Overall, 81% of the household types receiving social assistance experienced a net loss in pandemic-related supports between 2020 and 2021 (Laidley & Tabbara, 2022). The amount lost depended on the household type and jurisdiction. Losses ranged from $33 for a single parent, 1-child household in Prince Edward Island to $5,438 for a couple with 2 children in British Columbia.
Adding to the phaseout of COVID-19 supports, most jurisdictions did not substantially increase social assistance rates in 2021. Amid high inflation, many households that rely only on social assistance and other government transfers were worse off in 2021 than in 2020. The 2021 Welfare in Canada report showed that of the household types examined in the provinces and territories:
- 57% saw decreases in total welfare incomes that were worsened by inflation
- 32% saw total welfare incomes stay the same or increase by rates that were negated by the rate of inflation
- 11% saw their total welfare incomes increase (in Nova Scotia and Prince Edward Island only)
Cost of living
In April 2022, about 75% of people living in Canada reported that rising costs were affecting their ability to meet day-to-day expenses (Statistics Canada, 2022c). Urban residents reported being most affected by rising food prices, but rural residents reported being most affected by transportation. Of respondents, 27% reported having to borrow money from friends or relatives, take on additional debt or use credit to meet day-to-day expenses in the 6 months before the survey. Of the respondents, some groups were more likely to report needing to borrow money to meet day-to-day expenses. These included:
- those in the bottom 2 household income quintiles
- individuals aged 15 to 39
- households with at least 1 child under 18
- persons with a disability
- persons belonging to racialized groups
By December 2022, 26% of households said they would be unable to cover an unexpected expense of $500 (Statistics Canada, 2023c).
Consumer Price Index (CPI)
The Consumer Price Index (CPI) tracks the change in prices experienced by consumers in Canada by comparing the cost of a fixed basket of goods and services over time. The CPI is used to estimate inflation and increases in the cost of living. In 2021, the CPI increased by 3.4% on an annual average basis compared to 0.7% in 2020 (Statistics Canada, 2022a). In 2022, the CPI rose 6.8% on an annual average basis, doubling the rate from 2021 (Statistics Canada, 2023b). The recent increases in the cost of living represent one of the most important socioeconomic challenges faced by people living in Canada following the onset of the COVID-19 pandemic. It is expected that this will put upward pressure on poverty rates in 2022, especially for groups made most marginal.
Impact of CPI on MBM thresholds
The MBM establishes poverty thresholds for different regions in Canada's provinces. It adjusts those thresholds according to changes in the cost of living. Since 2015 and before the pandemic, MBM thresholds increased on an annual basis between 0.9 to 2.3% on average. However, MBM thresholds increased on average by 3.4% in 2021 and 8.1% in 2022. This reflects the high inflation rates experienced throughout 2022, with large increases in the shelter, transportation and food components of the MBM. The table below shows the trend in the annual growth rate of the average MBM threshold.
| Year | Average MBM threshold (MBM reference family of 4 persons) | Growth rate in average MBM threshold from previous year |
|---|---|---|
| 2015 | $41,045 | not applicable |
| 2016 | $41,581 | +1.3% |
| 2017 | $41,963 | +0.9% |
| 2018 | $42,790 | +2.0% |
| 2019 | $43,756 | +2.3% |
| 2020 | $44,141 | +0.9% |
| 2021 | $45,655 | +3.4% |
| 2022 | $49,356 | +8.1% |
- Source: Statistics Canada. Table 11-10-0066-01 Market Basket Measure (MBM) thresholds for the reference family by Market Basket Measure region, component and base year. Based on MBM with 2018 base.
Housing
Core housing need, Census 2021
Core housing need is one of the indicators of poverty tracked under the PRS. Households are identified as being in core housing need when they live in housing that is unaffordable, in major need of repairs, or unsuitable for the size and composition of the household and are not able to afford alternative housing in their community. This indicator is officially reported using Census data. Thus, this is the first year since we convened as a council that we can report an update. Importantly, the rate of core housing need for 2021 uses 2020 household incomes. As noted, temporary COVID-19 supports increased median incomes in 2020 which lifted many households above housing affordability thresholds. COVID-19 income supports have since ended. This will likely further strain households already struggling to make ends meet.
According to the Census, core housing need decreased from 12.7% in 2016 to 10.1% in 2021 (Statistics Canada, 2023e). All provinces and territories experienced decreases in the proportion of households in core housing need between 2016 and 2021. Nunavut experienced the highest absolute decrease, falling from 36.5% in 2016 to 32.9% in 2021. However, Nunavut's core housing need rate is still the highest among all provinces and territories in Canada. It is about 3 times the national rate. Core housing need was higher for renters (20.0%) than homeowners (5.3%) (Statistics Canada, 2022f). Renters were more than twice as likely to be in unaffordable housingFootnote 1 (33.2%) compared to homeowners (14.8%). Of note, the number of people living in Canada who are renting their home is increasing. Homeownership has become more difficult with the cost of buying a home outpacing household income growth (Statistics Canada, 2022d; Statistics Canada, 2022f).
Children
603,040 children (8.8%) were in core housing need in 2021 (Statistics Canada, 2022f). Core housing need was higher for children in lone-parent households (24.7%) compared to those in a couple family (5.4%).
People living alone
In 2021, persons in a couple family were the least likely to be in core housing need (Statistics Canada, 2022f). MillennialsFootnote 2 living alone were more likely to have core housing need (15.3%) than those that lived with a roommate (7.4%) or who lived in a couple (4.5%). Seniors living alone were more likely to live in unaffordable housing when renting (49.0%) compared to those who owned a home (18.8%) (Statistics Canada, 2022d).
People who use social housing
In 2021, about 227,100 households were waiting for social and affordable housing compared with 262,000 in 2018 (Statistics Canada, 2022d). Of those waitlisted, 148,200 (65%) reported waiting 2 years or longer. Further, among those waitlisted, about 66% of lone-parent households, 33% of young adult-led households, and 70% of senior-led households were waiting 2 years or longer.
Shelter costs and housing affordability – 2022
In 2022, shelter costs rose by 6.9% on an annual average basis (Statistics Canada, 2023b). Similarly, rent prices increased by 4.6% in 2022 compared to 1.6% in 2021. Also, in March 2022, the Bank of Canada began increasing interest rates, directly impacting the cost of owning a home. The Mortgage Interest Cost Index grew by 2.6% in 2022 after decreasing by 7.7% between 2020 and 2021. This has the biggest impact on:
- those with a variable-rate mortgage
- those renewing their mortgage
- prospective homebuyers such as young people (Statistics Canada, 2022f)
By December 2022, 58% of those aged 15 to 24 and 56% of those aged 25 to 34 reported being very concerned about their ability to afford housing or rent (Statistics Canada, 2023c). Moreover, members of racialized groups were also more likely to report concern about the cost of housing. About 74% of persons identifying as Black and 65% of persons identifying as South Asian reported being very concerned about the cost of housing. This was compared to 38% of non-Indigenous, non-racialized respondents.
Houselessness in Canada
A point in time (PiT) count conducted between 2020 and 2022 estimated that over 32,000 people in 59 communities across Canada were experiencing absolute houselessness in shelters, transitional housing, and unsheltered locations (Infrastructure Canada, 2023). Among the 55 communities included in the PiT count in 2018, the number of persons experiencing houselessness increased by 12%, with double the number of people living in an unsheltered location.
A PiT count is a one-day snapshot of houselessness in shelters and on the streets in participating communities. A PiT count estimates how many people are experiencing houselessness in emergency shelters, in transitional housing and in unsheltered locations on the day of the count. It does not account for those experiencing hidden houselessness or those experiencing houselessness in communities that did not participate in the PiT. It is therefore likely to underestimate houselessness in Canada.
Of those surveyed between 2020 and 2022, 46% experienced houselessness for the first time before the age of 25. About 71% experienced chronic houselessness compared to 60% in 2018. Around 35% of respondents identified as Indigenous, with most identifying as First Nations. The majority of 2SLGBTQ+ respondents were among youth respondents aged 13 to 24 (24%), followed by adults aged 25 to 49 (12%), older adults aged 50 to 64 (6%), and seniors aged 65 and up (5%).
National Housing Strategy and affordable housing
On top of rising shelter costs, Canada is losing affordable housing faster and in excess of what the National Housing Strategy (NHS) has committed to produce (National Housing Council, 2023). The NHS was designed with a target to produce 150,000+ units of housing that rent for $750/month or less. But estimates suggest that more than 550,000 units renting at this rate have been lost between 2011 and 2021. Further, the 30% shelter cost to income threshold used to define affordable housing may be too high for those experiencing deep poverty. This may prevent housing that is designated as affordable from benefiting those who need it the most.
As demonstrated in the example in Table 3, full-time workers earning minimum wage in Ottawa, Regina, and Vancouver would have had incomes below the 2021 Official Poverty Line. In 2021, the monthly average rent for a 1-bedroom apartment in the lowest rental rate category was $1,280 for Ottawa, $953 for Regina, and $1,434 for Vancouver (Statistics Canada, 2023d). For rental costs to be at most 30% of gross income (based on the definition of affordable housing), a person's gross income would have to be $51,200 in Ottawa, $38,120 in Regina, and $57,360 in Vancouver. The incomes shown in Table 3 suggest that full-time minimum wage earners in each of these cities would have to pay much more than 30% of their gross earnings to afford the average rent of a one-bedroom apartment.
Spotlight on the National Housing Council's 2023 Report
In April 2023, The National Housing Council released Renewing Canada's National Housing Strategy: A Report to the Minister of Housing and Diversity and Inclusion on the National Housing Strategy (National Housing Council, 2023). The Report came to the following conclusions:
- many people in core housing need or experiencing houselessness are not reached by the affordable housing being built or the subsidies from the Canada Housing Benefit
- Canada is losing affordable housing faster and in greater quantities than the National Housing Strategy is producing it
- the design of programs under the National Housing Strategy and the definitions of affordable housing exclude specific groups it intends to prioritize, including but not limited to 2SLGBTQ+, Indigenous people, newcomers, people experiencing houselessness, people with disabilities, racialized communities, seniors and women
- while the National Housing Strategy has produced over 115 000 new units of housing as of September 2022, the vast majority of the housing produced, and the subsidies delivered by the Canada Housing Benefit, are not affordable to or reaching those in core housing need or experiencing homelessness
The National Advisory Council on Poverty agrees with and echoes these concerns with the National Housing Council. We feel that the current housing crisis will not be solved through the National Housing Strategy, nor will it help those who are made most vulnerable.
Grocery costs and food insecurity – 2021
Between 2020 and 2021, the cost of groceries increased by 2.2%. This is compared to an increase of 2.4% between 2019 and 2020 (Statistics Canada, 2022a).
Food insecurity and poverty
Based on data from the 2020 CIS, of the total population facing severe food insecurity, 22% were below the poverty line (Employment and Social Development Canada, 2023). Nearly half (45.4%) of those facing severe food insecurity were in economic families with incomes greater than 50% above the poverty line. For persons experiencing severe food insecurity, government transfers were the main source of family income (53.5%), followed by wages and salaries (43.2%).
Research from the interdisciplinary research program PROOF indicates that food insecurity decreases with policies that increase the incomes of very low-income households (Tarasuk & Li, 2022). In other words, poverty reduction policies that help supplement incomes should also help reduce food insecurity across Canada.
In 2021, about 4.8 million people who live in Canada (12.9%) lived in households that experienced food insecurity (defined as moderate or severe) compared to 4.1 million (11.2%) in 2020 (Statistics Canada, 2023h). Groups made most marginal were more likely to experience food insecurity. For example, in 2021, persons living in female-led lone parent households had the highest rates of food insecurity (34.1%). Racialized groups were also more likely to experience food insecurity (16.8%) compared to non-racialized groups (11.3%). Of racialized groups, persons identified as Black experienced the largest absolute increase in food insecurity between 2020 (17.2%) and 2021 (27.2%). Also, in 2021, 24.1% of Indigenous people aged 16 years or older living off reserve experienced food insecurity. Food insecurity rates were particularly high among First Nations people aged 16 years or older living off reserve (29.4%). For comparison, 11.8% of non-Indigenous people aged 16 years or older experienced food insecurity in the same year. The table below shows the change in food insecurity rates between 2020 and 2021 for demographic groups with data available.
| Demographic group | 2020 | 2021 | % change in rate: 2020 to 2021 |
|---|---|---|---|
| Overall | 4,143,000 (11.2%) | 4,821,000 (12.9%) | +15.2% |
| Children (under age 18 years) | 962,000 (13.6%) | 1,223,000 (16.8%) | +23.5% |
| Seniors (aged 65 years and over) | 377,000 (5.7%) | 433,000 (6.3%) | +10.5% |
| Persons in lone-parent households | 467,000 (27.3%) | 537,000 (30.0%) | +9.9% |
| Persons in female-led lone-parent households | 416,000 (30.1%) | 487,000 (34.1%) | +13.3% |
| Persons in male-led lone-parent households | 52,000 (15.7%) | 50,000 (13.9%) | -11.5% |
| Single non-seniors (aged 64 or younger) | 743,000 (17.6%) | 789,000 (18.5%) | +5.1% |
| Racialized persons* | 1,474,000 (14.6%) | 1,824,000 (16.8%) | +15.1% |
| South Asian | 269,000 (10.4%) | 417,000 (15.1%) | +45.2% |
| Chinese | 176,000 (9.1%) | 274,000 (13.0%) | +42.9% |
| Black | 253,000 (17.2%) | 424,000 (27.2%) | +58.1% |
| Filipino | 213,000 (20.4%) | 214,000 (18.7%) | -8.3% |
| Arab | 166,000 (21.0%) | 118,000 (13.2%) | -37.1% |
| Latin American | 147,000 (22.4%) | 92,000 (15.4%) | -31.3% |
| Southeast Asian | 86,000 (15.7%) | 106,000 (17.8%) | +13.4% |
| Other racialized persons** | 164,000 (15.6%) | 179,000 (14.9%) | -4.5% |
| Indigenous people (living off reserve; aged 16 years and older) | 165,000 (21.9%) | 177,000 (24.1%) | +10.0% |
| First Nations (living off reserve; aged 16 years and older) | 91,000 (23.7%) | 93,000 (29.4%) | +24.1% |
| Métis (living off reserve; aged 16 years and older) | 70,000 (20.2%) | 80,000 (19.9%) | -1.5% |
| Immigrantsᶧ (aged 16 years and older) | 1,081,000 (12.7%) | 1,225,000 (14.0%) | +10.2% |
- Source: Statistics Canada, Canadian Income Survey, Table 13-10-0834-01 Food insecurity by economic family type; Table 13-10-0835-01 Food insecurity by selected demographic characteristics.
- Notes:
- *Referred to by Statistics Canada as persons designated as visible minorities.
- **Other racialized persons includes racialized groups not included elsewhere and persons who identified as more than one racialized group.
- ᶧReferred to by Statistics Canada as people who are, or have been, landed immigrants in Canada. Canadian citizens by birth and non-permanent residents (persons from another country who live in Canada and have a work or study permit, or are claiming refugee status, as well as family members living here with them) are not considered landed immigrants.
Grocery costs and food insecurity in 2022
Grocery prices rose by 9.8% in 2022, with prices increasing in almost every food category (Statistics Canada, 2023b). Large increases were seen in dairy products (+8.6%), fresh fruit (+10.4%), fresh vegetables (+8.3%), cereal products (+13.6%), and eggs (+10.7%). Official rates of food insecurity are not yet available for 2022. However, high food prices were a concern for many people living in Canada in 2022. Of all the rising costs, 43% of survey respondents were most concerned about the cost of food (Statistics Canada, 2022c). Adding to the rising cost of food, the CPI rose faster than average hourly wages on a year-over-year basis from October 2021 to April 2022 (Statistics Canada, 2022e). This means people living in Canada experienced decreasing purchasing power. As we heard in engagement, people feel forced to make difficult choices in how they spend money. Since people must pay housing costs and other fixed expenses first, they may have little money left for food.
In March 2022, food bank usage increased by 15% compared to March 2021 and 35% compared to March 2019 (Food Banks Canada, 2022). People cited the increasing cost of food as one of the main reasons they accessed food banks in 2022. Of those accessing food banks, 45.4% were from single-person households and 33.1% were children. Further, 14.1% cited employment as their main source of income. The percentage of Indigenous people accessing food banks grew from 8.0% in March 2021 to 15.3% in March 2022. Food bank usage also increased in racialized communities in 2022 (32.5%) compared to 2021 (14.4%).
Unmet health needs – An indicator of poverty tracked under the PRS
In 2021, the percentage of people who live in Canada who reported that their health care needs were not met during the past year increased to 7.9%, up from 7.2% in 2020 and 6.1% in 2019. Unmet health care needs were higher for females (8.9%) than males (6.9%). Of all age and sex groups, unmet health care needs were highest for females aged 35 to 44 (11.4%) followed by females aged 25 to 34 (10.2%).
Increasing unmet health care needs are partially attributable to the COVID-19 pandemic. Non-essential health procedures were delayed, with health resources being diverted to address issues related to the pandemic (Public Health Agency of Canada, 2022). Health care workers experienced high levels of burnout, absence, turnover and other mental health challenges (Statistics Canada, 2022b). This has contributed to patients experiencing long wait times for surgeries, emergency room closures and challenges accessing family health services. The pandemic also impacted other socioeconomic factors related to health, including food insecurity and social connection, among others. Persisting health inequities resulting from stigma and discrimination mean that people experiencing poverty as well as groups made most marginal are more likely to experience greater barriers to accessing health services.
Social exclusion and cohesion
This year, we also heard about social exclusion and cohesion from people with lived expertise of poverty and stakeholders. Social exclusion is a dynamic, multi-dimensional process by which people are unable to participate fully in economic, social, political and cultural life. Lack of access to material resources (income, employment, land and housing) or services (education and health care) hinders participation. Social exclusion also entails a lack of control over important decisions, as well as feelings of alienation or inferiority. Legal systems, land, labour markets and discriminatory or stigmatizing attitudes, beliefs, or perceptions may exclude people. People often unfairly experience disadvantage because of their:
- gender
- age
- location
- occupation
- race
- ethnicity
- religion
- citizenship status
- disability
- sexual orientation
- gender identity
Social exclusion robs individuals of dignity, security and the opportunity to lead a better life.
In 2021, the Government announced the Quality of Life Framework (QoL). The QoL Framework is an analytical tool that goes beyond traditional economic indicators to assess Canada's social and economic well-being (Statistics Canada, 2022g). The QoL Framework supports inclusive and sustainable growth to meaningfully improve the well-being of people who live in Canada. It consists of 84 indicators organized across 5 domains: Prosperity, Health, Society, Environment and Good Governance. The QoL Framework also has 2 overarching indicators: Life Satisfaction and Sense of Meaning and Purpose. The fairness and inclusion lens is intended to inform policy and program development, leading to greater equity and equality. It assesses how outcomes for quality of life indicators are distributed across different populations in Canada.
The quarterly Canadian Social Survey (CSS) is 1 data source that provides statistics on quality of life indicators. Based on findings from the CSS, by the fourth quarter of 2022, about 45.6% Canadians aged 15 or older felt a very strong or somewhat strong sense of belonging to their local community (Statistics Canada, 2023f; Statistics Canada, 2023g). However, sense of belonging varied among different demographic groups. Sense of belonging was lowest among those aged 25 to 54 years old (40.4%). On the other hand, it was highest among those 65 years and older (54.1%). 2SLGBTQ+ people had a lower sense of belonging (33.4%) compared to those who did not identify as 2SLGBTQ+ (46.4%). Sense of belonging was also lower among Indigenous people (36.1%) compared to non-Indigenous people (45.9%). Those with a disability, difficulty or long-term condition also had a lower sense of belonging (38.7%) compared to those without (51.0%).
The 2022 Toronto Social Capital Study illustrates the toll the pandemic has taken on social cohesion. It showed that in 2022, Torontonians reported having fewer close family members and friends than in 2018. They also reported that they are seeing their companions in person less often (Toronto Social Capital Study 2022, 2022). The same survey found that the proportion of people who volunteered for any organization in the past 12 months decreased from 37% in 2018 to 25% in 2022. This poses a serious challenge to the local not for profit sector. This is happening at a time when the needs of residents are greater (Toronto Social Capital Study 2022, 2022).
Social exclusion and poverty are interrelated in multiple and complex ways. Poverty is not only about income or material deprivation. It also interferes with human development and people's ability to participate fully in society. Conversely, members of groups who suffer exclusionary treatment may be victims of economic discrimination and eventually fall into poverty. However, not all members of socially excluded groups are poor. The Opportunity and Inclusion pillar of the PRS tracks aspects of social inclusion through the following indicators:
- relative low income (Low Income Measure)
- bottom 40% income share
- youth engagement (not in employment, education or training)
- low literacy and numeracy
Data are available for these indicators in Table 8 of Appendix D.
Youth Engagement – An indicator of poverty tracked under the PRS
Up until 2020, the proportion of youth aged 15 to 24 not in employment, education or training (NEET) had followed a gradual downward trend, decreasing from 10.5% in 2015 to 9.3% in 2019. However, the proportion rose to 11.8% in 2020 and remained elevated at 11.3% in 2021. In 2022, the proportion of youth NEET decreased to 9.6%, thus moving closer to the pre-pandemic rate. These statistics reflect the sharp impact that the COVID-19 pandemic had on youth engagement in 2020 and 2021.
Chapter 3 – What we heard
This was the fourth year that we have undertaken engagement to continue a conversation on poverty. This year we combined our first in-person sessions since the pandemic with virtual sessions. We took this approach to reach as many people as we could. It was important for us to meet people with lived expertise in person and where they are. We wanted to speak to the experiences they chose to speak to. It has been a privilege to speak to people with lived expertise of poverty, stakeholders, community organizations and experts in their fields.
Key themes
In speaking to people, it seems as though the feelings of hopefulness and optimism for change that we saw early in the pandemic have faded. Hopelessness and desperation have replaced these as the cost of living continues to increase and pandemic financial supports have ended. Some people experienced a higher level of support during the pandemic than they ever had previously. They were able to meet their needs better than before. Then those benefits ended, and the cost of living began increasing quickly. People returned to the same or an even worse position. That can be extra challenging after experiencing a better way of living. The following is not a full account of what we heard but is intended to highlight the key issues. We have organized the key issues into 4 themes. The overall themes that we heard largely reinforce what the Council has heard over the past four years:
- income inadequacy and impact of the rising cost of living
- the need to make equity and inclusion a priority
- challenges faced by specific populations made most marginal
- challenges accessing benefits and services
The richness and diversity of what we heard is difficult to capture in a concise way. But we feel it is important to share the stories, experiences and voices of the people with whom we engaged, in their own words. These expressions do not necessarily reflect our own thoughts, feelings or beliefs. In some cases, data backs the opinions we heard. In other cases, there may not be adequate data to support them. Either way, this summary aims to present what we heard in an authentic and honest way.
Income inadequacy and rising cost of living
Insufficient income
"You can't survive on social assistance rates."
We continued to hear about the inadequacy of income supports. In particular, we heard about social assistance, which is far below the cost of living. Inflation, particularly the price of food, has made the inadequacy worse. With rising costs, we heard that even people who are working full-time are struggling to make ends meet. Wages are failing to keep up with inflation. People who were already in poverty are sliding deeper into it. Those who were not in poverty are at risk of it now.
"You will never lift someone out of poverty if they're only receiving $700 a month. We struggle with how to really support individuals—we know that we're only giving people a tiny bit to get by."
Significant challenges also exist for people living in deep poverty. Existing federal government supports, such as tax credits, do not always offer enough help to those in the deepest need. For example, non-refundable tax credits are designed to reduce your federal tax payable. But they do not create a tax refund. As such, they have minimal impact on people with low income who pay little or no income tax, due to their income levels. Refundable tax credits reduce the amount of tax people have to pay. They also help people get a tax refund from the Government. Refundable tax credits give more support to people living in low income. For example, the Canada Workers Benefit provides support to workers with low income. However, people need to file income tax to receive tax credits.
Rising housing costs are exacerbating the housing crisis
Rising housing costs are very challenging, especially with the overall increase in the cost of living. High interest rates, rents and low stock are exacerbating the existing housing crisis at many levels. A direct link to increases in houselessness has followed. We heard that housing costs are so high that even once- affordable jurisdictions are becoming out of reach. Jurisdictions where housing has traditionally been more affordable have seen the highest increases in the country. The rising cost of housing has many consequences and is putting acute challenges on chronic problems:
- more encampments or tent cities have popped up in the inner city. More people are squatting in abandoned and boarded up houses
- people in rural and remote communities lack access to services where they live. They often make the choice to live houseless in a major city just for the opportunity to access services
- young people are expressing that they are forced to live in shared housing or unable to leave student housing
- gentrification pushes people out of the most desirable locations, away from affordable housing and essential services (major routes, hospitals, social services) and away from the areas they have spent all or most of their lives
- often, affordable areas are also food deserts
- once paying rent, people often do not have money left to afford other necessities and bills
The houseless population has doubled in some cities since pre-COVID, and encampments are popping up in cities. As a result, organizations are being forced to make encampment strategies to try to protect the people living in and around them. Society deeply stigmatizes houselessness, which makes people experiencing houselessness feel less than others. Feelings of hopelessness and othering contribute to isolation, which can worsen houselessness. Encampments can make people feel safe because they become a home base and a consistent part of life.
The increase in houselessness impacts other systems as well. For example, health systems are overloaded across the country. When living in rough conditions, people are likely to experience more health concerns. The health care system is not well equipped to treat and meet the needs of those without adequate shelter. When they receive care, the health system discharges people back into rough living conditions. They have no means to adhere to treatment plans, receive follow-up care or continue healing in a safe place. This makes it more likely that they will have increased health issues. In turn, this will result in more frequent encounters with the health system and higher costs over time.
"We presume that everyone has choices in life, but it's not true."
There were many challenges identified with subsidized and community housing. We heard that subsidized housing is overloaded and of poor quality. One person shared that they waited 4 years to gain access to housing. Others reported uninhabitable conditions, such as bedbug infestations. One participant noted that people cannot be considered for the subsidized housing waitlist if they have utility arrears that they are unable to pay. Needing to pay these first can be a barrier to accessing affordable housing.
"We cannot deal with anything else long-term if people are in a constant state of survival."
The rising cost of food is a significant challenge
Rising food costs are more challenging for those living in poverty. With rising rents and interest rates, less money is left over for food and other essentials. Food security between communities can vary greatly. Food banks offer some support for people who are having challenges accessing food. However, we heard that they are not the solution. Food security needs should not be met by relying on volunteers and donations. Instead, social assistance should be enough to allow people to meet their basic needs. Also, access is a challenge.
This matters because social determinants of health and food insecurity are connected. Health outcomes are worse for those who are food-insecure. They are more likely to:
- receive poor health diagnoses
- report greater issues relating to health than those who are not food-insecure
- have higher hospitalization/visit rates
- die early
A national school food program has been widely discussed. However, participants voiced concerns about its potential to solve food insecurity. A national school food program has benefits. But some participants felt that it should not be framed as a means to reduce food insecurity. This detracts from real policy solutions. Providing food to children in schools alone will not solve food insecurity, income will.
Stakeholders also noted that there needs to be an income-based intervention for food insecurity. For example, around 50% of food-insecure Canadians are single working-age people. Thus, a working-age benefit for single adults would help reduce food insecurity.
We also heard that food insecurity is racialized. For example, several people with lived expertise of poverty spoke about their communities (with a high proportion of racialized residents) having limited access to culturally appropriate food sources, affordable grocery stores and emergency food banks. Targeted approaches are needed to help groups more likely to be affected by food insecurity. It cannot be a "one size fits all" approach.
Promoting dignity, equity, and inclusion
As we heard in our engagement sessions, discrimination and racism continue to create and perpetuate poverty. Without explicitly addressing equity issues when developing policies and programs, interventions will continue to create or reinforce inequity. Some stakeholders noted that the Government needs to be more intentional about equity and inclusion, or they will accomplish neither. They also expressed that discriminatory ideologies continue to plague policy development and implementation.
We heard that the government needs to change its focus, refocusing on making sure everyone gets the benefits they need instead of protecting the system from abuse by individuals. Basic income is an important idea because everyone needs income. But if we do only that and we don't tackle the structures of exclusion, we won't solve the inequity.
In marginalized communities, a great history of building structures of support and mutual aid exists. These groups have a lot of strength and knowledge about how to solve issues within the community. Governments already have tools that communities can access to move forward on fostering inclusion and help themselves.
Social cohesion
With the twin forces of the COVID-19 pandemic and the growing economic crisis, we heard that people are disengaging from one another and even turning against each other. COVID-19 has created collective trauma, especially for those who were made marginal before the pandemic. Until we treat and heal the ongoing trauma and develop a more protective system, we cannot help people. We will continue to see trauma responses. Providing marginalized communities with funds is important, but there is also room to empower these communities to do the things they know how to do.
"We can see this with the convoy movement, hatred, antisemitism, and vile political discourse that is increasingly directed at specific groups of people who are already marginalized."
Populations disproportionally experiencing poverty and houselessness
Throughout the sessions, we heard about the specific challenges faced by many of the populations made most marginal. While there were many commonalities, each population also faces unique challenges. We also heard about a lack of targeted and specific supports for specific groups made marginal. These are populations that are disproportionally experiencing poverty and houselessness.
Intersectionality in accessing services
While we have presented the information below by population, we recognize that people are more complex than this and often have multiple intersecting identities.
We also recognize the additional challenges of navigating systems as people with multiple marginalized identities. There are many population-based services. However, those that have multiple identities must pick which identity to use when accessing services.
Intersecting forces concentrate poverty in certain communities. As a result, it can be very difficult to support people with multiple complicated challenges. Unfortunately, we don't build services to support people with multiple challenges. We need services that provide a multi-pronged approach.
Working-age singles
There was a significant focus in our engagement sessions on the challenges faced by working-age singles. The percentage of working-age single people living in poverty remains elevated, and few targeted supports are available for them. Wages are a significant contributing factor. Despite working full-time or working multiple jobs, many working-age singles stay in poverty due to inadequate wages.
We also heard that the narrative for single working-age individuals creates a challenge. It often describes them as undeserving of help, with children and seniors having received priority for more targeted supports. As a result of this narrative, there can be a feeling of disenfranchisement and exclusion among this population. Some have lost confidence in governments and institutions. That disenfranchisement can lead to people feeling disconnected from community and government. This can create an environment where disinformation and conspiracy theories can spread. People feel though, that this narrative is starting to change to include working-age singles as needing greater support.
Youth
For young people in general, family conflict and intergenerational poverty tend to be the root of poverty. In cases of neglect or abuse, children are removed from their families. However, in some cases, the challenges are related to poverty and income insecurity, but are labelled as neglect. To support and keep families together, it would be better to redirect resources for foster care to these families before their children are removed. Instead, funding is given to foster parents to care for those children. Youth are often bounced in and out of care (between foster parents and biological parents) which causes disruption to routines, a lack of stability that set youth up poorly for life and contributes to poverty in their own adult lives.
"Poverty doesn't mean you can't parent."
Young people in Canada who are involved with child protection make up a small part of the overall population. However, they are overrepresented in houselessness. Long-term consequences of houselessness could be prevented by better addressing youth houselessness. This group is a feeder system for those who will experience chronic houselessness. Half of houseless people have their first experience of houselessness before they're 25.
Stakeholders also noted that a narrative exists of youth poverty as a rite of passage. However, this is a gateway to intergenerational poverty. Youth who are couch surfing are in situations where they cannot develop themselves, their professional skills or their education. They also cannot support their mental/physical health. Youth experiencing houselessness unwillingly enter the workforce to afford essential services (such as housing) before having an opportunity to finish education, training, or apprenticeship. Trauma, insecurity and mental health challenges are associated with this. Youth often find themselves seeking stability rather than being able to thrive.
People who identify as Black
Anti-Black racism perpetuates and worsens the conditions of child welfare, housing, food security, and poverty more generally. The areas that experience high rates of poverty are often Black communities. What is provided may not align with what is needed. Racism exists and is obvious to those who experience it. However, groups who experience it are often asked to prove that it exists, which can be difficult to do. Anti-Black racism in our systems creates cognitive dissonance, confusion and despair. A gender and diversity lens would help to improve policy development for all communities.
"Black youth are disproportionately represented in the system; we need to turn off the tap and keep families together."
As noted earlier, we confuse poverty and insecurity with neglect, and we take children away instead of helping families. We heard that Black communities are the easiest demographic to exploit. Systems changes are needed to offer funds and support to keep families together, rather than removing children to place them in care. Keeping families together will lead to better outcomes for all.
First Nations, Inuit and Métis people
Colonial practices have shaped and developed systemic barriers for Indigenous people and communities. Systems are not designed to serve people and communities that have experienced so much trauma. This makes it difficult to trust schools or systems to help their children or families. Generations of impacts of the residential school system are being played out in the child welfare system. A recent report by the Office of the Child and Youth Advocate in Alberta found that the presence of the child intervention system in the lives of Indigenous young people is disproportionate to its presence in the lives of non-Indigenous young people.
"We have generations and generations of impacts of residential schools."
We heard that the window of opportunity to teach Indigenous children about their culture, heritage and languages and to instill pride in that identity is small. We also heard about the need for greater control for Indigenous people and communities. Efforts continue for a greater say in and control over the systems that impact their lives.
"I've been fighting with Child Services for 25 years for us [Indigenous people] to have some say in our children being put into care. Little has changed in those 25 years."
2SLGBTQ+ people
Systemic homophobic and transphobic violence and discrimination, violent victimization, including gender-based violence and discrimination, and barriers to employment and housing experienced by 2SLGBTQ+ individuals result in high rates of poverty and houselessness. We heard that for people in the 2SLGBTQ+ population, safety and security are paramount. They often face violence and discrimination because of their identity and who they are. Many have experienced trauma as a child, youth or adult. Those who identify as 2SLGBTQ+ note that they are not secure in spaces such as shelters that are not safe, inclusive and affirming.
"Youth would rather sleep under an underpass than access services."
We heard about the need to decriminalize street living. We also heard about a need to protect the safety of those who experience houselessness. There is often direct conflict between law enforcement and those in poverty. As a result, 2SLGBTQ+ persons have poor relationships with police, even if they are asking for police protection.
"There is a deep distrust of service and service providers."
Population-based programs are important. They afford the opportunity for people to create a community with people who accept them and share similar experiences. 2SLGBTQ+ people are disproportionately represented among those experiencing houselessness. The pathway to houselessness typically begins with identity-based family conflict (based on one's sexual orientation and/or gender identity). Then they face a system that is difficult to access and completely discriminates against them.
Only a handful of programs offer specialized services to 2SLGBTQ+ persons. These often offer only short-term and emergency solutions rather than long-term solutions. Services focussed on providing mental health support are lacking. This contributes to the high rates of chronic mental health issues experienced by 2SLGBTQ+ individuals. Waitlists for shelters are long. Sometimes service providers refer people to a 24-hour McDonald's or the airport to have a warm place to sleep.
"Queer youth are consistently being traumatized when accessing services."
Significant barriers exist for the 2SLGBTQ+ population. They face barriers to employment and housing due to discrimination and stigma. They also face barriers to accessing programs and services. Many applications require documents or information that 2SLGBTQ+ persons may not have. For example, parents may withhold documents (for example, identification) from their children whom they have rejected. Social assistance and student loans are two examples of supports for which they may be denied. Otherwise, they must prove and thus relive family breakdown.
Newcomers to Canada
Depending on how newcomers come to Canada, they can face significant challenges. When someone arrives as a refugee, they receive support for the first year through Immigration, Refugees and Citizenship Canada (IRCC) programs. These programs are more adequate than social assistance, but people are still living in poverty. After the first year is over, they are moved onto social assistance and the rates are even lower. If they have other challenges (mental health, language, etc.), they may fall deeper into poverty. New approaches and changes to programs made it easier for people fleeing Ukraine and Syria to come to Canada. These offer new ways to do things and could be used to make things better in the future.
Work permits are often a pathway to citizenship. However, when someone is on a work permit, despite paying taxes, they and their families do not have access to IRCC support. This can make it more difficult to transition to life in Canada.
Regardless of how someone comes to Canada, we heard people face issues being included in the immigration and refugee system at the federal level. We also heard about the lack of specific resources for 2SLGBTQ+ newcomers, especially for those fleeing communities or cultures where their sexuality or gender identity is not accepted or legal. They may feel unable to access services due to fear that accessing services will show they were unsuccessful transitioning to Canada. In turn, this makes them fear that they may be forced to return to a country where their safety is jeopardized. Participants provided the example of 2SLGBTQ+ refugees being asked to prove they are gay, especially when they have children. This creates a significant barrier to people trying to access basic services. People may feel forced into survival sex work, black market trade, etc. This is further complicated by the reality that many refugees are Black which adds added intersectional issues.
People living in institutions
The in-person engagement sessions provided us an opportunity to talk to people who live or have lived in institutions. This includes the criminal justice system, the health care system and the child welfare system. We heard that leaving institutions can be a tipping point to poverty and houselessness, as supports are often lacking. Also, people leaving institutions face significant challenges related to securing employment and housing.
Children of incarcerated parents face added challenges.
- They may leave the child welfare system when parents are released from prison. Sometimes though, their parents cannot return to the same community, so they need to move/change schools
- Parents are released from institutions and need to take care of themselves. They may not have the capacity to also take care of kids
- Kids experiencing family breakdown and living in care have much higher rates of poverty and houselessness
Poverty in rural and remote communities
Living in rural and remote communities can present specific challenges. Small towns and rural areas can have higher rates of hidden poverty and hidden houselessness. We heard examples of people who are living in forested areas, permanently camping. Services can be hard to access. Some participants shared that they had moved to smaller cities or rural areas to access more affordable housing. But at the same time, services were centralized in large urban areas. They were forced back to the city to access services but were unable to afford housing.
Rural areas need specific policy and program responses to meet their specific needs. Sometimes rural environments are treated as urban environments in policies, which can have disastrous consequences. Job opportunities are more limited, so job creation in rural areas is essential. There can also be limited opportunities to socialize with other kids and programs may not be available nearby. Travel is another significant challenge. Accessing employment or services can be hard without a car. People even need transportation to get to driving classes.
Women and children
We also heard about some of the specific challenges faced by women and children, especially in shelters. Many women in poverty experience issues of gender-based violence. They may fall into poverty when fleeing family violence. They may also not have the resources to flee family violence.
Growing up in poverty has lifelong impacts. Many kids who are in precarious housing, shelters or houselessness are not able to consistently attend school or after-school activities and supports. They are food-insecure. Also, stigma is associated with living in poverty. Those living in poverty are often perceived as people who must have made poor choices. For example, people may perceive a senior living in poverty as irresponsible for not having saved money. Others may judge a woman for being a single parent. They may also perceive women as irresponsible for having children without means to support them.
Challenges accessing benefits and supports
As in past years, we continued to hear about the difficulties people experience trying to access benefits and services. This was especially true for people with multiple intersecting marginalized identities. We heard that we need to increase benefits and reduce the administrative burden of access. Some of the issues participants spoke of:
- accessing government services, including social assistance, is a long, complicated process
- people face persistent problems with government systems (for example, the Canada Revenue Agency does not understand and adapt to the issues that Canadians face)
- there is too much oversight involved with receiving support. People need to have a fixed address to access many services and supports. Since housing is unaffordable, many people do not have a fixed address
"This is my pet peeve of the century. Forms are inaccessible, too long, they're not in plain language. It would be nice if we had one application. If my dad hadn't helped me fill out my provincial and federal applications for disability, I would probably never get it."
Many participants felt that access to a lot of programs and services was improved during the COVID-19 pandemic. This had a real material impact on communities. Greater access to information on available supports and neighbourhood-level community services are necessary. Supports need to be provided where people are living. Wraparound supports are essential, especially if they are all localized in the same physical space. Co-locating federal/provincial services and non-government organizations to achieve wrap-around services is very effective. For example, in Toronto the Yonge Street Mission hosts a Children's Aid Society worker at their site to help families in need. Discussions have also occurred about hosting Children's Aid Society family visitations at the Yonge Street Mission. This would help improve the environment around family reunion.
Systems are punitive and difficult to navigate
"I had to lie to get what I had but have to continue to lie to keep it."
Stakeholders continue to describe systems that strip people of their dignity and have complex and often contradictory rules. Some people shared examples of feeling like they had no choice but to lie to get needed supports. They felt that the system is very punitive, and that people will do what they need to survive.
"You have to manipulate the system in order to get adequate supports."
We heard that the Service Canada interface doesn't work for many. It is difficult to navigate and is a real barrier. The delays between applying and receiving payment are also significant issues. Those who are single and in low income situations are very vulnerable to delays in payment.
Strains experienced by service providers and their staff
As with past engagement sessions, we once again heard about the challenges facing community organizations and service providers. The model for non-profits should be honest partnership, not competition. Community organizations often struggle to secure funding because communities are pitted against one another. It's a constant fight for sustainable funding. The constant process of applying for funding is a burden on organizations. In contrast, long-term contracts and ongoing funding would be a welcome change. Many organizations noted that they cannot support a living wage for lots of employees due to limited funding.
Spending that alleviates root causes of poverty will always be most effective in the long term. Stakeholders also identified that services that help/intervene before crisis situations as well as give support after crisis are important. This includes investments in health care, youth services, families and employment training.
Government systems often lack the flexibility and capacity to adequately meet the complex and unique needs of individuals. Community services are often best equipped to tackle many poverty-related issues but are not adequately funded to do so. A considerable challenge for organizations is that many of them rely heavily on private funding, which is not sustainable. That funding is often time-limited and focused on one project or program of an organization's overall service offering. There is little or no process funding built in to operate the organization.
The current funding models also stifle innovation because they have no room for mistakes. Organizations cannot implement innovative solutions because funding models make people reluctant to try. Governments and organizations consider this a risk management issue, which make leaders hesitant to enact change or make mistakes. We heard that we need to allow governments and organizations to make mistakes when thinking about innovative solutions.
"We never have enough. There's never enough money for organizations to provide community services."
We also heard from front line workers that they face significant challenges. Some people noted that the last five years have been traumatizing for organizations working in housing and houselessness. Frontline essential workers, many of whom are racialized and/or women, were seen as the "sacrificial worker." We heard that it can be traumatizing, especially for new social workers and practicum students, to see what is happening and the unmet needs. And it leaves them feeling deflated.
"We need coordinated efforts and partnerships to address poverty – but that requires sustained funding."
Chapter 4 – What now: A call to action
The Council is focussed on several significant challenges facing families and individuals.
Increasing poverty rate
For the first time since the introduction of Opportunity for All: Canada's First Poverty Reduction Strategy, 2021 saw an increased number of people in poverty. As noted in our 2022 report, Transforming our Systems, this increase was anticipated. The poverty rate had been falling since 2015 but saw a sharper decrease in 2020 due to the introduction of emergency COVID-19 income benefits.
The introduction of emergency benefits offered us several learnings that are important to remember for benefit delivery, developing new benefits and supports, and overhauling existing service provision. Although the emergency benefits were not intended as a poverty alleviation measure, they lifted many above the poverty line. We saw that direct income benefits can have a dramatic impact on the poverty rate. This is learning number 1.
Not only were the benefits more (although not sufficiently) adequate, but they were easier to access. Some payments were issued automatically (for example, people did not need to apply). For other benefits, people could apply online, increasing access for many, including those living in rural and remote communities. Furthermore, applications were simple, and approvals and payments were swift. This is learning number 2.
At the same time, governments gave more funding to organizations to augment their capacity to offer much-needed and enhanced wrap-around supports and services. This included technology, more shelter spaces, food and mental health support. This is learning number 3.
This said, while the poverty rate decreased a lot in 2020, the decrease was not equitable across all groups. Those made most marginal were often ineligible for the emergency benefits (for example, those with no or precarious labour-market attachment). As a result, those who were living in the deepest poverty were left out. For example, many minimum wage earners, like young people entering the work force, did not qualify for the threshold of $500 a week. This is learning number 4.
The elimination of the emergency benefits and/or the clawbacks of overpayments has been to the detriment of many. Yet some of these people who received the CERB had applied for it in good faith, believing that they were eligible. Now, they must pay back the money they received. This is the same population that is not likely to have assets or savings to draw on. Add to this high inflation, high interest rates and a rising cost of living. More people in Canada are falling into poverty. It is concerning that this increase in the poverty rate is happening at a time of record employment rates. This suggests that wages are increasingly insufficient for people to meet their basic needs.
Ultimately, community organizations and governments were forced to re-evaluate some of the existing programs and services. There was a sense of optimism among some people that things could be done differently and that we were all in it together. That feeling seems to have been replaced with a sense of desperation. More people are struggling with inflation and high interest rates and are falling back or further into poverty.
Inflation and the rising cost of living
We have discussed high inflation levels and the associated rising cost of living throughout the report. These are putting stress on families and individuals. We are starting to see this in the 2021 data, with the rising number of people living in poverty. We also heard directly from people who are feeling the pinch. People who were already living in poverty are moving into deeper poverty. When the data is available in 2024, we expect to see the poverty rate rising further in 2022. Government benefits and wages are not keeping up with the rapid pace of inflation and profiteering. As a result, people on the edges of poverty and in middle income are seeing their budgets stretched thinner. They are finding themselves in more uncertain positions.
The housing crisis and increasing levels of houselessness
"The cost of housing is keeping me homeless."
Due to inflation, rising interest rates and a lack of affordable housing, we heard throughout our engagement sessions about the ongoing housing crisis in Canada. Housing is deeply unaffordable and out of reach for many people. Even once-affordable communities have seen dramatic increases in housing costs. All of this in spite of the federal National Housing Strategy put in place in 2019 to help ensure Canadians have access to affordable housing that meets their needs. The lack of affordable and adequate housing has many consequences. This includes an increase in the number of people who are precariously housed, houseless, or living in shelters, encampments or tent cities.
Many people do not have money left to afford other necessities and bills after paying for housing. Young people do not see how they will be able to afford to own a home. They are staying longer in apartments, which are no longer available to new renters.
In Canada, the housing system is market-driven with low levels of social housing. Because of this, people are exposed to market fluctuations in housing. This system may work for many people. But an unregulated housing market is unlikely to provide homes for people who are made most marginal. We may need to fundamentally rethink the system, or the size of government-funded housing, to make sure that housing does not fuel poverty.
According to the 2022 Auditor General of Canada's report on chronic homelessness (Office of the Auditor General of Canada, 2022), the National Housing Strategy is intended to "improve housing outcomes and affordability for Canadians in need, including reducing chronic homelessness by 50%," and names 11 groups most vulnerable. The report notes that the lead federal departments for the Strategy cannot confirm whether housing outcomes have been improved for these vulnerable groups. The report also finds that accountability and coordination are largely absent.
"There's no such thing as affordable housing anymore."
As more people are forced into insufficient housing or houselessness, we are going to see the long-term impact. The impact on children who are experiencing houselessness can be long-lasting. They may be unable to attend school, lack safety and security, and have fewer social connections. Their self-worth may also suffer. Youth who cannot afford housing may be pushed out of higher education, training or apprenticeship. This is because they may need to unwillingly enter the workforce to afford essential services.
"Houselessness is traumatizing."
A lot of stigma is associated with houselessness. This includes othering people who are houseless, equating houselessness with crime, and treating people who are houseless more harshly. There is a sense that the push to address houseless encampments and people living rough is not because it is the right thing to do. Rather, it is because people do not want to see the houseless population or fear them. Many people who are facing houselessness do not trust institutions. Paradoxically for some people, sleeping rough is the safer choice. People do not want to stay in a shelter for many reasons. These include:
- some shelters are religion-based
- some shelters are inadequate for women and children fleeing violence
- fear of violence
- fear of racism, transphobia and discrimination
Food insecurity
Rising food costs amid overall rising costs are further challenging those living in poverty. With much of income being spent on housing, inflation and profiteering, food is becoming harder for people to afford. Throughout the pandemic there were significant resources provided for emergency food services (for example, food banks). Many of those supports have since been discontinued.
"Food insecurity is a window to material deprivation."
Disenfranchisement
There seems to be a growing feeling of disenfranchisement and exclusion, especially among working-age singles living in poverty. This disenfranchisement can cause people to feel disconnected from community and government. It can also create an environment for the spread of disinformation. In the past, poverty was dealt with through social cohesion and social capital. People feel this is eroding.
With the twin forces of the choices made around the COVID-19 pandemic and the growing economic crisis, there is a sense that people are disengaging from one another at best, and at worst, turning against each other. There were some deliberate choices by some people to drive people apart. Some people used the pandemic responses as an opportunity to divide people for the purpose of political support. We can see this with hatred, discrimination and vile political discourse that is increasingly directed at specific groups of people who are already made marginal.
"There is a poverty of connection."
Inequity, racism, and discrimination
Discrimination, racism and inequity continue to place some people at greater risk of living in poverty. Higher rates of poverty for those made most marginal is evidence of this. Governments need to be intentional about equity and inclusion for those made most marginal, or they will accomplish neither. Equity must come before equality. Some examples of the effects of systemic barriers and colonial practices:
- generations of impacts of the residential school system are being played out in the child welfare system
- 2SLGBTQ+ individuals experience a lack of social inclusion and high rates of poverty. Where research demonstrates this, it has not always made its way into policy development and implementation
- the areas that experience high rates of poverty are often Black communities. Anti-Black racism and income inequality in our systems creates cognitive dissonance, confusion and despair. Anti-Black racism perpetuates and worsens the conditions of child welfare, housing, food security, and poverty more generally
Lessons learned from temporary COVID-19 benefits
The early days of the pandemic were a time of great uncertainty, upheaval and change. Seemingly overnight, systems and processes needed to be adapted to an unknown reality. Governments pivoted and focussed on providing urgent support when schools and workplaces closed with people told to isolate at home. Things we thought we could not do, we had to do because existing systems were not built to work in the context of the pandemic. Insights gained from this flexibility should inform retooling systems to minimize the impact of future social, environmental and economic shocks.
Earlier in this chapter, we noted several lessons learned from the Government of Canada's response to the COVID-19 pandemic. Throughout this time, there was an overall message of "building back better" from the pandemic. However, we think the focus should be on "building back fairer." For example, public health messaging like "stay at home," did not resonate with people experiencing houselessness and poverty.
In her 2021 report, the Chief Public Health Officer stated: "A strengthened public health system must also work with other sectors to address the broader social, economic, and ecological circumstances that influence whether people can reach their full health potential. As we are seeing with COVID-19, communities that experience unfair disadvantages in relation to housing, education, income, employment, food security, and other daily living conditions, also experience worse health outcomes." (Public Health Agency of Canada, 2022).
These lessons learned, coupled with the stark interplay of poverty, housing need and food insecurity and the persistence of systemic barriers, discrimination and racism obligate a renewed call to action. As part of this call, we remind the Government of Canada to deliberately put people with lived expertise of poverty at the centre of design, implementation and evaluation of its policies, programs and services, to achieve equity. Co-development is paramount.
Call to action
Over the past 3 years, this Council has made a series of recommendations to reduce poverty. These recommendations were made after examining existing data, and engaging with people with lived expertise of poverty, stakeholders, community and advocacy organizations and academics and experts in the field. They also build on the expertise and experience of the Council members. For this reason, we have chosen to use this report to reassert that the Government of Canada take urgent action in the 5 areas where we have made previous recommendations. Taken together, we strongly believe that they would create a stronger, simpler, more equitable and more proactive safety net. They will help reduce poverty, support people who need it most and create a more equitable and inclusive society.
Urgent action to decrease Indigenous poverty
For the Council, it is egregious and shocking that colonial practices, racist policies and programs, and discrimination have created and perpetuated poverty in Indigenous communities. The Government of Canada has made recent investments towards reconciliation. However, they must continue to work to earn the trust of First Nations, Inuit and Métis people to make much needed progress in reducing poverty. Extensive research and recommendations abound. It is imperative to carry out the calls to action from the Truth and Reconciliation Commission as well as the calls for justice from Reclaiming Power: The Final Report of the National Inquiry into Missing and Murdered Indigenous Women and Girls. To this end, the Government of Canada should continue the following actions:
- work with First Nations, Inuit and Métis people to improve data collection to allow for the evaluation of poverty reduction investments and supports for Indigenous people. This can help to provide a baseline to evaluate new measures, including Bill C-92, An Act respecting First Nations, Inuit and Métis children, youth and families
- support Indigenous leaders to reduce poverty in their communities and to ensure they have all the resources available to support their own people in their own way. This includes the co-development of:
- Indigenous indicators of poverty, as committed to in the Poverty Reduction Strategy
- a range of Indigenous poverty reduction strategies such as distinctions-based housing strategies, as committed to in the National Housing Strategy, and commitments made through the Indigenous early learning and childcare agreements
Dignity, equity and inclusion
Groups made most marginal (in alphabetical order):
- 2-spirit, lesbian, gay, bisexual, transgender, queer or questioning (2SLGBTQ+) people
- Black and other racialized communities
- children and youth in care
- First Nations, Inuit and Métis people
- people who are experiencing houselessness
- people who are involved in the criminal justice system
- people who are living in institutions (such as long-term care homes)
- people who are living in rural and/or remote areas
- people who have emigrated to Canada
- people with disabilities
- people with refugee status or who are undocumented or non-status
- women
We know that there are groups who have been made most marginal through racism and discrimination.
The Government of Canada must continue to support equity-enabling efforts such as:
- the Canada Disability Benefit
- the Black Entrepreneurship Program
- initiatives under the Indigenous Early Learning and Child Care Framework
They must also continue to challenge any and all discriminatory ideologies that impede equity in policy development and programming. Without explicitly dealing with equity when developing policy and programs, interventions will create or reinforce existing inequity. Equity must come before equality.
Groups made most marginal experience deeper poverty and face more barriers to full inclusion in society. We have not seen an adequate response to this issue. Despite recent improvements to disaggregate data, we need more data and information about specific groups to inform targeted strategies. We also need robust gender-based analysis plus (GBA+) to remove systemic barriers in program and policy design. Exploring the benefits and challenges of linking datasets across jurisdictions and topics may give further insights. These changes combined will help to develop targeted initiatives and to better measure progress towards greater equity in poverty reduction. To ensure that Canada's poverty reduction efforts work as well for those at highest risk, and to meet the unique needs of people made most marginal, the Government of Canada should:
- commit to develop and resource a plan to reduce current inequities in poverty that sets explicit targets to reduce poverty by at least 50% by 2030 for all populations made most marginal
- prioritize and improve the collection, analysis, application of and access to disaggregated data for all populations made most marginal, to support evidence-based decision making and reporting of disparities:
- all Statistics Canada and federal population-based surveys should ask inclusive questions and provide inclusive response options on Indigenous heritage, immigration/refugee status, race/ethnicity, disability, prior or current institutionalization, and sexual orientation and gender identity
- incorporate an equity lens into its GBA+ when developing and implementing strategies, policies, and programs
Income adequacy
We have heard consistently over the past 4 years that existing government benefits and minimum wage are insufficient for people to meet their needs. High inflation rates and increases in the cost of living have made this much worse. To prevent people from falling into or further into poverty, the Government of Canada should take the following actions:
- work with the provinces and territories to establish, by 2030, an income floor above Canada's Official Poverty Line, whether it be through employment income, income supports (including social assistance), new or enhanced existing targeted supports or a combination of the 3
- this includes accelerating work underway on targeted benefits and supports for populations with disproportionately high rates of poverty, as well as undertaking a gap analysis, informed by an equity lens and GBA+, to identify what is missing
- lead by example, by establishing a living wage in all federally regulated workplaces by 2030. Introduce worker protections through the Canada Labour Code to curb the social and economic disadvantages of precarious work, by expanding access to employment benefits for self-employed workers, workers in the gig economy and part-time workers
- take a leadership role in both providing and incentivizing better employment opportunities for marginalized groups, including Indigenous people, racialized individuals, immigrants, refugees, youth, persons leaving institutions and persons with a disability
Increasing access to benefits and services
Poverty is intersectional. As such, people often rely on many benefits, supports and services, provided by different levels of government and the non-profit sector. No single, streamlined point of access exists. Each benefit, support and service has its own application process and eligibility criteria, even when intended for the same group. We continue to hear that people are often unaware of benefits, supports and services. Even if they are aware, the application forms and processes are confusing and complicated. Finally, receiving income-tested supports is dependent on filing taxes, which many people living in (deep) poverty do not do. In short, our current social safety net is complex, difficult to access, inefficient, outdated and inadequate. Navigating this fragmented and complicated maze can be traumatizing for people who have already been made most marginal in society. Some people may give up and miss out on much-needed benefits to which they are entitled. As government benefits and supports are essential tools in poverty reduction, we urge the Government of Canada to take the following actions:
- prioritize and accelerate commitments made to implement automatic tax filing for those with low income. This will ensure eligible individuals are receiving the benefits to which they are entitled (for example, the GST/HST credit, the Canada Child Benefit, the Canada Workers Benefit and the new Canada Dental Benefit). This is a necessary first step in the design and implementation of automatic enrolment in other income-tested benefits and programs
- this is consistent with the 2022 Auditor General of Canada's report on access to benefits for hard-to-reach populations (Office of the Auditor General of Canada, 2022). The report finds that estimates of benefits take-up are overstated, as estimates do not always account for people who have not filed tax returns
- ensure that services are streamlined to make them low-barrier and easier to access (also in line with the Auditor General's report)
Prevention and protection
Poverty reduction efforts often focus on lifting people out of poverty. However, we stress the need to invest in keeping people from falling into poverty in the first place. Upstream investments require supporting people during challenging transition periods, such as when ageing out of care or exiting institutions. For example, providing supports to families to keep their children with them, rather than removing them and then paying for their foster care, contributes to better outcomes. It is also simply the right thing to do. Too often, we heard that poverty is mislabelled as neglect. This also means providing sufficient and sustainable government supports to service providers and not-for-profit organizations that are a crucial part of community-level efforts to prevent poverty. It also includes addressing the social determinants of health. Experiences of discrimination, racism and historical trauma are important social determinants of health for certain groups, such as:
- Indigenous people
- 2SLGBTQ+ people
- people who identify as Black
Since the release of our first report, the Government of Canada has made significant investments that will assist people living in poverty (see Annex B for a detailed list). However, we reiterate that more needs to be done to keep people out of poverty. To this end, the Government of Canada should take the following actions:
- build on recent investments in non-profit and community-based organizations that support people living in Canada with low incomes, with a focus on sustained core funding. Organizations need capacity to do what they do best for the populations who trust them. This should include funding for systems navigators for individuals and families trying to access government benefits and supports, until such time as access barriers are removed
- develop (or rebuild) robust systems and structures focussed on early interventions and prevention
- this entails swift implementation of announced supports, including expansion of the Canadian Dental Care Plan and increased funding for development of the Canada Disability Benefit
- establish an independent National Commissioner for Children and Youth, whose role would be to focus on children and youth who are made most marginal, to complement and bolster the Council's effort to amplify their voices, to ensure their needs are met
This call to action underscores continued implementation of the Poverty Reduction Strategy, in a way that ensures dignity and equity for all. The Government of Canada must continue to strategically invest in important social programs and benefits that allow people to meet their basic needs and stay out of poverty. This includes ongoing investments in:
- housing
- transportation
- health
- mental health
- food security
- educational attainment
- skills development
- family supports
- emergency preparedness
These investments should also support social cohesion and reduce racism and discrimination. At the same time, the Government should prioritize (re)building resilient, adaptable systems to support people through both individual transitions and broader system shocks. Let us learn from the good, the bad and the ugly of the pandemic, show people living in poverty that we are listening and put people at the centre of the program and policy design.
References
Devin, N., Gustajtis, B., & McDermott, S. (2022, November 3). Technical paper for the Northern Market Basket Measure of poverty for Yukon and the Northwest Territories. Income Research Paper Series. Statistics Canada, Government of Canada. Retrieved from https://www150.statcan.gc.ca/n1/pub/75f0002m/75f0002m2022004-eng.htm
Dionne-Simard, D., & Miller, J. (2019, September 11). Maximum insights on minimum wage workers: 20 years of data. Labour Statistics: Research Papers. Statistics Canada, Government of Canada. Retrieved from https://www150.statcan.gc.ca/n1/pub/75-004-m/75-004-m2019003-eng.htm
Employment and Social Development Canada. (2023, May). Severe food insecurity vs poverty line: Highlights from the Canadian Income Survey (CIS).
Food Banks Canada. (2022). HungerCount 2022. Mississauga: Food Banks Canada. Retrieved from https://hungercount.foodbankscanada.ca/assets/docs/FoodBanks_HungerCount_EN_2022.pdf
Heisz, A., & Gustajtis, B. (2023, January 17). Market Basket Measure poverty thresholds and provisional poverty trends for 2021 and 2022. Income Research Paper Series. Statistics Canada, Government of Canada. Retrieved from https://www150.statcan.gc.ca/n1/pub/75f0002m/75f0002m2022008-eng.htm
Infrastructure Canada. (2023, April 28). Everyone Counts 2020-2022: Preliminary Highlights Report. Government of Canada. Retrieved from https://www.infrastructure.gc.ca/homelessness-sans-abri/reports-rapports/pit-counts-dp-2020-2022-highlights-eng.html
Laidley, J., & Tabbara, M. (2022, November). Welfare in Canada, 2021. Maytree Foundation. Retrieved from https://maytree.com/welfare-in-canada/
National Housing Council. (2023, April). Renewing Canada's National Housing Strategy. Retrieved from https://cms.nhc-cnl.ca/media/PDFs/NHS_Report-FINAL.pdf
Office of the Auditor General of Canada. (2022, November 15). Report 5: Chronic Homelessness. Reports of the Auditor General of Canada to the Parliament of Canada. Office of the Auditor General of Canada. Retrieved from https://www.oag-bvg.gc.ca/internet/English/parl_oag_202211_05_e_44151.html
Public Health Agency of Canada. (2022, April 1). Report summary: A Vision to Transform Canada's Public Health System. Chief Public Health Officer's Report on the State of Public Health in Canada 2021. Government of Canada. Retrieved from https://www.canada.ca/en/public-health/corporate/publications/chief-public-health-officer-reports-state-public-health-canada/state-public-health-canada-2021/summary.html
Statistics Canada. (2022a, January 19). Consumer Price Index: Annual review, 2021. The Daily. Government of Canada. Retrieved from https://www150.statcan.gc.ca/n1/daily-quotidien/220119/dq220119b-eng.htm
Statistics Canada. (2022b, June 3). Experiences of health care workers during the COVID-19 pandemic, September to November 2021. The Daily. Government of Canada. Retrieved from https://www150.statcan.gc.ca/n1/daily-quotidien/220603/dq220603a-eng.htm
Statistics Canada. (2022c, June 9). Rising prices are affecting the ability to meet day-to-day expenses for most Canadians. The Daily. Government of Canada. Retrieved from https://www150.statcan.gc.ca/n1/daily-quotidien/220609/dq220609a-eng.htm
Statistics Canada. (2022d, July 21). Housing challenges remain for vulnerable populations in 2021. The Daily. Government of Canada. Retrieved from https://www150.statcan.gc.ca/n1/daily-quotidien/220721/dq220721b-eng.htm
Statistics Canada. (2022e, August 18). Income, meet inflation. StatsCan Plus. Government of Canada. Retrieved from https://www.statcan.gc.ca/o1/en/plus/1615-income-meet-inflation
Statistics Canada. (2022f, September 21). To buy or rent: The housing market continues to be reshaped by several factors as Canadians search for an affordable place to call home. The Daily. Government of Canada. Retrieved from https://www150.statcan.gc.ca/n1/daily-quotidien/220921/dq220921b-eng.htm
Statistics Canada. (2022g, November 10). About the Quality of Life Framework for Canada. Quality of Life Hub. Government of Canada. Retrieved from https://www160.statcan.gc.ca/about-apropos-eng.htm
Statistics Canada. (2023a, January 6). Labour Force Survey. The Daily. Government of Canada. Retrieved from https://www150.statcan.gc.ca/n1/daily-quotidien/230106/dq230106a-eng.htm
Statistics Canada. (2023b, January 17). Consumer Price Index: Annual review, 2022. The Daily. The Government of Canada. Retrieved from https://www150.statcan.gc.ca/n1/daily-quotidien/230117/dq230117b-eng.htm
Statistics Canada. (2023c, February 13). One in four Canadians are unable to cover an unexpected expense of $500. The Daily. Government of Canada. Retrieved from https://www150.statcan.gc.ca/n1/daily-quotidien/230213/dq230213b-eng.htm
Statistics Canada. (2023d, March 17). Table 34-10-0133-01 Canada Mortgage and Housing Corporation, average rents for areas with a population of 10,000 and over. Government of Canada. Retrieved from https://www150.statcan.gc.ca/t1/tbl1/en/tv.action?pid=3410013301
Statistics Canada. (2023e, March 29). Census Profile, 2021 Census of Population. Government of Canada. Retrieved from https://www12.statcan.gc.ca/census-recensement/2021/dp-pd/prof/index.cfm?Lang=E
Statistics Canada. (2023f, March 30). Quality of life indicators from the Canadian Social Survey, fourth quarter 2022. The Daily. Government of Canada. Retrieved from https://www150.statcan.gc.ca/n1/daily-quotidien/230330/dq230330d-eng.htm
Statistics Canada. (2023g, March 30). Sense of belonging to local community by gender and other selected sociodemographic characteristics. Government of Canada. Retrieved from https://www150.statcan.gc.ca/t1/tbl1/en/tv.action?pid=4510005301
Statistics Canada. (2023h, May 2). Canadian Income Survey, 2021. The Daily. Government of Canada. Retrieved from https://www150.statcan.gc.ca/n1/daily-quotidien/230502/dq230502a-eng.htm
Tarasuk, V., & Li, T. (2022, November 10). The case for establishing food insecurity reduction as a policy objective for poverty reduction. Toronto: Research to identify policy options to reduce food insecurity (PROOF).
Toronto Social Capital Study 2022. (2022). Toronto Foundation; Environics Institute for Survey Research. Retrieved from https://www.environicsinstitute.org/docs/default-source/default-document-library/tf---scs2022---final---digital-final-ua.pdf?sfvrsn=d96d1e9d_0
Appendix A – Recommendations from previous reports of the National Advisory Council on Poverty
Recommendations from Transforming our Systems: The 2022 Report of the National Advisory Council on Poverty
Poverty reduction with First Nations, Inuit and Métis people
- The Government of Canada urgently implement the calls to action from the Truth and Reconciliation and the calls for justice from Reclaiming Power: The Final Report of the National Inquiry into Missing and Murdered Indigenous Women and Girls
- The Government of Canada re-commit to co-development of any new and existing poverty reduction measures
- The Government of Canada continue to work with First Nations, Inuit and Métis people to improve data collection to allow for the evaluation of poverty reduction investments and supports for Indigenous people. In particular, this can help to provide a baseline to evaluate new measures, including Bill C-92, An Act respecting First Nations, Inuit and Métis children, youth and families
Establishing an income floor above Canada's Official Poverty Line
- The Government of Canada lead by example by working to establish a living wage in all federally regulated workplaces by 2030
- The Government of Canada introduce worker protections through the Canada Labour Code to address precarious work
- The Government of Canada accelerate and expand existing work on targeted benefits and supports for populations with disproportionately high rates of poverty. For example, the Government of Canada should accelerate work on the Canada Disability Benefit and ensure it provides income and employment supports that prevent people with disabilities from falling below the Official Poverty Line. The Government of Canada should also consider targeted supports for other high-risk and underserved populations, for example, youth from care
- The Government of Canada strengthen existing and new benefits and supports that assist with and improve housing, food security, physical and mental health, employment and skills training, and other indicators of poverty beyond income. Both income and non-income supports have an essential role to play in sustainable poverty reduction and improved quality of life
Reducing poverty by at least 50% by 2030 for populations made most marginal
- The Government of Canada commit to reducing poverty by at least 50% relative to 2015 levels by 2030 for all populations made most marginal
- The Government of Canada commit to developing and resourcing a plan to reduce current inequalities in poverty
- The Government of Canada accelerate the collection, analysis, application of and access to disaggregated data for all groups made most marginal to support evidence-based decision making and reporting of disparities. For example, Statistics Canada should accelerate work to introduce inclusive gender and sex questions and response options to key data sources on socioeconomic conditions, such as the Labour Force Survey and the Canadian Income Survey
Early intervention and prevention of child and youth poverty
- The Government of Canada identify children and youth most at risk of the intergenerational impacts of poverty and address these impacts through benefits and programs focused on early intervention and prevention
- The Government of Canada establish an independent national commissioner for children and youth. The role of the commissioner would be to focus on children and youth who are made most marginal. Their role could include:
- identifying which children and youth are most at risk of poverty and why they are at risk
- bringing the voices of those with lived expertise in poverty to the design and development of supports and services for children and youth
- ensuring that the rights of children and youth are considered and protected in all federal policies, services, laws and practices
- examining some of the structures that are placing children and youth at high risk, in order to keep them from falling through the cracks
Increasing awareness of, access to and availability of government benefits and supports
- The Government of Canada increase awareness of, access to and availability of government benefits and supports as an essential tool in poverty reduction. The Government of Canada should also increase investments in sustained, core funding for non-profit and community-based organizations that support Canadians living with low incomes, including those that (could) serve as systems navigators for individuals and families trying to access government benefits and supports
- The Government of Canada increase the incidence of tax filing through automatic tax filing for Canadians with low incomes, followed by implementation of automatic enrolment in other benefits and programs, particularly those that are income-tested
- The Government of Canada put people with lived expertise of poverty at the centre of design, implementation and evaluation of its policies, programs and services. Populations made most marginal should be included in the development, design and review of supports that meet their specific challenges and needs
Recommendations from Understanding Systems: The 2021 Report of the National Advisory Council on Poverty
Indigenous prosperity through truth, reconciliation and renewed relationships
- All signatories of the Indian Residential Schools Settlement agreement immediately implement the recommendations from the Truth and Reconciliation Commission of Canada
- The Government of Canada implement the recommendations from Reclaiming Power and Place: The Final Report of the National Inquiry into Missing and Murdered Indigenous Women and Girls
Building equity through programs, supports and benefits
- All Statistics Canada and federal population-based surveys should ask inclusive questions and provide inclusive response options on women and gender equity, Indigenous heritage, immigration/refugee status, race/ethnicity, disability, prior or current institutionalization, and sexual orientation and gender identity, to allow for routine disaggregation of data to support better decision making and reporting of disparities
- While working towards its overall poverty reduction goals, the Government of Canada should endeavor to reach those furthest behind first. To this end, the Government of Canada should commit to reducing poverty by 50% in 2030 for populations made most marginal, including Black populations, 2SLGBTQ people, Indigenous people, and persons with a disability. The Government of Canada should also specifically name and focus on Black populations, 2SLGBTQ people, Indigenous people, and persons with a disability within existing and new Government of Canada strategies, initiatives, and supports
Dignity through enhanced access and improved service design and provision
- Governments work to simplify the delivery of programs and supports for all people through enhanced coordination, improved low barrier access, and better coverage based on need. Specifically, we recommend that governments implement community feedback mechanisms that involve people with lived expertise in poverty in the development, implementation, evaluation and on-going evolution of policy, programs and services. Governments should collect disaggregated program data to demonstrate and improve equitable access and uptake programs and services
- That the Government of Canada implement automatic enrollment for federal benefits to ensure that people are accessing the supports and services that could keep them out of poverty. Automatic tax-filing is one mechanism that can help with this
Develop robust systems and structures focused on early intervention and poverty prevention
- The Government of Canada move to quickly implement all announced supports and benefits that have been publicly committed to. These significant investments (Canada-Wide Early Learning and Child Care System, Canada Disability Benefit, Canada Workers Benefit and the National Housing Strategy including Reaching Home) will both lift people out of poverty, and help prevent future generations from falling into poverty
- The Government of Canada increase investments in the important social programs and benefits that allow people to meet their needs and keep them from falling into poverty. This includes investments in transportation, health, mental health, food security, educational attainment, skills development, support for families, and for people going through transition periods
Employment income and income support
- The Government of Canada should collaborate with provinces and territories to build on its COVID-19 response and strengthen existing strategies, programs and policies. This would ensure a coordinated and robust social safety net in Canada by collectively providing income support that is at least at the level of Canada's Official Poverty Line
- That the Government of Canada take a leadership role in both providing and incentivizing better employment opportunities for marginalized groups, including Indigenous people, racialized individuals, immigrants, refugees, youth, persons recently institutionalized and persons with a disability
- The Government should continue to lead by example by implementing its existing commitments and pursue providing a minimum wage that is above Canada's Official Poverty Line (for full-time work) while consistently pursuing equitable employment practices. It should also use its influence including contract, grants and contributions and employment supports to encourage all employers to implement equitable employment and wage policies
- That the Government of Canada should increase access to employment benefits (such as, employment insurance and paid sick leave) for self-employed workers, workers in the gig economy and part-time workers
Recommendations from Building Understanding: The First Report of the National Advisory Council on Poverty
Continued poverty reduction efforts and investments, as well as increased funding in 4 key areas (food insecurity, housing and homelessness, literacy and numeracy, and the poverty gap)
- The Government of Canada should continue with the implementation of the Poverty Reduction Strategy and with its current government-wide investments
- The Government of Canada should focus additional investments in 4 areas where progress is falling behind: food security, housing and homelessness, literacy and numeracy, and the poverty gap
Urgent action to tackle Indigenous poverty with more specific measures
- The Government of Canada should take urgent action to support Indigenous leaders to reduce poverty in their communities and to ensure that they have all the resources available to support their own people in their own way. We specifically recommend the co-development of Indigenous indicators of poverty and wellbeing, as committed to in the Poverty Reduction Strategy; the co-development of a range of Indigenous poverty reduction strategies such as distinctions-based housing strategies, as committed to in the National Housing Strategy; and commitments made through the Indigenous early learning and child care agreements
- The data necessary to be able to report on Indigenous people should be made available to report on by our next progress report in 2021
Increased data disaggregation to give better account for and give a voice to marginalized populations
- All Statistics Canada and federal population-based surveys should ask inclusive questions and provide inclusive response options on women and gender equity, Indigenous heritage, immigration/refugee status, race/ethnicity, disability, prior or current institutionalization, and sexual orientation and gender identity, to allow for routine disaggregation of data to support better decision-making and reporting of poverty disparities
- The Government of Canada should work with stakeholders and communities to ensure that any new survey questions and response options regarding race, gender identity and sexual orientation are inclusive and that the questions reach the populations that are currently not captured
Applying an equity lens in policy-making
- The Government of Canada should incorporate an equity lens when it reviews, develops and implements strategies, policies and programs. It should ensure that Canada's poverty reduction efforts work as well for those at the highest risk as for everyone else and meet the unique needs of marginalized populations, including immigrants, refugees, ethno-cultural and racialized groups, persons with disabilities, 2SLGBTQ individuals and people experiencing homelessness. The Government should also use available data to transparently report on the use of the equity lens and the outcomes
Streamlining and coordination of benefits and bringing a level of support that is at least at Canada's Official Poverty Line
- The Government of Canada should collaborate with provinces and territories to build on its COVID-19 response and strengthen existing strategies, programs and policies to ensure a coordinated robust social safety net in Canada by collectively providing income support that is at least at the level of Canada's Official Poverty Line
- We recommend that benefits be streamlined and simplified to make them low-barrier, easier to access and easy to tailor to individual needs
Appendix B - Progress on the Government of Canada's commitments and investments
Since Transforming Systems was released in October 2022, the Government of Canada has made several proposals and commitments that would help address our recommendations.
Poverty reduction with First Nations, Inuit and Métis people
Supporting Indigenous governance and capacity
Budget 2023 proposes to provide $76.3 million in 2023 to 2024 to Indigenous Services Canada to continue to support the administrative capacity of First Nations governments and tribal councils delivering critical programs and services to their members.
Creating prosperity with Indigenous peoples
Budget 2023 proposes to provide $5 million in 2023 to 2024 to Indigenous Services Canada to support the co-development of an Economic Reconciliation Framework with Indigenous partners to increase economic opportunities for Indigenous peoples, communities, and businesses.
Supporting Indigenous health priorities
Budget 2023 proposes to provide $810.6 million over 5 years beginning in 2023 to 2024 to support medical travel and to maintain medically necessary services through the Non-Insured Health Benefits Program, including mental health services, dental and vision care, and medications.
Implementing the National Action Plan to End the Tragedy of Missing and Murdered Indigenous Women and Girls
Budget 2023 proposes to provide:
- $20 million over 4 years starting in 2022 to 2023 to support Indigenous-led projects for safer communities through the Pathways to Safe Indigenous Communities Initiative
- $95.8 million over 5 years starting in 2023 to 2024 and $20.4 million ongoing to help Indigenous families access information about their missing and murdered loved ones and to enhance victim services. This funding would renew existing programming and expand it to include support for families of 2SLGBTQI+ Indigenous victims who are men
- $2.6 million over 3 years starting in 2023 to 2024 to support the National Family and Survivors Circle in keeping families and survivors at the centre of the implementation of the National Action Plan and the Federal Pathway
- $2.2 million over 5 years starting in 2023 to 2024 to establish an oversight mechanism to monitor and report on the progress of implementation
- $1.6 million over 2 years starting in 2023 to 2024 to support the Ministerial Special Representative appointed to provide advice and recommendations on the creation of an Indigenous and Human Rights Ombudsperson
- $2.5 million over 5 years starting in 2023 to 2024 to facilitate and coordinate work on advancing the National Action Plan by establishing a standing Federal-Provincial-Territorial-Indigenous table on Missing and Murdered Indigenous Women, Girls and 2SLGBTQI+ People. This table will provide a specific forum to take action on areas of shared roles and responsibilities regarding Missing and Murdered Indigenous, Women, Girls, and 2SLGBTQI+ People, including prioritizing discussion on how to launch a "Red Dress Alert" to notify the public when an Indigenous woman or two-spirit person goes missing
Establishing an income floor above the poverty line
Permanently eliminating interest on student loans
In November 2022, the Government of Canada announced that it would permanently eliminate interest on Canada Student Loans and Canada Apprentice Loans, and that nobody earning less than $40,000 per year needs to make payments on their federal student loans.
Protecting federally regulated gig workers
Budget 2023 proposes to amend the Canada Labour Code to improve job protections for federally regulated gig workers by strengthening prohibitions against employee misclassification.
Building more affordable housing
Budget 2023 announces the Government of Canada's intention to support the reallocation of funding from the National Housing Co-Investment Fund's repair stream to its new construction stream, as needed, to boost the construction of new affordable homes for the Canadians who need them most.
Investing in an Urban, Rural, and Northern Indigenous Housing Strategy
Budget 2023 proposes to commit an additional $4 billion over 7 years starting in 2024 to 2025 to implement a co-developed Urban, Rural, and Northern Indigenous Housing Strategy.
Expanding the Canadian Dental Care Plan
Budget 2023 proposes to provide $13.0 billion over 5 years starting in 2023 to 2024 and $4.4 billion ongoing to Health Canada to implement the Canadian Dental Care Plan. The plan will provide dental coverage for uninsured Canadians with annual family income of less than $90,000, with no co-pays for those with family incomes under $70,000. The plan would begin providing coverage by the end of 2023.
Expanding access to dental care
Budget 2023 proposes to provide $250 million over 3 years starting in 2025 to 2026 and $75 million ongoing to Health Canada to establish an Oral Health Access Fund. The fund will complement the Canadian Dental Care Plan by investing in targeted measures to address oral health gaps among vulnerable populations and reduce barriers to accessing care, including in rural and remote communities.
Investing in community-led efforts to address food insecurity
Budget 2023 proposes to provide $10 million in 2023 to 2024 to top up the Local Food Infrastructure Fund to strengthen food security in Northern, rural and Indigenous communities across Canada.
Targeted inflation relief for Canadians who need it most
Budget 2023 proposes to introduce a one-time Grocery Rebate, providing $2.5 billion in targeted inflation relief to the Canadians who need it most. The Grocery Rebate will be delivered through a one-time payment from the Canada Revenue Agency.
Advancing inclusion of Canadians with disabilities
Budget 2023 proposes to provide $21.5 million in 2023 to 2024 to Employment and Social Development Canada to continue work on the future delivery of the Canada Disability Benefit, including engagement with the disability community and provinces and territories on the regulatory process.
Doubling the Goods and Services Tax Credit for 6 months
In November 2022, the Government doubled the Goods and Services (GST) credit for 6 months for those who receive it, resulting in a one-time, lump-sum payment targeted to those who need it most.
Providing a one-time top-up to the Canada Housing Benefit
In September 2022, the Government announced a one-time top-up to the Canada Housing Benefit program consisting of a tax-free payment of $500 to provide direct support to low-income renters.
Reducing poverty by at least 50% by 2030 for populations made most marginal
Building on Canada's Anti-Racism Strategy
Budget 2023 proposes to provide an additional $25.4 million over 5 years starting in 2023 to 2024 and $0.6 million ongoing to the Department of Canadian Heritage to continue to support Canada's Anti-Racism Strategy and fight all forms of racism, including but not limited to anti-Indigenous racism, anti-Black racism, anti-Asian racism, antisemitism, and Islamophobia.
Budget 2023 proposes to provide $1.5 million over 2 years starting in 2023 to 2024 to the Privy Council Office to create a new Anti-Racism, Equity and Inclusion Secretariat to ensure that considerations of anti-racism, equity and inclusion are applied in the development of federal government policies.
Supporting Black Canadian communities
Budget 2023 proposes to provide $25 million in 2024 to 2025 to Employment and Social Development Canada for the Supporting Black Canadian Communities Initiative, to continue empowering Black-led and Black-serving community organizations and the work they do to promote inclusiveness.
Advancing intersectional gender equality in Canada
Budget 2023 proposes to provide $160 million over 3 years starting in 2023 to 2024 for the Women's Program to provide funding to organizations in Canada that serve women. The government is committed to maintaining historic funding levels for Canadian women's organizations and equity-deserving groups, with a particular focus on Indigenous women, women with disabilities, members of the 2SLGBTQI+ communities, and newcomer, Black, racialized, and migrant women.
Early intervention and prevention of child and youth poverty
Investing in a Canada-wide early learning and child care system
In 2021, the Government of Canada made a historic investment in a Canada-wide system of affordable early learning and child care. Since April 2023, 6 provinces and territories are providing regulated child care for an average of $10-a-day or less. All other provinces and territories are on track to achieve a $10-a-day child care by 2026. In Quebec, federal investments are continuing to make the existing child care system more accessible through the creation of new spaces.
Supporting First Nations children
Budget 2023 proposes to provide $171 million in 2022 to 2023 to Indigenous Services Canada to ensure First Nations children continue to receive the support they need through Jordan's Principle.
Budget 2023 proposes to provide $444.2 million over 3 years starting in 2022 to 2023 to support Peguis First Nation in Manitoba and Louis Bull Tribe First Nation in Alberta to exercise jurisdiction over their child welfare systems and make decisions about what is best for their children and families.
Increasing awareness of, access to and availability of government benefits and supports
Automatic Tax Filing
Budget 2023 announces that the federal government will increase the number of eligible Canadians for File My Return to 2 million by 2025, and report on progress in 2024. File My Return is a Canada Revenue Agency service which allows Canadians with simple tax situations and lower or fixed income to auto-file their tax return over the phone.
Budget 2023 announces that starting in 2024, the Canada Revenue Agency will pilot a new automatic filing service that will help vulnerable Canadians who currently do not file their taxes receive the benefits to which they are entitled. Following consultations with stakeholders and community organizations, the CRA will present a plan in 2024.
Supporting Canada's disability organizations
Budget 2023 proposes to provide $10 million over 2 years beginning in 2023 to 2024 to Employment and Social Development Canada to help address the unique needs and ongoing barriers faced by persons with disabilities by investing in capacity building and the community-level work of Canada's disability organizations.
Appendix C – Organizations that participated in engagement sessions
Below is a list of organizations that participated in our in-person and virtual engagement sessions. The in-person sessions took place in British Columbia, Ontario, Québec, and Saskatchewan. This list does not include individuals who attended but were not affiliated with an organization, politicians or public servants.
We encourage organizations to contact us to correct any errors or omissions.
Email: EDSC.CCNP-NACP.ESDC@hrsdc-rhdcc.gc.ca
In-person engagement sessions
- The 519
- L’ABC de la Famille
- Association pour la défense des droits sociaux de Huntingdon
- Black Health Alliance
- Bouclier d'Athena Services Familiaux
- British Columbia Self Advocate Leadership Network Society
- Café des Deux Pains de Valleyfield
- Carmichael Outreach
- Carrefour jeunesse-emploi Beauharnois-Salaberry
- Carrefour jeunesse-emploi Huntingdon
- Centre du partage de Valleyfield
- Centre intégré de santé et services sociaux de la Montérégie-Ouest (le projet Vigilance)
- The Centre for Addiction and Mental Health
- Centre Atlas
- Comité logement Valleyfield
- Community Food Centres Canada
- Cornwall Alternative School
- Corporation de développement communautaire Beauharnois-Salaberry
- Corporation de développement communautaire du Haut-Saint-Laurent
- Covenant House Vancouver
- Eagle Heart Centre
- The Elizabeth Fry Society of Greater Vancouver
- First United Church Social Housing Society
- Four Directions Community Health Centre
- Frasier Regional Aboriginal Friendship Centre Association
- Fred Victor
- Living Wage for Families BC
- Lookout Housing and Health Society
- Maytree
- Mission Old Brewery
- Mothers Matter Centre
- MRC du Haut-Saint-Laurent
- Newo Yotina Friendship Centre
- North Central Family Centre
- Ontario Council of Agencies Serving Immigrants
- Ontario Human Rights Commission
- Options Community Services
- Pacte de rue
- PROOF – University of Toronto
- Quest Food Exchange
- Regina Anti-Poverty Ministry
- Regina Education & Action on Child Hunger
- Regina Food Bank
- Regina Public School Board
- Sacred Heart Community School
- Semiahmoo House Society
- Surrey School Board
- Toronto Community Housing Corporation
- United Way Regina
- United Way Toronto
- Wellesley Institute
- Yonge Street Mission
Virtual engagement sessions
- The 519
- Aboriginal Housing Management Association
- Alberta Rural Development Network
- Association franco-yukonnaise
- Au bas de l'échelle
- A Way Home Canada
- Canadian Association of Elizabeth Fry Societies
- Canadian Centre for Housing Rights
- Canadian Friends Service Community
- Canadian Observatory on Homelessness
- Canadian Poverty Institute – Ambrose University
- Collectif de recherche participative sur la pauvreté en milieu rural – UQAR
- Collectif pour un Québec sans pauvreté
- Le Conseil jeunesse provincial de la Nouvelle-Écosse
- CUPS Calgary
- Disability Without Poverty
- Health Providers Against Poverty
- HomeBASE
- Inclusion Canada
- Maison Richelieu Hébergement Jeunesse
- Maytree
- National Right to Housing Network
- Northwest Territories Seniors' Society
- Regroupement des centres d'amitié autochtones du Québec
- Réseau solidarité itinérance du Québec
- Restigouche Multicultural Association
- Rural Development Network
- Saint John Newcomer Centre
- Social Justice Co-operative of Newfoundland and Labrador
- Tamarack Institute
- Transport Urbain/Rural – Nouveau Brunswick
- United Way Centraide Canada
Appendix D – Other data tables
Progress on indicators of poverty tracked under the PRS
The following tables present a summary of the progress made on each of the indicators tracked under the PRS. For some indicators, data isn't reported every year, rather every 2, 3 or 5 years. We have noted which indictors do not have updates from our last report.
| Indicator | Reference period | Initial estimates | Latest estimates | Change to indicator | Potential effect on poverty reduction | Data source |
|---|---|---|---|---|---|---|
| Deep income poverty (Persons whose family disposable income is below 75% of Canada's Official Poverty Line) | 2015 to 2021 | 7.4% | 3.6% | decrease | positive | Canadian Income Survey |
| Unmet housing needs (Percentage of households who are in housing that is unaffordable, in need of major repairs, or unsuitable for the size and composition of the household and not able to afford alternative housing in their community) | 2016 to 2021 | 12.7% | 10.1% | decrease | positive | Census |
| Chronic homelessness (People who experienced homelessness for at least 6 months over the past year or have recurrent experiences of homelessness over 3 or more years) | 2016 to 2020 | 26,866 | 27,651Footnote 3 | increase | negative | National Homelessness Information System |
| Unmet health needs (Persons 16 years and older who reported not receiving healthcare when they felt they needed it) | 2018 to 2021 | 5.1% | 7.9% | increase | negative | Canadian Income Survey |
| Food insecurity (Persons living in households that reported moderate or severe food insecurity) | 2018 to 2021 | 11.6% | 12.9% | increase | negative | Canadian Income Survey |
| Indicator | Reference Period | Initial estimates | Latest estimates | Change to indicator | Potential effect on poverty reduction | Data Source |
|---|---|---|---|---|---|---|
| Relative low income (Persons living in households whose after-tax income falls below half the median after-tax income) | 2015 to 2021 | 14.3% | 10.6% | decrease | positive | Canadian Income Survey |
| Bottom 40% income share (Share of total after-tax income held by the bottom 40% of the income distribution) | 2015 to 2021 | 20.2% | 21.8% | increase | positive | Canadian Income Survey |
| Persons aged 15 to 24 who were not in employment, education, or training (Statistics Canada “Youth Engagement” indicator) | 2015 to 2022 | 10.5% | 9.6% | decrease | positive | Labour Force Survey |
| Low literacy among 15-year-oldsFootnote 4 (Limited ability to understand, use, reflect on and engage with written text which enables basic participation in society) | 2015 to 2018 | 10.7% | 13.8% | increase | negative | Program for International Student Assessment |
| Low numeracy among 15-year-oldsFootnote 5 (Limited ability to communicate, use and interpret mathematics in daily life) | 2015 to 2018 | 14.4% | 16.3% | increase | negative | Program for International Student Assessment |
| Indicator | Reference Period | Initial estimates | Latest estimates | Change to indicator | Potential effect on poverty reduction | Data Source |
|---|---|---|---|---|---|---|
| Real median hourly wageFootnote 6 (The hourly wage at which half the employed population has a higher wage and half the population has a lower wage – in 2022 constant dollars) | 2015 to 2022 | $26.27 | $27.00 | increase | positive | Labour Force Survey |
| Average poverty gap (Average income shortfall below Canada’s Official Poverty Line for those living in poverty, expressed as a percentage of the poverty line) | 2015 to 2021 | 31.8% | 31.6% | decrease | positive | Canadian Income Survey |
| Asset resilienceFootnote 7 (Persons who are able to cover for unexpected expenses or reduced income by drawing from assets for a period of three months) | 2016 to 2019 | 66.6% | 67.1% | increase | positive | Survey of Financial Security |
| Low income entry rates (Proportion of persons who entered low income in the second year out of those who were not in low income in the first year) | 2014 to 2015 till 2019 to 2020 | 4.1% | 3.1% | decrease | positive | Longitudinal Administrative Databank |
| Low income exit rates (Proportion of persons who exited low income in the second year out of those who were in low income in the first year) | 2014 to 2015 till 2019 to 2020 | 27.5% | 42.0% | increase | positive | Longitudinal Administrative Databank |
| Group | 2015 | 2020 | 2021 |
|---|---|---|---|
| Overall | 5,044,000 (14.5%) | 2,357,000 (6.4%) | 2,762,000 (7.4%) |
| Males | 2,438,000 (14.1%) | 1,163,000 (6.3%) | 1,306,000 (7.0%) |
| Females | 2,606,000 (14.8%) | 1,194,000 (6.4%) | 1,456,000 (7.7%) |
| Singles (under age 65) | 1,582,000 (38.9%) | 1,153,000 (27.3%) | 1,117,000 (26.2%) |
| Male singles (under age 65) | 838,000 (36.5%) | 619,000 (25.4%) | 579,000 (24.2%) |
| Female singles (under age 65) | 744,000 (41.9%) | 535,000 (29.7%) | 538,000 (28.8%) |
| Children aged 0 to 17 | 1,115,000 (16.3%) | 333,000 (4.7%) | 462,000 (6.4%) |
| Children aged 0 to 2 | 196,000 (17.4%) | 47,000 (4.2%) | 57,000 (5.3%) |
| Children aged 3 to 5 | 208,000 (18.5%) | 57,000 (4.8%) | 80,000 (6.8%) |
| Children aged 6 to 11 | 386,000 (16.7%) | 120,000 (4.8%) | 166,000 (6.8%) |
| Children aged 12 to 17 | 324,000 (14.2%) | 108,000 (4.7%) | 159,000 (6.2%) |
| Seniors aged 65+ | 394,000 (7.1%) | 207,000 (3.1%) | 383,000 (5.6%) |
| Persons in lone parent families | 545,000 (32.8%) | 231,000 (13.5%) | 288,000 (16.1%) |
| Persons in male-led parent families | 65,000 (18.9%) | 24,000 (7.2%) | 42,000 (11.6%) |
| Persons in female-led parent families | 480,000 (36.4%) | 207,000 (15.0%) | 246,000 (17.2%) |
| Indigenous people living off-reserve (aged 16+) | 205,000 (26.2%) | 89,000 (11.8%) | 102,000 (13.9%) |
| Indigenous people living on reserve | not collected | not collected | not collected |
| 2SLGBTQ+ persons | not collected | not collected | not collected |
| Persons with disabilities (aged 16+) | 1,535,000 (20.6%) | 761,000 (8.5%) | 979,000 (10.6%) |
| Immigrantsᶧ (aged 16+) | 1,303,000 (17.5%) | 576,000 (6.8%) | 705,000 (8.1%) |
| Recent immigrants (10 years or less) aged 16+ | 649,000 (28.3%) | 219,000 (8.6%) | 279,000 (10.3%) |
| Very recent immigrants (5 years or less) aged 16+ | 423,000 (34.9%) | 148,000 (11.2%) | 179,000 (12.0%) |
| Racialized persons* | not collected | 802,000 (8.0%) | 1,033,000 (9.5%) |
| South Asian | not collected | 192,000 (7.5%) | 194,000 (7.0%) |
| Chinese | not collected | 185,000 (9.6%) | 247,000 (11.7%) |
| Black | not collected | 111,000 (7.5%) | 179,000 (11.5%) |
| Filipino | not collected | 37,000 (3.6%) | 33,000 (2.9%) |
| Arab | not collected | 79,000 (10.0%) | 114,000 (12.8%) |
| Latin American | not collected | 57,000 (8.7%) | 41,000 (6.8%) |
| Southeast Asian | not collected | 56,000 (10.3%) | 54,000 (9.1%) |
| Other racialized persons** | not collected | 84,000 (8.0%) | 173,000 (14.4%) |
| Persons living in institutions | not collected | not collected | not collected |
| Persons who were formerly incarcerated | not collected | not collected | not collected |
- Source: Statistics Canada, Canadian Income Survey.
- Note: ᶧ Referred to by Statistics Canada as people who are, or have been, landed immigrants in Canada. Canadian citizens by birth and non-permanent residents (persons from another country who live in Canada and have a work or study permit, or are claiming refugee status, as well as family members living here with them), are not landed immigrants.
- *Referred to by Statistics Canada as persons designated as visible minorities.
- **Other racialized people includes racialized groups not included elsewhere and persons who identified as more than one racialized group.