
National School Food Policy Engagements – What We Heard Report
On this page
Alternate formats

Large print, braille, MP3 (audio), e-text and DAISY formats are available on demand by ordering online or calling 1 800 O-Canada (1-800-622-6232). If you use a teletypewriter (TTY), call 1-800-926-9105.
List of figures
- Figure 1: Percent of respondents believing school food programs are beneficial for children (children who are attending school, age 18 and under)
- Figure 2: Percent of respondents believing each reason to be important for a Pan-Canadian food policy
- Figure 3: Percent of respondents believing each action to be important for a Pan-Canadian food policy
- Figure 4: Percent thinking each model could help feed the most children while reducing stigma
- Figure 5: Percent of respondents by child’s school food program participation
- Figure 6: Percent of respondents agreeing with each benefit of their child’s school food program participation
- Figure 7: Percent of respondents citing each reason for child’s non-participation in school food programs
- Figure 8: Percent of respondents that cite each reason for potential participation/non-participation
- Figure 9: Percent willing to pay amount per child per day to have breakfast provided at school
- Figure 10: Percent willing to pay amount per child per day to have lunch provided at school
- Figure 11: Percent working in a school with a food program
- Figure 12: Percent of respondents by employment in schools
- Figure 13: Percent believing each barrier to be a significant obstacle to school food programming
- Figure 14: Percent believing each barrier to be a significant obstacle to school food programming
- Figure 15: Percent of respondents whose organization provides each type of service
- Figure 16: Percent by organization type
- Figure 17: Percent obtaining funding and in-kind contributions from each source
Executive summary
A priority for the Government of Canada is to ensure that every child gets the best possible start in life. This is one of the many reasons the Government of Canada is taking steps to build a National School Food Policy.
The Government of Canada has committed to working with provinces, territories, Indigenous partners, municipalities and stakeholders to develop a National School Food Policy (Policy) and to work toward a national school nutritious meal program.
This report summarizes what we heard in the engagements on the Policy. Since January 2022, we engaged with Canadians through:
- national targeted thematic stakeholder and regional roundtables
- ministerial visits to school food programs
- a public online questionnaire
- written submissions from organizations and individuals
- National Advisory Council on Poverty
- Canadian Food Policy Advisory Council
- Canadian Agricultural Youth Council
- meetings with diverse stakeholders, including academics and service delivery organizations
Through these engagements, Canadians shared many views on what the Policy could include. Additionally, service delivery organizations and experts shared some of the challenges school food programs face.
We heard that school food has many benefits for children and their communities. Participants shared many ways that the Policy could include these benefits. They highlighted that the Policy should:
- allow for flexibility so that individual programs can adapt to local contexts and realities
- build on existing programming
We heard it is important to make sure children do not experience stigma when participating in programs. We also heard it was important for programs to embrace universality.
We heard from Indigenous peoples and organizations delivering programs within Indigenous communities. We heard about the importance of:
- ensuring Indigenous partners have full control over programming
- facilitating access to traditional food and knowledge
We heard that organizations delivering programs face many challenges. Participants also shared how the Policy could strengthen the school food community.
We heard directly from children and youth about the importance of school food programs for all students. They shared that healthy eating allows them to stay focused and energized in school and to excel academically.
The findings from these engagements and ongoing engagements will help to inform the development of the Policy.
Overview
National School Food Policy
The Government of Canada has committed to working with provinces, territories, Indigenous partners, municipalities and stakeholders to develop a National School Food Policy (Policy) and to work toward a national school nutritious meal program.
An important step in developing this Policy was engaging with Canadians. We engaged to hear the views of Canadians so we could make sure the Policy reflects their views. To support engagement, we released a discussion paper describing key themes.
This What We Heard report is a summary of what we heard during those engagements.
About the engagement
Engagement began in early 2022. We engaged broadly and will continue to do so going forward as development of the Policy continues. We heard from Canadians in the following ways.
Ministerial roundtables and site visits
The Minister of Families, Children and Social Development’s predecessor, the Honourable Karina Gould, hosted roundtables with stakeholders. The Minister’s predecessor also visited many school food programs in communities across Canada.
Targeted thematic stakeholder virtual roundtables
The Minister’s predecessor, the Honourable Karina Gould, also hosted 4 thematic roundtables in November and December of 2022. Agriculture and Agri-Food Canada (AAFC) hosted 1 thematic roundtable in November 2022. More than 130 stakeholders participated in these roundtables from across the country representing:
- service delivery organizations
- school communities
- health organizations
- academics
- food and agricultural organizations
- community advocacy organizations
We made efforts to ensure diverse representation from:
- Northern, remote, urban, rural and Indigenous peoples
- marginalized populations
- key players in delivering school meal programs
- the populations most affected by this policy area, including school administrators and children and youth
Consult Annex A for a list of organizations that participated in the virtual roundtables.
Children and youth engagement sessions
Three engagement sessions with children and youth were held in May and June of 2023. Two in-person sessions took place with children in grades 3 to 6. One bilingual virtual session took place with youth in grades 7 to 12.
Public online questionnaire
5,283 responses were received from the online public questionnaire posted from November 16 to December 16, 2022.
- 83% of respondents completed the questionnaire as individuals, and 16% as representatives of an organization. The remaining 2% responded “prefer not to answer”, “I don’t know”, or specified another answer in a text response
- 89% of respondents completed the questionnaire in English, and 11% completed the questionnaire in French
Of all respondents:
- 16% identified as male, 78% identified as female, 1% identified as non-binary and 5% chose not to respond
- 28% identified as a teacher, school administrator or education support professional
- 54% identified as being a parent or legal guardian. They had at least one child under the age of 18 living in their household
- 965 respondents identified as Indigenous or as an individual working with Indigenous communities
- there was representation from every province and territory among respondents. Most respondents were from Ontario (39%), British Columbia (12%), Quebec (11%) and Manitoba (11%)
Of the organizational respondents:
- 74% identified as an organization providing school meal programming
- 26% identified as an organization interested in delivering school food programming
- 69% of organizations responding were non-profit, 18% were governmental, 6% were for-profit; and the remaining 7% either responded “I don’t know” or “prefer not to answer”
- In decreasing order, the 832 organizational respondents received funding from:
- provincial or territorial governments
- charitable organizations
- the private sector
- municipal governments
- the federal government
- parents or guardians
Consult Annex B for a summary of key results from the completed questionnaires.
Written submissions
Over 76 organizations and individuals provided written submissions from November 2022 to May 2023 including:
| Type of Stakeholder | Number |
|---|---|
| Health organizations | 21 |
| Food and agricultural organizations | 14 |
| Service delivery organizations | 17 |
| School community organizations (K-12 schools; organizations representing teachers, school administrators and parents) | 13 |
| Other (academics, individuals, charities, municipalities) | 11 |
| Total | 76 |
National Advisory Council on Poverty (NACP) engagement sessions on lived expertise
The NACP led engagement sessions in late 2022. These sessions took place in Montreal, Toronto, Regina and Vancouver. They included persons with lived expertise of poverty and/or food insecurity. They also included organizations that relate to poverty and food insecurity. During these sessions, participants discussed their views on the Policy.
Meetings with stakeholders
Since January 2022, officials from Employment and Social Development Canada (ESDC) and AAFC met on numerous occasions with:
- stakeholders
- experts
- academics
Canadian Food Policy Advisory Council (CFPAC)
Officials at ESDC and AAFC engaged CFPAC’s working group on school nutrition. They shared their views on a Policy.
Canadian Agricultural Youth Council (CAYC)
Officials at ESDC and AAFC engaged Council members. They shared their views on a Policy.
We have consulted with representatives from provincial and territorial governments and Indigenous partners. We continue to consult with these representatives and partners as we work on a Policy.
What We Heard – Key takeaways
The key takeaways in this section reflect the views of participants. Results do not represent the entire Canadian population or all ESDC stakeholders. This section aims to provide a summary of the ideas raised. We do not reflect every comment we heard in this document.
Throughout the report, we use the term “participant” to credit views expressed. These views were from various engagement methods by diverse stakeholders. The About the Engagement section outlines these methods and stakeholders. We are more specific when referring to individual stakeholder types or methods of engagement.
Support for a National School Food Policy
The engagements showed overwhelming support for a National School Food Policy. Almost all participants agreed that school food programs benefit children. For example, around 96% of questionnaire respondents agreed that programs benefit children. Stakeholder organizations supported the Government developing a Policy and funding programs.
Participants spoke to the numerous benefits they have seen school food programs provide firsthand. They spoke to benefits to child health, educational opportunities and connections to food systems and the local economy.
Through engagement, many participants agreed that the Policy should:
- be flexible and adaptable to the local context and realities of each community
- complement and build on programs that exist
- allow programs to continue exploring new ways to deliver programming
- include measures preventing provinces and territories from displacing current funding
Less than 1% of questionnaire respondents did not support the Government playing a role in school food. Their reasons included:
- schools fall under provincial and territorial jurisdiction
- feeding children should not be the responsibility of schools or governments
- school food programs are a bandage solution to a problem rooted in inadequate income
Some participants thought that school food programs are not a way to reduce food insecurity. They included academics and health and community organizations. They recommended the government put in place more income-based supports to address this issue. Service delivery organizations and school communities described how programming can:
- reduce child hunger and food insecurity
- provide some stability for families
Views of children and youth
Children and youth recognized the importance of school food programs for all students. They shared that healthy eating allows them to stay focused and energized in school and to excel academically.
“The immediate need is to get healthy food to children. Families right across Canada are in crisis and often choosing between paying their rent and putting food on the table. Children must be in school, so we know that through a National School Food Program they, at least, will have access to food while they are there.”
“My child is never hungry upon waking but is hungry by the time they arrive at school. Having food available upon arrival is tremendously valuable.”
“There are many different school food program models across Canada. Even within provinces and territories there are regional differences. This is one of the greatest strengths of the program, as communities understand the needs of their children and how best to nourish them. It follows that communities have different challenges and operational needs.”
Working towards universality and reducing stigma
Participants supported a universal program delivery model. In a universal model, every child has access to school food. Participants said universality reduces stigma. It also ensures that all children who need school food have access. Though programs often target low-income households, there is no “stereotypical” hungry child. Organizations shared there are many reasons why students come to school hungry.
Many participants shared it was important to make sure students do not experience stigma when they take part in programs. A majority of questionnaire respondents (59%) thought this was an important goal. The goal for many organizations is universally accessible programs. They noted that funding limits may mean that they need to choose who takes part in programs. They voiced that they can do this without stigmatizing students. They shared examples of how they do this including:
- targeting all students within a particular grade, considering or not considering socioeconomic factors
- targeting students within a school or neighborhood, considering or not considering socioeconomic factors
- in a pay-what-you-can model, ensuring families do not know which families pay for meals and how much
- making sure all students that use programs have the same meal options and the same treatment
Participants showed wide support for a pay-what-you-can program model. In this model, all children who have access to a program can take part. Families that are able to can pay and those that do not pay can still take part. Almost a third of questionnaire respondents (32%) believed a pay-what-you-can model could help feed the most children. They believed it could also reduce stigma at the same time. Some participants believed the only way to end stigma is through universal access.
Some programs use means-testing or target specific students within a school. Many service delivery organizations and communities warned against this. They warned this can result in fewer students choosing to take part due to stigma. Instead, they recommended targeting all students within a particular grade or school.
Some programs provide access only to Indigenous students in a school. Service delivery organizations also warned against this. They recommended programs provide funding for all students in a school. This avoids the chance of program participants experiencing stigmatization and racism.
Views of children and youth
Children and youth supported access for all to programming because there are many reasons why someone could be hungry at school. Children shared that sometimes they may:
- not have time to have breakfast
- misplace or lose their lunch at school
- not have brought enough food to be full
- not want to eat what they brought to school
They shared that if a program only includes families who are have difficulty providing food, many hungry children will be left out. As one child said: “everyone matters.”
They also supported programs that provide meals eaten at school, like breakfast and lunch, instead of only snacks.
Almost all children and youth who participated had a breakfast or snack program at their school. They shared that their breakfast and snack helped them focus. However, many noted that the food provided through these programs was not substantial enough to make them feel full throughout the day. Most children and youth did not have a lunch program in their school and noted the importance of including lunch in school food programs. Youth felt that lunch was the most important meal of their day and that programs need to include filling lunches to help youth learn throughout the day. Youth acknowledged that while most programs may need to offer paid lunches, there should be free options for youth who cannot pay.
In addition to being available to all students and providing every meal at school, youth stressed that there should be enough food for all who wish to participate. Youth voiced that stigma is not the only reason why they may choose not to participate in programs. One youth shared that they do not participate in their school’s program when they are hungry out of guilt. They feel pressure to leave food for other youth who may not have access to enough food at home.
“I would say there is some stigma [about the school food program], but I feel like the whole reason why the students who maybe don’t have the income to afford food [at home] don’t go to this program is because they feel like it’s not worth it. I’ve heard it from so many that the food just doesn’t look appealing at all, or it doesn’t keep you full. We don’t really have any biases from my school about it. We just wish there was much more, so much more to give them so then people actually can access it better.
“Many families have more than one child, buying lunch for each child can be very expensive”
“We know that children as young as 10 years old will skip eating if they feel embarrassed about their families’ socio-economic circumstances. Therefore, it is vitally important that no child feels stigmatized by accessing a school food program. To achieve this, the principle of universal access for all students within prioritized school communities is crucial... While the goal may be to nourish all Canadians at school, the reality is that funding is limited. Therefore, priority must be given to low-income communities identified through Census Canada data.”
Health and nutrition
Growing access to healthy and nutritious food could benefit all Canadian children. There are many reasons why children may be hungry or have diets that lack adequate nutrition. Many health organizations shared this view. Many participants thought the Policy should focus on child health and well-being. They also thought it should focus on reducing hunger. Questionnaire respondents agreed, with 88% and 83% indicating these as important goals.
Many participants believed that school food programs have the potential to improve the health and nutritional intake of participating children in the long-term by:
- reducing the number of children learning on an empty stomach
- helping children develop healthy practices for life through food literacy and education
- improving diets through increased intake of healthy foods
Some participants suggested programs establish plant-based food targets. Many service delivery organizations stressed that plant-based targets were not advised. These targets may not meet and respect the cultural needs of many Canadians. They noted the needs of Indigenous peoples. They also raised that given local contexts and realities, targets may not be possible.
Participants supported aligning the Policy with Canada’s Food Guide. Many participants noted challenges to improving health and nutrition including:
- local nutrition standards. Schools and regions may need to develop guidelines to account for local realities
- access to nutritious, local or organic foods. Some communities do not have regular access and need to rely on packaged and processed food
- failing to engage students, school staff and parents. This can result in nutrition guidelines having little impact on child health
There were differences of opinion amongst participants about food marketing in schools. Some service delivery and community advocacy organizations had concerns. Some participants raised concerns about using branded food products in schools. They thought these products might have impacts on eating practices. They advocated for banning marketing of unhealthy foods in programs.
Many other organizations noted the need for balance. They noted that programs may rely on branded or unhealthy donations. They thought it was more important to equip children with food literacy skills. They noted these skills would build child confidence in making healthy choices.
Views of children and youth
Several youth shared that they try to avoid labelling foods as healthy or unhealthy and instead strive to find balance in their diets.
They expressed that while it is important for programs to serve healthy food, it is equally important to serve a wide variety of food that is appetizing, filling and of high quality. Several youth shared that they had heard negative perceptions about school food programs including:
- the food is not healthy
- the food is not filling
- the options are boring or repetitive
- the program is not worth the money or too expensive
- the food is not tasty
Youth noted that healthier options are not always the most popular. They noted that food provided in programs are competing against food from cafeterias, restaurants and home. To promote healthy foods in school food programs they suggested that healthy foods be served:
- in a fun and colourful way
- at a low and affordable price
- fresh and in good condition
“…unhealthy eating constitutes a tremendous economic burden to Canada that is similar in magnitude to the burden of smoking and larger than that of physical inactivity… A status quo in promoting healthy eating will allow this burden to continue.”
“I try not to view food necessarily as unhealthy versus healthy. I know that there are some foods that are better for me and some that are less, but I value balance. Of course, I'm going to go and try to seek out more vegetables, more protein, but you know, once in a while, I want to have an Oreo to keep myself happy and I think that's really important.”
“By ensuring improved access to adequate healthy food, the Program would begin to address critical problems associated with insufficient and non-nutritious food for millions of school children in Canada, affecting their physical and mental health, risks of lifelong chronic diseases, school attendance and performance, self-esteem, and longer-term personal development and well-being.”
Food literacy, education and student involvement
Many stakeholders stressed that school meal programs should take a holistic approach. They note that this approach promotes health and nutrition. They suggested:
- creating opportunities for student involvement
- integrating food literacy and education
- linking to curricula
Participants shared that programs could increase their impact by going beyond just serving food. Besides health and nutrition benefits, food literacy and education can provide benefits including:
- understanding local food production and larger food systems
- strengthening connections between children and their communities
- providing the opportunity for children to learn about future career opportunities
- learning unique cultural foods and eating practices
- developing children’s food preparation skills and knowledge
Participants thought it was important for the Policy to increase children's food knowledge. Half of questionnaire respondents agreed that this was an important aim. Participants also thought it was important to increase children's food preparation skills. A quarter of respondents agreed.
Participants noted the benefits of experiential ‘hands-on’ learning. Organizations shared that this has the most positive impact on students. This learning can impact food literacy, skills and building healthy habits. Organizations shared that they do this through:
- showcasing local food production through community on-site tours and activities
- involving students in menu planning, food preparation and service of food
- encouraging schools to collaborate with chefs, harvesters, hunters, fishers, nutritionists and dietitians
- using affordable meal kits. Children can take the kits home to their families to teach and build food skills
- integrating food education into curricula
School food programs provide unique opportunities for collaboration. Organizations noted schools could work with Indigenous Elders and Friendship Centres. These collaborations could educate children on traditional foods, particularly through land-based activities. Some participants noted the historical wrongdoings of government on Indigenous food systems. They voiced that food literacy teaching needs to reflect these wrongdoings.
Views of children and youth
There was significant enthusiasm from children and youth to be involved in their programs. Several participants commented on the importance of youth “getting to decide what goes into their bodies”. Both children and youth noted that they are best at deciding what they want to eat and could benefit now and into the future from being more involved in components like meal preparation.
Some youth expressed that they did not feel like their voices were reflected in the programs at their school. Some shared that the food served has not changed, despite decreasing participation, and that their suggestions for improvements to the programs have not been implemented. They also noted that at times they do not know where to voice their suggestions as it is not clear who is in charge of programming.
Children expressed interest in deciding what kinds of food they consume and having the opportunity to suggest foods to try in their programs. Many shared that school food programs should include food from different cultures and one child noted that “some people may not feel appreciated if there is no food that represents their culture.”
Youth also noted that programs could also be an educational opportunity. They suggested that programs could help youth:
- learn how to safely prepare food
- address negative perceptions about healthy food
- achieve balance in their diet
- prepare and plan healthy and affordable meals
“Hands-on participatory programs are linked to increased nutritional knowledge, higher intake of nutrient-dense foods such as vegetables and fruits, and increased preference for healthy foods, especially among younger children. Children of all ages can participate in age-appropriate food skill activities.”
“I'm about to move out next year. So having [a program that] shows me how to make the nutritious meals with… cheap ingredients [would be] something that is really useful for me.”
“The kids at the school who have programs should have a certain say into what's happening with the program itself because ultimately they're the ones who are going to be impacted by what's being served. Like [other participant] said earlier, if they're eating the same thing every day for 4 years at some point it will discourage some people to use it because they're looking for diversity in their food… It doesn't need to be run 100% by the students, but at least have some type of committee by the students to help set menus and work with the school administration or whoever runs the program…
“Giving students the opportunity to have a say, provide feedback and see their voices heard by staff will build acceptance of and commitment to the program.”
Local food systems and community development
Participants saw an opportunity to boost local food production and economic development. Many stakeholders voiced potential to boost development through:
- creating jobs (for example program administrators, food service and food supply chain workers, dietitians and chefs)
- growing the role of local agriculture, food businesses, hunters and harvesters in school food
- investing in local food supply chains and infrastructure
A quarter of questionnaire respondents noted promoting connections to local food and producers as an important goal of the Policy.
Food and agriculture organizations recommended a flexible “local” food procurement definition. Participants noted communities have differing abilities to produce and provide local food. These abilities depend on factors such as geography and seasonality.
Some participants noted concerns that current school food procurement practices favour large-scale businesses. They raised that local communities and marginalized populations lack participation and decision-making power. Service delivery and community advocacy organizations noted ways to address this including:
- shifting procurement practices to focus on other factors over costs including:
- locality
- sustainability
- underrepresented small and medium businesses led by Black and Indigenous peoples, youth and women
- providing incentives and/or subsidies to reduce the higher costs of sourcing local food for schools
- creating networks, like food hubs, between schools and businesses to provide logistics support
Academics shared evidence that school-owned supply chains reduced program costs. They noted that income for local producers and harvesters improved when third-party suppliers were not used.
Views of children and youth
A few youth participants voiced the opinion that programs run by smaller companies, by their school, or by clubs within their school are more likely to provide lower cost and better-quality food for students than programs run by larger corporations.
A few youth also voiced the opinion that food should be locally sourced when possible as this would help students discover local products and encourage the local economy.
“We strongly advocate using locally owned and operated companies to provide meals to schools. This will stimulate local economy and employment as well as making it easier to use locally sourced products and produce appropriate cultural meals.”
Program delivery challenges
Service delivery organizations and school communities are experiencing increases in demand for programming. This comes at a time when they are also facing significant decreases in capacity. They noted the decrease in capacity is due to many factors, including the higher cost of food. Organizations shared that they are experiencing challenges including:
- infrastructure
- the need for paid staff
- lack of data and governance structure
Infrastructure
Service delivery organizations and school communities noted a lack of infrastructure. They shared that this is a barrier to program delivery and expansion.
Some service delivery organizations shared that some of their funding has limits on non-food related costs. These costs include infrastructure, equipment and administration costs. They noted the goal of these limits is to ensure funding goes towards increasing access to food. Many organizations lamented that these limits constrain their ability to deliver programs. For example, participants noted that, to deliver programs, volunteers and staff need documents like:
- Vulnerable Sector Checks
- safe food handler certification
They explained that non-food funding limits make costs like these difficult to absorb.
School communities shared that many schools do not have dedicated kitchen spaces. This requires them to:
- find space outside schools to produce and package meals
- create space inside schools for storage before service
Some service delivery organizations voiced their experiences during the COVID-19 pandemic. They relied on pre-packaged goods and single-use plates and cutlery to deliver programming. They raised the need to invest in reusable goods and dishwashing to deliver programs sustainably and reduce costs.
Some service delivery organizations also noted challenges in dealing with food waste. They expressed that programs need to invest in infrastructure to manage food waste.
“Inadequate infrastructure limits programming in many schools. Capital funding projects provide an opportunity to ensure adequate kitchen and storage space… bright, non-stigmatizing eating areas; and external building features such as transportation access for food deliveries and outdoor lighting to facilitate after hours food preparation for [school nutrition programs].”
Need for paid staff
Participants shared that school food programs rely on volunteers to deliver programming. They also noted challenges recruiting volunteers. This increases pressure on teachers and administrators to provide programming.
Organizations agreed that more paid staff would allow programming to be more sustainable.
Organizations stressed the potential benefits of more paid staff including:
- increased local employment opportunities
- increased food preparation yields and lower food waste
- increased program accountability
- more efficient program operations and management
Organizations receive funding that may have limits on non-food related expenses. They also rely on voluntary contributions that can be unpredictable. Organizations noted that these 2 factors make hiring paid staff difficult.
“[W]e recognize that current school food programs are highly dependent on volunteers and school staff who volunteer their time… funding should be flexible so that schools can decide to hire a community member or pay an existing school staff to do this important work.”
Data and governance structure
Many participants raised the lack of data at a program and a national level.
Many organizations voiced the lack of data and web-based tools as a gap in their operations. They expressed a desire to adopt more of these tools in their work.
On the national level, many academics and service delivery organizations observed a lack of program data. They expressed this data gap makes it difficult to:
- understand where and how many students have access to programming
- measure program benefit and impact
- compare and contrast different program models
They voiced the need for common reporting metrics and reporting structure. They noted programs need to invest in infrastructure and capacity to deliver this reporting.
At a program level, some service delivery organizations noted the benefits gained using data and web-based tools to:
- make informed program decisions based on data analytics
- efficiently organize and manage their internal operations
- host web portals for families to easily pay for meals and provide feedback
Academics and organizations raised the need for more information sharing and governance. Participants noted that they were able to learn from each other through the Government's engagements on school food. Many lamented that they lack a permanent mechanism to discuss across the country.
Many participants recommended establishing a community of practice. This community of practice could serve as the forum for school food across Canada. Through this, the sharing of information, lessons learned and best practices could continue. Additionally, the community of practice could explore key issues programs generally experience. They shared that it was also an opportunity to collect, analyze and review data together.
“We believe that the Policy [and] program will be successful if it supports communities of practice to enhance coordination, share best practices, and develop evidence-informed programming.”
Rural, remote and Northern communities
There are challenges when delivering programming in rural, remote and Northern communities. Participants voiced that these challenges include:
- higher costs for food, labour and transportation
- differing levels of infrastructure. Some communities face higher program costs
- water and sewage issues in the North can impact food preparation and create food safety concerns
- severity of seasonal and climactic impacts. This creates challenges with growing and transporting food in winter months
- lengthy commutes. Students can arrive at school after breakfast programs have already ended
- human resources are more limited in rural and remote areas. Attracting and retaining paid staff is essential in these areas
“[I]n [N]orthern rural communities, schools are often isolated and are at great distance from grocery stores. In this instance there is a need to use some funding for gas costs. In other communities, food must be shipped frozen, and multiple freezers are essential. In urban areas, schools have large populations and commercial food preparation equipment and additional labour is needed.”
Indigenous school food programming
Participants shared views on a policy from an Indigenous perspective through the engagements:
- respect and value the practices and cultures of First Nations, Inuit and Métis peoples by offering traditional and country foods
- involve communities in all stages of program development and implementation
- account for food insecurity experienced by First Nations, Inuit and Métis communities. This includes considering the limited access to fresh, healthy produce due to lack of availability and high cost
- ensure that funding:
- considers the specific needs of each community
- is enough to serve all children
- accounts for more than the cost of food, like staff and infrastructure costs
Participants recommended that Indigenous partners have full control over programming. They also recommended that initiatives ensure access to traditional food and knowledge.
“Work with communities to find out how the program would work best for them. Do not impose or implement the program without including communities in planning from the beginning.”
What’s Next
The engagements demonstrate overwhelming support for a National School Food Policy. Through these engagement activities, we have gained a better understanding of the current school food landscape, as well as views on principles and objectives that could shape a National School Food Policy.
What we heard will help to inform the development of a National School Food Policy which remains an important commitment for the Government of Canada. We look forward to continuing to work with Indigenous partners, provinces and territories and stakeholders on this important commitment.
Acknowledgements
We thank everyone who participated in the engagements. The feedback from participants was wide-ranging, varied and in some instances, opposing. We appreciate the input provided by all engagement participants.
We thank the Breakfast Club of Canada and the Coalition for Healthy School Food for providing invaluable support throughout the process. We thank Children First Canada for facilitating the engagements with children and youth.
Annex A - Virtual roundtable participants
- Afri-Can FoodBasket
- Agriculture in the Classroom Canada
- Agropur
- Alberta Food Matters
- Aliments d'ici et saveurs d'ailleurs
- APPLE Schools
- Backpack Buddies
- Ballenas Secondary School, School District 69 (Qualicum)
- Boys and Girls Club of Canada
- Breakfast Club of Canada
- British Columbia Centre for Disease Control
- British Columbia Ministry of Agriculture
- British Columbia Public Health Agency
- British Columbia Teachers’ Federation
- Brown Bagging for Calgary’s Kids
- Calgary Food Bank
- Canadian Association of School System Administrators
- Canadian Cancer Society
- Canadian Cattle Youth Council
- Canadian Cattlemen’s Association
- Canadian Feed the Children
- Canadian Nutrition Society
- Canadian Paediatric Society
- Canadian Produce Marketing Association
- Canadian School Boards Association
- Canadian Teachers’ Federation
- CAPE
- Centre de services scolaire de Montréal
- Chantier Program
- CHEP Good Food Inc.
- Child Nutrition Council of Manitoba
- Children First Canada
- Children Nutrition Council of Manitoba
- Chilliwack Bowls of Hope Society
- Coalition for Healthy School Food
- Coalition for Healthy School Food- BC Chapter Lead
- Collectif QC Alimentation scolaire
- Conseil du système alimentaire montréalais
- Dairy Farmers of Canada
- Dietitians of Canada
- E4C
- École Salisbury Morse Place School, River East Transcona School Division
- Edmonton School Board
- Egg Farmers of Canada
- Equiterre
- Fare Farms Initiative
- Farm to Cafeteria Canada
- Farm to School BC
- Fédération des comités de parents du Québec
- Fédération nationale des conseils scolaires francophones
- Federation of Canadian Municipalities
- Ferron Family Farms
- First Nations Education Council
- Fisheries Council of Canada
- Food Allergy Canada
- Food Depot Alimentaire
- Food First Foundation
- Food First NL
- Food For Kids / Peterborough Public Health
- Food Producers of Canada
- Food Secure Canada
- Fredericton Anglophone School District West
- Fresh Roots (LunchLAB)
- Fruit and Vegetable Growers of Canada
- Halifax Food Policy Alliance
- Heart and Stroke Foundation of Canada
- Indigenous & Black Peoples Food Sovereignity
- Jambican Studio Gardens
- Kativik Ilisarniliriniq
- Kids Eat Smart Foundation
- KTC Education Authority
- La cantine pour tous
- La Grande Table
- La table des Chefs
- Le Conseil de la transformation alimentaire du Québec
- Lord Roberts Elementary School, Vancouver School Board
- Manitoba Education and Early Childhood Learning
- Maskwacîs Education Schools Commission
- MAURO
- Mohawk Medbuy Corporation
- Natoaganeg Mi’kmaq School, Eel Ground NB, Principal
- National Farmers’ Union
- Newfoundland and Labrador Ministry of Fisheries, Forestry, and Agriculture
- Northern Manitoba Food, Culture and Community
- Northwest Territories Ministry of Industry, Tourism, and Investment
- Nourish Cowichan Society
- Nourish Leadership
- Nourish Nova Scotia
- Nourish NS
- Nova Scotia Ministry of Agriculture
- Nunavik Regional Board of Health and Social Services
- Nunavut Tunngavik Incorporated
- Oakwood Public School, Halton District School Board / Farm to Cafeteria
- Ontario Fruit and Vegetable Growers Association
- Ontario Ministry of Agriculture, Food and Rural Affairs
- Ontario Public School Boards’ Association
- Ontario Student Nutrition Program
- Ottawa Network for Education
- PEI School Food Program
- Peterborough Child & Family Centres
- Physical and Health Education Canada
- Prairie Oat Growers Association
- Presidents’ Choice Children’s Charity
- Prince Edward Island Teachers’ Federation
- PROOF
- Pulse Canada
- Qajuqturvik Food Centre
- Regina Food for Learning
- School Lunch Association
- Shuswap Food Action
- Sirivik
- Student Nutrition Ontario
- Tastebuds Hamilton
- The UpLift Partnership
- Toronto Black Farmers
- Toronto District School Board
- Toronto Foundation for Student Success
- Toronto Public Health
- Tr’ondek Hwech’in Teaching and Working Farm
- Winnipeg Food Council
- Yukon First Nation Education Directorate
- Yukon First Nations Education Directorate
- Yukon Food for Learning
- Yukon Ministry of Energy, Mines, and Resources
Annex B – Questionnaire results summary
Questions asked to all respondents
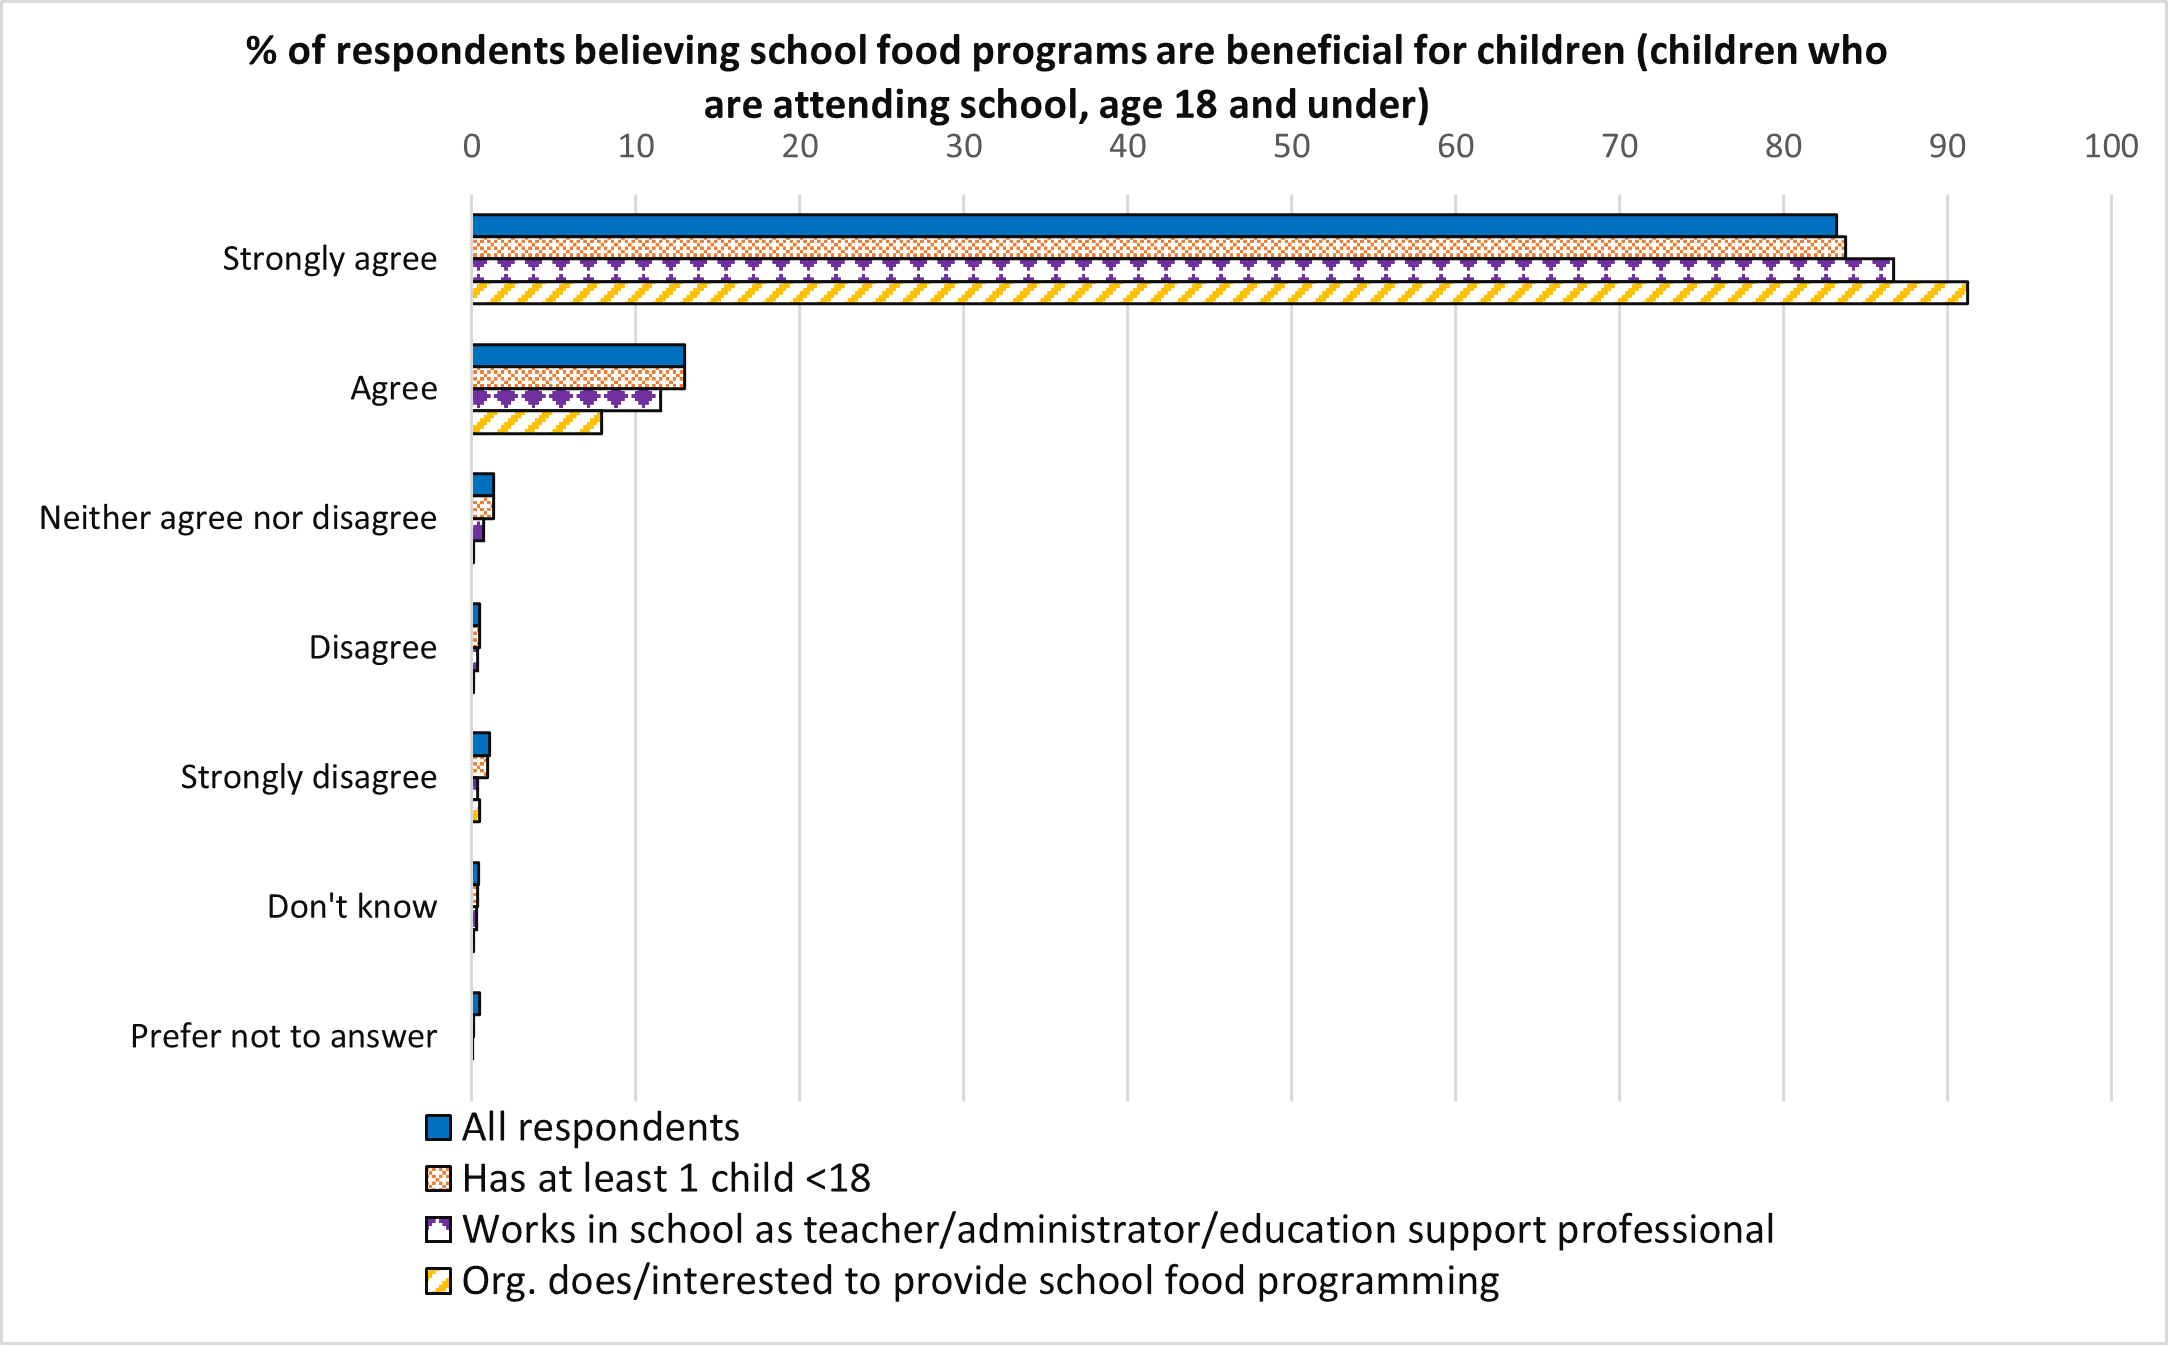
Figure 1 - Text version
| Response | All respondents | Has at least 1 child <18 | Works in school as teacher / administrator / education support professional | Organisation does / interested to provide school food programming |
|---|---|---|---|---|
| Strongly agree | 83.23% | 83.77% | 86.71% | 91.23% |
| Agree | 12.97% | 12.98% | 11.54% | 7.93% |
| Neither agree nor disagree | 1.34% | 1.33% | 0.74% | 0.12% |
| Disagree | 0.49% | 0.49% | 0.34% | 0.12% |
| Strongly disagree | 1.10% | 0.98% | 0.34% | 0.48% |
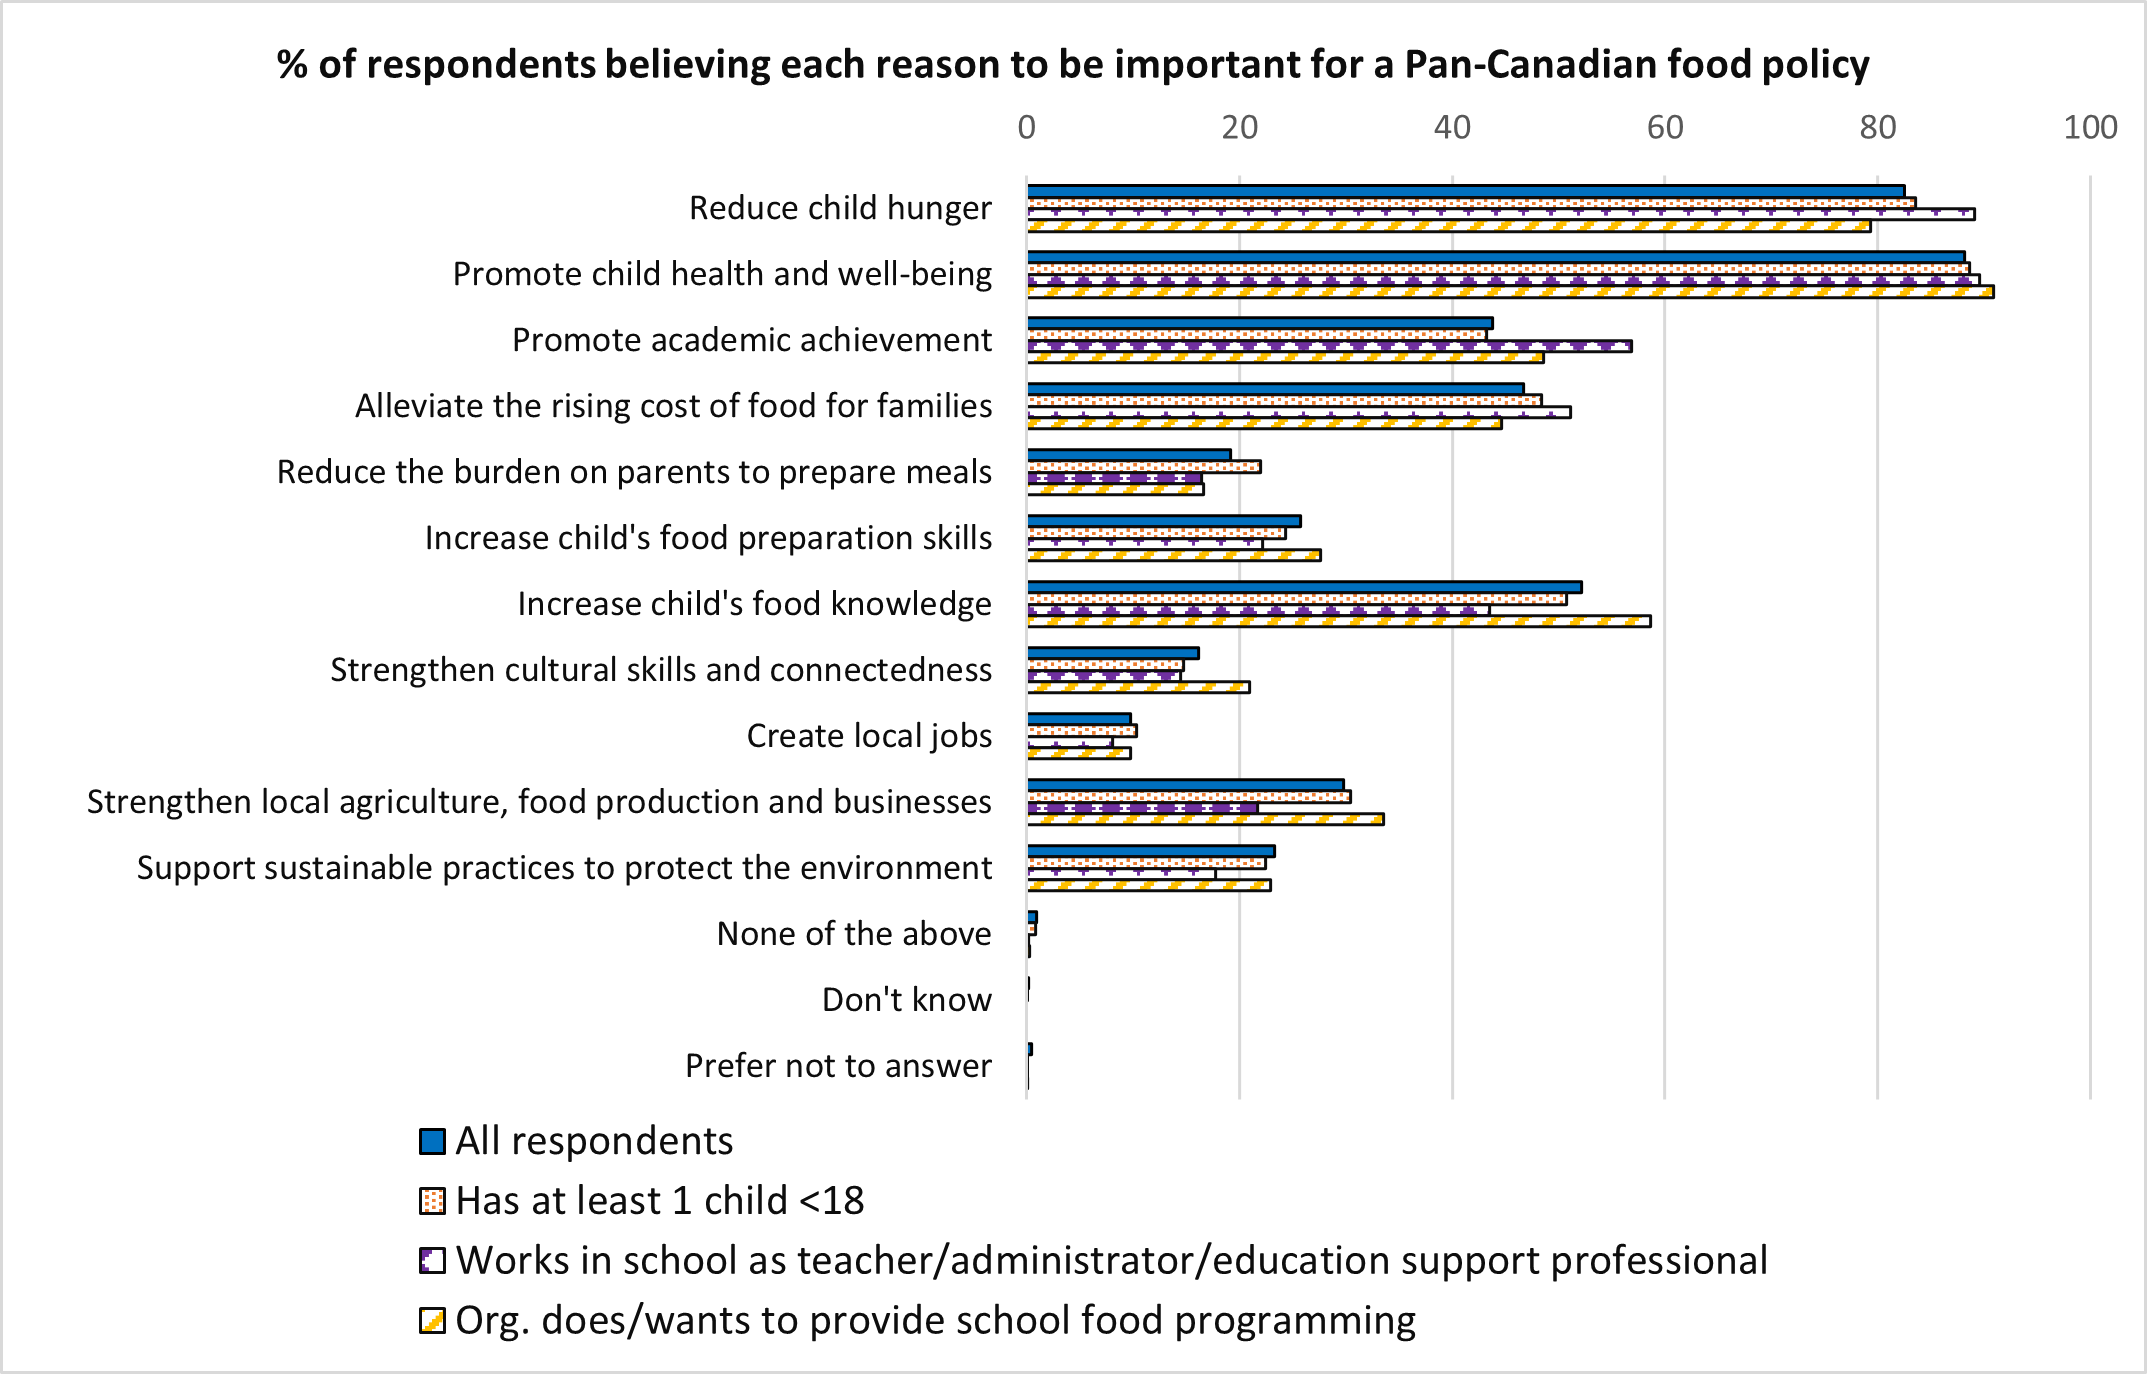
Figure 2 - Text version
| Reason | All respondents | Has at least 1 child <18 | Works in school as teacher / administrator / education support professional | Organisation does / interested to provide school food programming |
|---|---|---|---|---|
| Reduce child hunger | 82.55% | 83.56% | 89.07% | 79.33% |
| Promote child health and well-being | 88.13% | 88.59% | 89.54% | 90.87% |
| Promote academic achievement | 43.82% | 43.21% | 56.88% | 48.56% |
| Alleviate the rising cost of food for families | 46.66% | 48.41% | 51.15% | 44.59% |
| Reduce the burden on parents to prepare meals | 19.19% | 22.02% | 16.4% | 16.59% |
| Increase child’s food preparation skills | 25.71% | 24.36% | 22.13% | 27.64% |
| Increase child’s food knowledge (for example, where it comes from, nutrition principles, traditional foods and practices) | 52.13% | 50.79% | 43.52% | 58.65% |
| Strengthen cultural skills and connectedness | 16.18% | 14.73% | 14.44% | 20.91% |
| Create local jobs | 9.73% | 10.37% | 8.03% | 9.74% |
| Strengthen local agriculture, food production and businesses | 29.79% | 30.4% | 21.73% | 33.53% |
| Support sustainable practices to protect the environment | 23.28% | 22.41% | 17.75% | 22.96% |
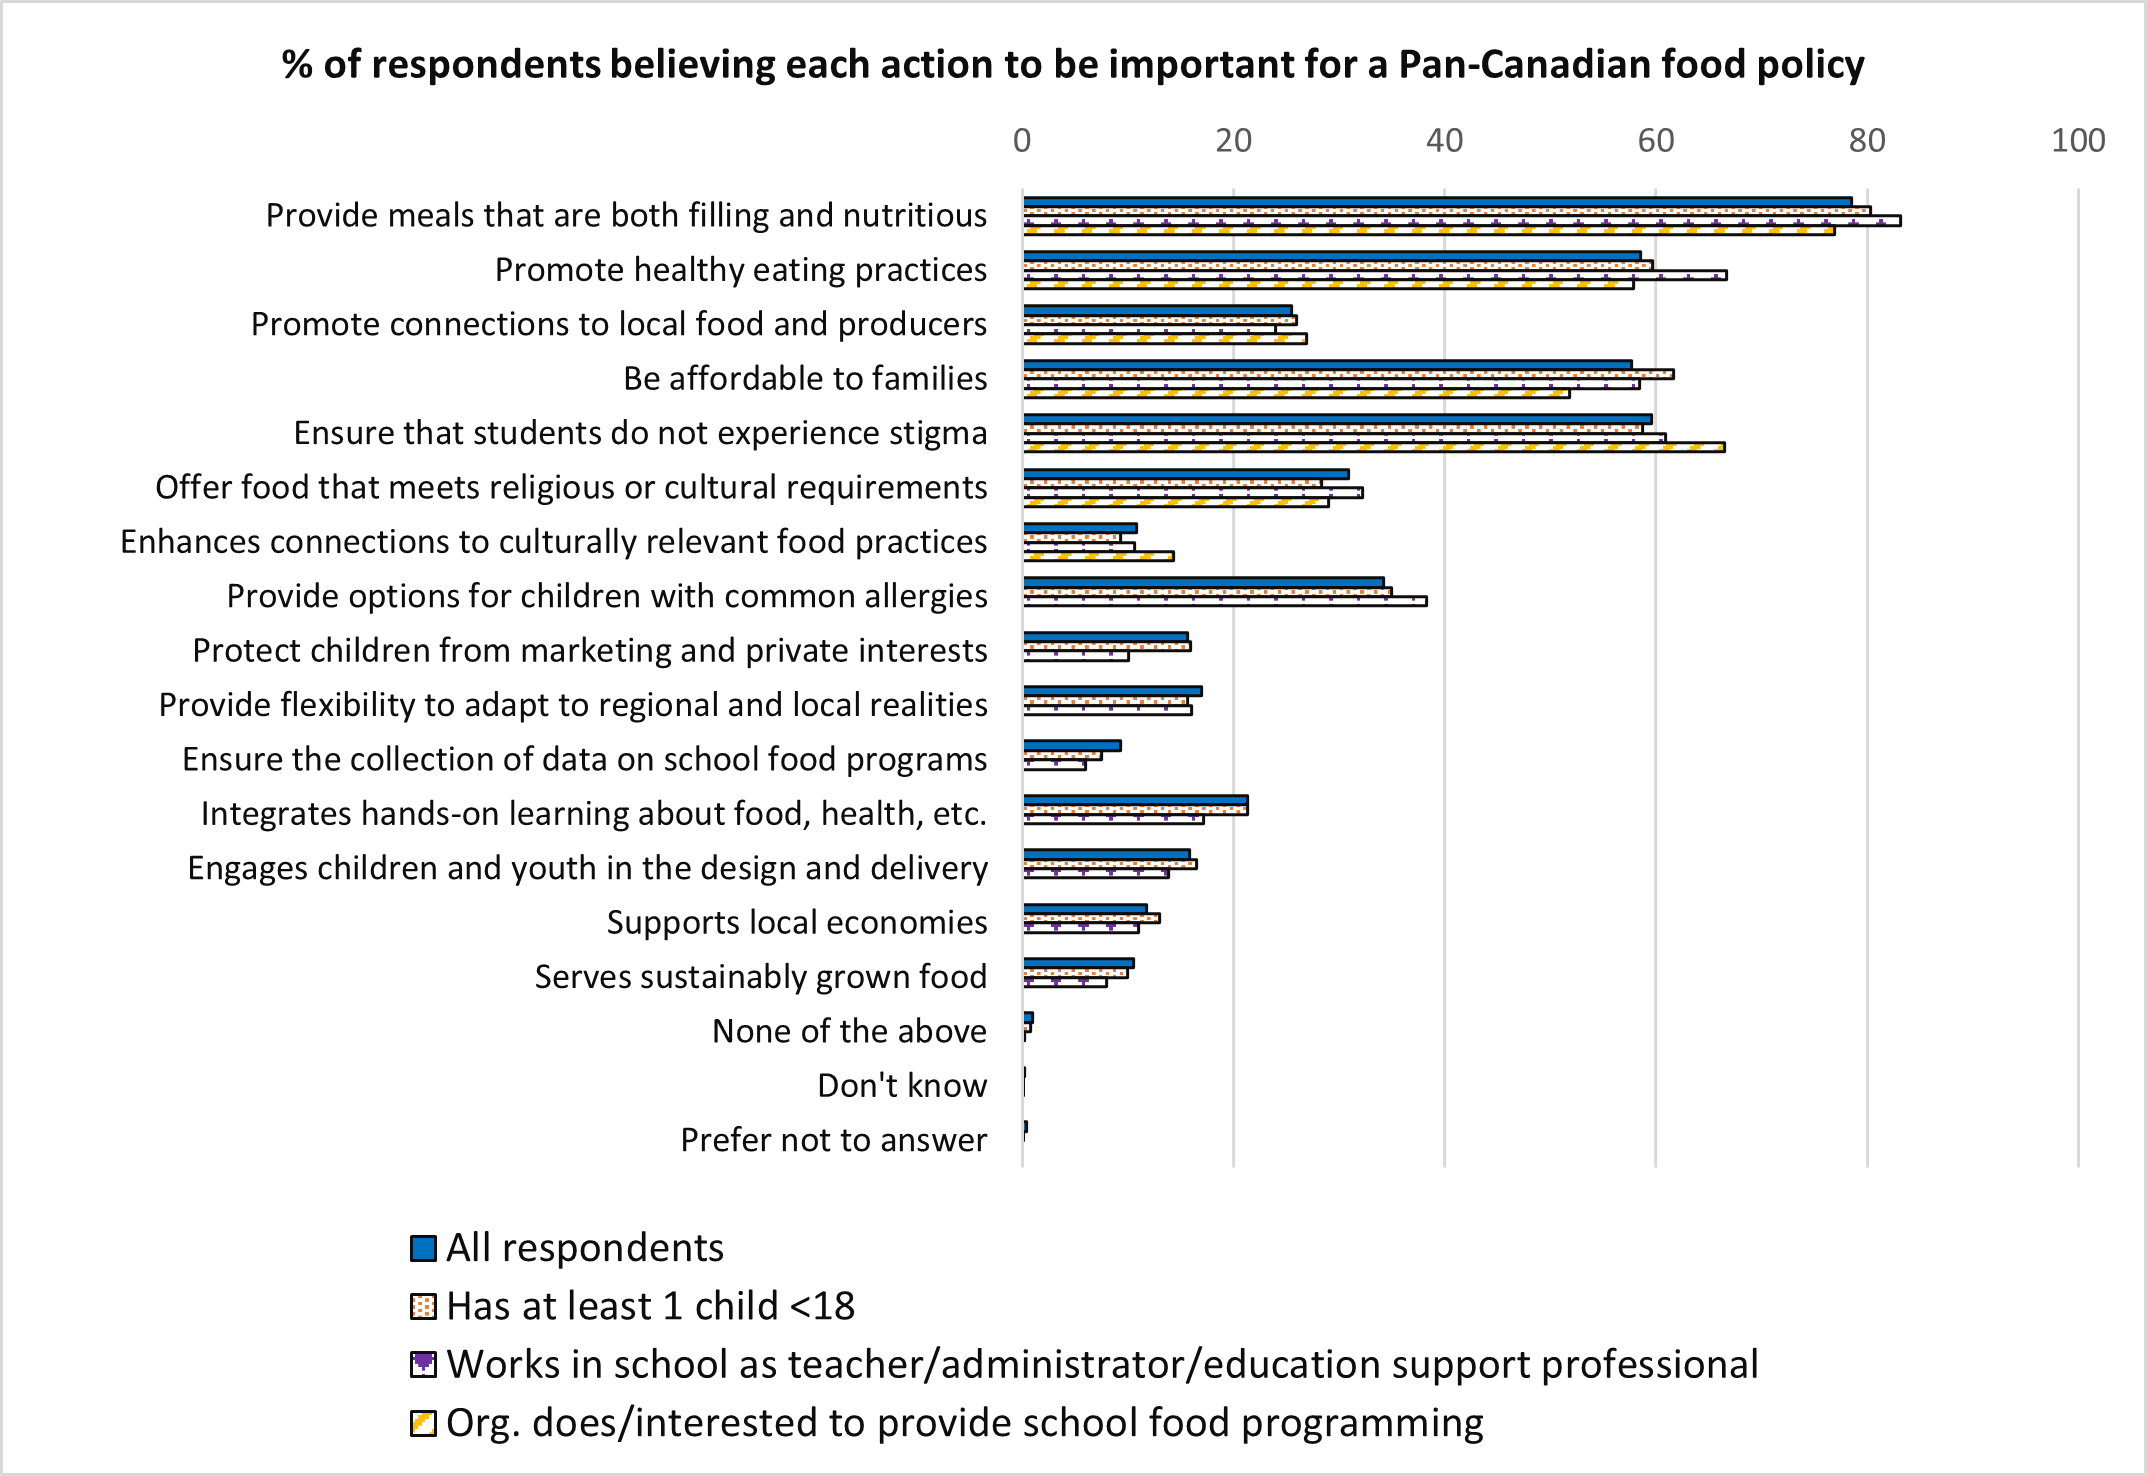
Figure 3 - Text version
| Action | All respondents | Has at least 1 child <18 | Works in school as teacher / administrator / education support professional | Organisation does / interested to provide school food programming |
|---|---|---|---|---|
| Provide meals that are both filling and nutritious | 78.5% | 80.35% | 83.13% | 76.92% |
| Promote healthy eating practices | 58.57% | 59.65% | 66.67% | 57.93% |
| Promote connections to local food and producers | 25.52% | 25.97% | 24.02% | 26.92% |
| Be affordable to families | 57.68% | 61.71% | 58.5% | 51.8% |
| Ensure that students do not experience stigma for participating in the program | 59.59% | 58.78% | 60.93% | 66.47% |
| Offer food that meets religious or cultural requirements (for example: kosher, halal, vegetarian) | 30.93% | 28.34% | 32.25% | 28.97% |
| Enhances connections to culturally relevant food practices (for example: traditional food, country food) | 10.88% | 9.32% | 10.66% | 14.3% |
| Provide options for children with common allergies (for example: nut, milk, wheat) | 34.2% | 34.97% | 38.33% | 25.84% |
| Protect children from marketing and private interests | 15.65% | 15.95% | 10.12% | 12.38% |
| Provide flexibility to adapt to regional and local realities | 17.02% | 15.64% | 16.06% | 25.72% |
| Ensure the collection of data on school food programs to measure progress | 9.28% | 7.57% | 6.01% | 13.82% |
| Integrates hands-on learning about food, health, and the environment | 21.37% | 21.36% | 17.21% | 26.56% |
| Engages children and youth in the design and delivery (for example: menu planning and preparation) | 15.88% | 16.54% | 13.83% | 19.23% |
| Supports local economies | 11.81% | 12.98% | 11.07% | 12.62% |
| Serves sustainably grown food | 10.54% | 9.95% | 7.96% | 11.06% |
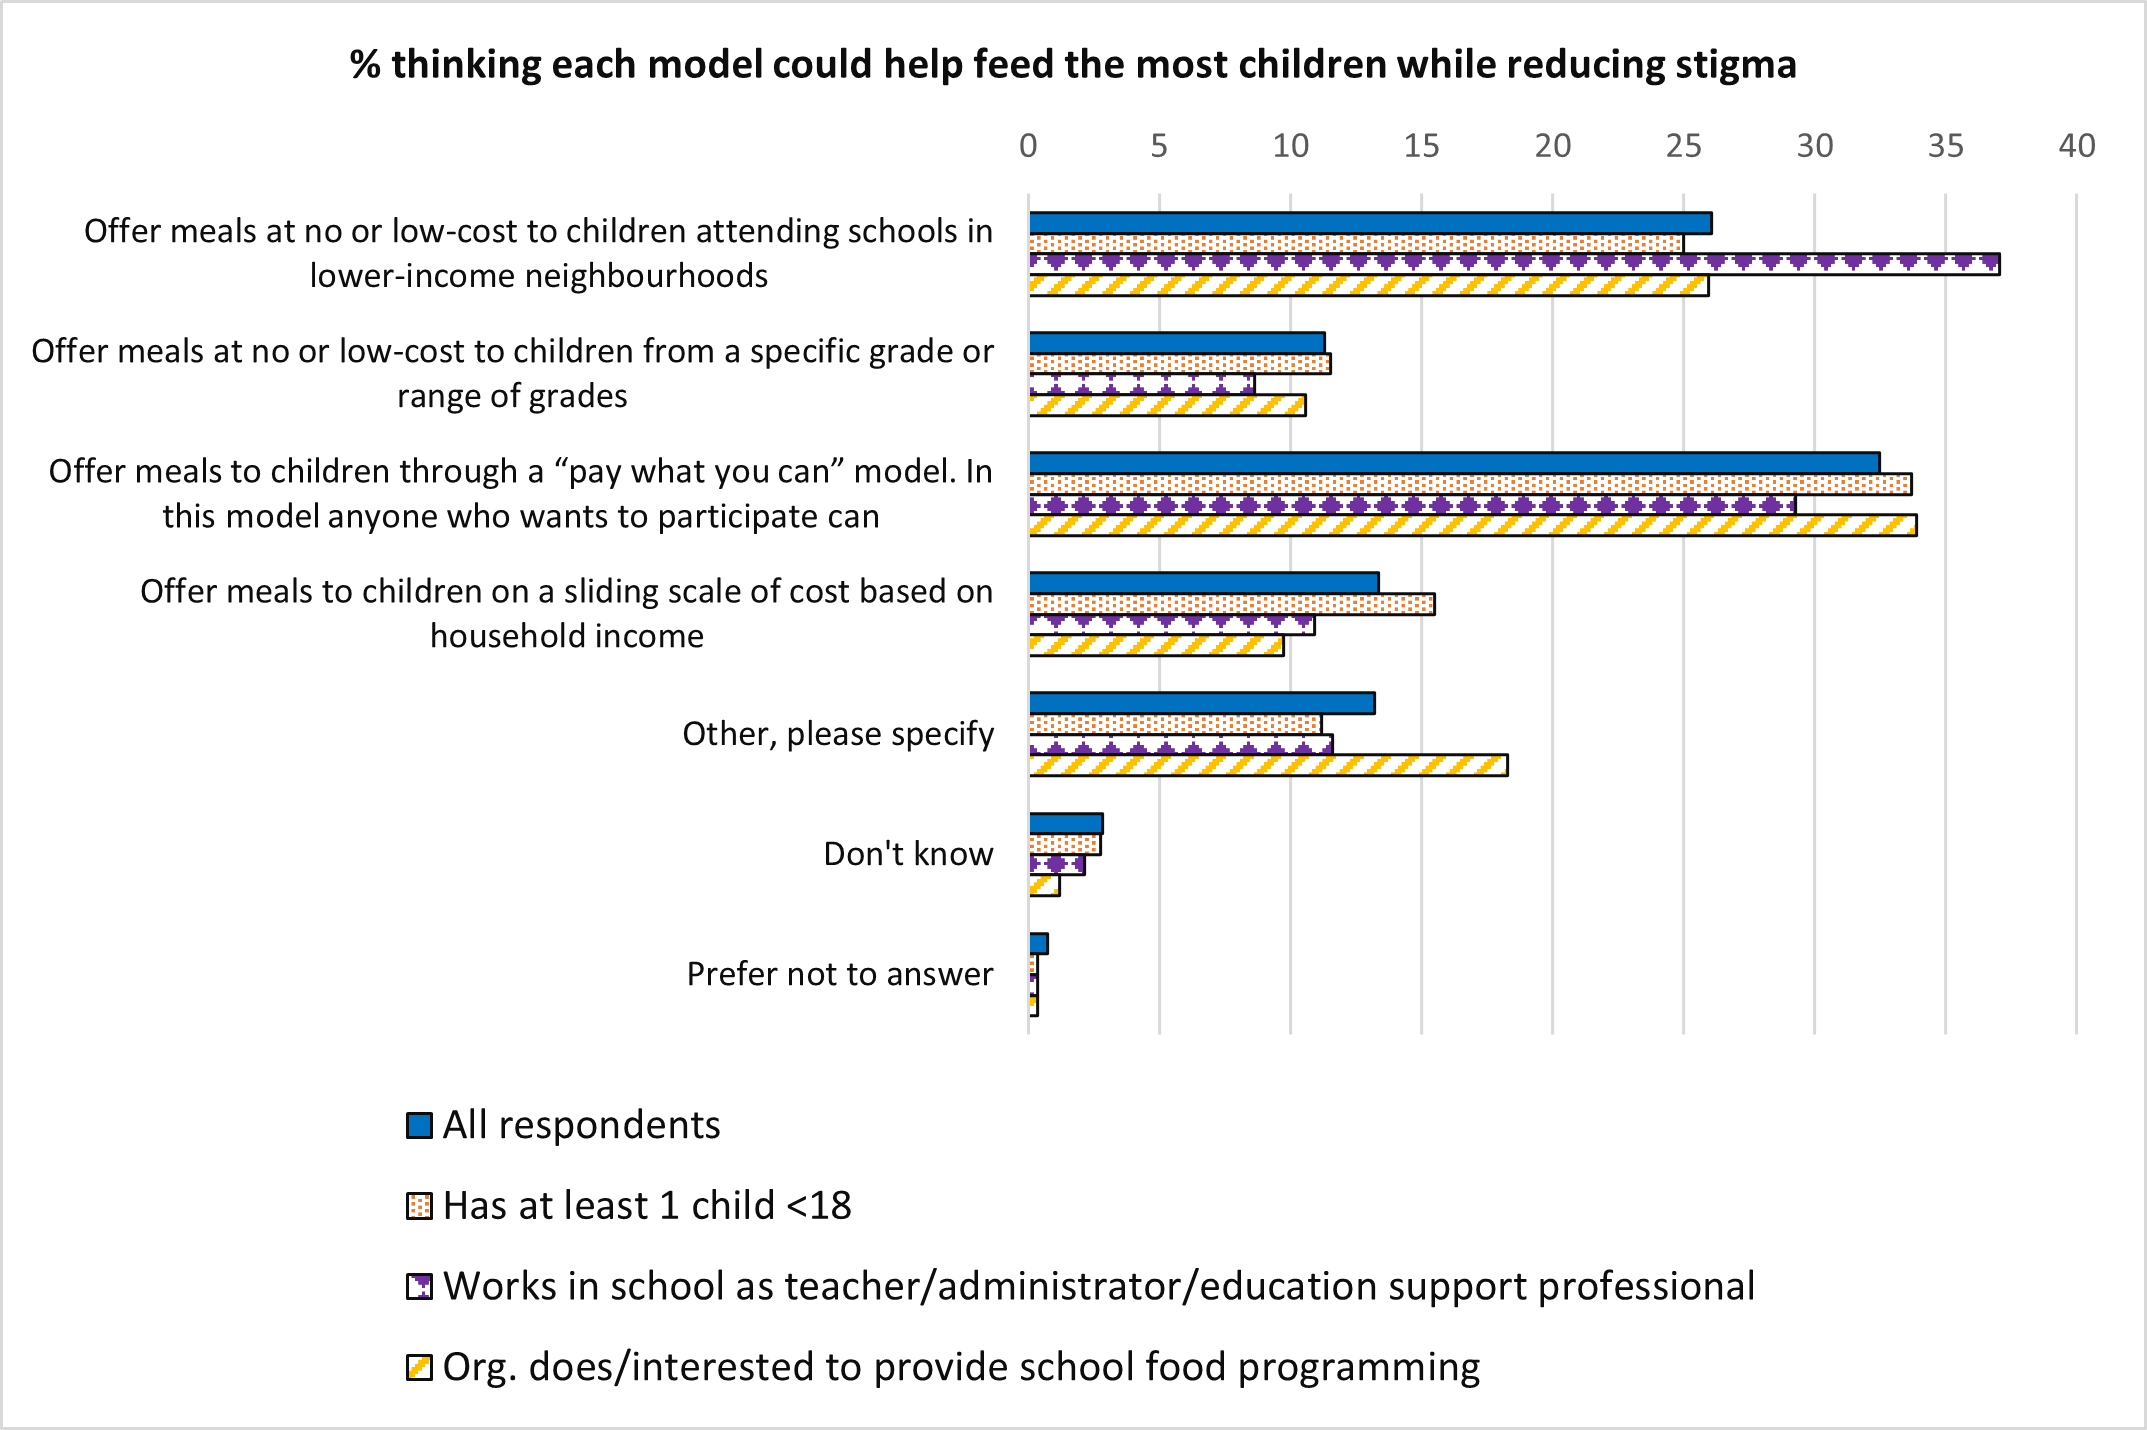
Figure 4 - Text version
| Model | All respondents | Has at least 1 child <18 | Works in school as teacher / administrator / education support professional | Organisation does / interested to provide school food programming |
|---|---|---|---|---|
| Offer meals at no or low-cost to children attending schools in lower-income neighbourhoods | 26.08% | 24.99% | 37.04% | 25.96% |
| Offer meals at no or low-cost to children from a specific grade or range of grades | 11.3% | 11.52% | 8.64% | 10.58% |
| Offer meals to children through a “pay what you can” model. In this model anyone who wants to participate can and has the option to pay what they are able to pay | 32.48% | 33.68% | 29.28% | 33.89% |
| Offer meals to children on a sliding scale of cost based on household income | 13.36% | 15.5% | 10.93% | 9.74% |
| Other, please specify | 13.21% | 11.2% | 11.61% | 18.27% |
| Don’t know | 2.84% | 2.76% | 2.16% | 1.2% |
| Prefer not to answer | 0.72% | 0.35% | 0.34% | 0.36% |
Questions asked to parents
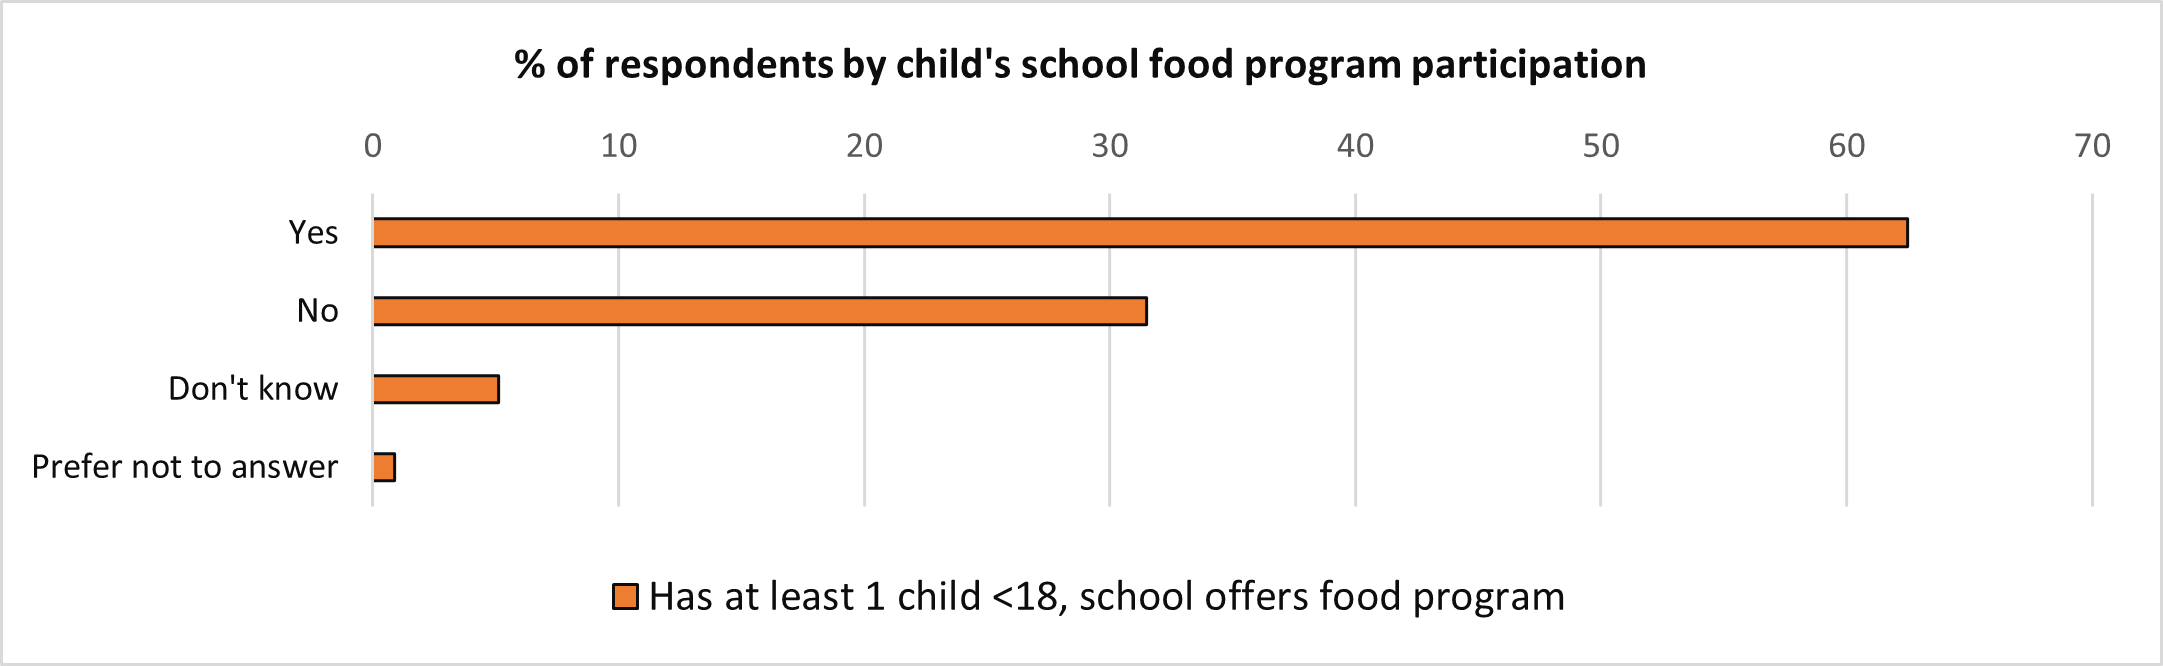
Figure 5 - Text version
| Participation | Has at least one child <18, school offers food program |
|---|---|
| Yes | 62.49% |
| No | 31.51% |
| Don’t know | 5.12% |
| Prefer not to answer | 0.88% |
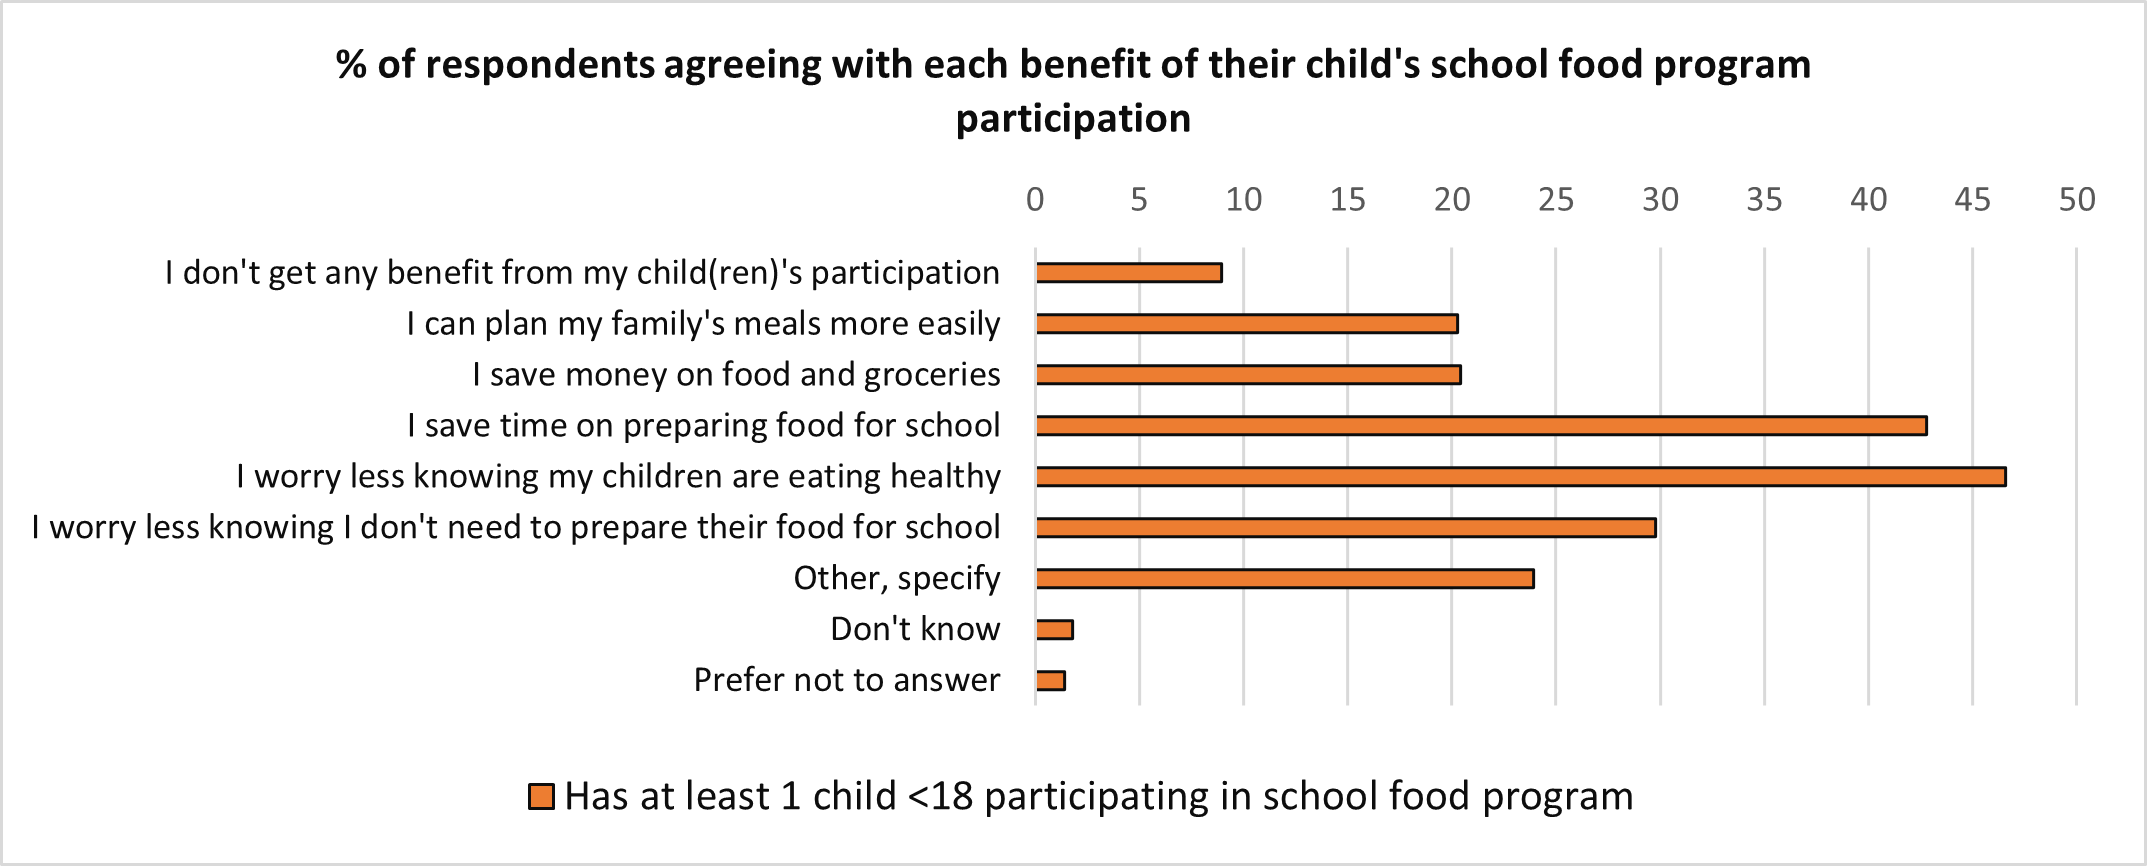
Figure 6 - Text version
| Benefit | Has at least one child <18 participating in school food program |
|---|---|
| I don’t get any benefit from my child(ren)’s participation | 8.95% |
| I can plan my family’s meals more easily | 20.28% |
| I save money on food and groceries | 20.42% |
| I save time on preparing food for school | 42.8% |
| I worry less knowing my children are eating healthy | 46.57% |
| I worry less knowing I don’t need to prepare their food for school | 29.79% |
| Other, specify | 23.92% |
| Don’t know | 1.82% |
| Prefer not to answer | 1.4% |
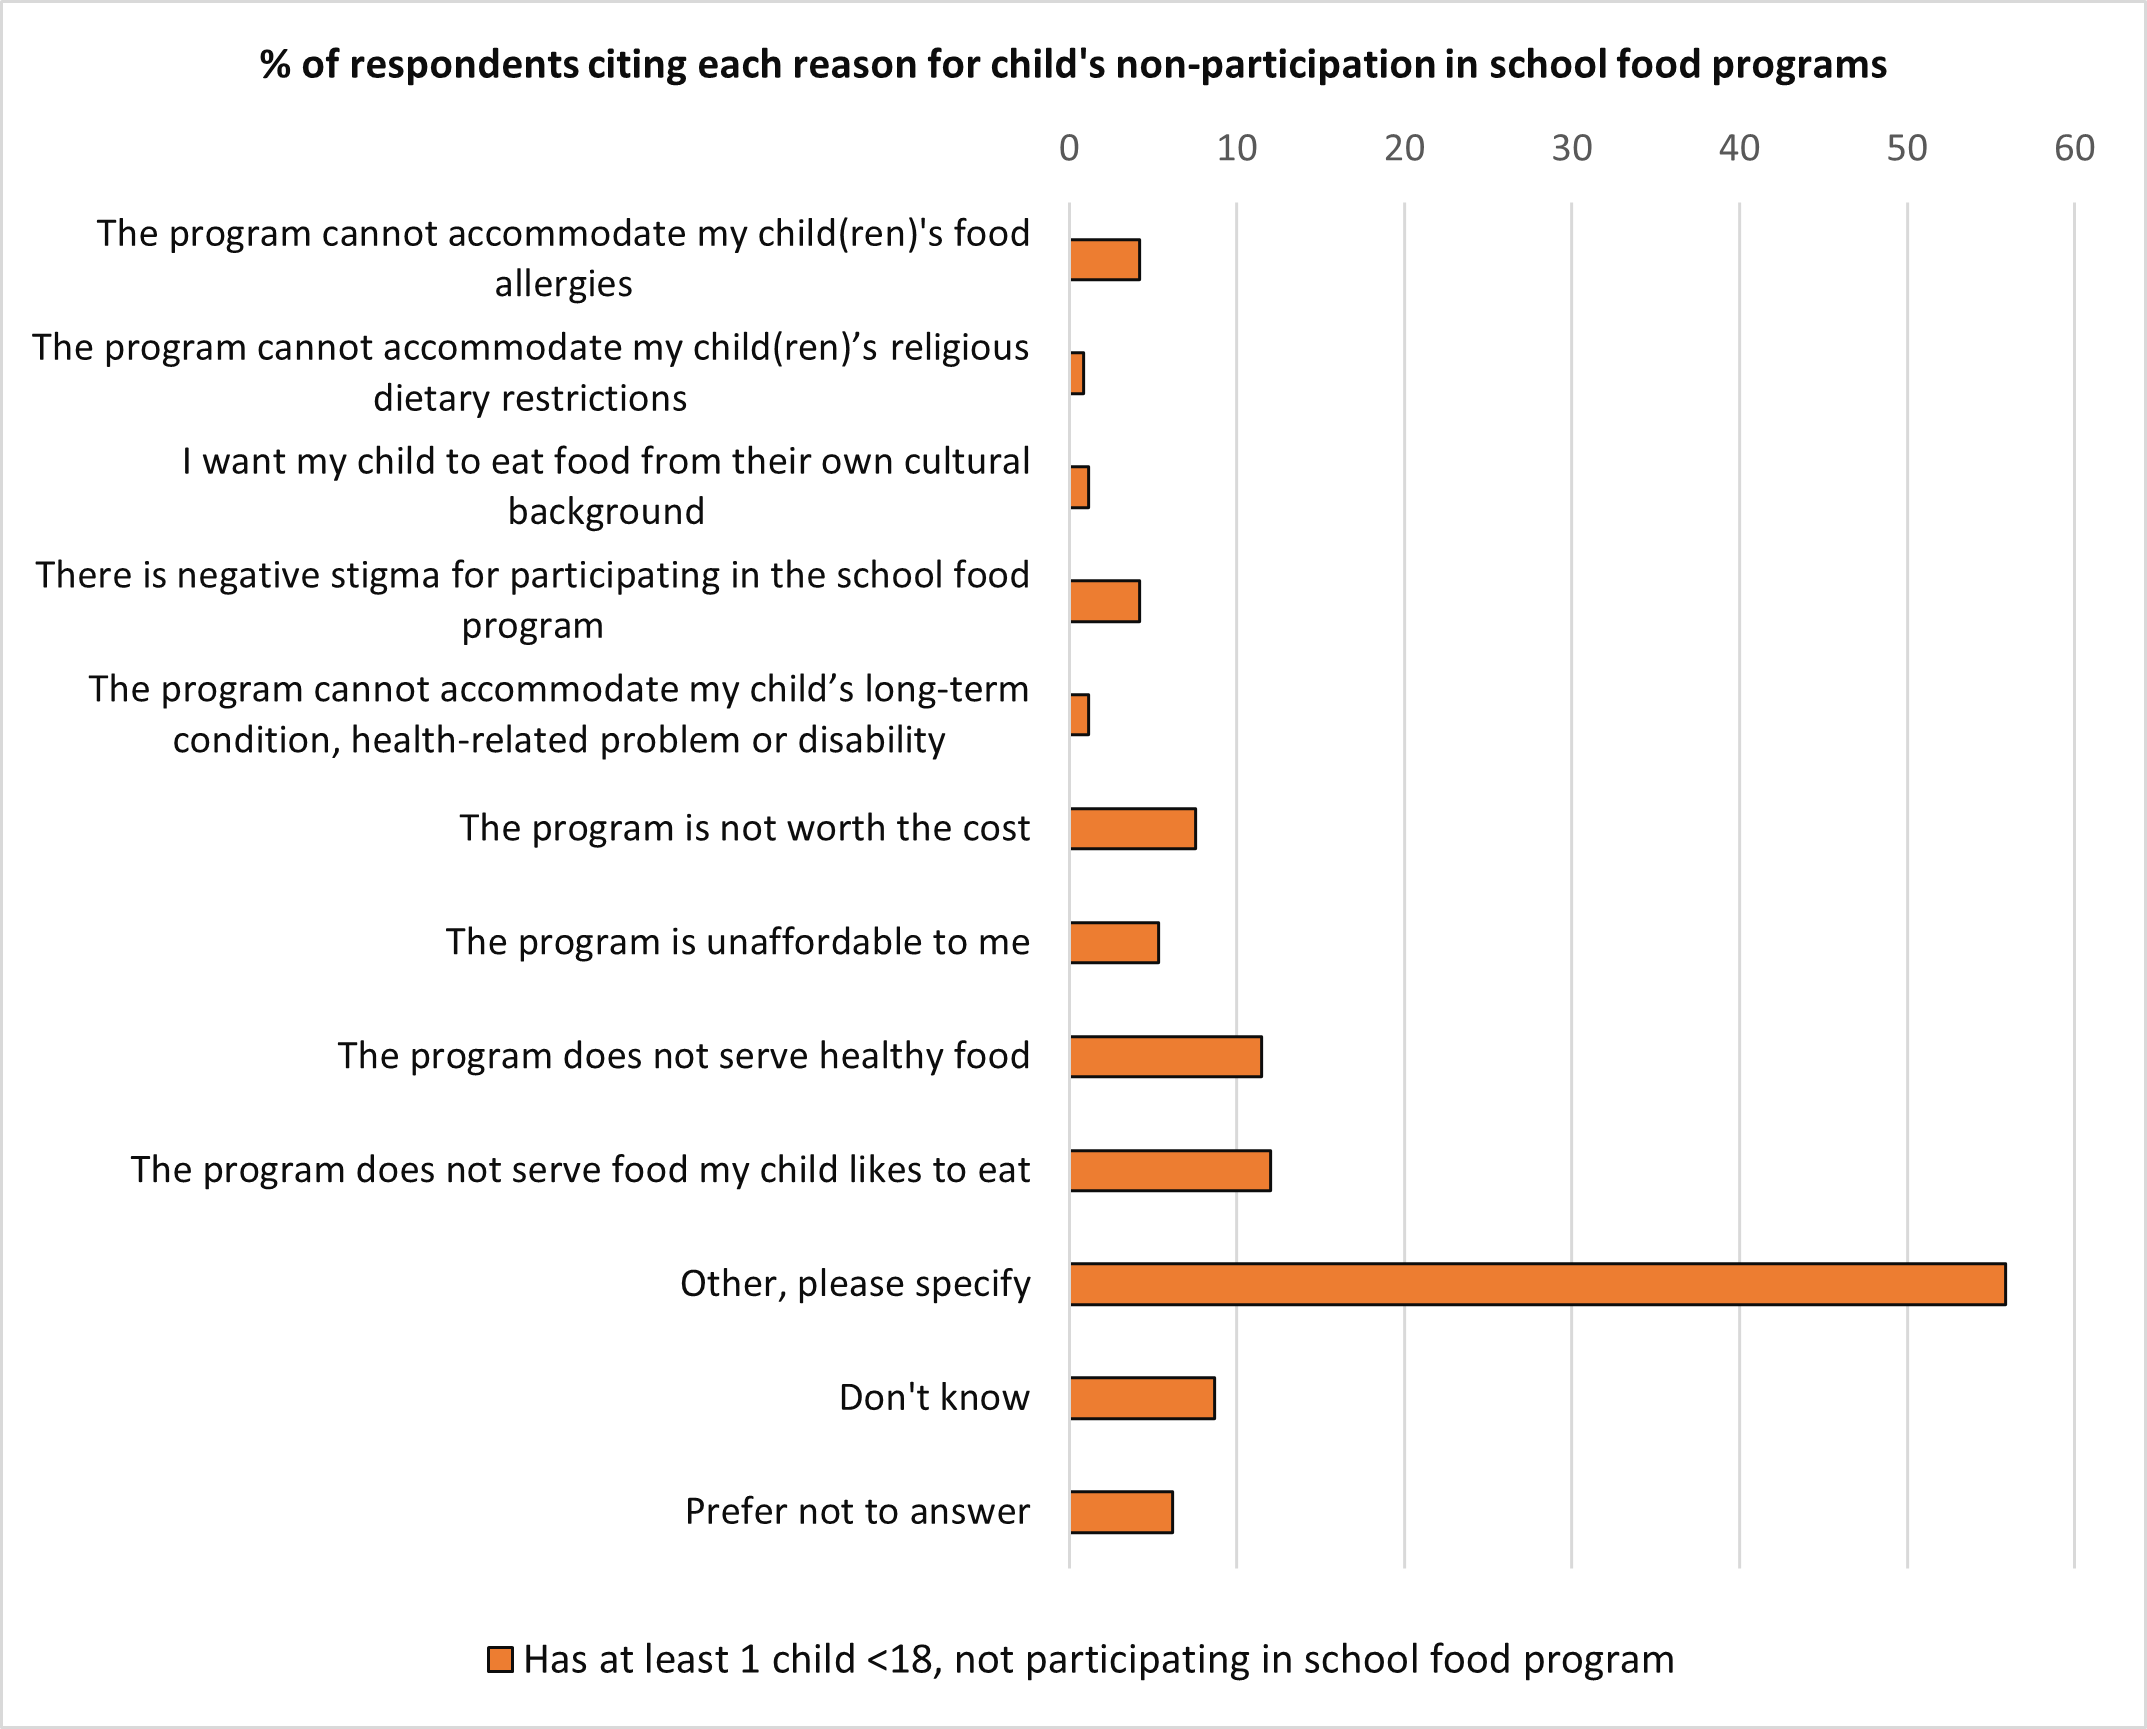
Figure 7 - Text version
| Reason | Has at least one child <18 not participating in school food program |
|---|---|
| The program cannot accommodate my child(ren)’s food allergies | 4.19% |
| The program cannot accommodate my child(ren)’s religious dietary restrictions | 0.84% |
| I want my child to eat food from their own cultural background | 1.12% |
| There is negative stigma for participating in the school food program | 4.19% |
| The program cannot accommodate my child’s long-term condition, health-related problem or disability | 1.12% |
| The program is not worth the cost | 7.54% |
| The program is unaffordable to me | 5.31% |
| The program does not serve healthy food | 11.45% |
| The program does not serve food my child likes to eat | 12.01% |
| Other, please specify | 55.87% |
| Don’t know | 8.66% |
| Prefer not to answer | 6.15% |
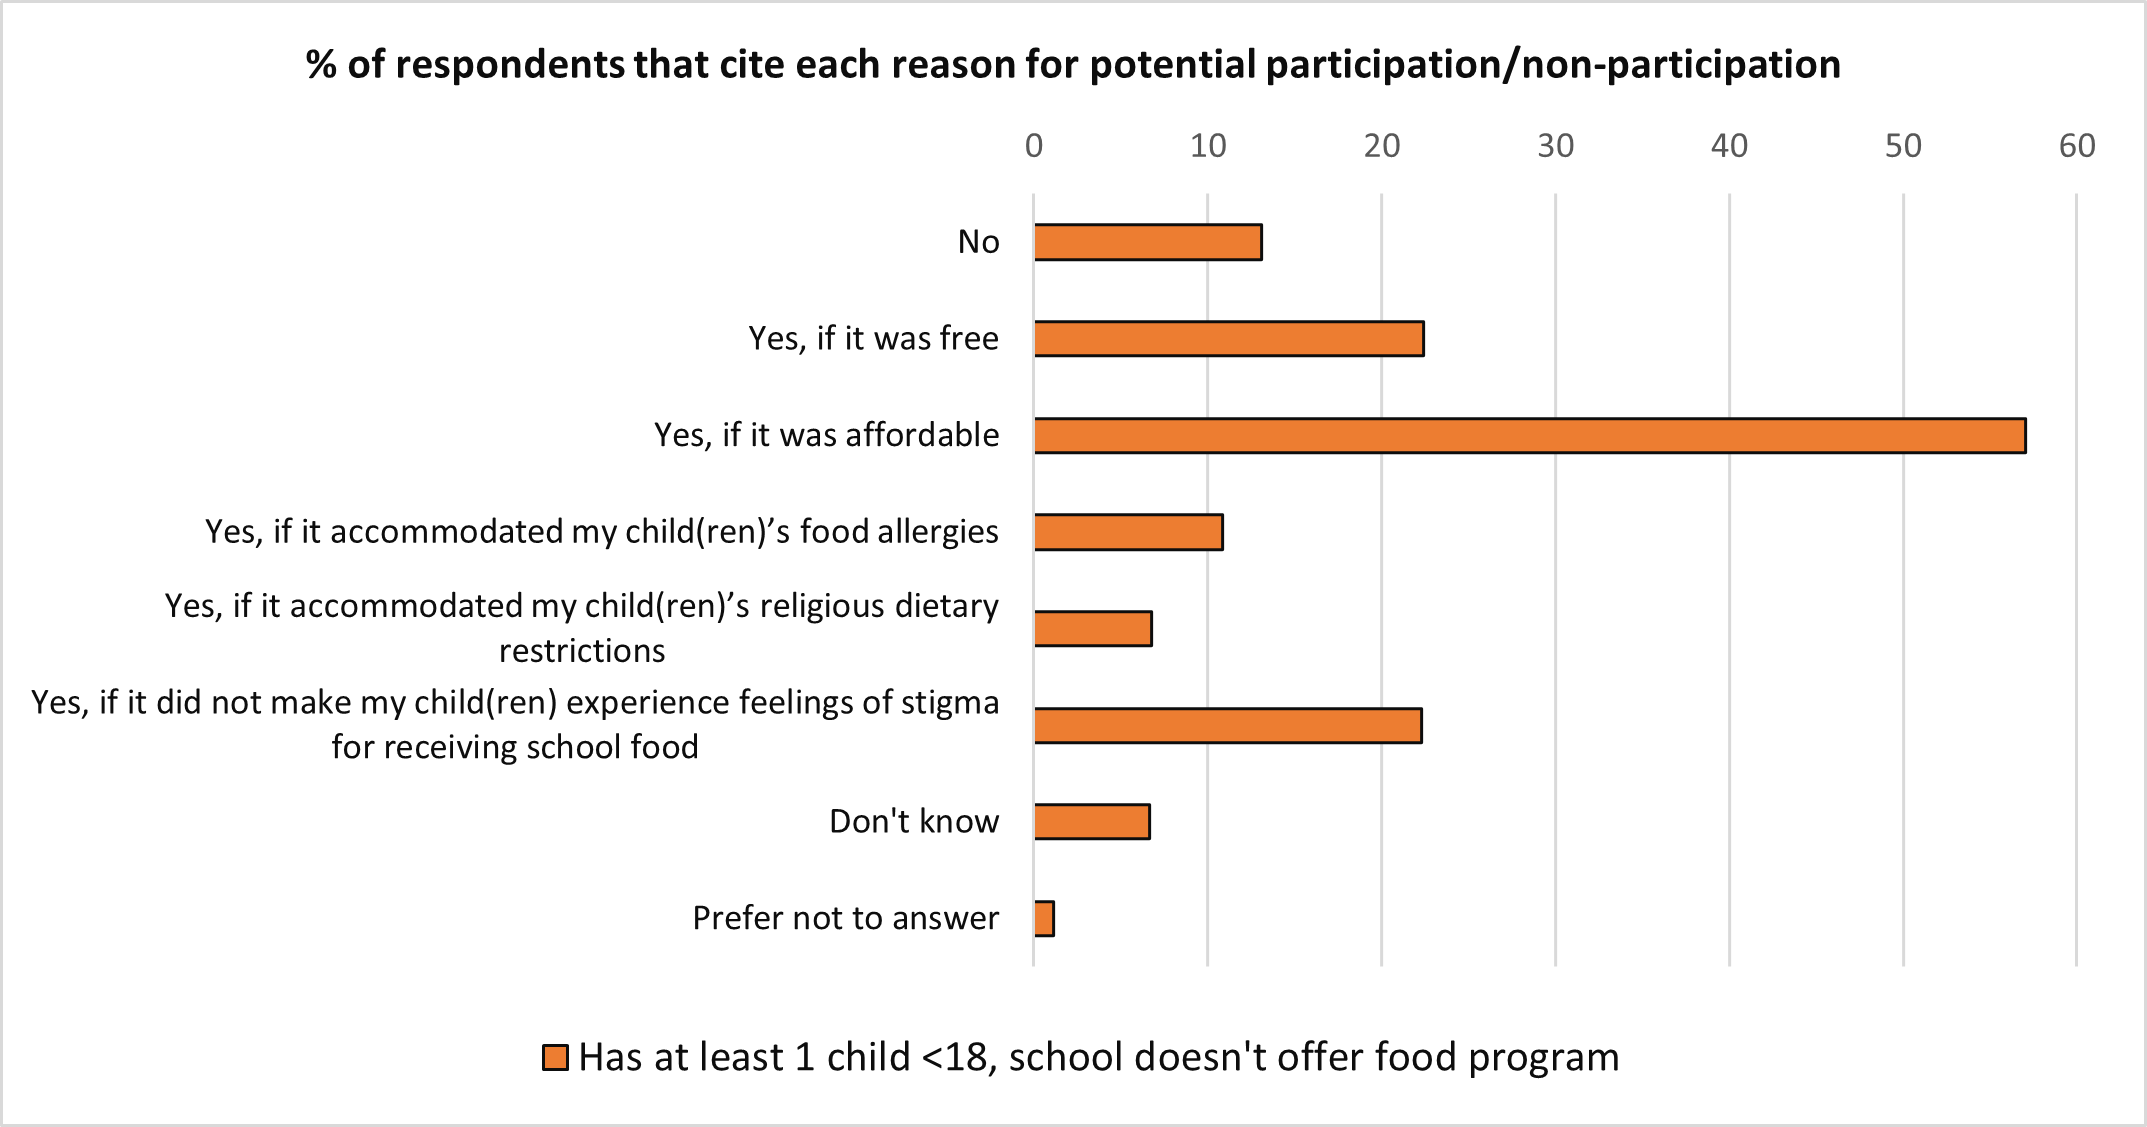
Figure 8 - Text version
| Reason | Has at least one child <18, school doesn’t offer food program |
|---|---|
| No | 13.08% |
| Yes, if it was free | 22.41% |
| Yes, if it was affordable | 57.03% |
| Yes, if it accommodated my child(ren)’s food allergies | 10.83% |
| Yes, if it accommodated my child(ren)’s religious dietary restrictions | 6.74% |
| Yes, if it did not make my child(ren) experience feelings of stigma for receiving school food | 22.29% |
| Don’t know | 6.62% |
| Prefer not to answer | 1.15% |
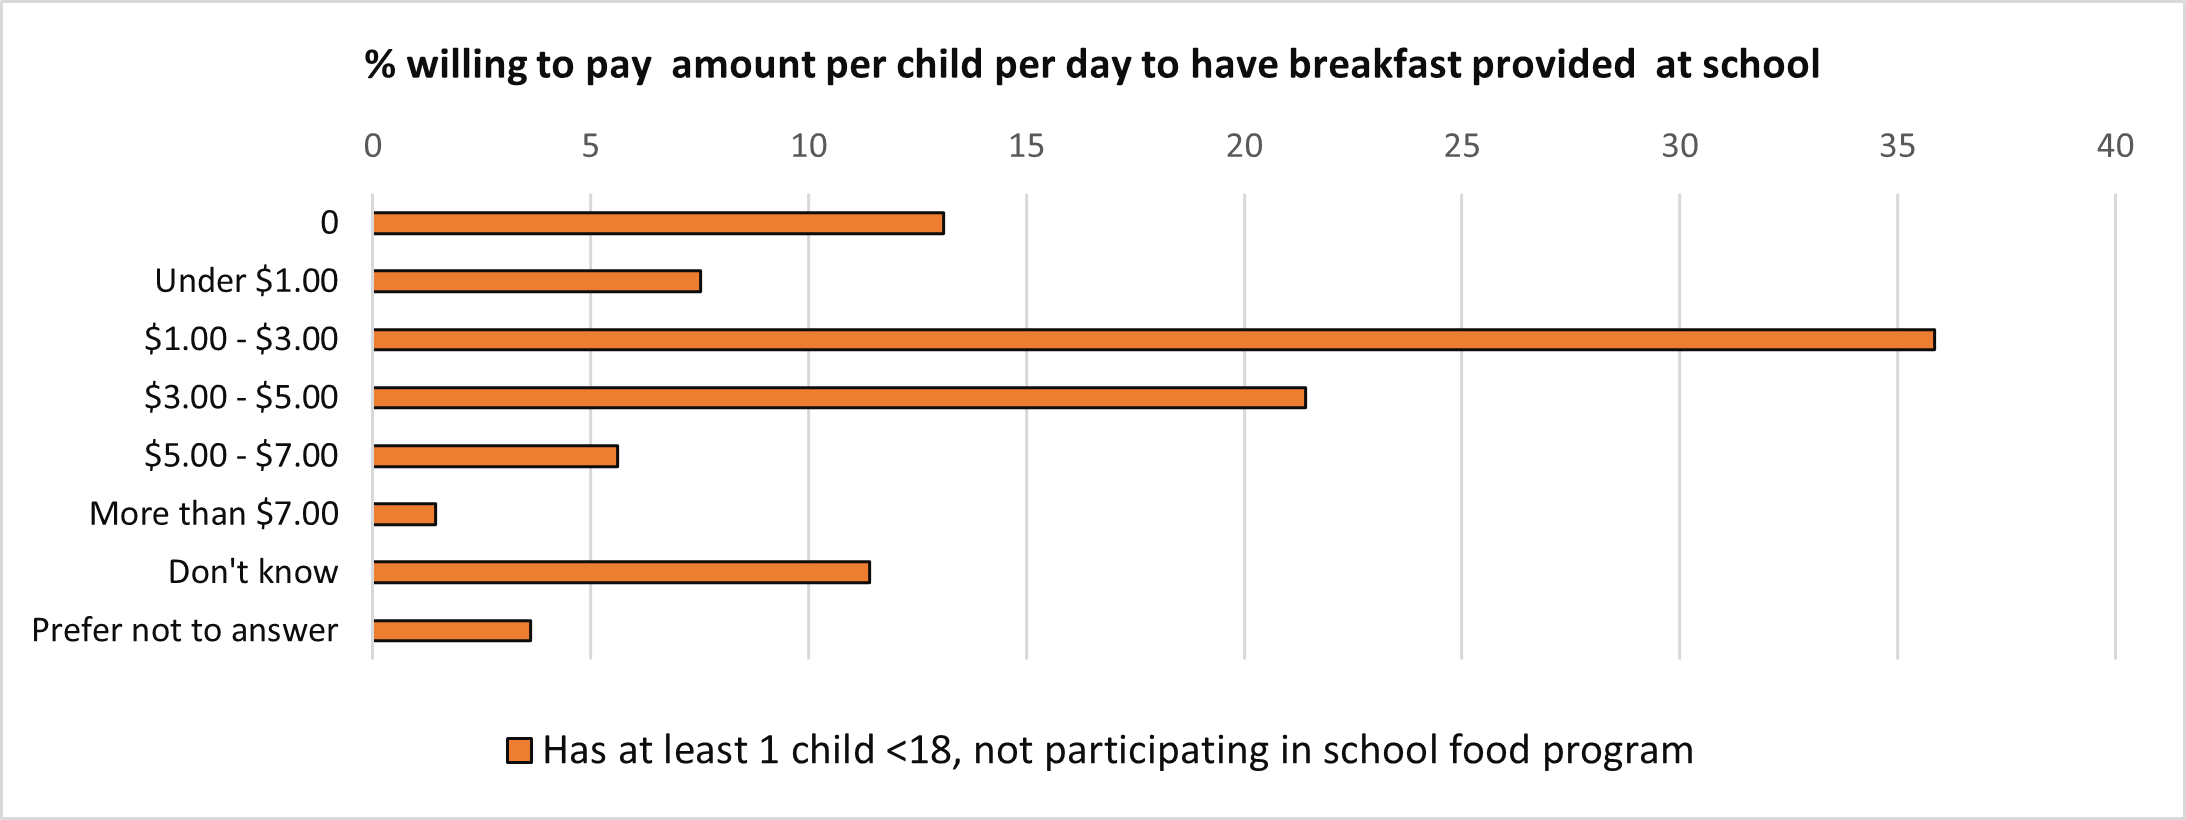
Figure 9 - Text version
| Amount | Has at least one child <18, not participating in school food program |
|---|---|
| 0 | 13.11% |
| Under $1.00 | 7.53% |
| $1.00 - $3.00 | 35.86% |
| $3.00 - $5.00 | 21.41% |
| $5.00 - $7.00 | 5.62% |
| More than $7.00 | 1.44% |
| Don’t know | 11.4% |
| Prefer not to answer | 3.61% |
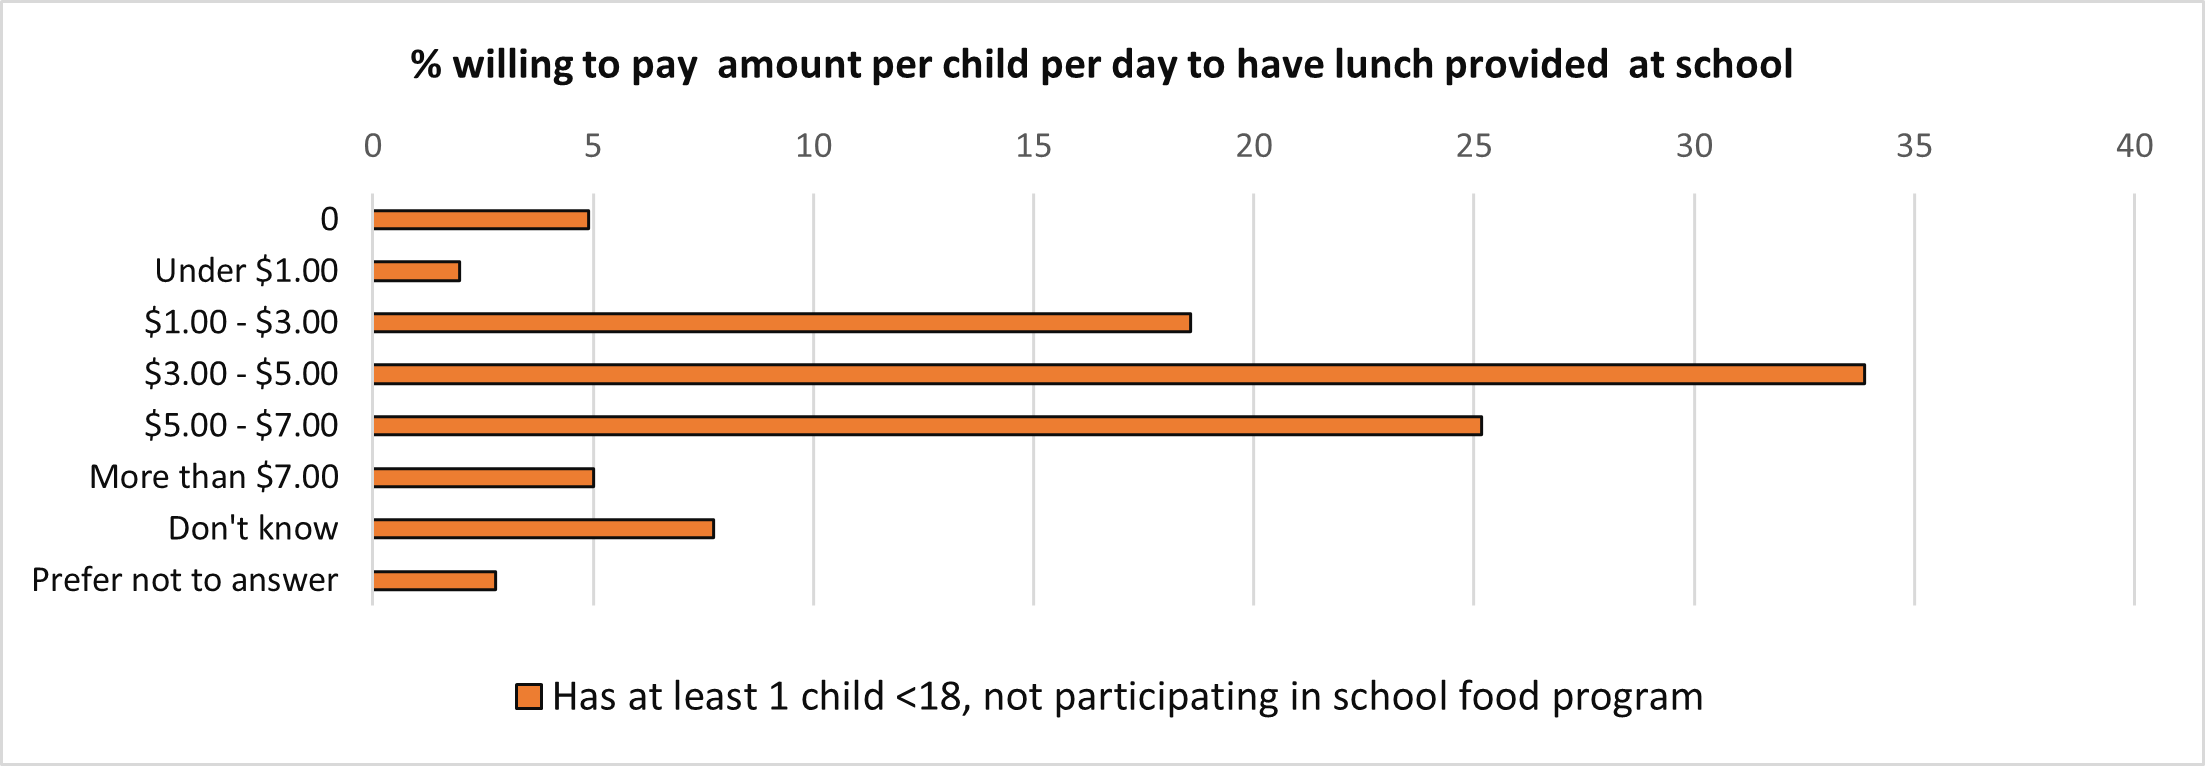
Figure 10 - Text version
| Amount | Has at least one child <18, not participating in school food program |
|---|---|
| 0 | 4.9% |
| Under $1.00 | 1.96% |
| $1.00 - $3.00 | 18.57% |
| $3.00 - $5.00 | 33.88% |
| $5.00 - $7.00 | 25.17% |
| More than $7.00 | 5% |
| Don’t know | 7.74% |
| Prefer not to answer | 2.78% |
Questions asked to school workers
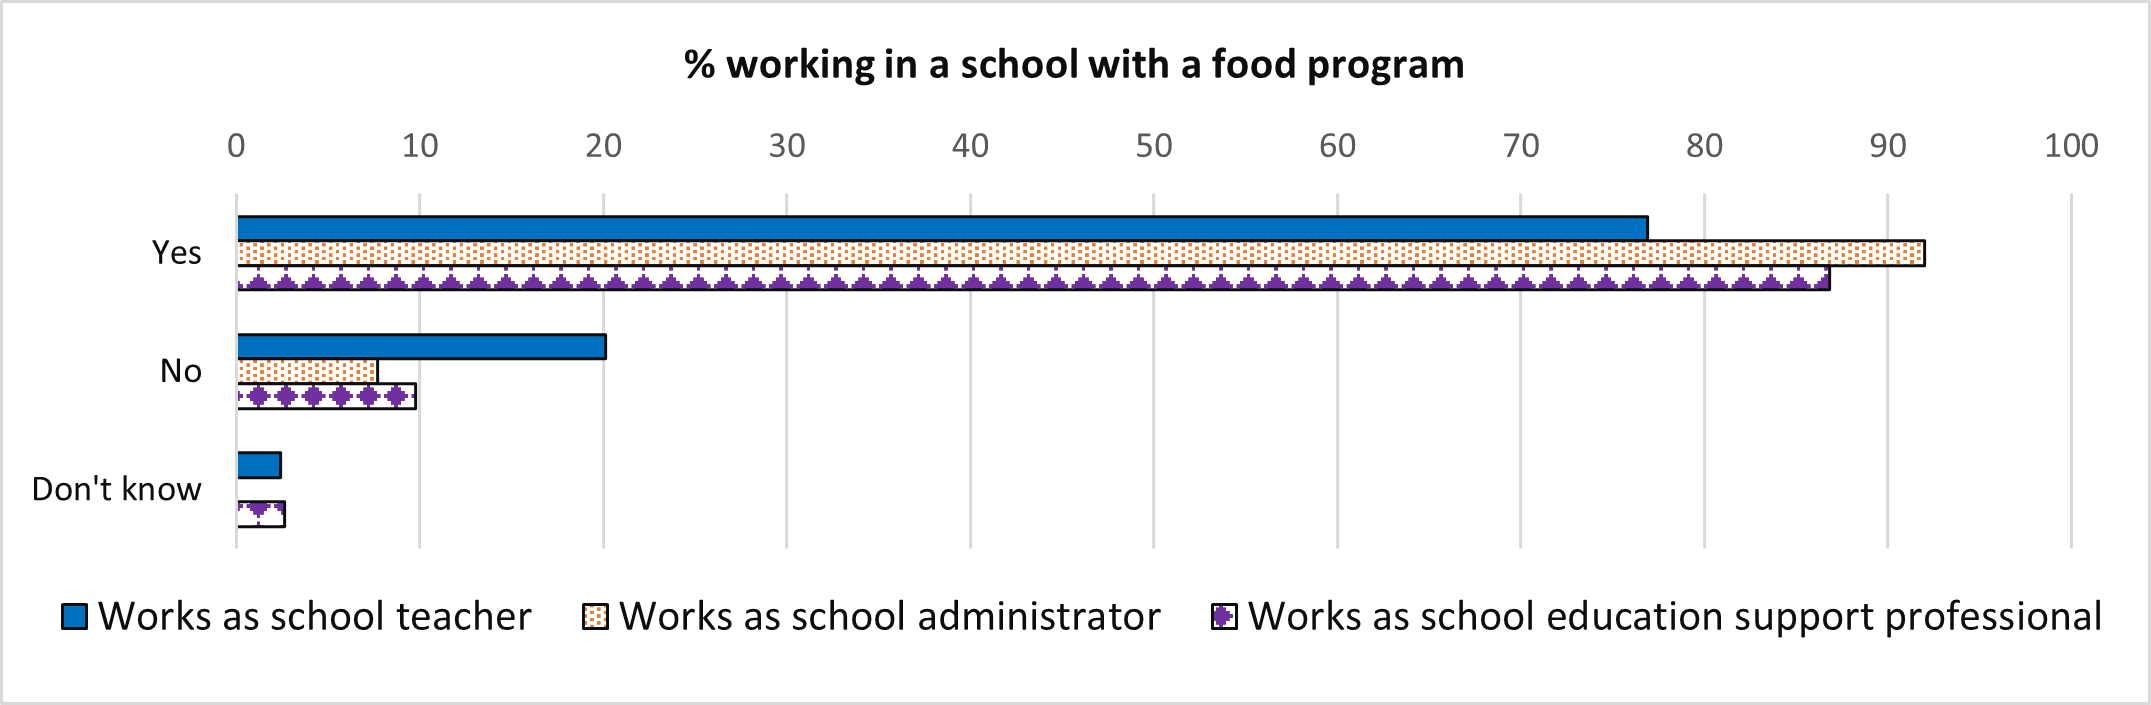
Figure 11 - Text version
| Response | Works as school teacher | Works as school administrator | Works as school education support professional |
|---|---|---|---|
| Yes | 76.89% | 92.01% | 86.81% |
| No | 20.14% | 7.71% | 9.76% |
| Don’t know | 2.43% | 0% | 2.64% |
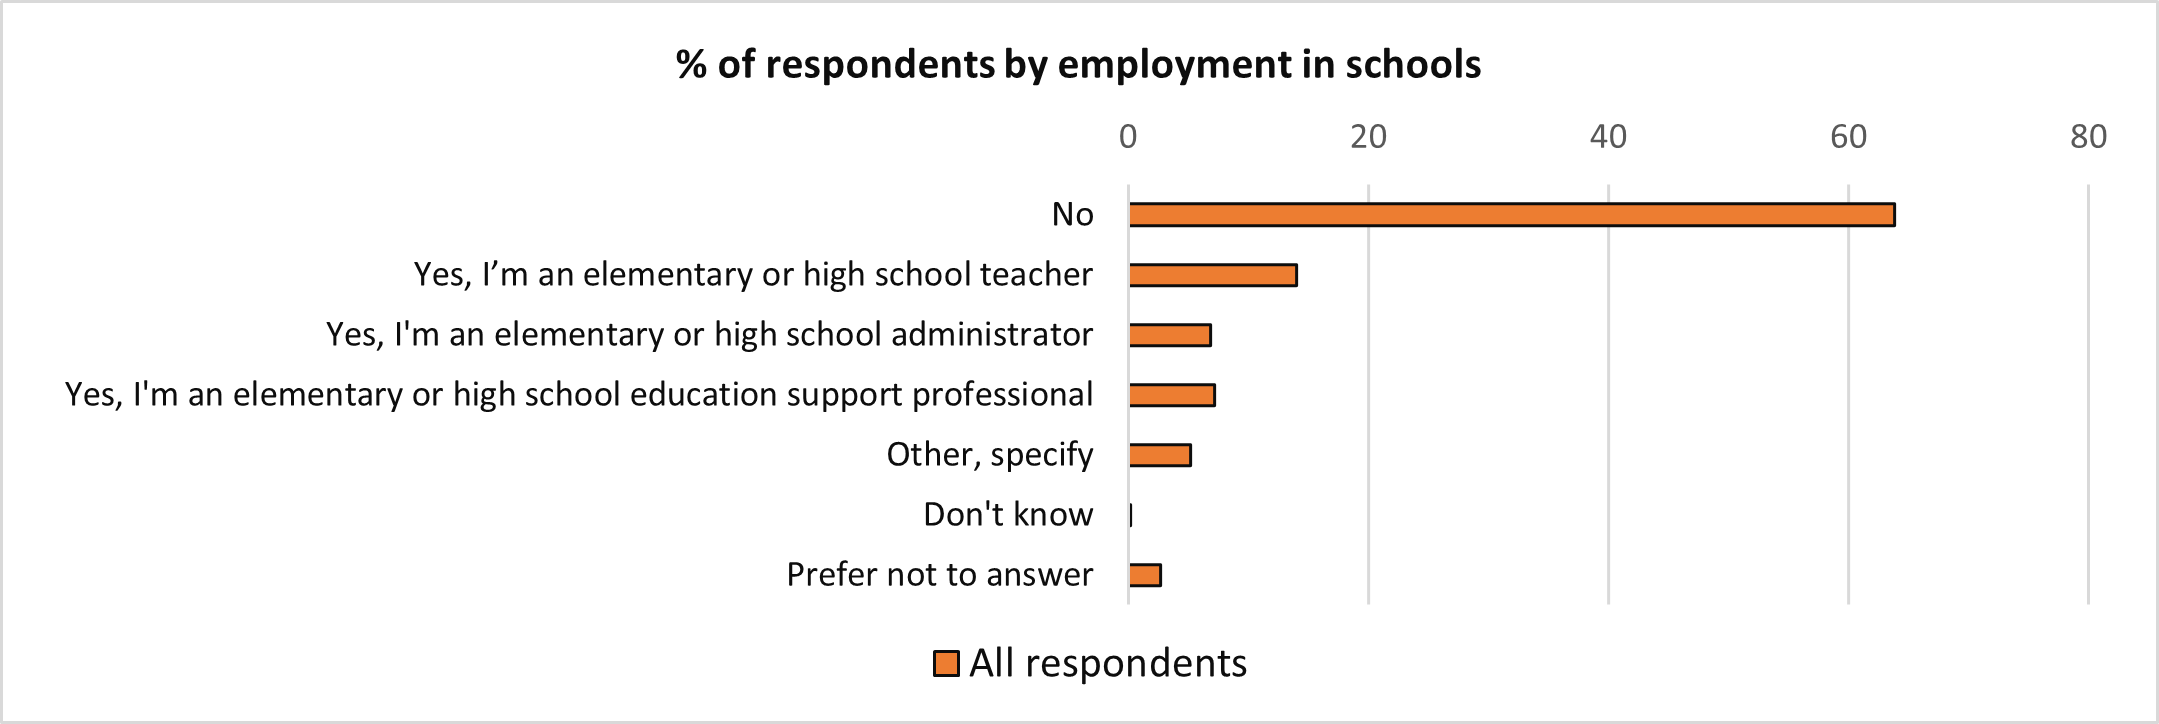
Figure 12 - Text version
| Response | All respondents |
|---|---|
| No | 63.88% |
| Yes, I’m an elementary or high school teacher | 14.01% |
| Yes, I’m an elementary or high school administrator | 6.87% |
| Yes, I’m an elementary or high school education support professional | 7.17% |
| Other, specify | 5.17% |
| Don’t know | 0.21% |
| Prefer not to answer | 2.69% |
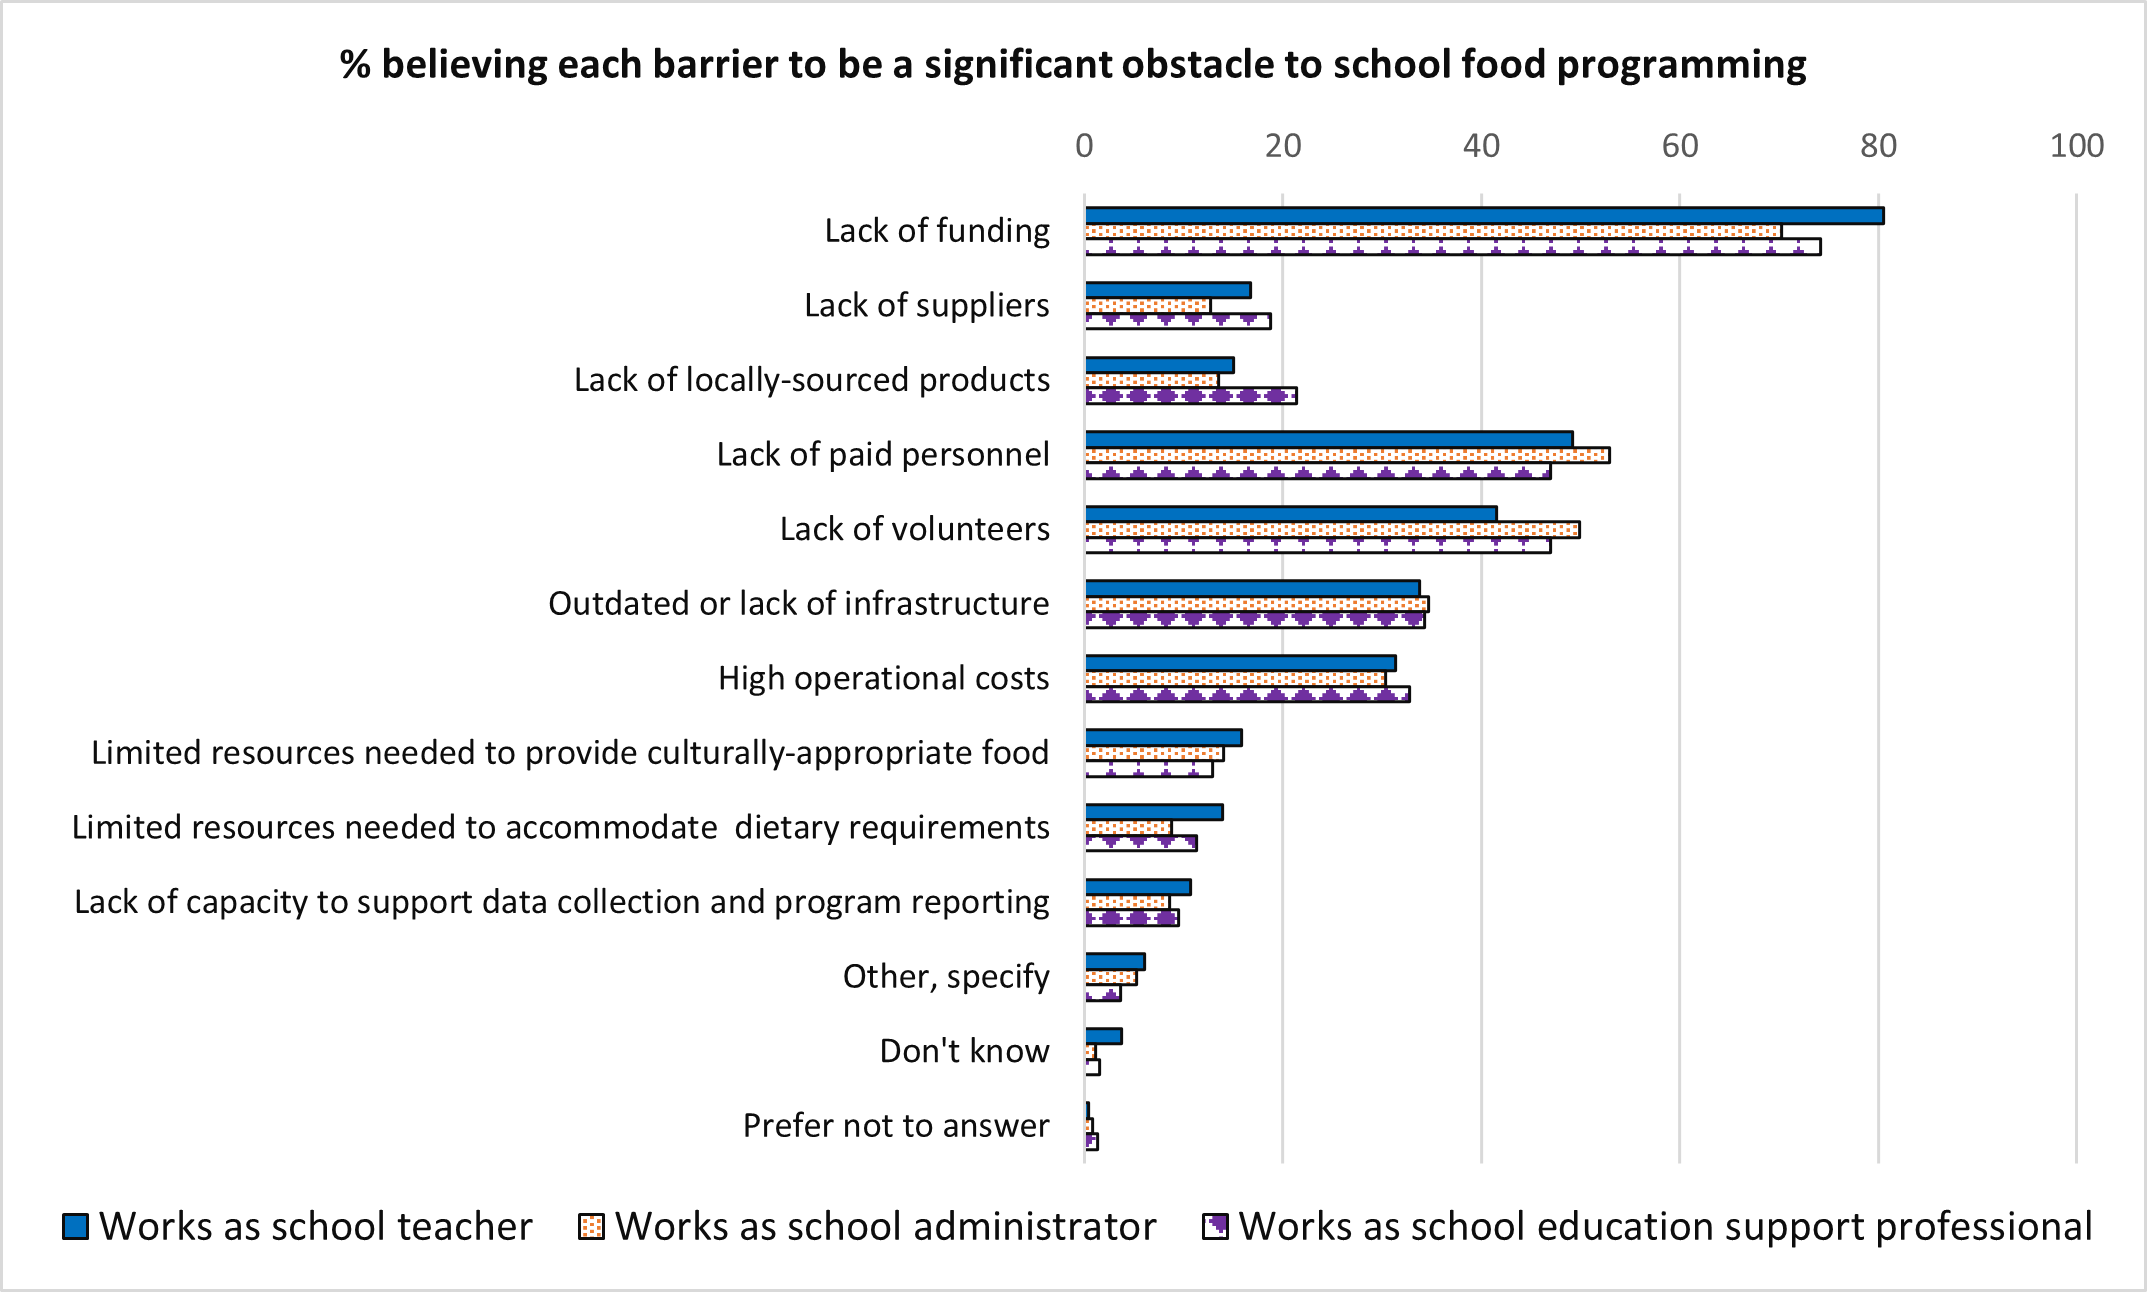
Figure 13 - Text version
| Barrier | Works as school teacher | Works as school administrator | Works as school education support professional |
|---|---|---|---|
| Lack of funding | 80.54% | 70.25% | 74.14% |
| Lack of suppliers | 16.76% | 1.1% | 18.73% |
| Lack of locally-sourced products | 15% | 13.5% | 21.37% |
| Lack of paid personnel | 49.19% | 52.89% | 46.97% |
| Lack of volunteers | 41.49% | 49.86% | 46.97% |
| Outdated or lack of infrastructure (for example: kitchens, equipment) | 33.78% | 34.71% | 34.3% |
| High operational costs | 31.35% | 30.3% | 32.72% |
| Limited experience / resources needed to provide culturally-appropriate food | 15.81% | 14.05% | 12.93% |
| Limited experience / resources needed to accommodate various dietary requirements | 13.92% | 8.82% | 11.35% |
| Lack of capacity to support data collection and reporting on programs | 10.68% | 8.54% | 9.5% |
| Other, specify | 6.08% | 5.23% | 3.69% |
| Don’t know | 3.78% | 1.1% | 1.58% |
| Prefer not to answer | 0.41% | 0.83% | 1.32% |
Questions asked to service delivery organizations
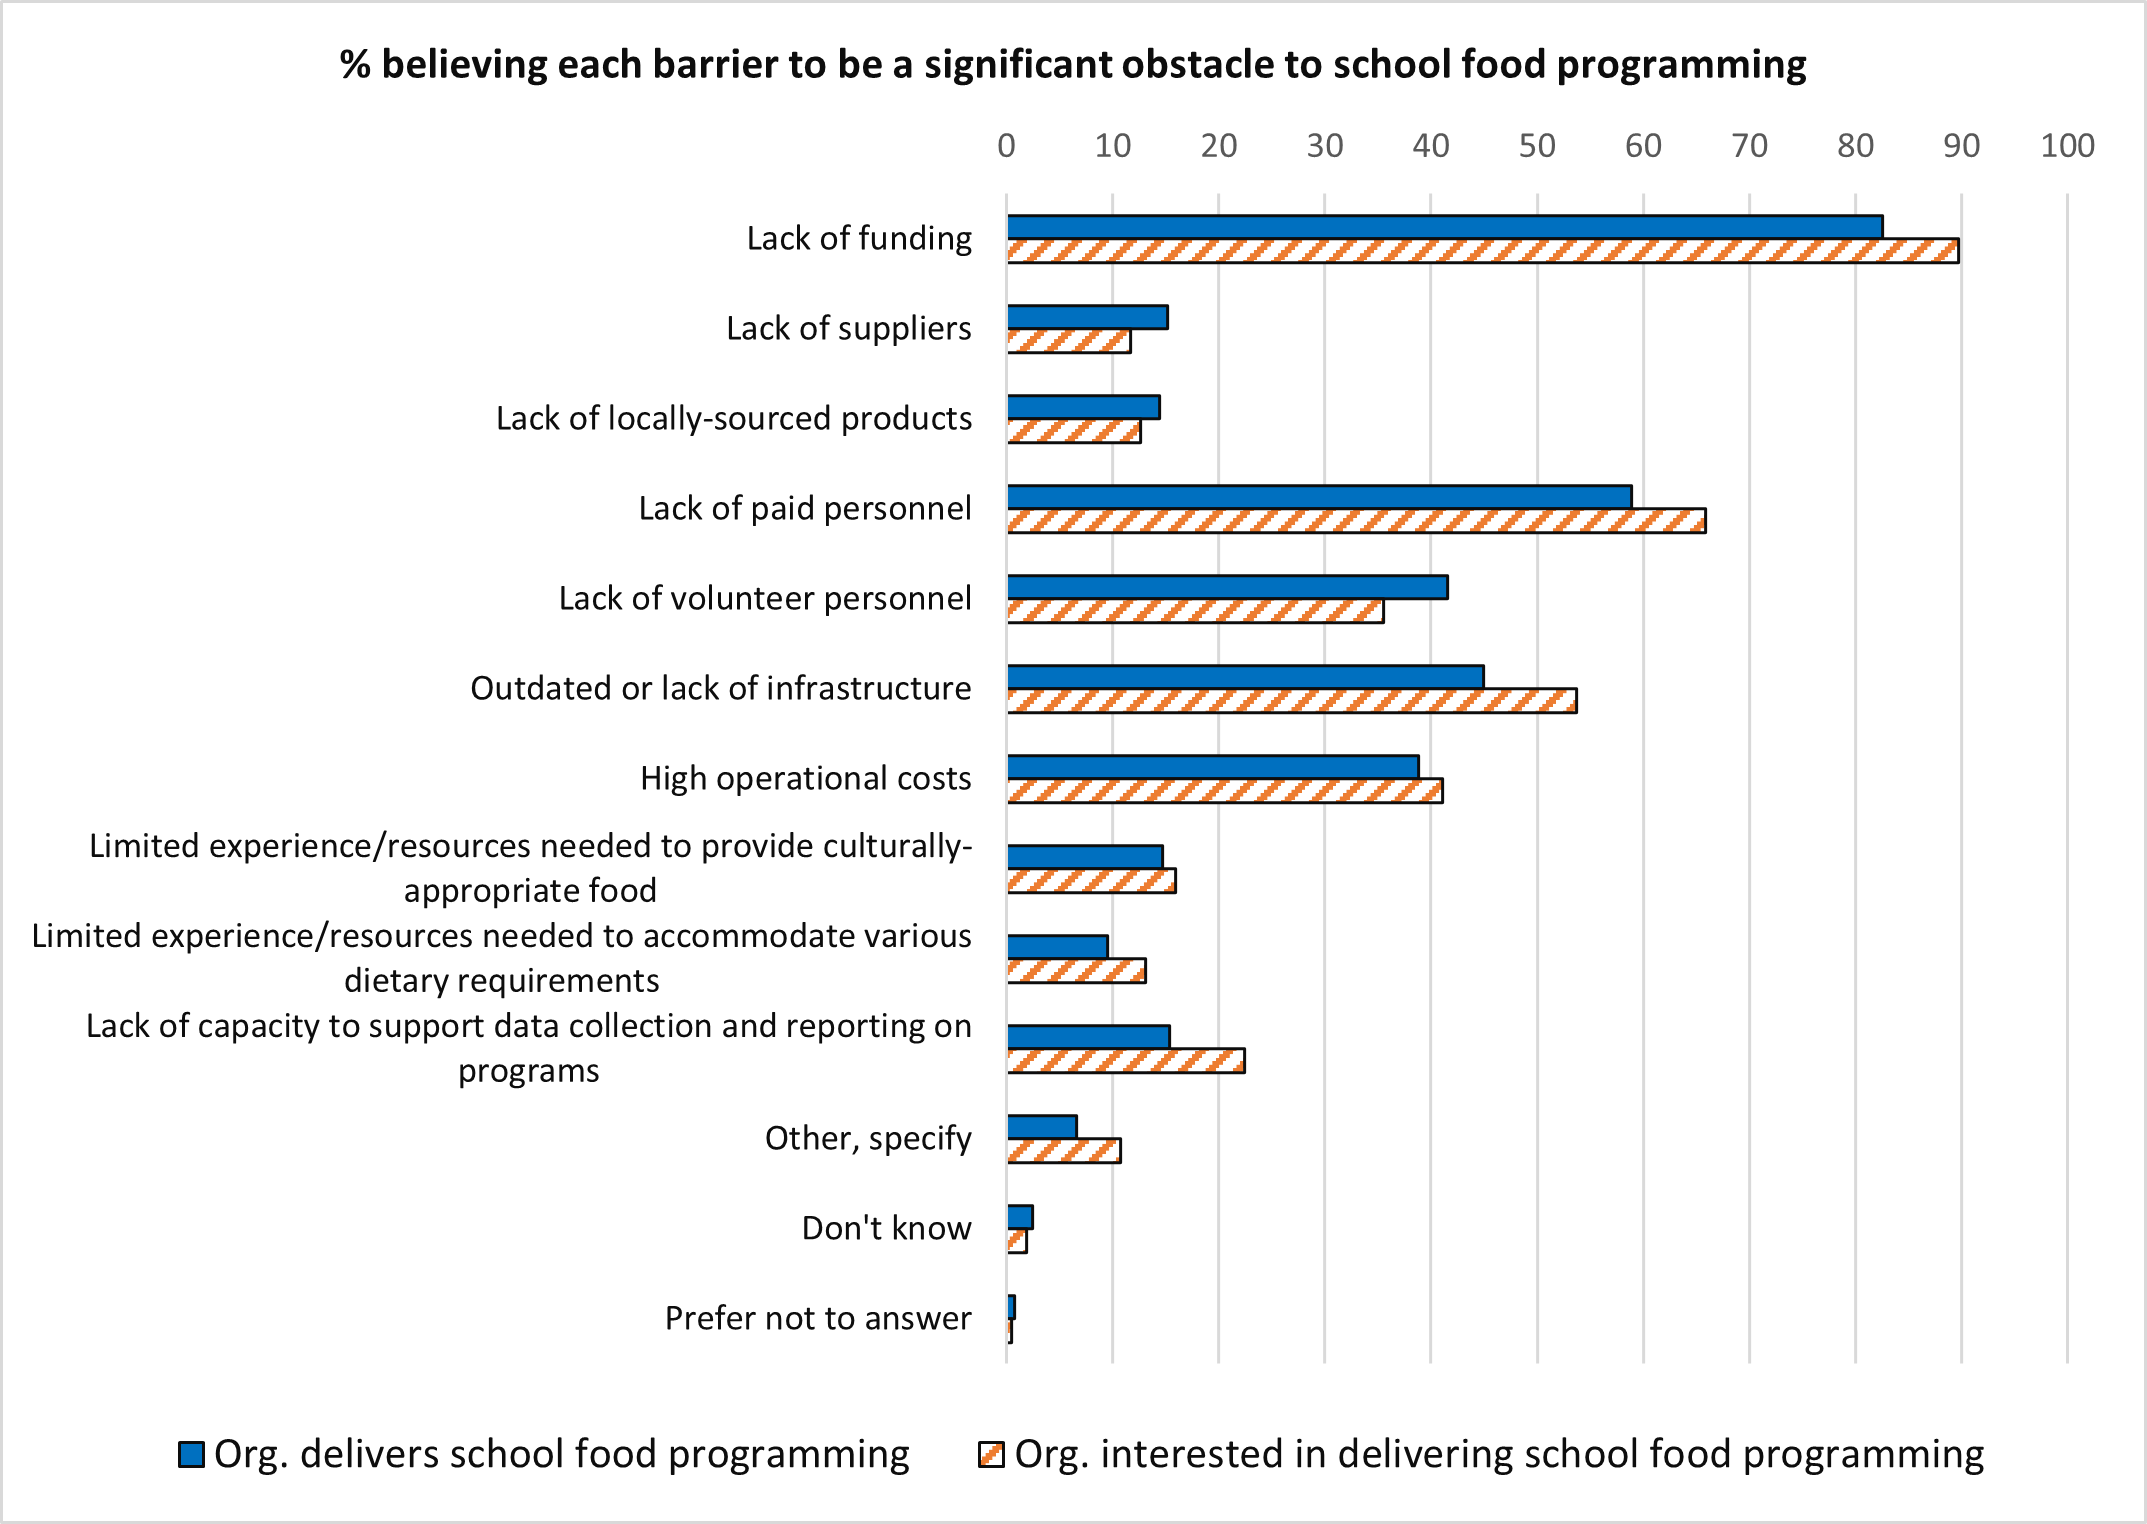
Figure 14 - Text version
| Barrier | Organisation delivers school food programming | Organisation interested in delivering school food programming |
|---|---|---|
| Lack of funding | 82.52% | 89.72% |
| Lack of suppliers | 15.21% | 11.68% |
| Lack of locally-sourced products | 14.4% | 12.62% |
| Lack of paid personnel | 58.9% | 65.89% |
| Lack of volunteer personnel | 41.59% | 35.51% |
| Outdated or lack of infrastructure (for example: kitchen equipment) | 44.98% | 53.74% |
| High operational costs | 38.83% | 41.12% |
| Limited experience / resources needed to provide culturally-appropriate food | 14.72% | 15.89% |
| Limited experience / resources needed to accommodate various dietary requirements | 9.55% | 13.08% |
| Lack of capacity to support data collection and reporting on programs | 15.37% | 22.43% |
| Other, specify | 6.63% | 10.75% |
| Don’t know | 2.43% | 1.87% |
| Prefer not to answer | 0.81% | 0.47% |
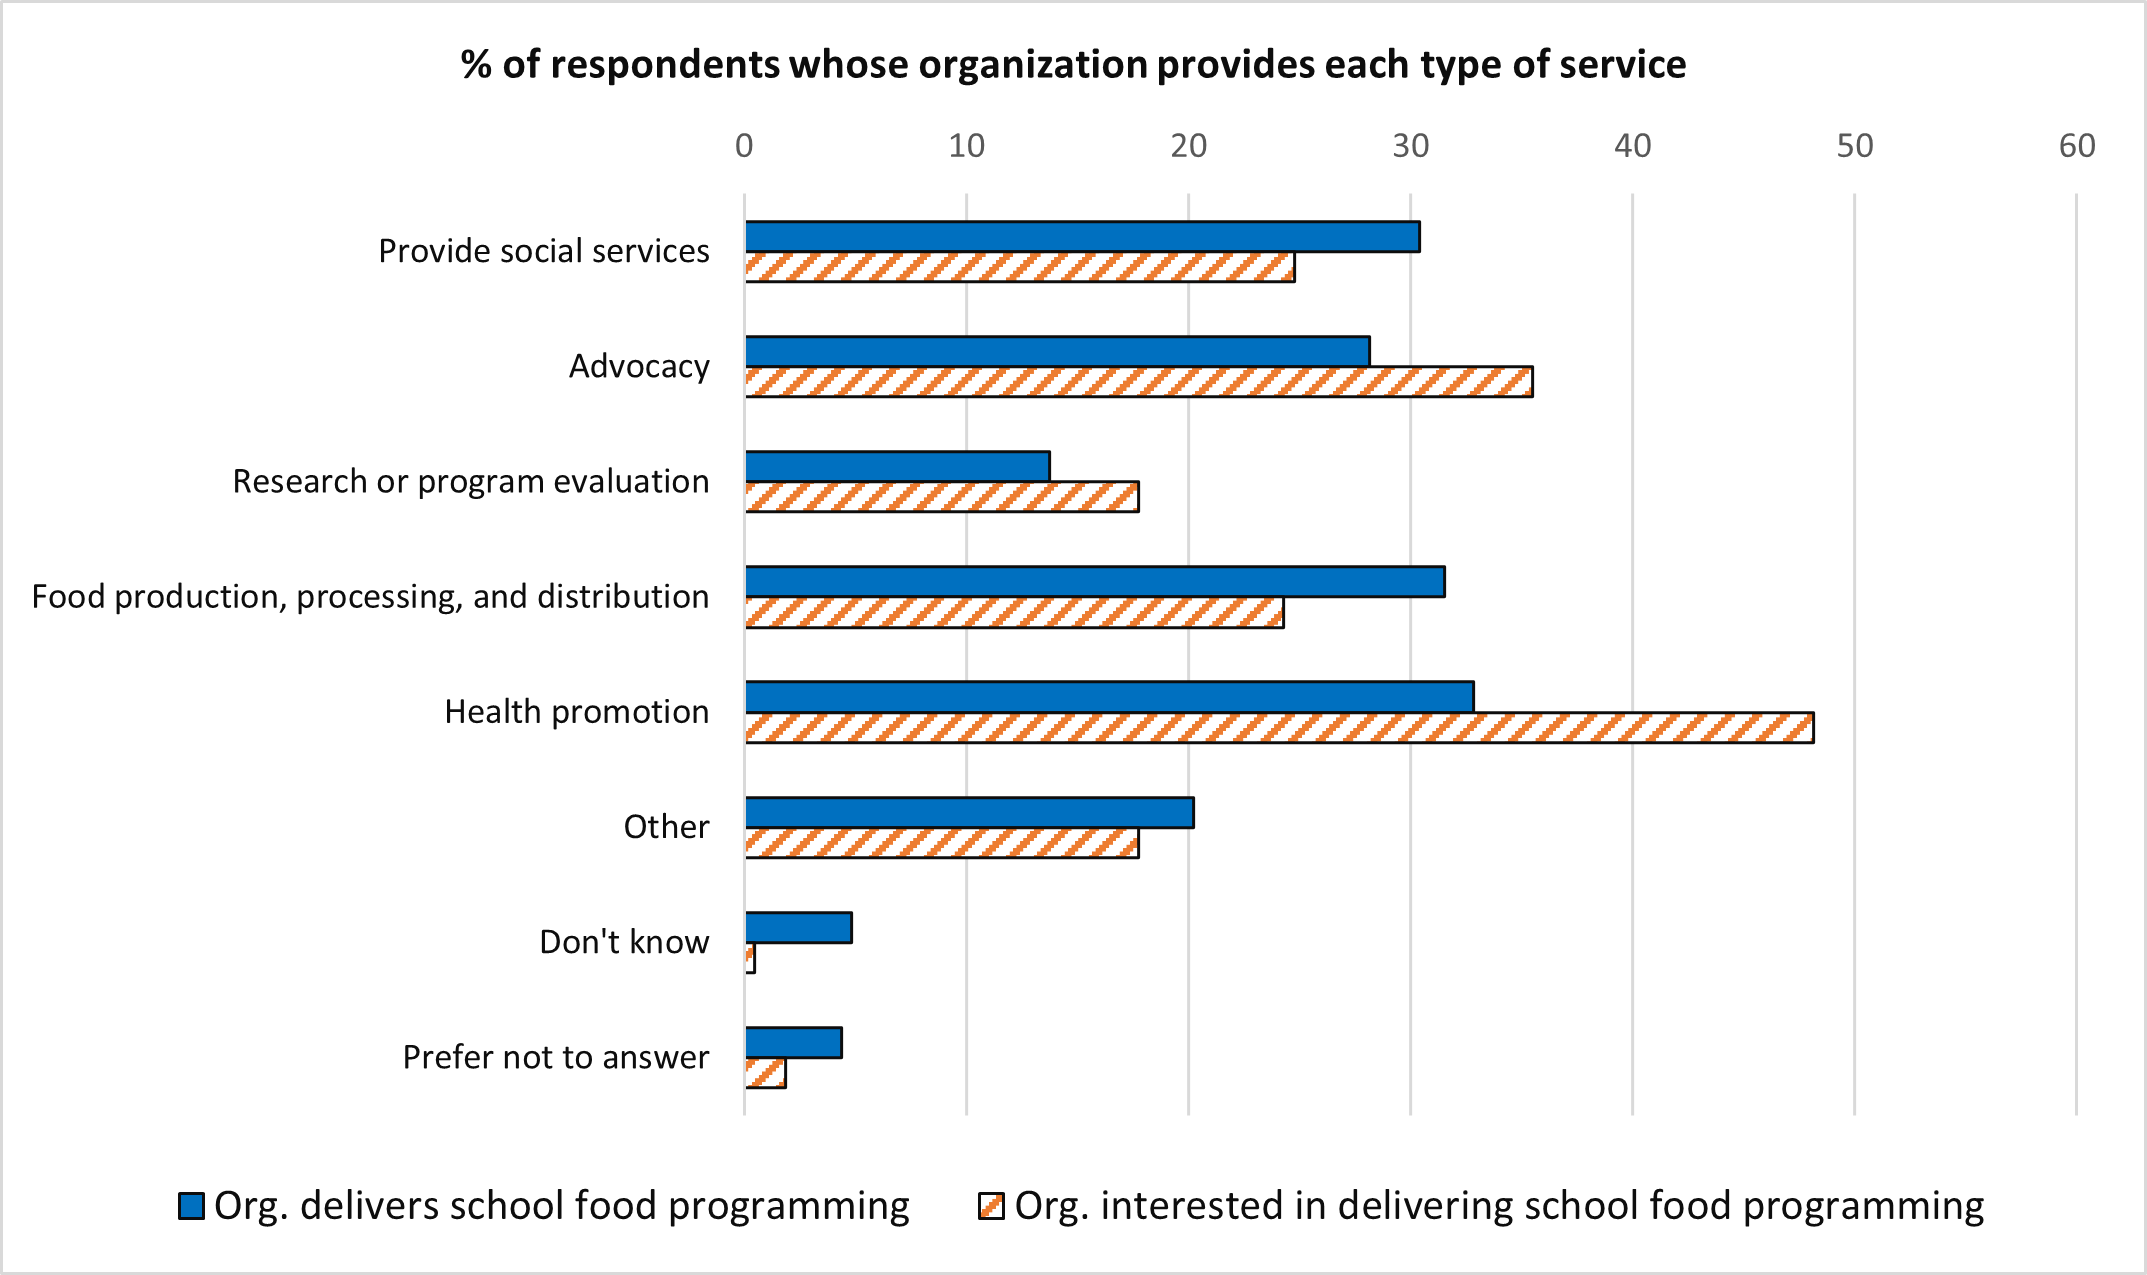
Figure 15 - Text version
| Service | Organisation delivers school food programming | Organisation interested in delivering school food programming |
|---|---|---|
| Provide social services | 30.42% | 24.77% |
| Advocacy | 28.16% | 35.51% |
| Research or program evaluation | 13.75% | 17.76% |
| Food production, processing, and distribution | 31.55% | 24.3% |
| Health promotion | 32.85% | 48.13% |
| Other | 20.23% | 17.76% |
| Don’t know | 4.85% | 0.47% |
| Prefer not to answer | 4.37% | 1.87% |
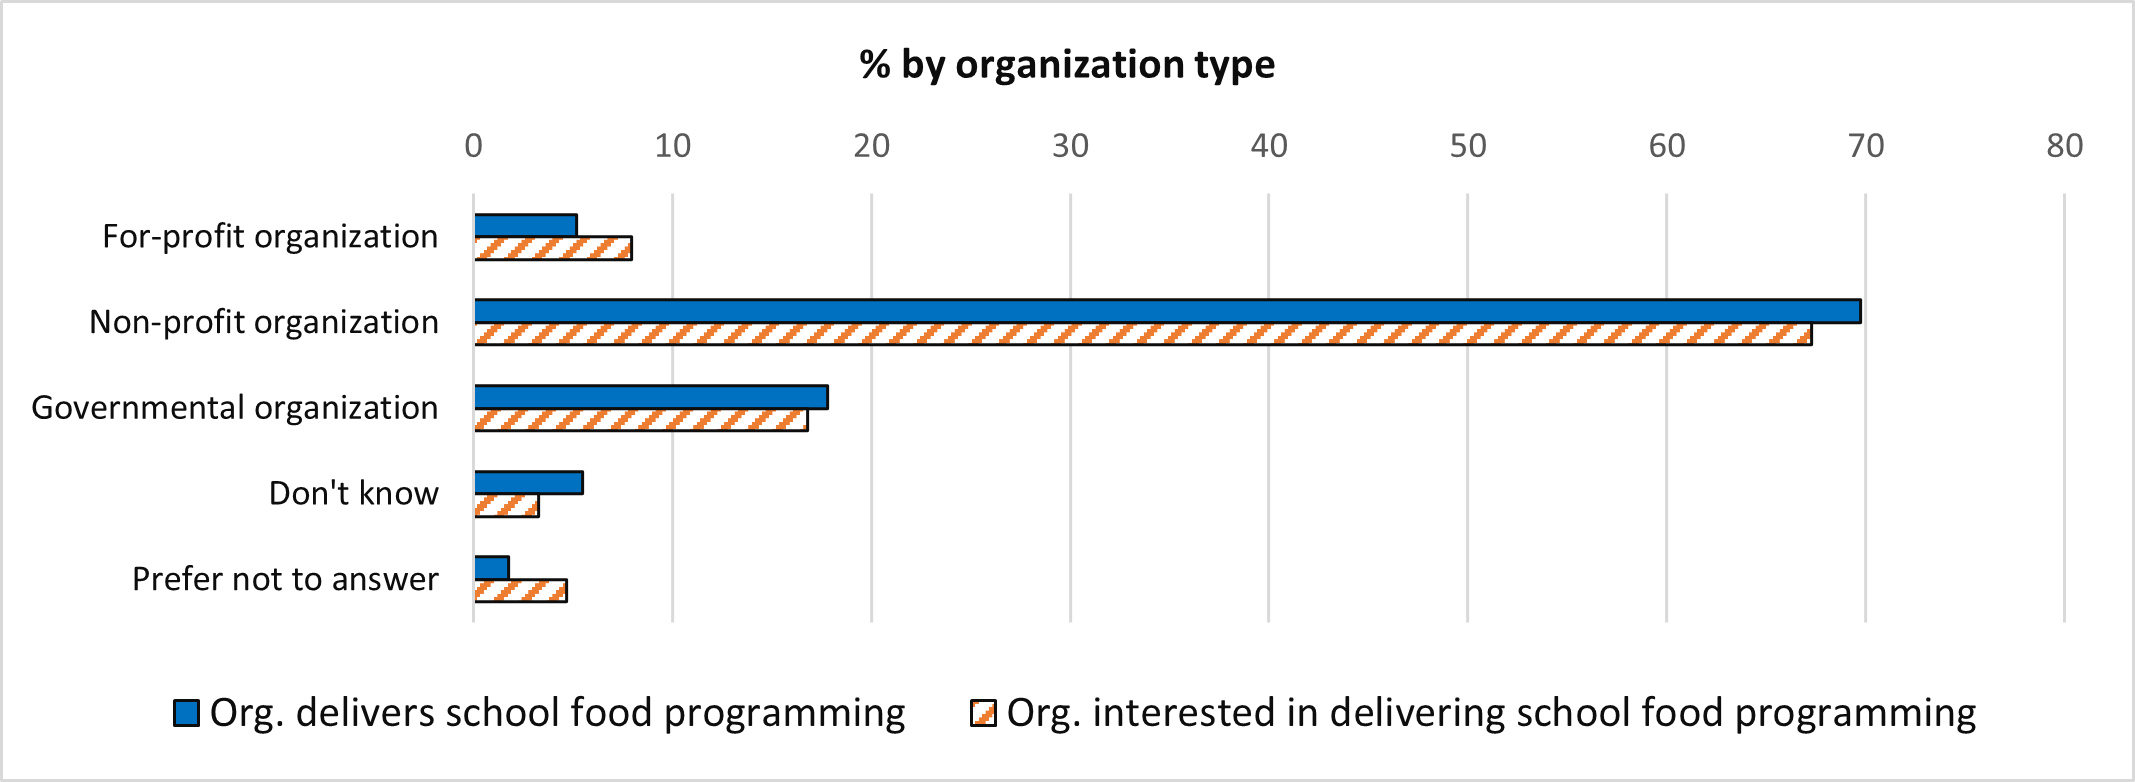
Figure 16 - Text version
| Type | Organisation delivers school food programming | Organisation interested in delivering school food programming |
|---|---|---|
| For-profit organization | 5.18% | 7.94% |
| Non-profit organization | 69.74% | 67.29% |
| Governmental organization | 17.8% | 16.82% |
| Don’t know | 5.5% | 3.27% |
| Prefer not to answer | 1.78% | 4.67% |
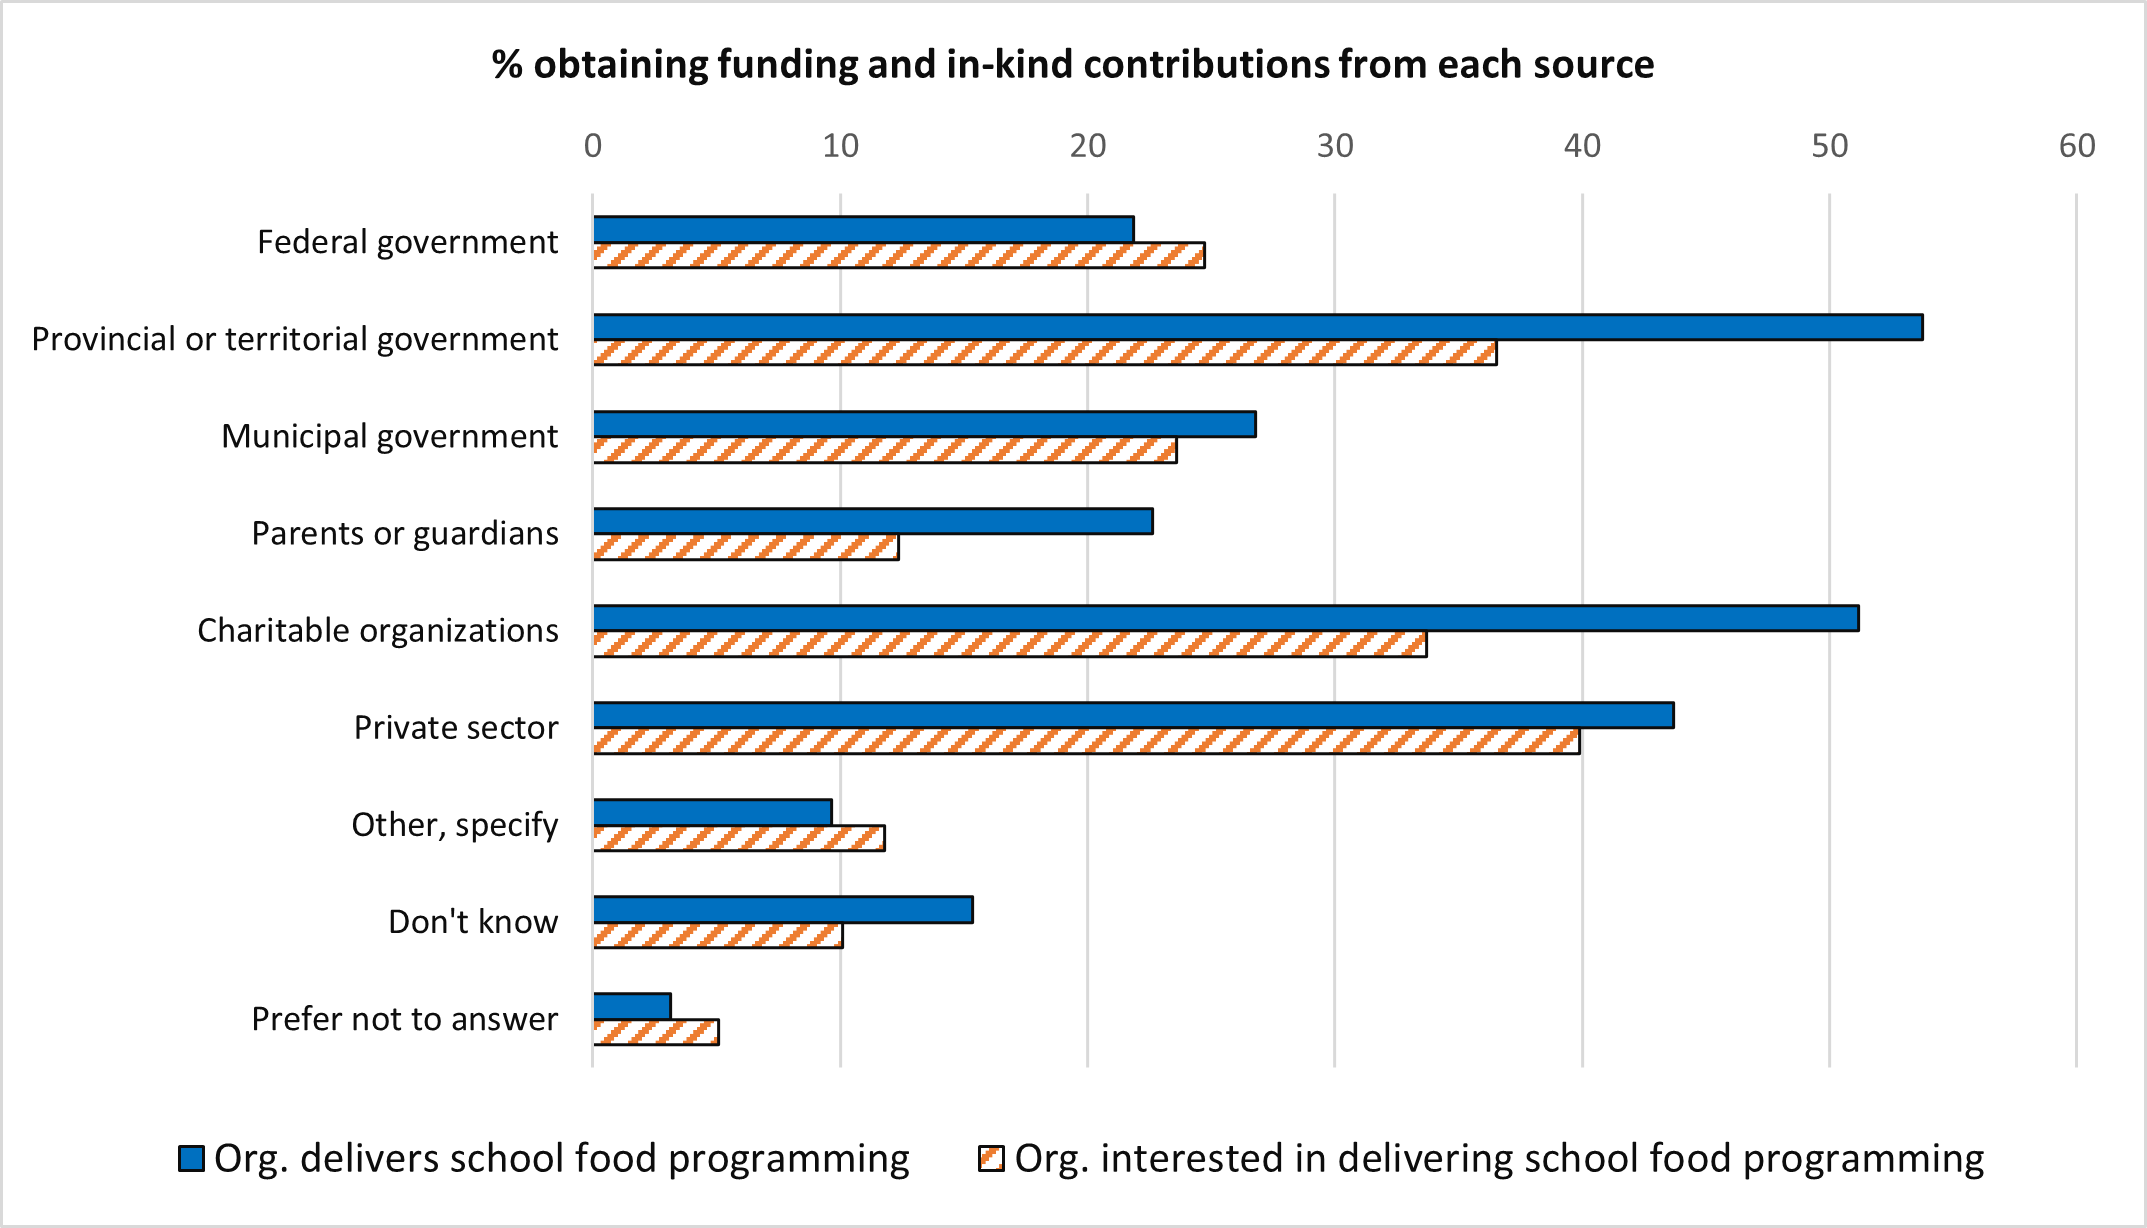
Figure 17 - Text version
| Source | Organisation delivers school food programming | Organisation interested in delivering school food programming |
|---|---|---|
| Federal government | 21.85% | 24.72% |
| Provincial or territorial government | 53.74% | 36.52% |
| Municipal government | 26.77% | 23.6% |
| Parents or guardians | 22.64% | 12.36% |
| Charitable organizations | 51.18% | 33.71% |
| Private sector | 43.7% | 39.89% |
| Other, specify | 9.65% | 11.8% |
| Don’t know | 15.35% | 10.11% |
| Prefer not to answer | 3.15% | 5.06% |