
Social Finance Fund results and updates
The Social Finance Fund (SFF) is contributing to accelerate the growth of the social finance market. The SFF is focused on making it easier for charities, non-profits, social enterprises, cooperatives, and other social purpose organizations to access flexible financing. By providing more financing opportunities, the SFF helps these organizations grow, innovate, and increase their social and environmental impacts. This, in turn, supports more inclusive economic development in communities across Canada.
This page highlights the progress of the SFF so far, including data on investments made under the SFF and updates on other initiatives that support the fund. Key highlights (as of December 31, 2024):
- Fund managers (i.e., wholesalers) reported that their SFF investments have helped leverage over $322 million in private (non-government) funding to social finance investments.
- Wholesalers have committed to investments in 34 different Social Finance Intermediaries (SFIs) and one direct investment in a Social Purpose Organization (SPO).
- Wholesalers' investments have resulted in more than $250 million in investments in at least 83 SPOs and social finance projects.
All investment data in this document show trends as of December 31, 2024.
The information below is an overview of the initial data being collected. Starting in 2026, wholesalers will report on specific SFI and SPO data, including who they serve, demographic data, Social Equity Lens and Gender Lens Investment data, along with impact data. Reporting requirements for the Social Equity Lens and Gender Lens Investment data are expected starting in 2026; therefore, the data provided below is preliminary. For more details, please consult the Social Finance Fund Hub's FAQ on data collection and reporting.
Investment data
Wholesaler data
| Data category | Amount / Number |
|---|---|
| Total investment commitments in Social Finance Intermediaries (SFIs) | $177.13 million |
| Total investment commitments in new or emerging SFIs | $62.85 million |
| Total investment commitments in SFIs offering below market (concessional) investments | At least $65 million |
| Number of investment commitments in SFIs | 40 |
| Number of different SFIs financed | 34 |
| Total investment commitments in SFIs that went to investments promoting greater social equity (SE) | At least 32% ($57.25 million) (This increases to 86% when including only the SFIs that reported preliminary data for 2024) |
| Total investment commitments in SFIs that went to investments promoting greater gender equality | At least 16% ($28.75 million) (This increases to 43% when including only the SFIs that reported preliminary data for 2024) |
| Size of investment commitments in SFIs | Average: $4.42 million; Median: $4 million |
| Private capital leveraged by wholesalers | $40 million |
Social Finance Intermediary (SFI) data
| Data Category | Amount / Number |
|---|---|
| Total investment commitments in Social Purpose Organizations (SPOs) | Over 250 million |
| Number of SPOs Financed | At least 83 |
| Total investment commitments in SPOs that went to investments promoting greater social equity (SE) | At least 10% ($25 million) (This increases to 66% when including only the SPOs that reported preliminary data for 2024) |
| Total investment commitments in SPOs that went to investments promoting greater gender equality | At least 4% ($8.9 million) (This increases to 22% when including only the SPOs that reported preliminary data for 2024) |
| Size of investment commitments in SPOs | Average: $3.1 million; Median: $0.4 million |
| Private capital leveraged by SFIs attributable to the SFF | $282 million |
Investment type
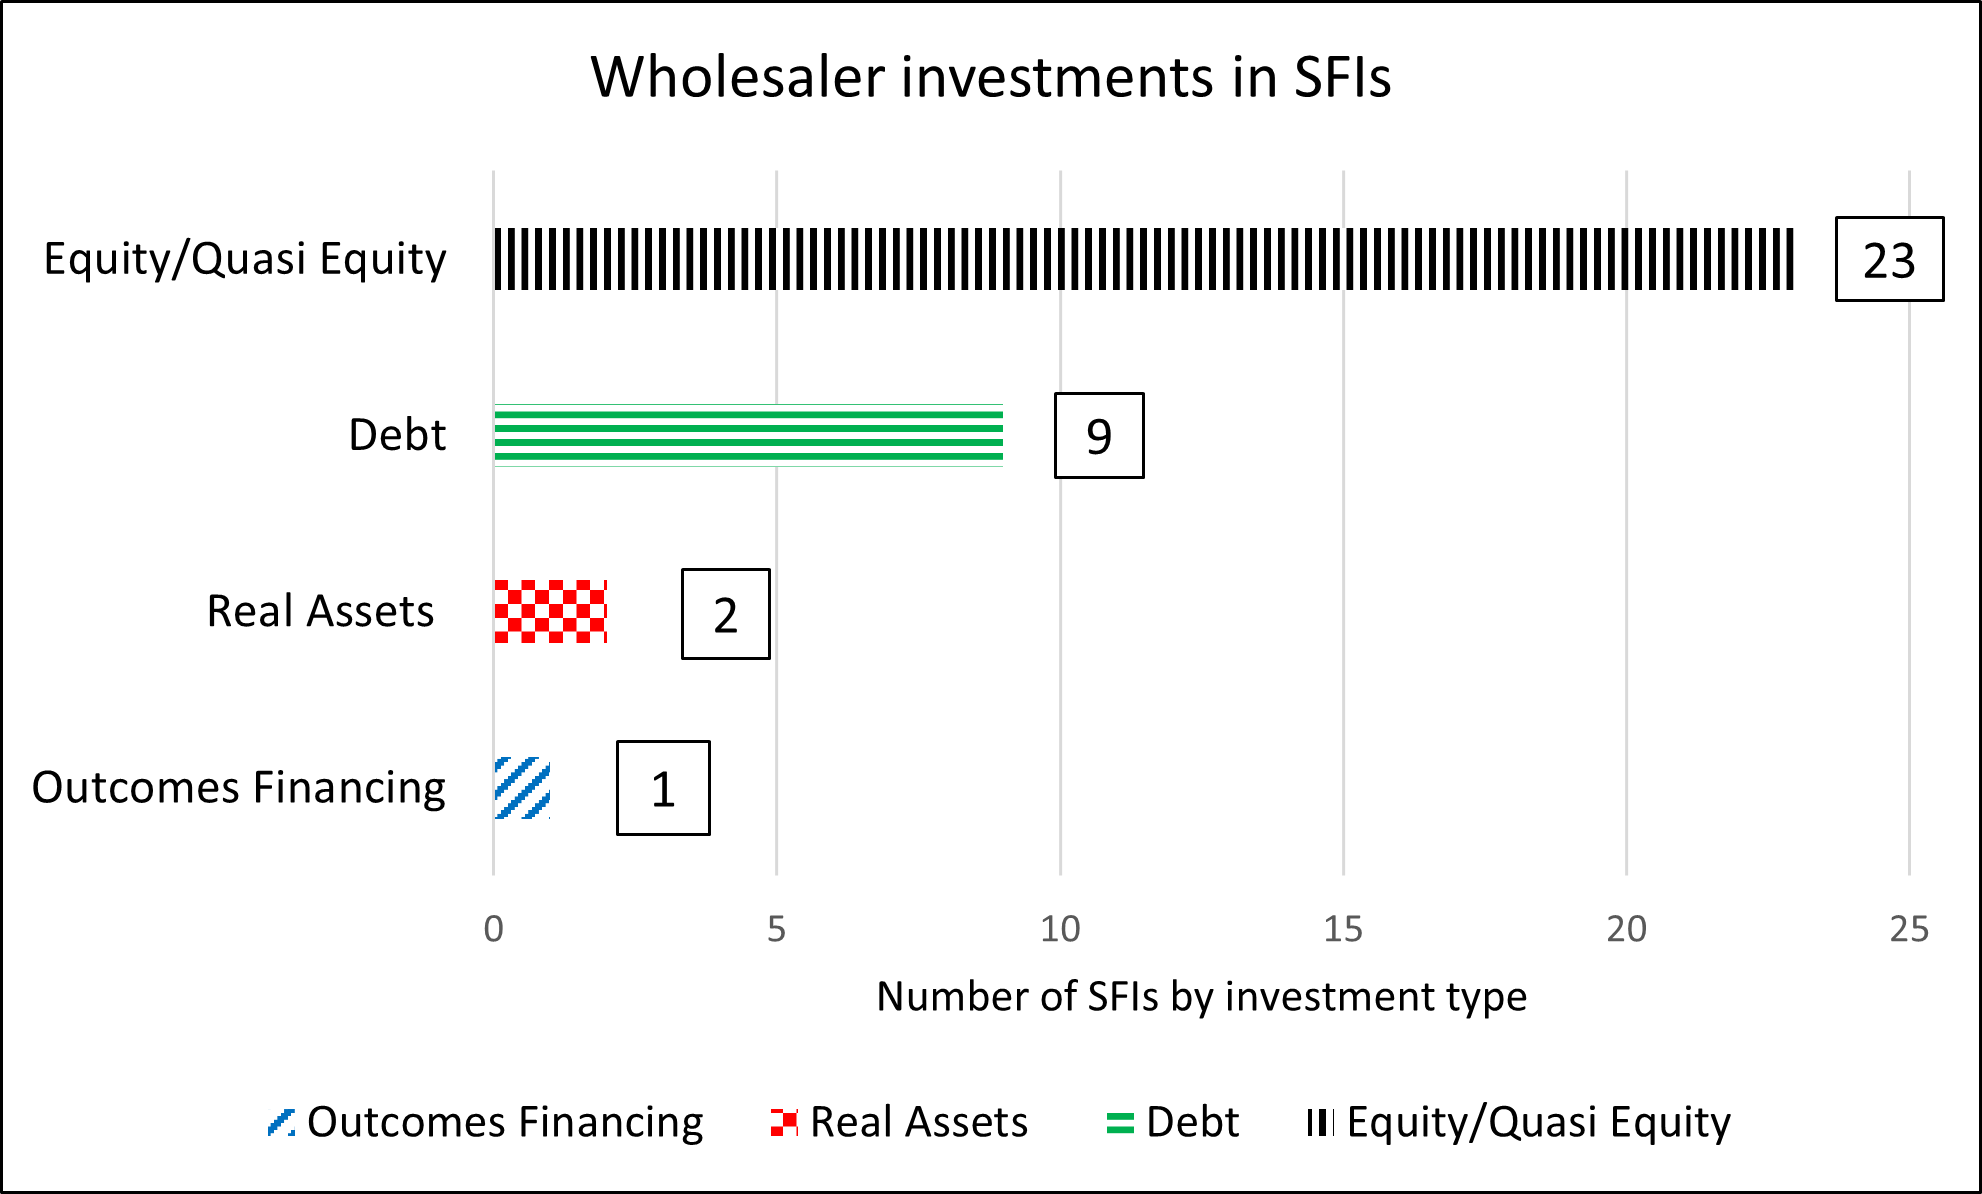
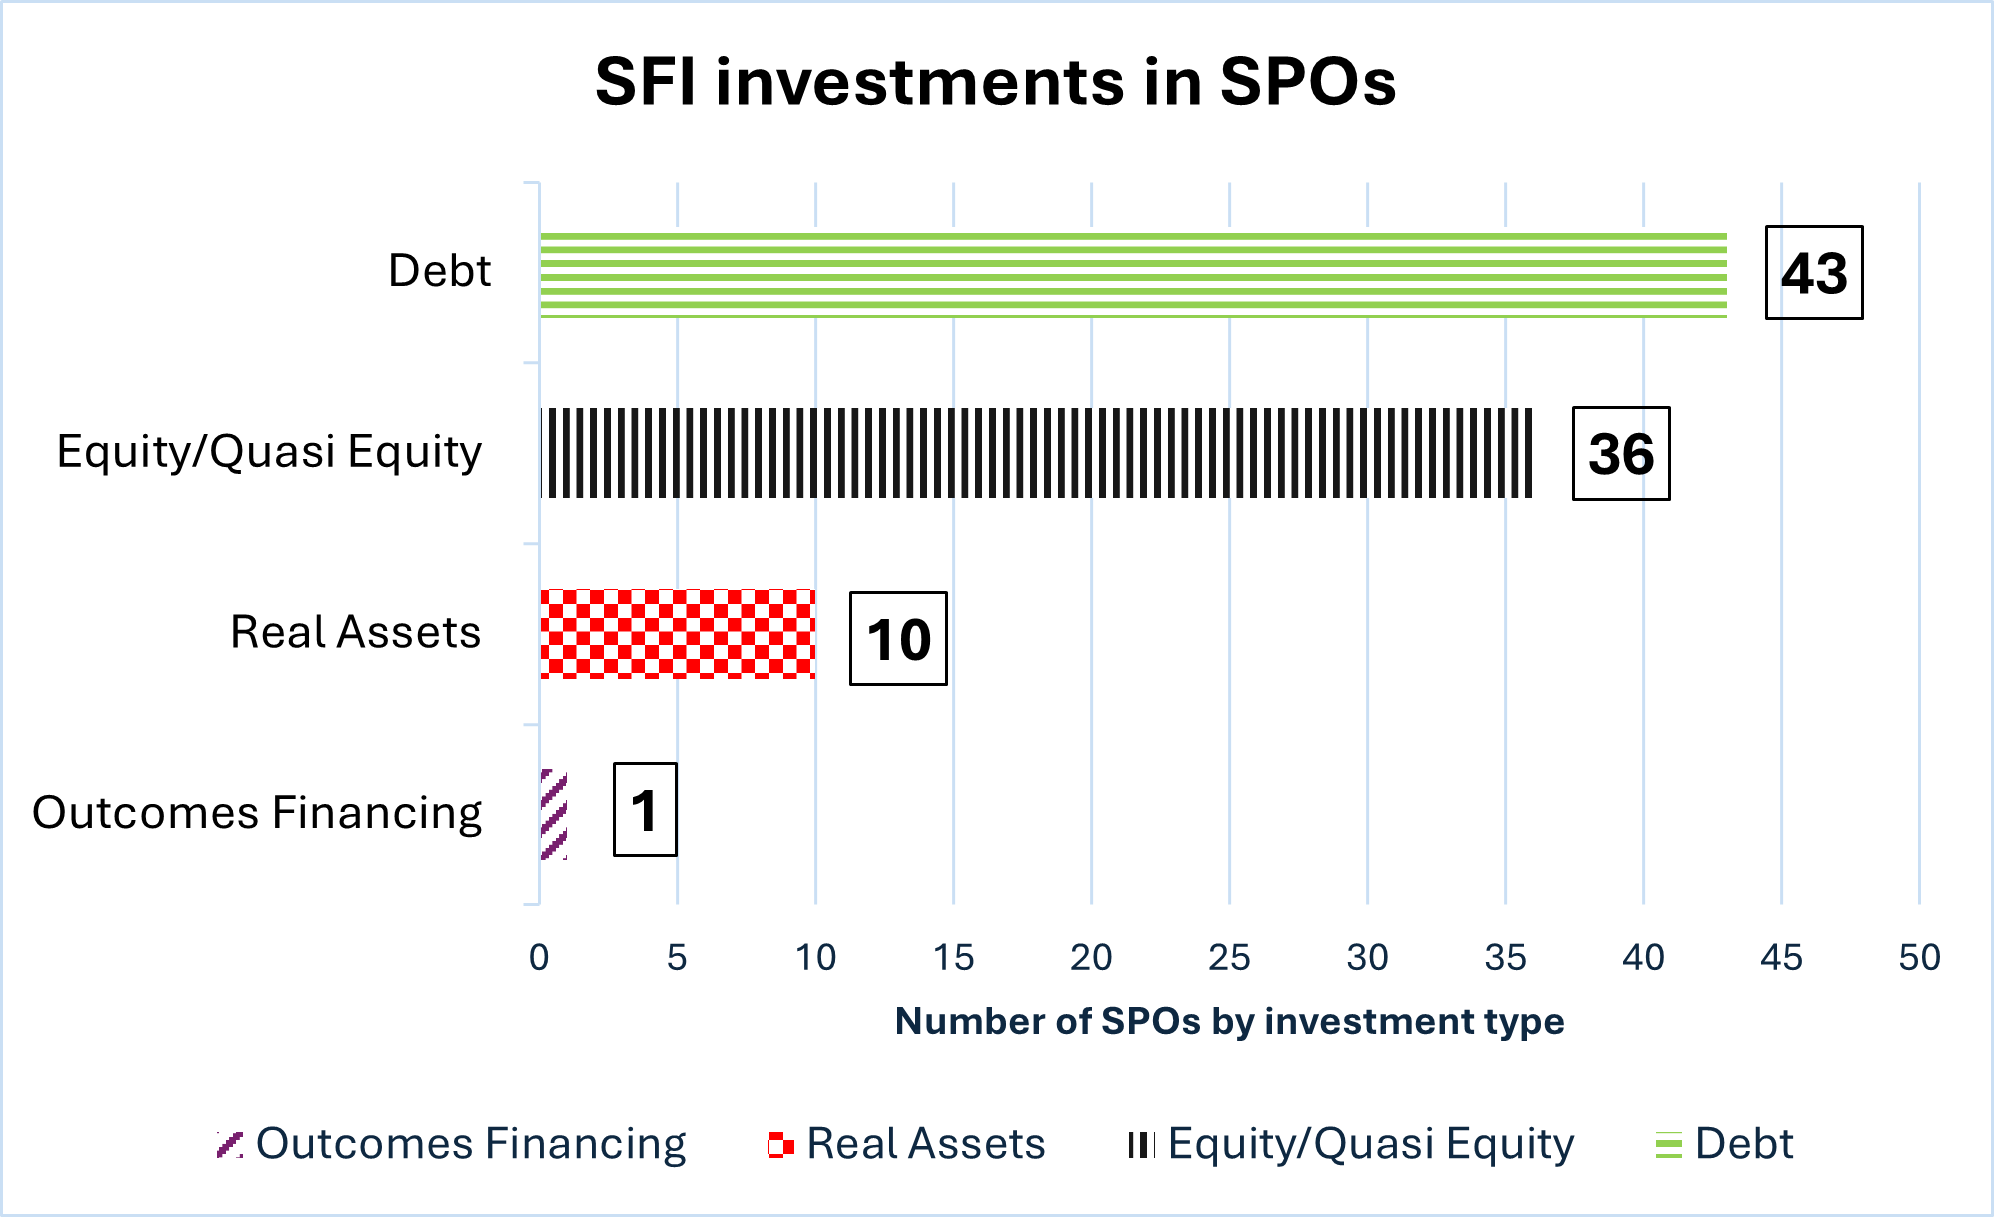
These two bar graphs show the breakdown of wholesaler and Social Finance Intermediary (SFI) investments by type, including Debt, Equity, Outcomes Financing and Real Assets.
Text description: Figure 1
Figure 1 shows the distribution of investment types made by wholesalers. The chart is segmented as follows:
- Equity/Quasi Equity investments in 23 SFIs, shown in black and white vertical stripes.
- Debt investments in 9 SFIs, shown in green and white horizontal stripes.
- Real Asset investments in 2 SFIs, shown in red check pattern.
- Outcomes Financing investment in 1 SFI, shown in diagonal blue and white stripes.
Overall, equity was the most common type of investment made by wholesalers in SFIs.
- Note: Some investments included more than one type, reflecting a mix of terms.
Text description: Figure 2
Figure 2 shows breakdown of various investment types made by SFIs. The chart is segmented as follows:
- Debt investments in 43 SFIs, shown in green and white horizontal stripes.
- Equity/Quasi Equity investments in 36 SFIs, shown in black and white vertical stripes.
- Real Asset investments in 10 SFIs, shown in red check pattern.
- Outcomes Financing investment in 1 SFI, shown in diagonal blue and white stripes.
At the Social Purpose Organization (SPO) level, there was a relatively balanced split between equity (46%) and debt (52%). Non-profits primarily relied on debt financing (71%) because they cannot take on equity investments. In contrast, for-profit organizations mainly accessed equity (78%), with a smaller portion (15%) using debt.
Type of Social Purpose Organization (SPO) funded
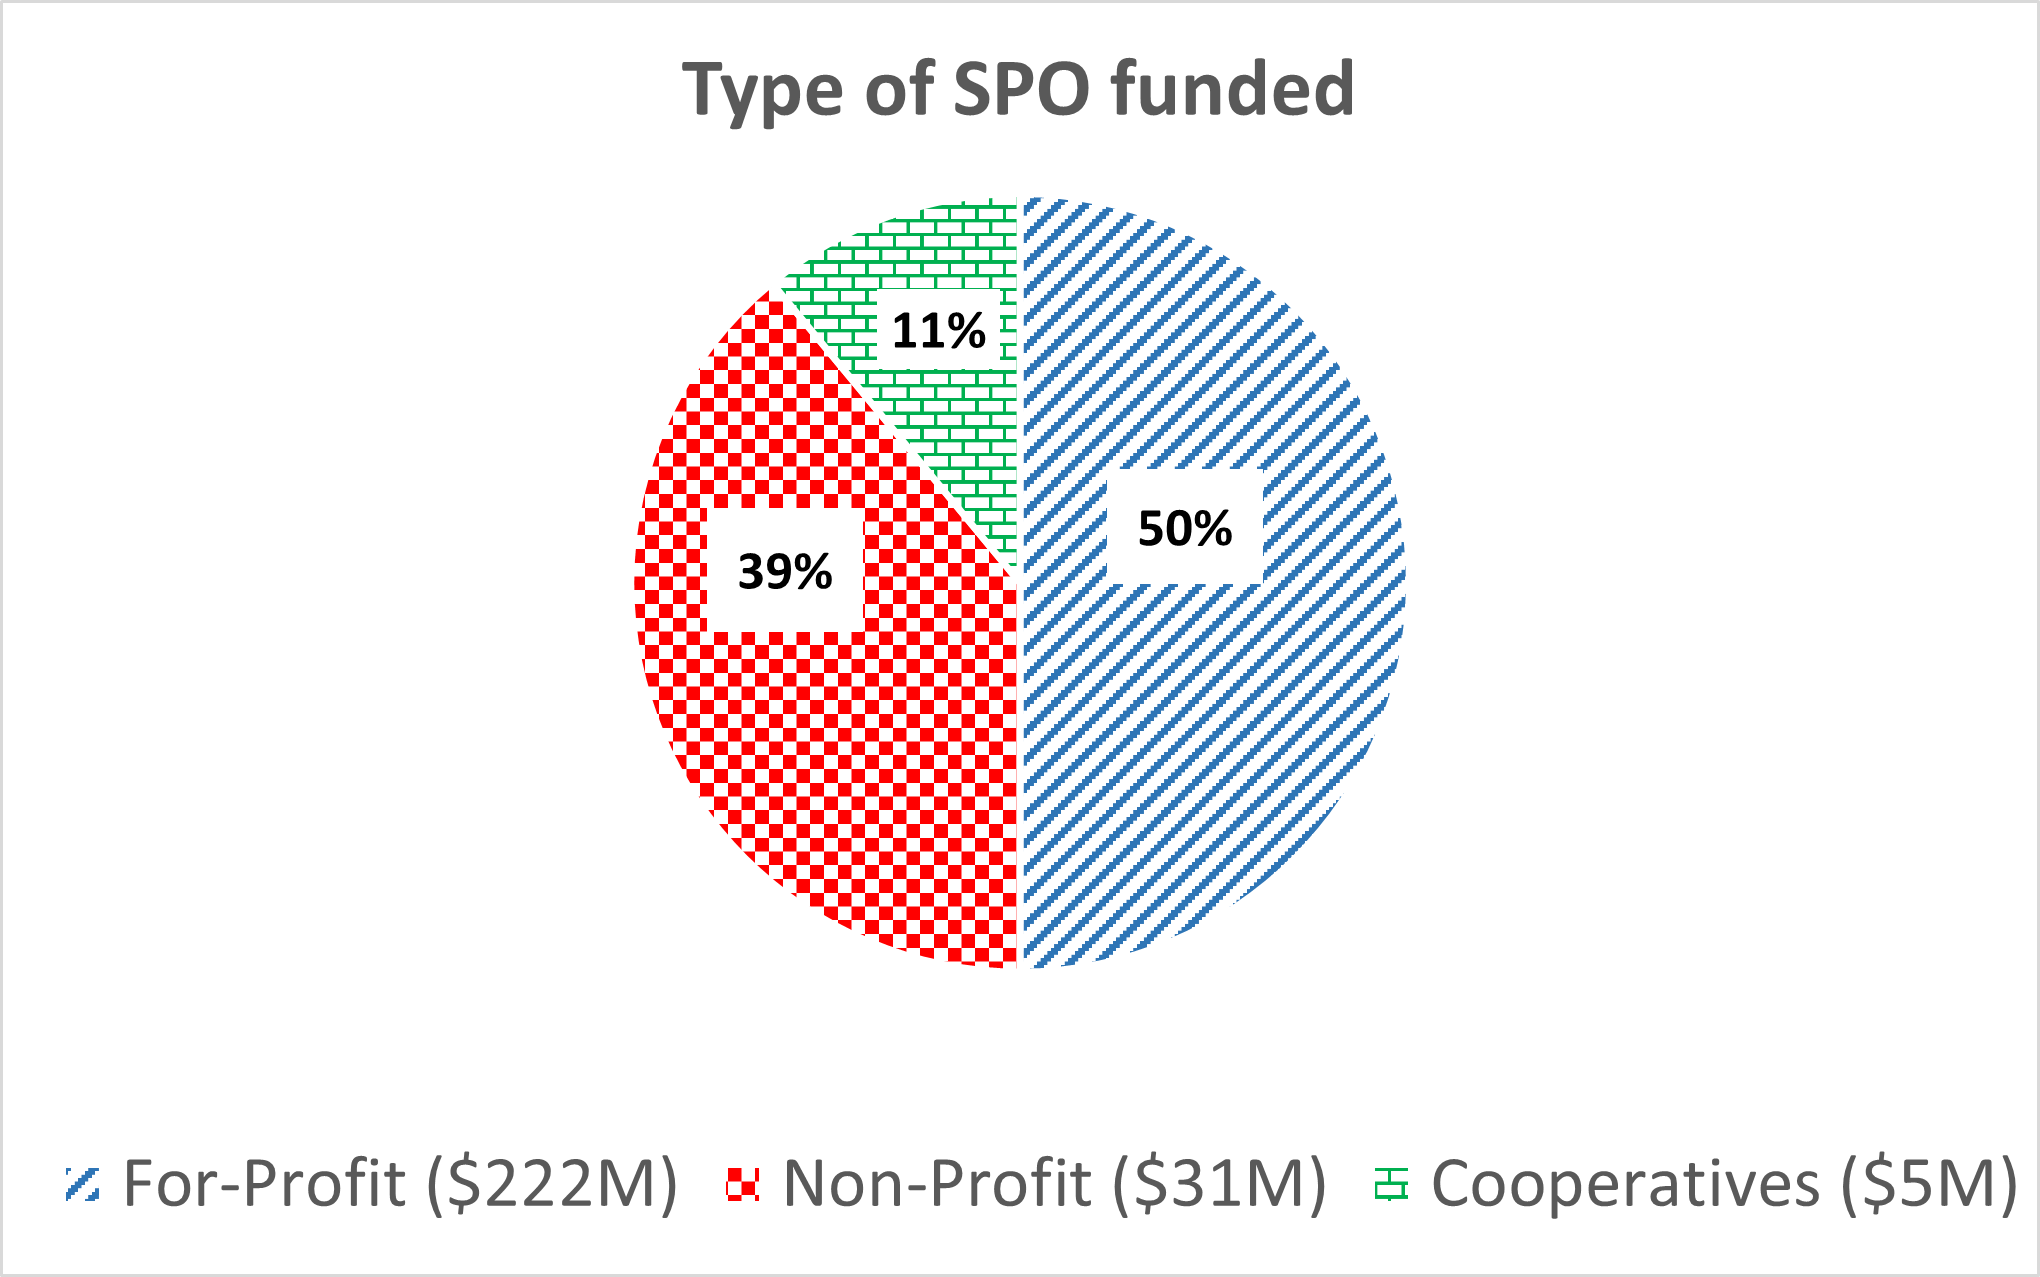
This chart shows the breakdown of funded SPOs by type, including Profit, Not-for Profit and Cooperatives.
Text description: Figure 3
Figure 3 illustrates the distribution of funding across three categories:
- For-Profit Organizations, accounting for 50%, represented in blue diagonal stripes.
- Non-Profit Organizations, making up 39%, shown in red check pattern.
- Cooperatives, which constitute 11%, indicated in green brick pattern.
Regions served
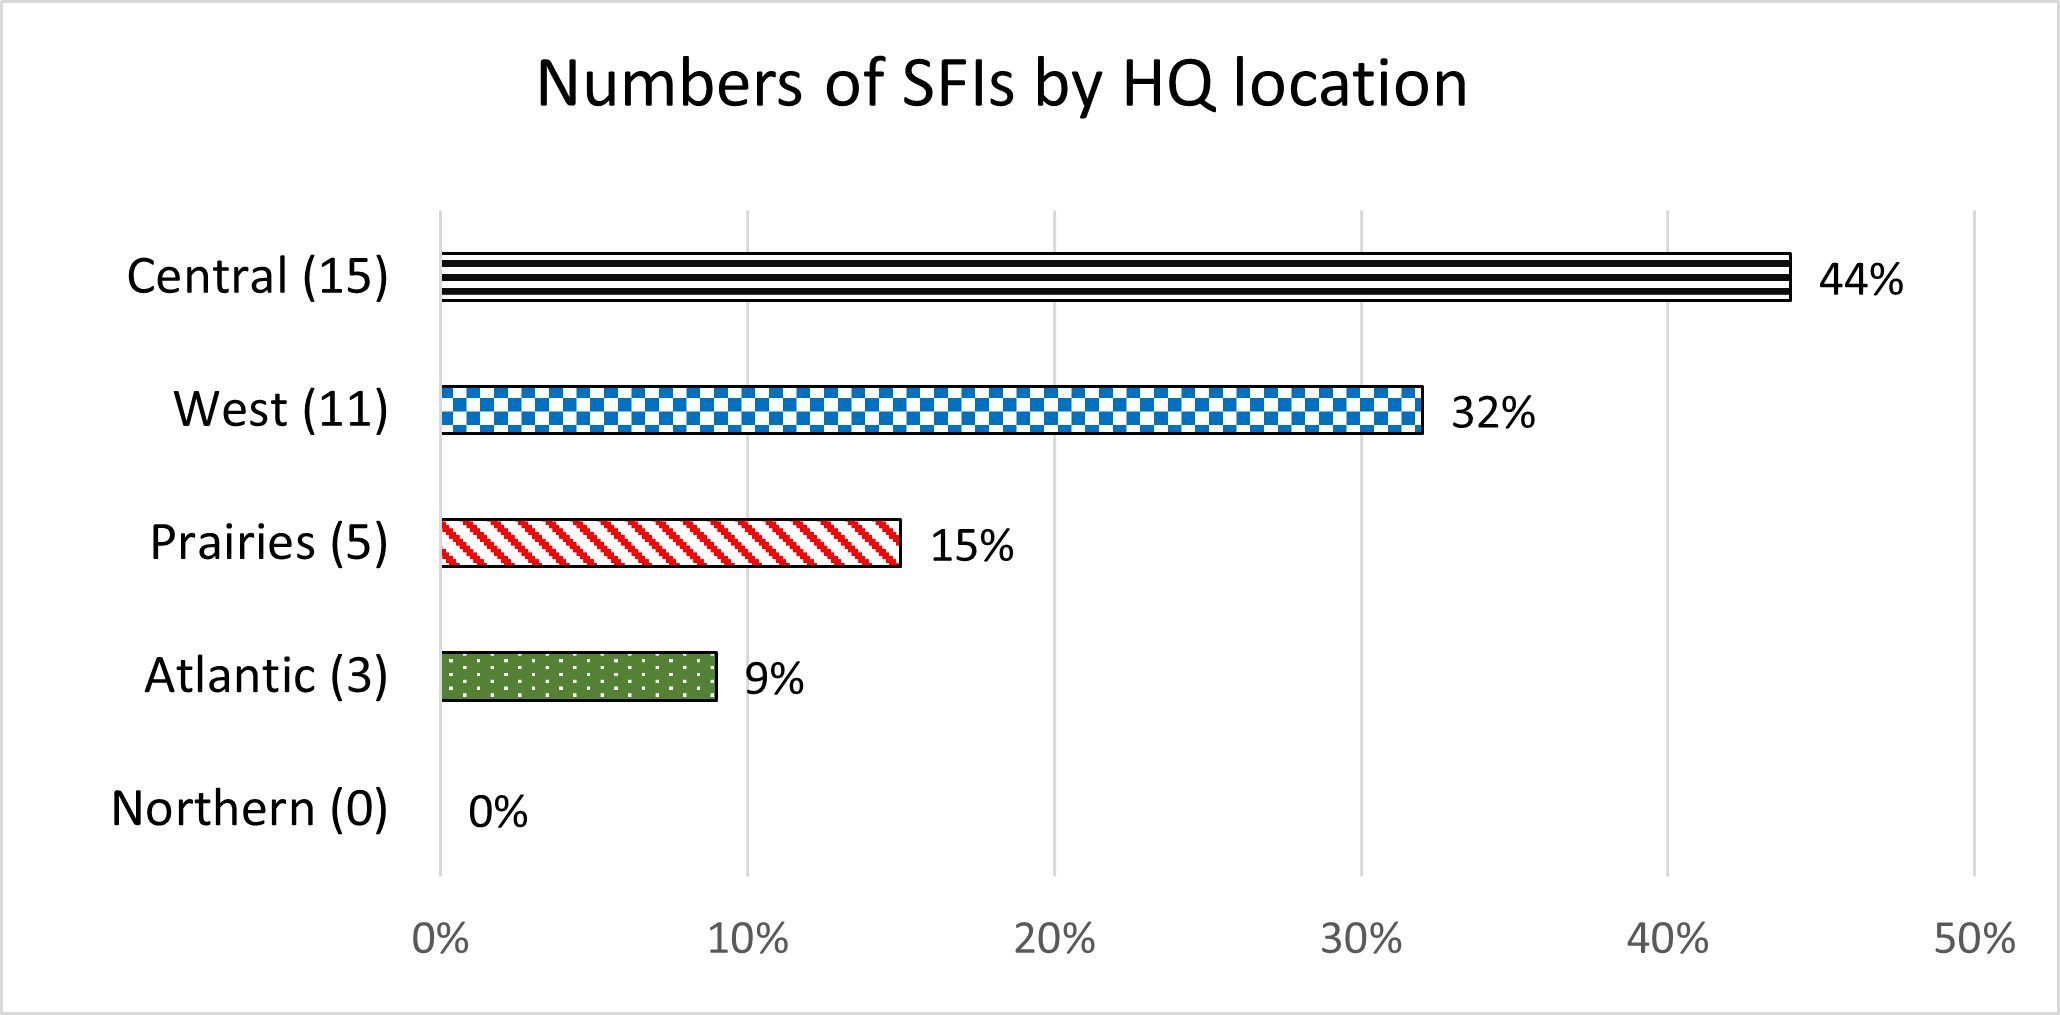
These next two graphs show the number of Social Finance Intermediaries (SFIs) by their Headquarter (HQ) location (Figure 4) and the number of investments in SFIs by regions served (Figure 5).
Text description: Figure 4
Figure 4 shows the distribution of Social Finance Intermediaries (SFIs) based on their headquarter location. The graph includes the following data points:
- Central: 15 SFIs, accounting for 45% of the total, shown in black horizontal stripes.
- West: 11 SFIs, representing 33%, shown in blue check pattern
- Prairies: 5 SFIs, making up 15%, shown in diagonal red stripes.
- Atlantic: 2 SFIs, corresponding to 5%, shown in green polka dot pattern.
- Northern: 0 SFIs, signifying 0%.
Most Social Finance Intermediaries (SFIs) have their headquarters in the west (British Columbia) and central provinces (Ontario and Quebec).
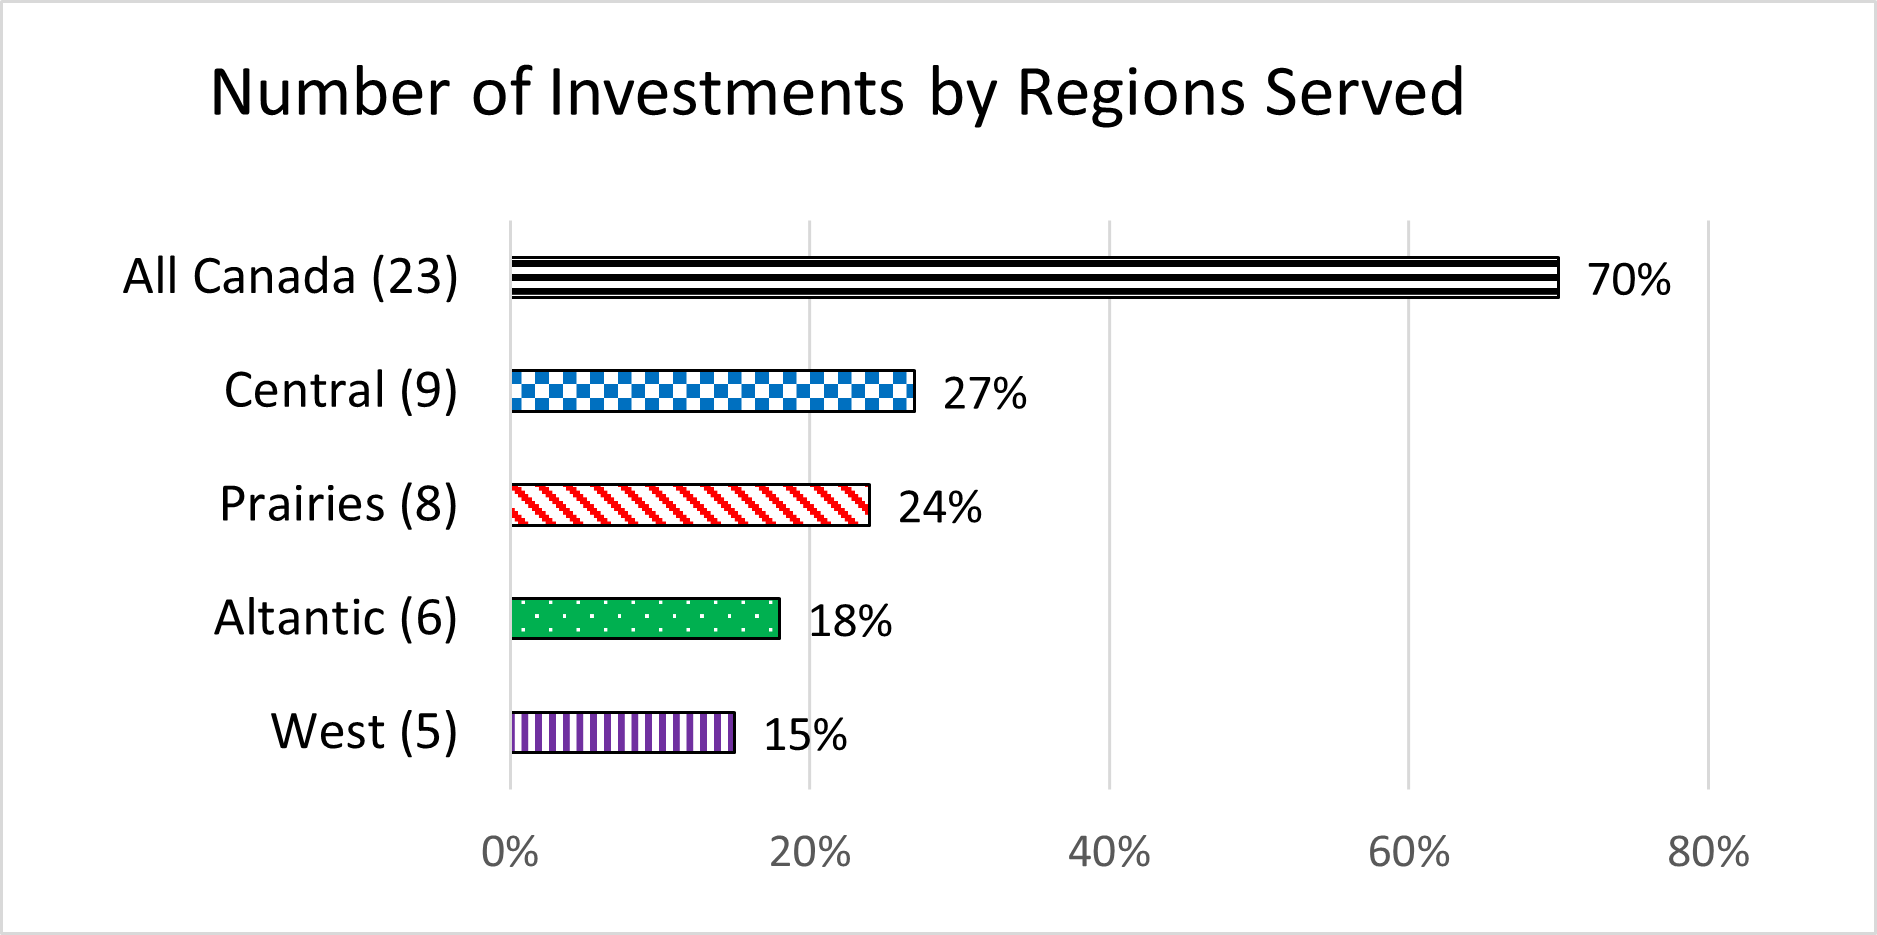
Text description: Figure 5
Figure 5 displays the distribution of investments across different regions in Canada. The graph includes the following data points:
- All Canada: 23 investments, representing 70% of the total, shown in black horizontal stripes.
- Central: 9 investments, accounting for 27%, shown in blue check pattern.
- Prairies: 8 investments, making up 24%, shown in red diagonal stripes.
- Atlantic: 6 investments, corresponding to 18%, shown in green polka dot pattern.
- West: 5 investments, indicating 15%, shown in purple vertical stripes.
Regardless of their location, most of the investments from wholesalers (70%) were made into SFIs that serve all of Canada.
These next two graphs show the number of Social Purpose Organizations (SPOs) by headquarter (HQ) location (Figure 5) and the number of SPOs by regions served (Figure 6).
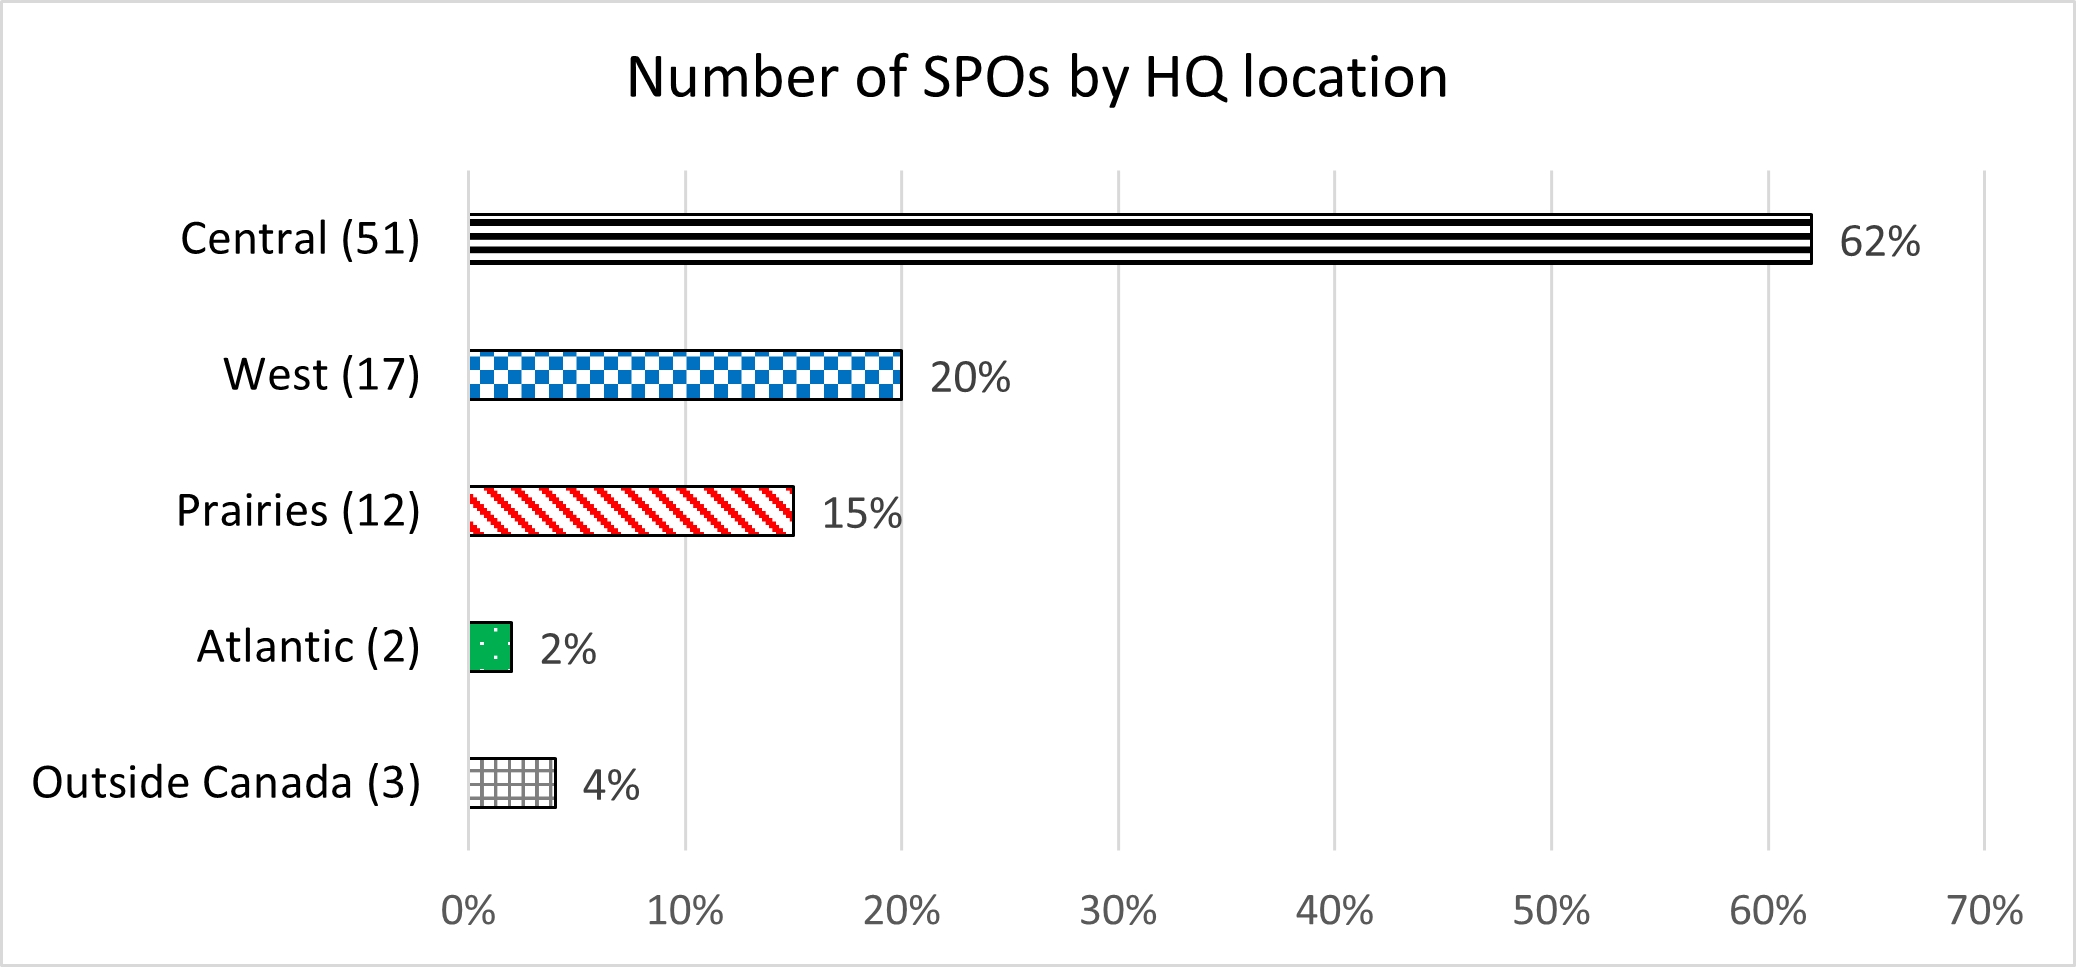
Text description: Figure 6
Figure 6 illustrates the distribution of Social Purpose Organizations (SPOs) based on their headquarter (HQ) location. The data points include:
- Central: 51 SPOs, accounting for 62% of the total, shown in black horizontal stripes.
- West: 17 SPOs, representing 20%, shown in blue check pattern.
- Prairies: 12 SPOs, making up 15%, shown in red diagonal stripes.
- Atlantic: 2 SPOs, corresponding to 2%, shown in green polka dot pattern.
- Outside Canada: 3 SPOs, signifying 4%, shown in grey box pattern.
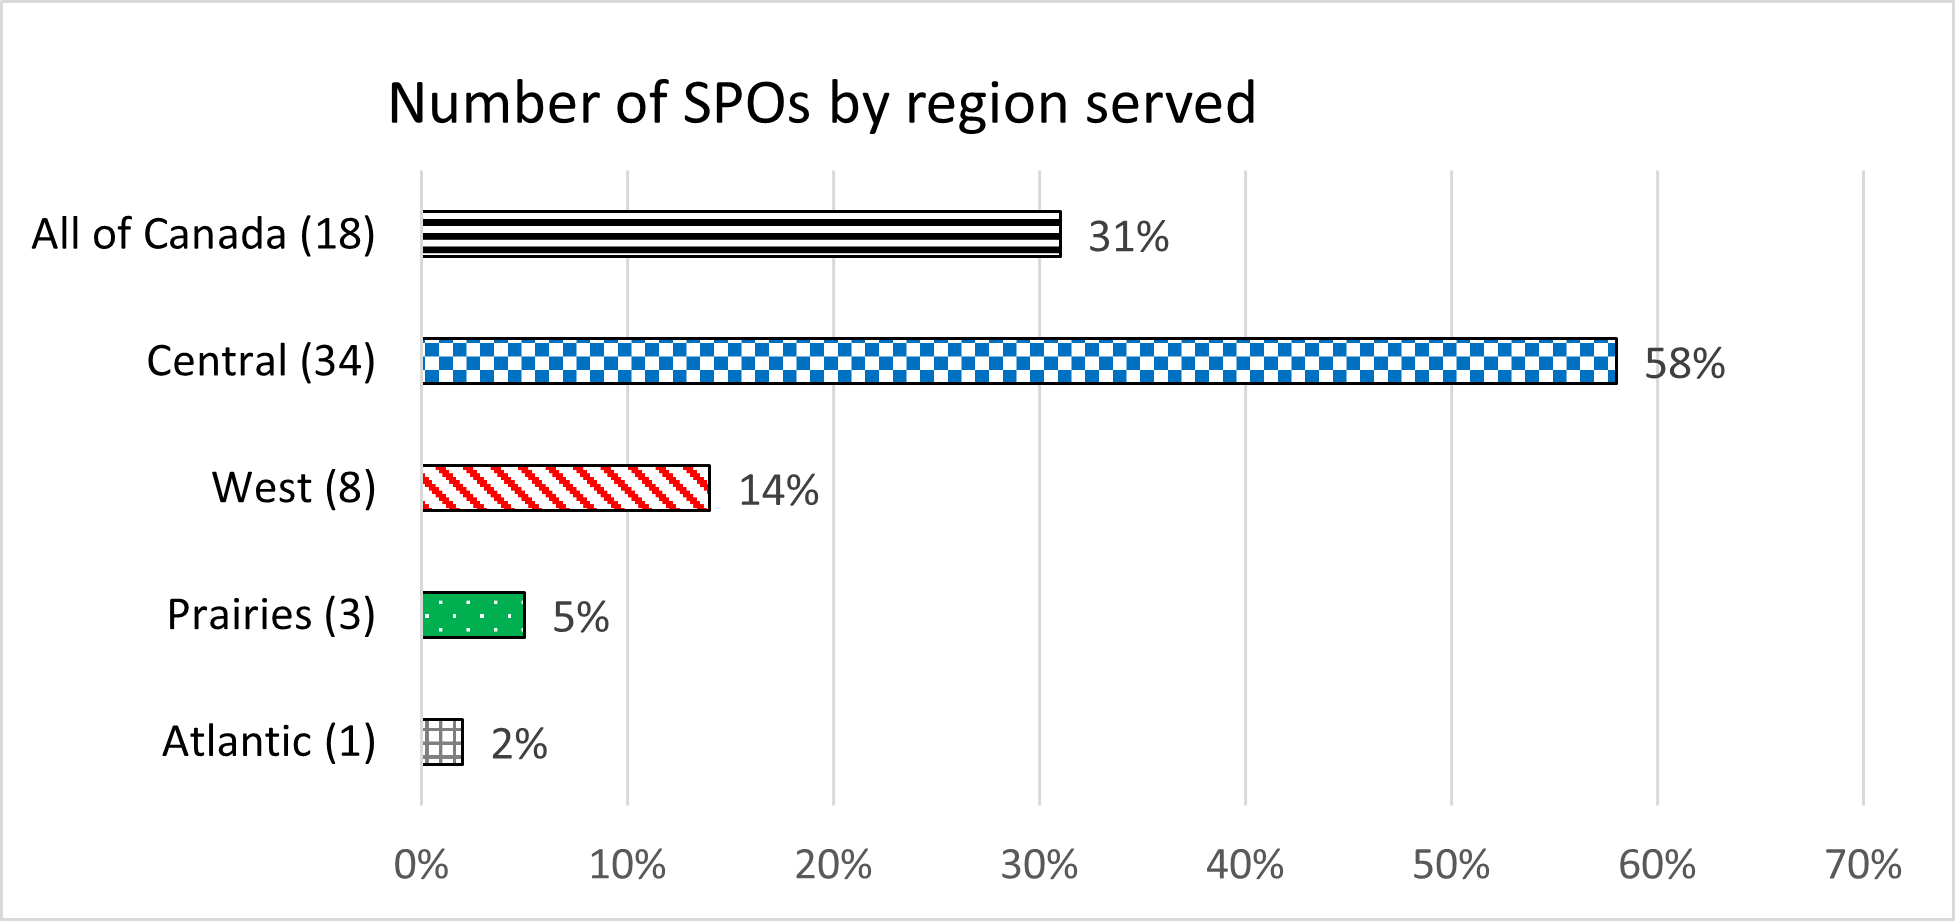
Text description: Figure 7
Figure 7 shows the number of SPOs based on regions served. The data points include:
- All of Canada: 18 SPOs, which constitute 58% of the total, shown in black horizontal stripes.
- Central: 34 SPOs, representing 31%, shown in blue check pattern.
- West: 8 SPOs, accounting for 14%, shown in red diagonal stripes.
- Prairies: 3 SPOs, making up 5%, shown in green polka dot pattern.
- Atlantic: 1 SPO, corresponding to 2%, shown in grey box pattern.
Most Social Purpose Organizations (SPOs) reported that they focus on serving the central provinces (Ontario and Quebec). About 30% of SPOs stated that they serve all of Canada. While three of the SPOs have headquarters outside of Canada, they are providing services in Canada.
Top sustainable development goals (SDGs) supported
The Social Finance Fund is closely aligned with the United Nations Sustainable Development Goals (SDGs) through its mission to support Social Finance Intermediaries (SFIs) and Social Purpose Organizations (SPOs) that tackle pressing social, environmental, and economic challenges. As of December 2024, these are the top SDGs supported by SPOs and SFIs.
Top SDGs Supported by SFIs:
- SDG 3: Good Health and Well-Being
- SDG 8: Decent Work and Economic Growth
- SDG 10: Reduced Inequalities
- SDG 11: Sustainable Cities and Communities
- SDG 13: Climate Action
Top SDGs Supported by SPOs:
- SDG 7: Affordable and Clean Energy
- SDG 9: Industry, Innovation and Infrastructure
- SDG 10: Reduced Inequalities
- SDG 11: Sustainable Cities and Communities
- SDG 13: Climate Action
Update on market-building activities
Social finance is a relatively new concept in Canada, and the market and investment opportunities in this area are still growing. Each wholesaler received non-repayable contribution (NRC) funding to support activities that help build the Canadian social finance ecosystem. These activities aim to:
- Strengthen the market's infrastructure
- Support the people involved in the market
- Identify and remove barriers to accessing social finance
- Promote a fairer balance of power between those supplying and those seeking social finance
Specifically, these market-building efforts focus on supporting existing and new Social Finance Intermediaries (SFIs), especially those led by or serving equity-deserving groups.
As of March 31, 2025, wholesalers have spent $9.4 million on market-building activities, including $6.6 million in funding support to 33 SFIs in the following areas:
- Operational Support: Funding is allocated for salaries, administrative expenses, and other operational costs, including professional fees and capacity building for staff
- Capacity Development: Numerous initiatives focus on strengthening the capabilities of organizations, including the development of investment readiness and financial modeling tools
- Community and Outreach Programs: Investments are aimed at enhancing community engagement, outreach, and support, including the development of tailored investment strategies and financial instruments
- Legal and technical assistance: Funding is directed towards obtaining legal advice, compliance materials, and technical support necessary for establishing and syndicating investments
- Market strategy development: Resources are dedicated to developing go-to-market strategies, branding, and marketing collateral for new funds and initiatives
- Research and analysis: Financial support is provided for research studies and analysis related to impact models, system building, and sector-specific studies
- Innovative financial instruments: Funding is designated for the development of unique financing tools and structures, such as revenue-based financing and impact-linked compensation frameworks
- Programs supporting equity-deserving Groups: Special emphasis is placed on initiatives led by or supporting equity-deserving groups, including capacity-building projects and case studies
- Fund launch and management: Support is offered for launching new funds, including operational funding for fund managers, and enhancing collaboration among investors to expand impact
- Student and intern engagement: Funding includes stipends for interns and educational programs aimed at fostering the next generation of social finance leaders
Current status: Ongoing
* Market-building funding has also been provided to wholesalers for technical assistance support with the implementation of the Impact Data Standard and the Pilot Social Equity Lens Investment (SELI) Coding System, as well as for the development of the Social Finance Fund Hub (see below).
Update on impact measurement and management activities
The Social Finance Fund (SFF) helps improve social and environmental outcomes for people in Canada by supporting social purpose organizations (SPOs). A key part of this goal is measuring impact, which is why the SFF is creating an Impact Data Standard.
Since June 2023, the SFF has been working with wholesalers and Common Approach to Impact Measurement to develop this standard. Common Approach is a Canadian non-profit that focuses on enabling flexible, shareable impact measurement by SPOs. It has updated its existing data standard, based on the United Nations Sustainable Development Goals and other impact measurement frameworks, to meet the SFF's needs.
Rather than using fixed metrics, the SFF's Impact Data Standard provides guidelines on how to collect impact data. It outlines key data fields and lets SPOs choose impact indicators that match their goals. SPOs use the impact data standard by adopting software or other aligned tools (e.g., spreadsheets).
The SFF is also focused on improving skills in impact measurement among its investees. This includes the IMM Programming launched by Realize Capital Partners, which is designed to support Social Finance Intermediaries (SFIs) and SPOs. Common Approach has also developed resources to help SFIs and SPOs adopt the Impact Data Standard.
This collaborative approach helps SPOs and SFIs collect and manage impact data more effectively. It strengthens how impact is measured in the social finance ecosystem, ensuring that both social and financial returns are tracked and reported effectively.
Current status: The Impact Data Standard is ready to use, with ongoing efforts by the wholesalers and Common Approach to support adoption by investees.
Update on social equity lens investment activities
The Social Finance Fund (SFF) was designed through a social equity lens to address systemic bias, encourage decisions that remove barriers, and ultimately ensure investments reach and support equity-deserving communities and underserved populations. As part of this commitment, the SFF has set targets to allocate a minimum of 35% of investments into Social Equity Lens Investments (SELI), including a minimum of 15% into Gender Lens Investments (GLI). To evaluate these investments, a Pilot Social Equity Lens Investment (SELI) Coding System was developed.
The Pilot SELI Coding System is a taxonomy that will enable the Department to track and measure its progress towards its Social Equity Lens Investment and Gender Lens Investment targets. The taxonomy was announced in November 2024 at the Sustainable Finance Forum by the Honourable Jenna Sudds, then Minister of Families, Children and Social Development.
Wholesalers are receiving funding to help them put the Pilot SELI Coding System into action across the social finance ecosystem
Current status: The full taxonomy and its implementation tools can be accessed through Social Finance Fund Hub.
Update on Social Finance Hub
Funded by the Social Finance Fund (SFF) and led by Boann Social Impact - one of the three wholesalers - the Social Finance Fund Hub is a national online platform for social finance. It offers comprehensive information about the Social Finance Fund and helps connect capital providers, social finance intermediaries, and social purpose organizations.
Current status: The Hub website currently focuses information about the SFF but will expand to include various resources such as learning tools, a sector directory, and additional insights related to the social finance ecosystem.