
Role of the Cost-of-Living-Adjustment clauses during low inflation time
Introduction
The Cost-of-Living-Adjustment (COLA) clauses allow increases in wages at specified intervals during the life of a contract. The increments are subject to adjustments to the increase in the cost of living as measured by the consumer price index (CPI). During the late 1970’s and early 1980’s, when inflation was in the double digits, COLA clauses were a common feature in most collective bargaining settlements (Statistics Canada 2005). Later, with lower and more stable annual inflation, COLA clauses became less relevant and eventually less desired by unions compared to other provisions (Christofides and Peng 2010). This study analyzes the declining frequency of the presence of COLA clauses in collective bargaining settlements in Canada. The analysis is based on a pattern of evidence from major Footnote i collective bargaining settlements between 1977 and 2014.
Presence of COLA by jurisdiction
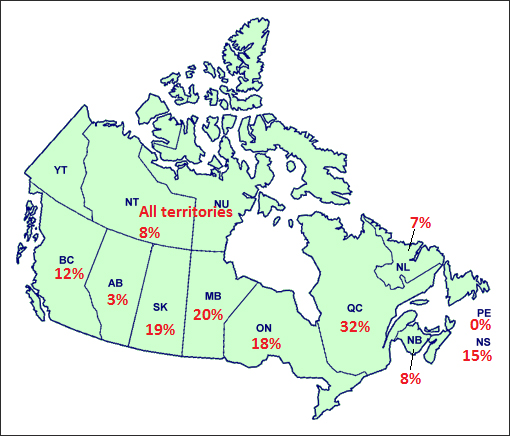
Between 1977 and 2014, a total of 16,355 major agreements were ratified. Ontario (37%) and Quebec (14%) in combined had more than half of the agreements ratified during that time. Of these all agreements, 17% (2,724 agreements) had a COLA clause. By jurisdiction, the highest proportion of agreements with COLA was in Quebec (32%, 743 agreements), followed by Manitoba (20%, 152 agreements), Saskatchewan (19%, 76 agreements), and Ontario (18%, 1,087 agreements) [Figure 1]. In the federal jurisdiction, 273 agreements (14%) had a COLA clause and most (67%) of them took place before 1991.
Show Data Table
| Jurisdiction | Agreements with COLA |
|---|---|
| Alberta | 3% |
| All territories | 8% |
| British Columbia | 12% |
| Manitoba | 20% |
| New Brunswick | 8% |
| Newfoundland and Labrador | 7% |
| Nova Scotia | 13% |
| Ontario | 18% |
| Prince Edward Island | 0% |
| Quebec | 32% |
| Saskatchewan | 19% |
Decline in agreements settled with COLA
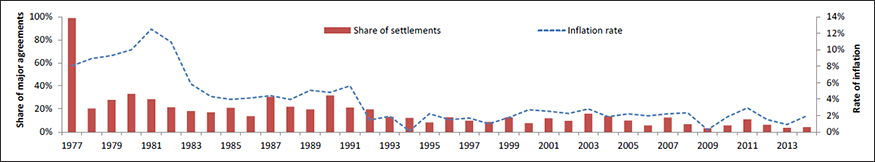
The proportion of agreements settled with a COLA clause each year has been in gradual decline since 1981 [Figure 2]. During the late 1970’s and throughout the 1980’s, when inflation was significantly higher than today, the proportion of settlements with COLA mostly remained between 20% and 30%, with the exception of 1977 when all of the ratified agreements included a COLA clause. From 1992 onwards the share of such agreements had been in the range of 6% to 16%. This comes as no surprise since inflation during the latter period remained stable, mostly around 2%.
COLA clauses across jurisdictions
Overall, the share of agreements settled in Canada with a COLA clause declined over the study period and mirrored inflation [Figure 2]. Most jurisdictions had a decline in settlements with a COLA clause since the early 80s. Quebec, with the largest proportion of agreements with COLA, experienced a significant decline since the 90s.
Show Data Table
| Years | Inflation rate | Share of major agreements |
|---|---|---|
| 1977 | 8.0% | 99.0% |
| 1978 | 8.9% | 20.4% |
| 1979 | 9.3% | 27.8% |
| 1980 | 10.0% | 33.2% |
| 1981 | 12.5% | 28.4% |
| 1982 | 10.9% | 21.5% |
| 1983 | 5.8% | 18.1% |
| 1984 | 4.3% | 17.0% |
| 1985 | 4.0% | 20.9% |
| 1986 | 4.1% | 13.7% |
| 1987 | 4.4% | 30.5% |
| 1988 | 3.9% | 22.0% |
| 1989 | 5.1% | 19.6% |
| 1990 | 4.8% | 31.8% |
| 1991 | 5.6% | 21.2% |
| 1992 | 1.4% | 19.6% |
| 1993 | 1.9% | 13.1% |
| 1994 | 0.1% | 12.2% |
| 1995 | 2.2% | 8.2% |
| 1996 | 1.5% | 12.7% |
| 1997 | 1.7% | 9.7% |
| 1998 | 1.0% | 8.7% |
| 1999 | 1.8% | 12.7% |
| 2000 | 2.7% | 7.6% |
| 2001 | 2.5% | 11.8% |
| 2002 | 2.2% | 9.7% |
| 2003 | 2.8% | 15.8% |
| 2004 | 1.8% | 13.6% |
| 2005 | 2.2% | 9.8% |
| 2006 | 2.0% | 5.7% |
| 2007 | 2.2% | 12.5% |
| 2008 | 2.3% | 6.8% |
| 2009 | 0.3% | 3.2% |
| 2010 | 1.8% | 5.7% |
| 2011 | 2.9% | 10.9% |
| 2012 | 1.5% | 6.4% |
| 2013 | 0.9% | 3.6% |
| 2014 | 2.0% | 4.2% |
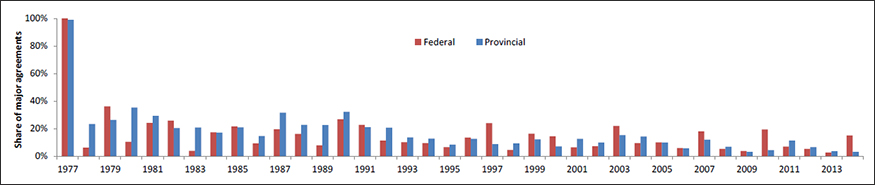
A total of 1,941 major settlements took place in the federal jurisdiction over the study period and only 273 agreements (14%) of those had COLA provisions. In the provincial jurisdiction, only 17% (2,451 agreements) of 14,414 agreements had COLA provisions during 1977-2014. The annualized average share of settlements with COLA during 1980’s was 17% in the federal and 24% in provincial jurisdictions, whereas during 1991-2014 period, such average shares dropped to 11% and 10%, respectively [Figure 3].
Show Data Table
| Years | Federal | Provincial |
|---|---|---|
| 1977 | 100.0% | 99% |
| 1978 | 6.1% | 23% |
| 1979 | 36.0% | 26% |
| 1980 | 10.4% | 35% |
| 1981 | 24.1% | 29% |
| 1982 | 25.7% | 20% |
| 1983 | 3.8% | 21% |
| 1984 | 17.3% | 17% |
| 1985 | 21.4% | 21% |
| 1986 | 9.2% | 15% |
| 1987 | 19.4% | 31% |
| 1988 | 16.1% | 23% |
| 1989 | 7.9% | 23% |
| 1990 | 26.8% | 32% |
| 1991 | 22.6% | 21% |
| 1992 | 11.3% | 21% |
| 1993 | 10.1% | 14% |
| 1994 | 9.5% | 13% |
| 1995 | 6.5% | 8% |
| 1996 | 13.5% | 13% |
| 1997 | 24.0% | 9% |
| 1998 | 4.4% | 9% |
| 1999 | 16.3% | 12% |
| 2000 | 14.3% | 7% |
| 2001 | 6.4% | 12% |
| 2002 | 7.1% | 10% |
| 2003 | 21.9% | 15% |
| 2004 | 9.5% | 14% |
| 2005 | 10.0% | 10% |
| 2006 | 5.9% | 6% |
| 2007 | 17.9% | 12% |
| 2008 | 5.3% | 7% |
| 2009 | 3.7% | 3% |
| 2010 | 19.4% | 4% |
| 2011 | 6.9% | 11% |
| 2012 | 5.3% | 7% |
| 2013 | 2.6% | 4% |
| 2014 | 15.0% | 3% |
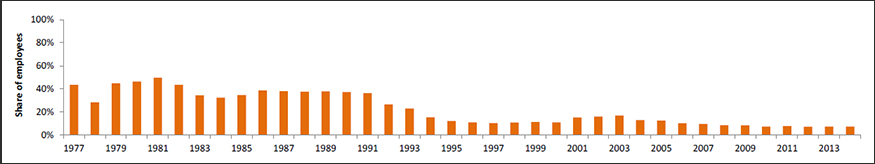
The proportion of employees with COLA coverage has also declined substantially over the 1977-2014 period [Figure 4].
Show Data Table
| Years | Share of major agreements |
|---|---|
| 1977 | 43.6% |
| 1978 | 28.3% |
| 1979 | 44.9% |
| 1980 | 46.3% |
| 1981 | 49.8% |
| 1982 | 43.6% |
| 1983 | 34.4% |
| 1984 | 32.5% |
| 1985 | 34.7% |
| 1986 | 38.6% |
| 1987 | 38.1% |
| 1988 | 37.7% |
| 1989 | 38.0% |
| 1990 | 37.3% |
| 1991 | 36.5% |
| 1992 | 26.6% |
| 1993 | 23.1% |
| 1994 | 15.4% |
| 1995 | 12.2% |
| 1996 | 11.2% |
| 1997 | 10.4% |
| 1998 | 10.9% |
| 1999 | 11.4% |
| 2000 | 11.0% |
| 2001 | 15.3% |
| 2002 | 16.1% |
| 2003 | 17.1% |
| 2004 | 13.1% |
| 2005 | 12.6% |
| 2006 | 10.3% |
| 2007 | 9.8% |
| 2008 | 8.7% |
| 2009 | 8.6% |
| 2010 | 7.4% |
| 2011 | 7.8% |
| 2012 | 7.3% |
| 2013 | 7.4% |
| 2014 | 7.5% |
Between the late 1970’s and the early 1990’s, the federal share in all covered employees declined from 28% to 19%. However, the proportion of employees covered by a COLA clause in this jurisdiction dropped from 40% to 20% over the same period [Figure 5]. COLA coverage also declined among the employees in the provincial jurisdictions. For example, in 1980, 47% of employees in the provincial jurisdictions had a COLA clause in their collective agreements; by 2014 this proportion has come down to only 1%.
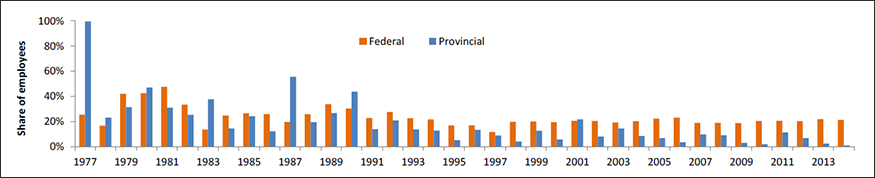
Show Data Table
| Years | Federal | Provincial |
|---|---|---|
| 1977 | 25.5% | 99.5% |
| 1978 | 16.7% | 23.1% |
| 1979 | 42.1% | 31.5% |
| 1980 | 42.5% | 47.1% |
| 1981 | 47.5% | 31.1% |
| 1982 | 33.4% | 25.3% |
| 1983 | 13.7% | 37.7% |
| 1984 | 24.8% | 14.5% |
| 1985 | 26.6% | 24.2% |
| 1986 | 25.9% | 12.2% |
| 1987 | 19.7% | 55.6% |
| 1988 | 25.8% | 19.4% |
| 1989 | 33.9% | 26.8% |
| 1990 | 30.4% | 43.8% |
| 1991 | 22.9% | 14.0% |
| 1992 | 27.5% | 20.9% |
| 1993 | 22.7% | 13.8% |
| 1994 | 21.6% | 12.7% |
| 1995 | 16.8% | 5.2% |
| 1996 | 16.9% | 13.4% |
| 1997 | 11.6% | 8.8% |
| 1998 | 19.7% | 4.0% |
| 1999 | 20.1% | 12.7% |
| 2000 | 19.5% | 5.7% |
| 2001 | 20.6% | 21.8% |
| 2002 | 20.5% | 8.1% |
| 2003 | 19.2% | 14.5% |
| 2004 | 20.2% | 8.5% |
| 2005 | 22.2% | 6.7% |
| 2006 | 23.1% | 3.5% |
| 2007 | 19.0% | 9.7% |
| 2008 | 19.0% | 9.0% |
| 2009 | 18.8% | 3.1% |
| 2010 | 20.4% | 2.0% |
| 2011 | 20.6% | 11.3% |
| 2012 | 20.3% | 6.8% |
| 2013 | 21.8% | 2.5% |
| 2014 | 21.3% | 1.0% |
Presence of COLA by sector
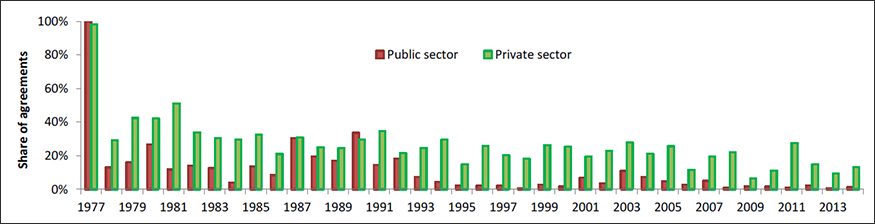
During 1977-2014, more than 25% of all private-sector settlements and around 10% of all public-sector settlements had COLA provisions during the last four decades. In both sectors, the share of agreements settled with a COLA clause declined over time [Figure 6]. For example, in 1980, the share of settlements with COLA in the public sector was 27%, whereas it was only 1% in 2014. In the private sector, 42% agreements had COLA provision in 1980, and the share declined to 13% in 2014. The decline of the proportion of private-sector settlements with COLA has been relatively mild compared to the public-sector ones, largely due to the stronger presence of COLA in the manufacturing industry, which is a private-sector industry.
Show Data Table
| Years | Public sector | Private sector |
|---|---|---|
| 1977 | 100% | 98% |
| 1978 | 13% | 29% |
| 1979 | 16% | 42% |
| 1980 | 27% | 42% |
| 1981 | 12% | 51% |
| 1982 | 14% | 34% |
| 1983 | 13% | 31% |
| 1984 | 4% | 30% |
| 1985 | 14% | 33% |
| 1986 | 8% | 21% |
| 1987 | 30% | 31% |
| 1988 | 20% | 25% |
| 1989 | 17% | 25% |
| 1990 | 34% | 29% |
| 1991 | 15% | 35% |
| 1992 | 18% | 22% |
| 1993 | 7% | 25% |
| 1994 | 4% | 30% |
| 1995 | 2% | 15% |
| 1996 | 2% | 26% |
| 1997 | 2% | 20% |
| 1998 | 0% | 18% |
| 1999 | 3% | 26% |
| 2000 | 2% | 25% |
| 2001 | 7% | 19% |
| 2002 | 4% | 23% |
| 2003 | 11% | 28% |
| 2004 | 7% | 21% |
| 2005 | 5% | 26% |
| 2006 | 3% | 12% |
| 2007 | 5% | 19% |
| 2008 | 1% | 22% |
| 2009 | 2% | 6% |
| 2010 | 2% | 11% |
| 2011 | 1% | 27% |
| 2012 | 2% | 15% |
| 2013 | 1% | 10% |
| 2014 | 1% | 13% |
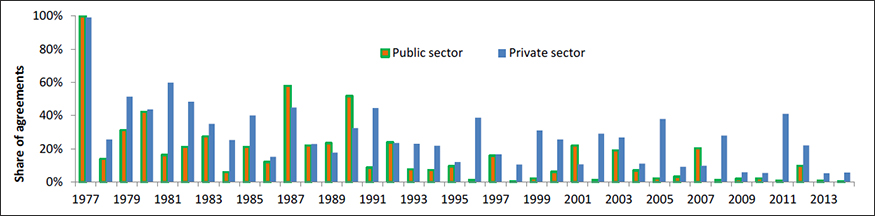
In terms of proportion of employees covered by a COLA clause, both sectors experienced a decline as well [Figure 7]. For example, in 1980, the proportion of public-sector employees covered by agreements with COLA was 42%, while the proportion of such employees in the private sector was 44%. These shares fell consistently to 0.4% and 6% respectively, by the end of 2014.
Show Data Table
| Years | Public sector | Private sector |
|---|---|---|
| 1977 | 100% | 99% |
| 1978 | 14% | 26% |
| 1979 | 31% | 51% |
| 1980 | 42% | 44% |
| 1981 | 16% | 60% |
| 1982 | 21% | 48% |
| 1983 | 27% | 35% |
| 1984 | 6% | 25% |
| 1985 | 21% | 40% |
| 1986 | 12% | 15% |
| 1987 | 58% | 45% |
| 1988 | 22% | 23% |
| 1989 | 23% | 18% |
| 1990 | 52% | 33% |
| 1991 | 9% | 44% |
| 1992 | 24% | 23% |
| 1993 | 8% | 23% |
| 1994 | 7% | 22% |
| 1995 | 10% | 12% |
| 1996 | 1% | 39% |
| 1997 | 16% | 17% |
| 1998 | 0% | 11% |
| 1999 | 2% | 31% |
| 2000 | 6% | 26% |
| 2001 | 22% | 11% |
| 2002 | 1% | 29% |
| 2003 | 19% | 27% |
| 2004 | 7% | 11% |
| 2005 | 2% | 38% |
| 2006 | 3% | 9% |
| 2007 | 20% | 10% |
| 2008 | 1% | 28% |
| 2009 | 2% | 6% |
| 2010 | 2% | 6% |
| 2011 | 1% | 41% |
| 2012 | 10% | 22% |
| 2013 | 1% | 5% |
| 2014 | 0.4% | 6% |
Presence of COLA by industry
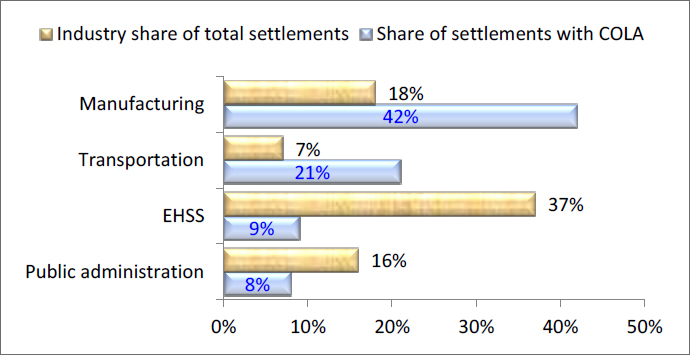
Among the major Footnote ii industries, manufacturing had the highest proportion of agreements (42%) settled with COLA during 1977-2014, followed by transportation (21%), as shown in Figure 8. Although, Education, health and social services had the largest share (37%) in total agreements settled during the study period, only 9% of those had a COLA clause in them.
Show Data Table
| Industry | Share of settlements with COLA | Industry share of total settlements |
|---|---|---|
| Public administration | 8% | 16% |
| EHSS | 9% | 37% |
| Transportation | 21% | 7% |
| Manufacturing | 42% | 18% |
All major industries experienced steady decline in the proportion of agreements settled with COLA annually [Figure 9]. The share of agreements settled with COLA in manufacturing was higher than that in any other industry. EHSS had a precipitous decline in settlements with COLA in 1992, and since 1995, there has been on average only one agreement settled with COLA annually.
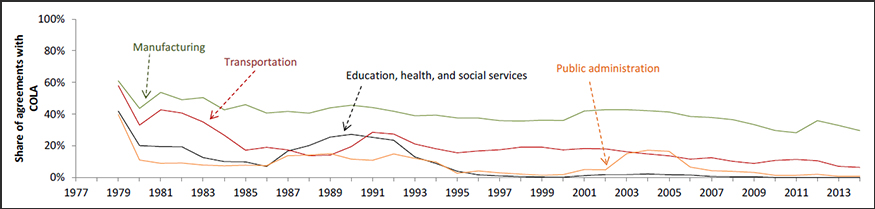
* Figures 9 and 10 show three year moving averages.
Show Data Table
| Years | Manufacturing | Education, health, and social services | Transportation | Public administration |
|---|---|---|---|---|
| 1977 | 100% | 100% | 100% | 100% |
| 1978 | 34% | 14% | 17% | 10% |
| 1979 | 49% | 11% | 57% | 9% |
| 1980 | 48% | 35% | 25% | 14% |
| 1981 | 64% | 12% | 46% | 4% |
| 1982 | 35% | 11% | 51% | 10% |
| 1983 | 52% | 14% | 8% | 10% |
| 1984 | 41% | 5% | 21% | 2% |
| 1985 | 45% | 10% | 23% | 11% |
| 1986 | 36% | 6% | 14% | 9% |
| 1987 | 44% | 34% | 16% | 21% |
| 1988 | 42% | 21% | 12% | 12% |
| 1989 | 46% | 22% | 15% | 12% |
| 1990 | 49% | 39% | 32% | 10% |
| 1991 | 38% | 15% | 38% | 10% |
| 1992 | 39% | 16% | 11% | 24% |
| 1993 | 40% | 7% | 14% | 2% |
| 1994 | 39% | 3% | 29% | 3% |
| 1995 | 34% | 1% | 4% | 2% |
| 1996 | 40% | 1% | 17% | 6% |
| 1997 | 34% | 1% | 32% | 0% |
| 1998 | 33% | 0% | 8% | 0% |
| 1999 | 42% | 0% | 17% | 4% |
| 2000 | 33% | 0% | 26% | 1% |
| 2001 | 51% | 3% | 11% | 9% |
| 2002 | 44% | 2% | 17% | 4% |
| 2003 | 33% | 1% | 21% | 32% |
| 2004 | 49% | 4% | 7% | 16% |
| 2005 | 41% | 0% | 13% | 1% |
| 2006 | 25% | 0% | 14% | 2% |
| 2007 | 47% | 1% | 10% | 9% |
| 2008 | 38% | 0% | 6% | 0% |
| 2009 | 16% | 0% | 10% | 0% |
| 2010 | 36% | 0% | 16% | 4% |
| 2011 | 33% | 0% | 8% | 0% |
| 2012 | 38% | 0% | 7% | 2% |
| 2013 | 27% | 0% | 5% | 0% |
| 2014 | 24% | 0% | 6% | 0% |
* Figures 9 and 10 show three year moving averages.
While the proportion of employees covered by a COLA clause has substantially declined in EHSS, and in public administration, it remained fairly stable in transportation and in manufacturing since early 1990s [Figure 10]. One reason for this could be the duration of agreements. The average duration of agreements in both manufacturing and transportation tended to be consistently longer than in other industries. Employees, in these two industries, might have inclined to negotiate a COLA clause in their agreements as an insurance against hike in inflation over the period of their contracts which is relatively longer.
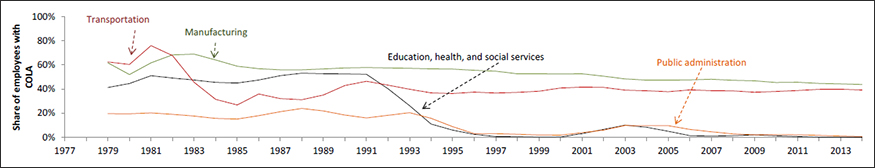
* Figures 9 and 10 show three year moving averages.
Show Data Table
| Years | Manufacturing | Education, health, and social services | Transportation | Public administration |
|---|---|---|---|---|
| 1977 | 89% | 41% | 82% | 20% |
| 1978 | 44% | 29% | 29% | 19% |
| 1979 | 52% | 54% | 76% | 20% |
| 1980 | 60% | 51% | 76% | 19% |
| 1981 | 73% | 49% | 76% | 21% |
| 1982 | 72% | 48% | 52% | 16% |
| 1983 | 62% | 46% | 9% | 15% |
| 1984 | 58% | 43% | 33% | 15% |
| 1985 | 56% | 46% | 37% | 15% |
| 1986 | 56% | 53% | 37% | 23% |
| 1987 | 55% | 54% | 22% | 25% |
| 1988 | 56% | 52% | 35% | 23% |
| 1989 | 58% | 52% | 49% | 17% |
| 1990 | 58% | 54% | 45% | 15% |
| 1991 | 57% | 51% | 45% | 16% |
| 1992 | 57% | 16% | 39% | 24% |
| 1993 | 57% | 11% | 35% | 21% |
| 1994 | 56% | 5% | 36% | 2% |
| 1995 | 56% | 1% | 37% | 3% |
| 1996 | 54% | 1% | 39% | 4% |
| 1997 | 54% | 0% | 34% | 2% |
| 1998 | 50% | 0% | 39% | 2% |
| 1999 | 54% | 0% | 41% | 2% |
| 2000 | 54% | 0% | 42% | 2% |
| 2001 | 50% | 8% | 41% | 8% |
| 2002 | 48% | 11% | 41% | 8% |
| 2003 | 47% | 11% | 35% | 13% |
| 2004 | 47% | 3% | 39% | 8% |
| 2005 | 48% | 1% | 38% | 7% |
| 2006 | 47% | 0% | 40% | 4% |
| 2007 | 49% | 2% | 38% | 2% |
| 2008 | 45% | 2% | 37% | 2% |
| 2009 | 46% | 2% | 37% | 2% |
| 2010 | 44% | 0% | 40% | 2% |
| 2011 | 46% | 0% | 40% | 2% |
| 2012 | 43% | 0% | 40% | 1% |
| 2013 | 43% | 0% | 40% | 1% |
| 2014 | 45% | 0% | 38% | 1% |
* Figures 9 and 10 show three year moving averages.
COLA clauses and wage disparity
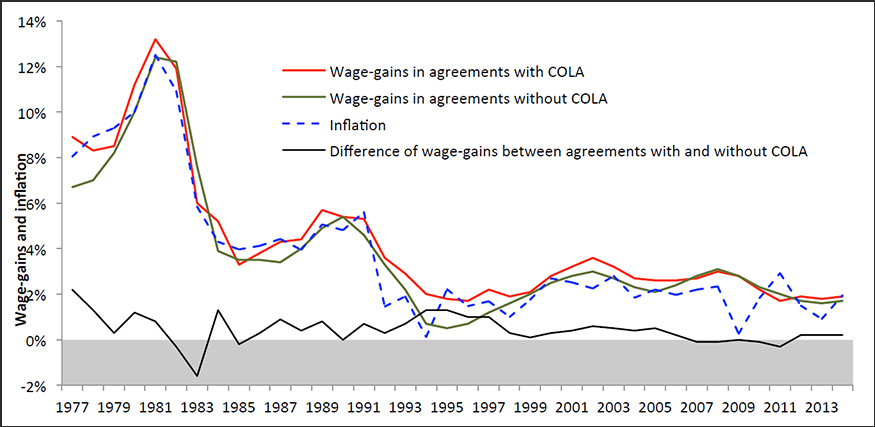
In terms of annual wage adjustments, employees covered by agreements with COLA had some advantages over those covered by agreements without COLA, although such advantages were not substantial. The annual average wage adjustments for both groups tended to move hand in hand with the rate of inflation. As shown in Figure 11, the difference between the average wage adjustments mostly remained below 1.0% and since 2007, it has almost disappeared. This similarity in wage gains between agreements with and without COLA might have resulted partly from the fact that inflation was not high enough to trigger a COLA clause and consequently, additional wage increases were not realized. Footnote iii
Show Data Table
| Years | Wage-gains in agreement with COLA | Wage-gains in agreement without COLA | Inflation | Difference in wage gains |
|---|---|---|---|---|
| 1977 | 8.9% | 6.7% | 8.0% | 2.2% |
| 1978 | 8.3% | 7.0% | 8.9% | 1.3% |
| 1979 | 8.5% | 8.2% | 9.3% | 0.3% |
| 1980 | 11.2% | 10.0% | 10.0% | 1.2% |
| 1981 | 13.2% | 12.4% | 12.5% | 0.8% |
| 1982 | 11.9% | 12.2% | 10.9% | -0.3% |
| 1983 | 6.0% | 7.6% | 5.8% | -1.6% |
| 1984 | 5.2% | 3.9% | 4.3% | 1.3% |
| 1985 | 3.3% | 3.5% | 4.0% | -0.2% |
| 1986 | 3.8% | 3.5% | 4.1% | 0.3% |
| 1987 | 4.3% | 3.4% | 4.4% | 0.9% |
| 1988 | 4.4% | 4.0% | 3.9% | 0.4% |
| 1989 | 5.7% | 4.9% | 5.1% | 0.8% |
| 1990 | 5.4% | 5.4% | 4.8% | 0.0% |
| 1991 | 5.3% | 4.6% | 5.6% | 0.7% |
| 1992 | 3.6% | 3.3% | 1.4% | 0.3% |
| 1993 | 2.9% | 2.2% | 1.9% | 0.7% |
| 1994 | 2.0% | 0.7% | 0.1% | 1.3% |
| 1995 | 1.8% | 0.5% | 2.2% | 1.3% |
| 1996 | 1.7% | 0.7% | 1.5% | 1.0% |
| 1997 | 2.2% | 1.2% | 1.7% | 1.0% |
| 1998 | 1.9% | 1.6% | 1.0% | 0.3% |
| 1999 | 2.1% | 2.0% | 1.8% | 0.1% |
| 2000 | 2.8% | 2.5% | 2.7% | 0.3% |
| 2001 | 3.2% | 2.8% | 2.5% | 0.4% |
| 2002 | 3.6% | 3.0% | 2.2% | 0.6% |
| 2003 | 3.2% | 2.7% | 2.8% | 0.5% |
| 2004 | 2.7% | 2.3% | 1.8% | 0.4% |
| 2005 | 2.6% | 2.1% | 2.2% | 0.5% |
| 2006 | 2.6% | 2.4% | 2.0% | 0.2% |
| 2007 | 2.7% | 2.8% | 2.2% | -0.1% |
| 2008 | 3.0% | 3.1% | 2.3% | -0.1% |
| 2009 | 2.8% | 2.8% | 0.3% | 0.0% |
| 2010 | 2.2% | 2.3% | 1.8% | -0.1% |
| 2011 | 1.7% | 2.0% | 2.9% | -0.3% |
| 2012 | 1.9% | 1.7% | 1.5% | 0.2% |
| 2013 | 1.8% | 1.6% | 0.9% | 0.2% |
| 2014 | 1.9% | 1.7% | 2.0% | 0.2% |
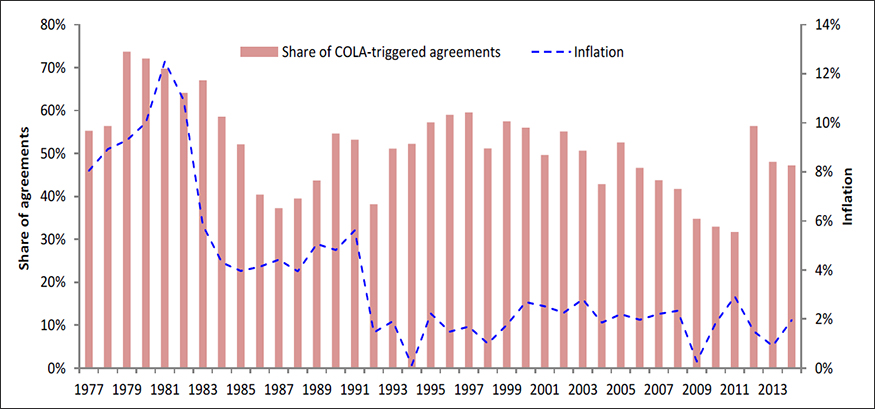
In reality, only a proportion of agreements settled with COLA had their COLA clause triggered (Figure 12). During 1977-1981, when inflation was on the rise, 65% of COLA agreements had their COLA clause triggered. This proportion has declined to 50% during 1982-1992, when inflation was mostly in decline. Since 1993, since the inflation rate has been mostly low and stable, only less than half of COLA agreements had their COLA clause come into effect. This implies that most COLA clauses in agreements ratified in recent times had the trigger mark set too high compared to the prevailing inflation rate and the employees could not realize any benefit from the clauses. Consequently, the COLA clause was losing its relevance to unions. A COLA clause serves as an insurance to the union members against economic uncertainty, in particular a rise in inflation. Negotiating a trigger level that is too high for the clause to come into effect might have resulted from different motivations of the bargaining parties. Firstly, unions, given the trend of stable inflation, might have negotiated the ‘high’ trigger mark just to add one more layer of protection against an unlikely sharp unanticipated rise in inflation. Employers, on the other hand, might have also offered the COLA clause with high trigger mark knowing that the COLA clause will very unlikely come into effect. Should inflation remain below the trigger level, the COLA clause will not cost anything to the employer. Nonetheless, coming to an agreement over a COLA clause with the employees could help develop healthy labour relations at the workplace.
Show Data Table
| Years | Share of COLA-triggered agreements | Inflation |
|---|---|---|
| 1977 | 55% | 8.0% |
| 1978 | 56% | 8.9% |
| 1979 | 74% | 9.3% |
| 1980 | 72% | 10.0% |
| 1981 | 70% | 12.5% |
| 1982 | 64% | 10.9% |
| 1983 | 67% | 5.8% |
| 1984 | 59% | 4.3% |
| 1985 | 52% | 4.0% |
| 1986 | 40% | 4.1% |
| 1987 | 37% | 4.4% |
| 1988 | 39% | 3.9% |
| 1989 | 44% | 5.1% |
| 1990 | 55% | 4.8% |
| 1991 | 53% | 5.6% |
| 1992 | 38% | 1.4% |
| 1993 | 51% | 1.9% |
| 1994 | 52% | 0.1% |
| 1995 | 57% | 2.2% |
| 1996 | 59% | 1.5% |
| 1997 | 60% | 1.7% |
| 1998 | 51% | 1.0% |
| 1999 | 57% | 1.8% |
| 2000 | 56% | 2.7% |
| 2001 | 50% | 2.5% |
| 2002 | 55% | 2.2% |
| 2003 | 51% | 2.8% |
| 2004 | 43% | 1.8% |
| 2005 | 53% | 2.2% |
| 2006 | 47% | 2.0% |
| 2007 | 44% | 2.2% |
| 2008 | 42% | 2.3% |
| 2009 | 35% | 0.3% |
| 2010 | 33% | 1.8% |
| 2011 | 32% | 2.9% |
| 2012 | 56% | 1.5% |
| 2013 | 48% | 0.9% |
| 2014 | 47% | 2.0% |
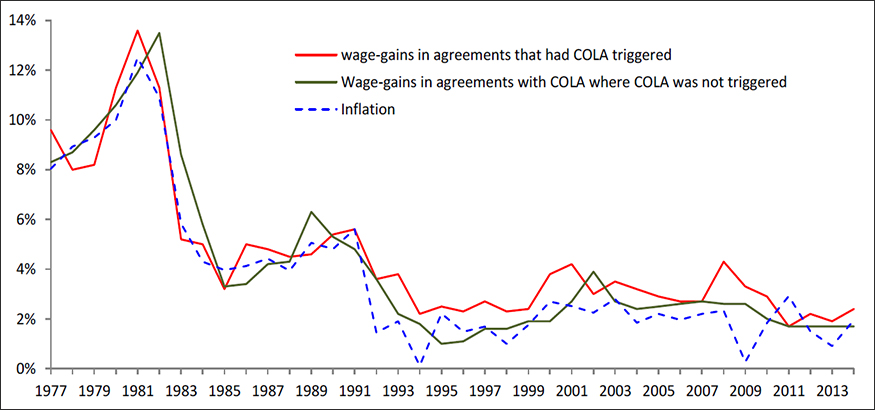
In terms of wage adjustments, as expected, the employees who were subject to a triggered COLA clause, received higher gains than those with a non-triggered COLA clause, for the most part of the study period [Figure 13]. As mentioned earlier, among all agreements settled during the study period, only a very small proportion had a COLA clause in them. Within those settlements, almost more than half never had the clause triggered. This comes as no surprise since inflation has been stable and low enough to prevent the COLA clause from coming into effect.
Show Data Table
| Years | Wage-gains in agreements that had COLA triggered | Wage-gains in agreements with COLA where COLA was not triggered | Inflation |
|---|---|---|---|
| 1977 | 9.6% | 8.3% | 8.0% |
| 1978 | 8.0% | 8.7% | 8.9% |
| 1979 | 8.2% | 9.6% | 9.3% |
| 1980 | 11.3% | 10.6% | 10.0% |
| 1981 | 13.6% | 11.9% | 12.5% |
| 1982 | 11.3% | 13.5% | 10.9% |
| 1983 | 5.2% | 8.6% | 5.8% |
| 1984 | 5.0% | 5.8% | 4.3% |
| 1985 | 3.2% | 3.3% | 4.0% |
| 1986 | 5.0% | 3.4% | 4.1% |
| 1987 | 4.8% | 4.2% | 4.4% |
| 1988 | 4.5% | 4.3% | 3.9% |
| 1989 | 4.6% | 6.3% | 5.1% |
| 1990 | 5.4% | 5.3% | 4.8% |
| 1991 | 5.6% | 4.8% | 5.6% |
| 1992 | 3.6% | 3.6% | 1.4% |
| 1993 | 3.8% | 2.2% | 1.9% |
| 1994 | 2.2% | 1.8% | 0.1% |
| 1995 | 2.5% | 1.0% | 2.2% |
| 1996 | 2.3% | 1.1% | 1.5% |
| 1997 | 2.7% | 1.6% | 1.7% |
| 1998 | 2.3% | 1.6% | 1.0% |
| 1999 | 2.4% | 1.9% | 1.8% |
| 2000 | 3.8% | 1.9% | 2.7% |
| 2001 | 4.2% | 2.7% | 2.5% |
| 2002 | 3.0% | 3.9% | 2.2% |
| 2003 | 3.5% | 2.7% | 2.8% |
| 2004 | 3.2% | 2.4% | 1.8% |
| 2005 | 2.9% | 2.5% | 2.2% |
| 2006 | 2.7% | 2.6% | 2.0% |
| 2007 | 2.7% | 2.7% | 2.2% |
| 2008 | 4.3% | 2.6% | 2.3% |
| 2009 | 3.3% | 2.6% | 0.3% |
| 2010 | 2.9% | 2.0% | 1.8% |
| 2011 | 1.7% | 1.7% | 2.9% |
| 2012 | 2.2% | 1.7% | 1.5% |
| 2013 | 1.9% | 1.7% | 0.9% |
| 2014 | 2.4% | 1.7% | 2.0% |
Other factors contributing to COLA’s declining relevance
On the whole, two major factors have contributed to the declining relevance of COLA over 1977-2014. First, in a low and stable inflationary environment, the risk of facing unanticipated inflation is quite low and therefore an ‘insurance’ against such risks (COLA) has lost its relevance. Consequently, wage negotiators seemed to have shifted their focus from COLA clauses to more relevant areas, such as job security, pay equity, pension and other benefits. Second, unions quest for other innovative clauses such as the ones that allow increases in wages in response to growth in GDP, or in oil prices.
Key findings
- The share of agreements that are settled with COLA annually has been declining steadily since early 1990s.
- The proportion of employees covered by a COLA clause has been declining as well.
- In the federal jurisdiction, the decline in the share of settlements with COLA has been relatively mild, compared to other jurisdictions.
- Among the major industries, the proportion of employees covered by COLA has sharply declined in public administration and EHSS. However, the decline has been moderate in manufacturing and transportation. This could be partly due to relatively longer contract duration in these industries.
- In terms of annualized average wage adjustments, employees covered by agreements with COLA did not consistently have any substantial advantages over those covered by agreements without COLA. The wage disparity between the two groups has almost disappeared over the last four years.
- The average wage gain recorded by the COLA-triggered agreements has been consistently higher than the one recorded by the agreements that never had the COLA triggered. However, over the last two decades, as inflation remained low and stable, more than half of the COLA agreements never had the clause come into effect.
Reference
- Christofides, L. and Peng, A. (2010). Labor Contract Duration, Indexation, and Wage Adjustment: Interdependence and Inflation Propagation Mechanisms. Industrial Relations, Vol. 49, No. 2
- Statistics Canada (2005). Collective Bargaining Priorities. Perspectives; Catalogue no. 75-001-XIE, pp-5-10
Footnotes
- Footnote i
-
Major collective agreements cover 500 or more employees across Canada.
- Footnote ii
-
Manufacturing, education, health, and social services (EHSS), transportation, and public administration, in combined, represent 82% of all agreements settled during 1977-2014. For the purpose of this analysis, these four are considered major industries.
- Footnote iii
-
Identifying the agreements that had a COLA clause but never triggered could provide more insight into the wage non-disparity between agreements with COLA and those without COLA. However, such data was not available at the time of this analysis.