
Occupational chemical agent compliance sampling guideline
Official title: Canadian Occupational Chemical Agent Compliance Sampling Guideline, August 14, 2015
Upcoming changes to regulations under Part II of the Canada Labour Code
Introducing amendments to regulations under Part II of the Canada Labour Code
Alternate formats

On this page
- 1. Purpose
- 2. Scope
- 3. Issue
- 4. Background
- 5. Policy intention
- 6. Definitions
- 7. Procedures
- 7.1 Considerations for conduction sampling
- 7.2 Sampling for the TWA value based on an 8-hour work shift exposure
- 7.3 Sampling for STEL values of a hazardous substance based on 15 minute exposures
- 7.4 Sampling for a ceiling value (C) of a hazardous substance
- 7.5 Sampling for excursion limits
- 7.6 Sampling for an adjusted TLV
- 7.7 Sampling and analysis quality control measures
1. Purpose
This guideline will help Labour Program (LP) industrial hygiene specialists, employers, and industrial hygiene consultants in interpreting the sampling requirement regulations and in taking samples for compliance with Part X of the Canada Occupational Health and Safety Regulations (COHSR), “Hazardous Substances”Footnote 1.
2. Scope
This procedure should be used when measurements of airborne chemical concentrations in federally regulated work places are taken by a qualified person to verify compliance regarding worker exposure to a chemical agent as per the requirements in Part X of the COHSR “Hazardous Substances”. Following this procedure will ensure a uniform approach and yield consistent results.
3. Issue
How should personal air sampling in a work place be conducted for:
- TLV-TWA or OEL-TWA (8-hour)?
- TLV-STEL or OEL-STEL (15-minute)?
- TLV-C or OEL-C (peak concentration)?
See Section 6 for an explanation of these terms.
4. Background
Briefly, Part X of the COHSR requires:
- chemical sampling of work place air for the entire work shift;
- use of a National Institute for Occupational Safety and Health (NIOSH) method or any other scientifically proven method based on active sampling.
In addition, Canada Labour Code, Part IIFootnote 2 requires an employee member of the work place health and safety committee or health and safety representative be present at least at the beginning of the compliance sampling.
5. Policy intention
Subsection 10.19(1) of the COHSR states that:
- 10.19(1) An employee shall be kept free from exposure to a concentration of
(a) an airborne chemical agent in excess of the value for that chemical agent adopted by the American Conference of Governmental Industrial Hygienists, in its publication entitled Threshold Limit Values and Biological Exposure Indices, as amended from time to timeFootnote 1.
- 10.19(3) where there is a likelihood that the concentration of an airborne chemical agent may exceed the value referred to in subsection (1), air samples shall be taken and the concentration of the chemical agent shall be determinedFootnote 1
(b) in accordance with the standards set out by the United States National Institute for Occupational Safety and Health in the NIOSH Manual of Analytical Methods, fourth edition, volumes 1 and 2, as amended from time to time;
(c) in accordance with a method that collects and analyses a representative sample of the chemical agent with accuracy and with detection levels at least equal to those which would be obtained if the standards referred to in paragraph (b) were used; or
(d) where no specific standards for the chemical agent are set out in the publications referred to in paragraph (b) and no method is available under paragraph (c), in accordance with a scientifically proven method used to collect and analyse a representative sample of the chemical agentFootnote 1.
While the following requirements are not yet contained in the regulations, it is strongly recommended that work place parties follow these guidelines:
- Where there is a likelihood that the concentration of an airborne chemical agent may exceed the value referred to in subsection 10.19(1), samples shall be taken to evaluate an employee’s exposure to the airborne contaminant.
- Air samples shall be obtained from the breathing zone of the most highly exposed employees as determined by a qualified person.
- When sampling measurements are to be compared with a TLV-TWA or OEL-TWA, the airborne chemical agent shall be sampled over the full work shift.
- When sampling measurements are to be compared with a TLV-STEL or OEL-STEL, the airborne chemical agent shall be sampled for 15 minutes during the periods of maximum concentration as determined by a qualified person. A minimum of three samples shall be taken. If the airborne chemical agent is generated for a period of 45 minutes or less, consecutive 15-minute samples shall be taken for the entire duration of the work activity. The highest of all measurements shall be compared with the TLV-STEL or OEL-STELFootnote 1.
- When sampling measurements are to be compared with a TLV-C or OEL-C, the airborne chemical agent shall be sampled instantaneously as determined by a qualified person. If instantaneous measurements are not available, sampling shall be conducted for the minimum period of time sufficient to detect exposures at or above the TLV-C or OEL-CFootnote 1.
6. Definitions
Breathing zone
Breathing zone means a hemisphere of 300 mm radius extending in front of a person’s face and measured from the midpoint of an imaginary line joining the earsFootnote 3.
Dermal sensitization notation (DSEN)
Warns of an agent to produce dermal sensitizationFootnote 4.
Excursion limits (ELs)
For many substances with a TLV-TWA, there is no TLV-STEL. Nevertheless, excursions above the TLV-TWA should be controlled, even where the 8-hour
TLV-TWA is within recommended limits. Excursion limits apply to those TLV-TWAs that do not have TLV-STELsFootnote 4.
Excursions in worker exposure levels may exceed 3 times the TLV-TWA for no more than a total of 30 minutes during a workday, and under no circumstances should they exceed 5 times the TLV-TWA, provided that the TLV-TWA is not exceededFootnote 4.
It is often difficult to directly measure brief excursions that exceed 5 times the TLV-TWA. However, the geometric standard deviation (GSD) of short term exposures can be used to estimate excursion limit measurements. For example, if the true GSD of short-term exposures is three, then about 7% of all values will, in fact, exceed 5 times the geometric mean (GM). Refer to the ACGIH publications, Threshold Limit Values and Biological Exposure Indices and Modern Industrial HygieneFootnote 5.
Fibre per cubic centimetre (f/cc)
A measure of concentration of a fibrous substance in air. It describes the number of fibres per cubic centimetre (cc) of airFootnote 4.
Geometric mean (GM)
The measure of central tendency in a lognormal distribution is the antilog of the mean logarithm of the sample values. The distribution is skewed, and the geometric mean is always smaller than the arithmetic mean by an amount that depends on the geometric standard deviationFootnote 4.
Geometric standard deviation (GSD)
A measure of the variability of the sample data. In the lognormal distribution, the GSD is the antilog of the standard deviation of the sample value logarithms, and 68.26% of all values lie between GM / GSD and GM x GSD. A GSD of 1.0 occurs when the data points have no variability. GSDs of approximately 2.0 are common in workplaces. A GSD of 2.0 means that 5% of all values will exceed 3.13 times the geometric mean. A GSD greater than 2.0 is considered high variability and indicates inconsistent control of worker exposuresFootnote 4.
Lower confidence limit (LCL)
The LCL should be calculated when many measurements are taken at a work place for the purpose of an industrial hygiene monitoring program as part of the internal responsibility system. If a measured sampling value is slightly greater than its respective TLV or OEL, then the LCL should be calculated. If the LCL subtracted from the measured sampling value is still greater than the TLV or OEL, then there is non-compliance. Refer to the NIOSH publication, Occupational Exposure Sampling Strategy Manual for LCL formulas and example calculationsFootnote 6.
The NIOSH Occupational Exposure Sampling Strategy Manual is used to calculate the UCL and LCL of samples that are close to the TLV or OELFootnote 6.
When sampling for a full period, use the formulas belowFootnote 6:
X (capital X) = full period sample value
STD = TWA-TLV or 8-hour OEL
x (lowercase x) = transformed sample value
1.645 = 95% point (one-sided) of the normal distribution
(CVT) = coefficient of variation for the sampling/analytical method as stated on the associated method
x (lowercase x)= X(capital X)/(divided by)STD
UCL (95%) = x + [(1.645)x(multiplied by)(CVT)]
LCL (95%) = x – [(1.645)x(multiplied by)(CVT)]
If the UCL (95%) < 1, then compliance exists at a 95% confidence level. This is the employer’s test for compliance.
If the LCL (95%) < 1 and the UCL (95%) > 1, then non-compliance exists at a 95% confidence level.
If the LCL (95%) > 1, then non-compliance exists at a 95% confidence level. This is the compliance officer’s test for non-complianceFootnote 6.
Example
Using alpha-chloroacetophenone (2-chloroacetophenone) Footnote 6
X = 0.04 ppm
STD = 0.05 ppm
CVT = 0.09
x(lowercase x) = 0.04 ppm/(divided by)0.05 ppm
x = 0.8
Note: no LCL is required, since the value of x is below 1.0.
UCL (95%) = 0.8 + [(1.645)x(multiplied by)(0.09)]
UCL (95%) = 0.95
The UCL (95%) value of 0.95 is less than 1.0, so compliance exists at a 95% confidence levelFootnote 6.
Milligram per cubic metre (mg/m3)
A measure of concentration of a particulate substance in air. It is a mass per volume unit. The mass of the hazardous substance is measured in the metric unit of the milligram (mg), while the volume of work place air sampled is measured in the metric unit of the cubic metre (m3). 1 m3 = 1000 litres (L)Footnote 3.
Occupational exposure limit (OEL)
Labour Program regulatory limit for an airborne hazardous substance. The relevant OEL for a hazardous substance is to be used when specified instead of the corresponding ACGIH® TLV®.
Particle Size-Selective sampling criteria for airborne particulate matter
The Particle Size-Selective TLVs® (PSS-TLVs) are expressed in three forms:
- Inhalable Particulate Matter TLVs® (IPM-TLVs) for those materials that are hazardous when deposited anywhere in the respiratory tract.
- Thoracic Particulate Matter TLVs® (TPM-TLVs) for those materials that are hazardous when deposited anywhere within the lung airways and the gas-exchange region.
- Respirable Particulate Matter TLVs® (RPM-TLVs) for those materials that are hazardous when deposited in the gas-exchange regionFootnote 4.
Particles (insoluble or poorly soluble) not otherwise specified (PNOS)
Particles that: Do not have an applicable TLV; are insoluble or poorly soluble in water (or, preferably, in aqueous lung fluid if data are available); and have low toxicity (i.e., are not cytotoxic, genotoxic, or otherwise chemically reactive with lung tissue, and do not emit ionizing radiation, cause immune sensitization, or cause toxic effects other than by inflammation or the mechanisms of “lung overload”)Footnote 4.
ACGIH® believes that even biologically inert, insoluble, or poorly soluble particles may have adverse effects and recommends that airborne concentrations should be kept below 3 mg/m3, respirable particles; and 10 mg/m3, inhalable particles, until such time as a TLV® is set for a particular substanceFootnote 4.
Part per million (ppm)
A measure of concentration of a vapour or gas in air. It is a volume per volume unit. The unit ppm is an abbreviation of the term part per millionFootnote 3.
Respiratory sensitization notation (RSEN)
Warns of an agent to produce respiratory sensitizationFootnote 4.
Skin notation (Skin)
The designation “Skin” in the “Notations” column refers to the potential significant contribution to the overall exposure by the cutaneous route, including mucous membranes and the eyes, by contact with vapors, liquids, and solidsFootnote 4.
Threshold limit value–Ceiling (TLV-C)
The concentration that should not be exceeded during any part of the working exposure. If instantaneous measurements are not available, sampling should be conducted for the minimum period of time sufficient to detect exposures at or above the ceiling valueFootnote 4.
Threshold limit value-Short-term exposure limit (TLV-STEL)
A 15-minute TWA exposure that should not be exceeded at any time during a workday, even if the 8-hour TWA is within the TLV-TWA. The TLV-STEL is the concentration to which it is believed that workers can be exposed continuously for a short period of time without suffering from 1) irritation, 2) chronic or irreversible tissue damage, 3) dose-rate-dependent toxic effects, or 4) narcosis of sufficient degree to increase the likelihood of accidental injury, impaired self-rescue, or materially reduced work efficiency. The TLV-STEL will not necessarily protect against these effects if the daily TLV-TWA is exceededFootnote 4.
Threshold limit value-Time-weighted average (TLV-TWA)
The TWA concentration for a conventional 8-hour workday and 40-hour workweek, to which it is believed that nearly all workers may be repeatedly exposed, day after day, for a working lifetime without adverse effectFootnote 4.
Threshold limit values (TLVs®)
A threshold limit value refers to an airborne concentration of a chemical substance and represents conditions under which it is believed that nearly all workers may be repeatedly exposed, day after day, over a working lifetime, without adverse health effects. It is a health-based value. TLVs are determined at normal temperature and pressure (NTP). Note: A correction factor shall be applied to sampled values taken at work place conditions that differ from NTP. Refer to the ACGIH publication, Threshold Limit Values and Biological Exposure IndicesFootnote 4.
Upper confidence limit (UCL)
The UCL should be calculated when many measurements are taken at a work place for the purpose of an industrial hygiene monitoring program as part of the internal responsibility system. If a measured sampling value is less than, but close to its respective TLV or OEL, then the UCL should be calculated. If the UCL added to the measured sampling value is still less than the TLV or OEL, then there is compliance. Refer to the NIOSH publication, Occupational Exposure Sampling Strategy Manual for UCL formulas and example calculationsFootnote 6.
7. Procedures
7.1 Considerations for conducting sampling
Complaint or work refusal:
In the event of an occupational health and safety complaint from an employee or a work refusal from an employee, refer to the Labour publications, “Information on occupational health and safety:
- 3 – Internal complaint resolution process” and “Information on occupational health and safety:
- 4 – Right to refuse dangerous work”Footnote 7,Footnote 8.
Field blanks
Follow the requirements and recommendations of the sampling method being used with regard to the number of field blanks. The field blanks must be the same in every way as the actual sampling media. The field blanks must also be handled in the same manner as the actual sampling media, but are not connected to a pump.
Lunch break
The pump should be stopped during the lunch break and placed in a non-contaminated area and it must be assumed that the worker had no exposure to the substance being sampled for that time period.
Depending on the circumstances, a qualified person may decide to let the sampling pump continue to operate during the lunch break at the workstation of the worker being sampled. The worker shall then resume wearing the sampling pump after the lunch break.
Note: The status and location of the sampling pump during the lunch break must be recorded in the sampling report. An explanation of the circumstances of not sampling or sampling during the lunch break should be included in the interpretation of the sampling results.
Skin notation and sensitization notation
When sampling for a hazardous substance that has a skin notation (Skin) as part of its TLV entry, extra consideration should be given to the dermal and ingestion routes of exposure.
When sampling for a hazardous substance that has a dermal sensitization notation (DSEN) or respiratory sensitization notation (RSEN) as part of its TLV entry, extra consideration should be given to further reducing worker exposures through control measuresFootnote 4.
Threshold limit values for mixtures
Most threshold limit values are developed for a single chemical substance. However, the work environment is often composed of multiple chemical exposures both simultaneously and sequentially. It is recommended that multiple exposures that comprise such work environments be examined to assure that workers do not experience harmful effects.
There are several possible modes of chemical mixture interaction. Additivity occurs when the combined biologic effect of the components is equal to the sum of each of the agents given alone. Synergy occurs where the combined effect is greater than the sum of each agent. Antagonism occurs when the combined effect is lessFootnote 4.
The general ACGIH® mixture formula applies to the additive model. It is utilized when additional protection is needed to account for this combined effect. This guidance does not apply to substances in mixed phases.
The “TLV® Basis” column found in the table of Adopted Values lists the adverse effect(s) upon which the TLV® is based. This column is a resource that may help alert the reader to the additive possibilities in a chemical mixture and the need to reduce the combined TLV® of the individual components. Note that the column does not list the deleterious effects of the agent, but rather, lists only the adverse effect(s) upon which the threshold limit was based. The current Documentation of the TLVs® and BEIs® should be consulted for toxic effects information, which may be of use when assessing mixture exposuresFootnote 4.
When two or more hazardous substances have a similar toxicological effect on the same target organ or system, their combined effect, rather than that of either individually, should be given primary consideration. In the absence of information to the contrary, different substances should be considered as additive where the health effect and target organ or system is the same.
If the below inequality is true for a mixture of two or more hazardous substances with additive effects, then a worker overexposure has not occurred. In the below inequality, C is a measured concentration of a hazardous substance and T is the corresponding TLV or OELFootnote 4.
C1/T1 + C2/T2 + … Cn/Tn < (less than) 1
Mixture example
A mixture of two chemicals are presented below that both affect the central nervous system (CNS), since both chemicals have a “CNS impair” TLV BasisFootnote 4. The first chemical in this example is tetrachloroethylene and the second chemical is n-hexane. The average TWA measurement in an example work place and corresponding TLV-TWA are used for each chemical in the below inequality.
C1/T1 + C2/T2 + … Cn/Tn < (less than) 1
16 ppm/25 ppm + 24 ppm/50 ppm < (less than) 1
0.64 + 0.48 > (more than) 1
1.12 > (more than) 1
Even though the individual worker exposures to tetrachloroethylene and n-hexane are below their respective TLV-TWAs, they combine to cause an overexposure to the CNS. Efforts should be made to reduce worker exposure to these two chemicals through engineering controls.
7.2 Sampling for a TWA value based on an 8-hour work shift exposure
The entire 8-hour work day must be sampled. To verify compliance, the worst case exposed workers should be sampled. The obtained results must be compared to the corresponding TLV-TWA or OEL-TWA.
Note: To conduct industrial hygiene sampling for other purposes such as identifying trends, estimating the size of an exposure problem, identifying specific targets for exposure prevention strategies, work place prevention programs, occupational disease surveillance programs, or research, refer to the NIOSH publication, Occupational Exposure Sampling Strategy ManualFootnote 6.
Examples
Toluene Vapour
2015 ACGIH TLV-TWA: 20 ppm
NIOSH method 1501 was usedFootnote 10
Equipment: glass tube (7 cm long, 6-mm OD, 4-mm ID, flame-sealed ends, containing two sections of activated coconut shell charcoal (front = 100 mg, back = 50 mg) separated by a 2-mm urethane foam plug. A silylated glass wool plug precedes the front section and a 3-mm urethane foam plug follows the back section. Tubes are commercially available).
Personal air sampling pump with flexible connecting tubingFootnote 10.
Three consecutive 160-minute samples were taken over the entire 8-hour work shift of 9:00 to 17:00 (9 am to 5 pm). All three samples used a flow rate of 0.04 L/min in order to remain within the required volume range of the method for toluene sampling. 6.4 L of air were passed through each sample media, which is within the 1 L to 8 L volume range.
All the samples were sent to a laboratory for analysis. The results obtained are as follows:
Sample 1 (9:00-11:40):
20 ppm average toluene concentration sampled in 6.4 L (0.0064 m3) of airSample 2 (11:40-14:20):
10 ppm average toluene concentration sampled in 6.4 L (0.0064 m3) of airSample 3 (14:20-17:00):
37 ppm average toluene concentration sampled in 6.4 L (0.0064 m3) of air
In order to calculate worker exposure to toluene vapour during the entire work shift, the following equation must be used:
TWA = [(C1xT1)+(C2xT2)+…+(CnxTn)]/(T1+T2+…+Tn)
The sum of the multiplications (C1-nT1-n) divided by the sum of T1-n
Calculation of TWA based on the lab results:
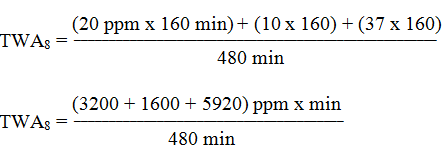
TWA8 = 22.3 ppm
The measured TWA of 22.3 ppm is greater than the TLV-TWAtoluene of 20 ppm. Therefore, the sampling results indicate a worker overexposure and non-compliance in this case.
7.3 Sampling for STEL values of a hazardous substance based on 15-minute exposures
Some substances that have a TLV-TWA also have a TLV-STEL, which is a 15-minute TWA exposure that should not be exceeded at any time during a workday, even if the 8-hour TWA is within the TLV-TWA. It is possible for the TLV-TWA of a chemical to not be exceeded, but the corresponding TLV-STEL may be exceeded during the same time as the TWA measurements. A minimum of 3 samples of 15 minutes in duration must be sampled at the peak exposure of the chemical of interest. The worst case exposed workers shall be sampled. The measured values shall be directly compared to the corresponding TLV-STEL or OEL-STELFootnote 4.
Example
Hydrogen sulfide (H2S) gas
2015 ACGIH TLV-STEL: 5 ppm
NIOSH method 6013 was usedFootnote 11
Equipment: Sampler: glass tube, 10 cm long, 8-mm OD, 6-mm ID, flame-sealed ends with plastic caps, containing 20/40 mesh activated (600°C) coconut shell charcoal (front = 400 mg, back = 200 mg) separated by a 6-mm urethane foam plug. A silyated glass wool plug precedes the front section and a 6-mm urethane foam plug follows the back section. Pressure drop across the tube at 1 L/min airflow must be less than 3.4 kPa. Tubes are commercially available. Zefluor PTFE pre-filter, 0.45-μm, 25-mm, with porous plastic support pad in 25-mm cassette.
Note: Some lots of charcoal have excessively high sulfur backgrounds, and/or desorption efficiencies. Screen each lot before field use.
Personal air sampling pump with flexible connecting tubingFootnote 11.
Four 15-minute samples were taken during the work shift.
A STEL sampling procedure was conducted. According to NIOSH method 6013, a pump flow rate of 1 L/min should be used for 15-minute samples. The STEL samples should be taken at the breathing zone of the worst case exposed worker during a task when excessive hydrogen sulfide is released into the work place air.
The following lab results were obtained:
Sample 1:
4.3 ppm average hydrogen sulfide concentration sampled in 15 L (0.015 m3)Sample 2:
4.6 ppm average hydrogen sulfide concentration sampled in 15 L (0.015 m3)Sample 3:
2.4 ppm average hydrogen sulfide concentration sampled in 15 L (0.015 m3)Sample 4:
1.4 ppm average hydrogen sulfide concentration sampled in 15 L (0.015 m3)
Do not average the STEL measurements. Compare each STEL measurement to the TLV-STEL for compliance.
The greatest measured 15-minute STEL of 4.6 ppm is less than the TLV-STELhydrogen sulfide of 5 ppm. Therefore, the sampling results do not indicate a worker overexposure and compliance exists in this case. Since the value exceeds the action level (50% of the TLV), it is recommended to lower worker exposures to H2S through engineering control measures over 15-minute intervals.
7.4 Sampling for a ceiling value (C) of a hazardous substance
A ceiling value is the concentration that should not be exceeded during any part of the workday. Substances that have a C value, do not have a TLV-TWA or TLV-STELFootnote 4. A direct reading instrument (DRI) with data logging capabilities should be used if reasonably practicable. The worst case exposed worker will be sampled. If instantaneous measurements are not available, sampling should be conducted for the minimum period of time sufficient to detect exposures at or above the ceiling value.
Example
Potassium hydroxide (KOH) aerosol
2015 ACGIH TLV-C: 2 mg/m3
NIOSH method 7401 was usedFootnote 12
Equipment: 37-mm diameter PTFE membrane filter (Millipore, Fluoropore or equivalent),
1.0-μm pore size, supported by a cellulose backup pad in a 37 mm closed face cassette (CFC) filter holder.
Personal air sampling pump with flexible connecting tubingFootnote 12.
Four 20-minute samples were taken during the work shift because a direct reading instrument (DRI) measuring KOH is not available. A C sampling procedure was conducted. According to NIOSH method 7401, a pump flow rate of 4 L/min should be used for 20-minute samples. The maximum flow rate of 4 L/min for 20 minutes is necessary to exceed the minimum required sampling volume of 70 L. The C value samples should be taken at the breathing zone of the worst case exposed worker during a task when excessive potassium hydroxide is released into the work place air.
The following lab results were obtained:
Sample 1:
0.09 mg potassium hydroxide in 80 L (0.08 m3) of air
0.09 mg / 0.08 m3 = 1.125 mg/m3Sample 2:
mg potassium hydroxide in 80 L (0.08 m3) of air
mg / 0.08 m3 = 1.25 mg/m3Sample 3:
0.03 mg potassium hydroxide in 80 L (0.08 m3) of air
0.03 mg / 0.08 m3 = 0.375 mg/m3Sample 4:
0.04 mg potassium hydroxide in 80 L (0.08 m3) of air
0.04 mg / 0.08 m3 = 0.5 mg/m3
Do not average the C measurements. Compare each C measurement to the TLV-C for compliance.
The greatest measured C of 1.25 mg/m3 is less than the TLV-Cpotassium hydroxide of 2 mg/m3. Therefore, the sampling results do not indicate a worker overexposure and compliance exists in this case.7.5 Sampling for excursion limits
The worst case exposed workers are to be sampled. Sample for excursion limits when the measured TWA value is not exceeded and a TLV-STEL does not exist.
Excursions in worker exposure levels may exceed 3 times the TLV-TWA for no more than a total of 30 minutes during a workday, and under no circumstances should they exceed 5 times the TLV-TWA, provided that the TLV-TWA is not exceededFootnote 4.
Example
Carbon monoxide (CO) gas
2015 ACGIH TLV-TWA: 25 ppm
NIOSH method 6604 was usedFootnote 13
Equipment: Carbon monoxide monitor: Envirocheck I single sensor CO Monitor (Quest Technologies); CO262 or STX70 (Industrial Scientific); MiniCO (MSA); or other electrochemical CO monitor with equivalent performance specifications.
Replacement batteries or battery recharger, as appropriate for monitorFootnote 13.
Four 15-minute samples were taken during the work shift.
A short term exposure sampling procedure was conducted. According to NIOSH method 6604, a portable direct reading carbon monoxide monitor should be used for 15-minute samples. The 15-minute samples should be taken at the breathing zone of the worst case exposed worker during a task when excessive carbon monoxide is released into the work place air.
The following lab results were obtained:
Sample 1:
19 ppm average carbon monoxide concentration sampled over 15 minutesSample 2:
138 ppm average carbon monoxide concentration sampled over 15 minutesSample 3:
104 ppm average carbon monoxide concentration sampled over 15 minutesSample 4:
80 ppm average carbon monoxide concentration sampled over 15 minutes
Excursion limit analysis:
- The greatest measured STEL value is 138 ppm, which is more than 5 times the TLV-TWA of 25 ppm. Three of the measured STEL values exceed the excursion limit of 3 times the TLV-TWA for 30 minutes. Therefore, it appears that the sampling results indicate a worker overexposure and non-compliance in this case.
Statistical analysis of hazardous substance air sampling results
Excursion limits GSD calculation example for CO
Excursions in worker exposure levels may exceed 3 times the TLV-TWA for no more than a total of 30 minutes during a workday, and under no circumstances should they exceed 5 times the TLV-TWA, provided that the TLV-TWA is not exceededFootnote 4.
Sample 1:
19 ppm average carbon monoxide concentration sampled over 15 minutesSample 2:
138 ppm average carbon monoxide concentration sampled over 15 minutesSample 3:
104 ppm average carbon monoxide concentration sampled over 15 minutesSample 4:
80 ppm average carbon monoxide concentration sampled over 15 minutes
It is necessary to calculate the GSD of measured 15-minute sample values from similarly exposed workers to gain a better understanding of the variations of worker exposure to hazardous substances. The Microsoft® Excel-based software program New IHSTAT developed by the American Industrial Hygiene Association (AIHA) was used to calculate the GM, GSD, and other descriptive statistics of the above CO excursion limit data, which can be seen in Figure 1 and Figure 2Footnote 14.
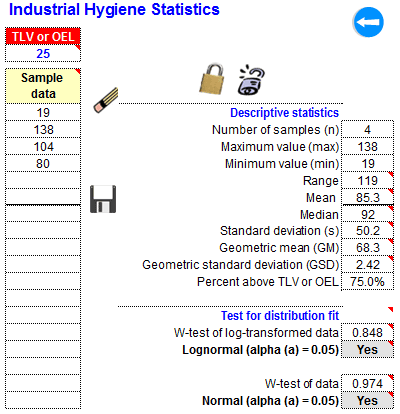
Text description of Figure 1
The results (Sample 1 – 4) were entered in the left column of the Figure 1, under Sample data, and the software program NEW IHSTAT generated results with the Descriptive statistics provided in the right column. Based on the same results (Sample 1 – 4) entry, the generated results in Figure 1 are presented in the graphical form of the Figure 2.
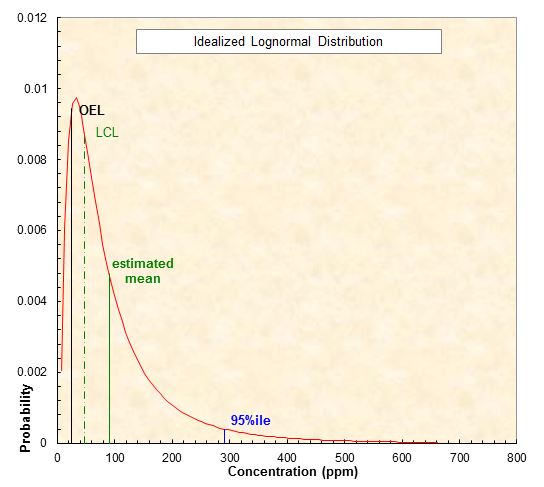
Text description of Figure 2
The CO excursion limit data points are normally distributed because the value of the W-test of the data is greater than the W-test of the log-transformed data. The GSD is greater than 2.0, thus the relatively high CO variability indicates that the work process emitting CO is not under good control and efforts should be made to restore control. Improving engineering control measures will reduce the worker exposure and exposure variability, and thus reduce the GSD. However, it is recognized that the geometric standard deviations of some common workplace exposures may exceed 2.0. If such distributions are known and workers are not at increased risk of adverse health effects, recommended excursion limits should be modified based upon workplace-specific data. When the toxicological data for a specific substance are available to establish a TLV-STEL or TLV-C, these values take precede over the excursion limitFootnote 4.
7.6 Sampling for an adjusted TLV
The entire work day must be sampled. The worst case exposed worker is sampled.
Example
The TLV-TWA or OEL-TWA must be adjusted so that the measured air concentration can be properly compared to the limit. Use the Institut de recherche Robert-Sauvé en santé et en sécurité du travail (IRSST) method to adjust the TLV-TWA or OEL-TWA.
Flour dust (inhalable) exposure for a 12-hour work shift
2015 ACGIH TLV-TWA: 0.5 mg/m3
OEL-TWA: 3.0 mg/m3
IRSST method No. 373 was usedFootnote 15
Equipment: 25-mm 5 μm pore size PVC filter supported by an Institute of Occupational Medicine (IOM) inhalable dust sampler or equivalent.
Personal air sampling pump with flexible tubingFootnote 15,Footnote 16.
Note: The same method and example apply to the TLV-TWA of 0.5 mg/m3.
Four consecutive 180-minute samples were taken over the entire 12-hour work shift of 7:00 to 19:00 (7 am to 7 pm). All four samples used a flow rate of 2 L/min as required in the method. 360 L of air were passed through each sample media, which is below the 400 L sampled volume stated in the method.
All the samples were sent to a laboratory for analysis. The results obtained are as follows:
Sample 1 (7:00-10:00):
0.9 mg flour dust in 360 L (0.36 m3) of air
0.9 mg / 0.36 m3 = 2.5 mg/m3Sample 2 (10:00-13:00):
0.8 mg flour dust in 360 L (0.36 m3) of air
0.8 mg / 0.36 m3 = 2.22 mg/m3Sample 3 (13:00-16:00):
1.2 mg flour dust in 360 L (0.36 m3) of air
1.2 mg / 0.36 m3 = 3.33 mg/m3Sample 4 (16:00-19:00):
mg flour dust in 360 L (0.36 m3) of air
mg / 0.36 m3 = 3.06 mg/m3
In order to calculate 12-hour worker exposure to flour dust (inhalable) during the entire work shift, the following equation must be used:
TWA = [(C1xT1)+(C2xT2)+…+(CnxTn)]/(T1+T2+…+Tn)
The sum of the multiplications(C1-nT1-n)divided by the sum of T1-n
Calculation of TWA12h based on the lab results:
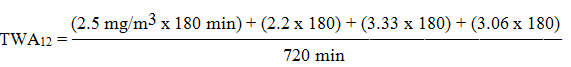
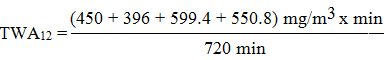
TWA12 = 2.77 mg/m3
The measured TWA12 of 2.77 mg/m3 is less than the unadjusted 8-hour OEL-TWAflour dust of 3.0 mg/m3. Therefore, it appears that the samples do not indicate a worker overexposure and compliance exists; however the flour dust OEL-TWA must be adjusted to be properly compared to the data acquired from the 12-hour shift. As well, the measured TWA12 of 2.77 mg/m3 is greater than the unadjusted TLV-TWAflour dust of 0.5 mg/m3. Using this limit, a worker overexposure and non-compliance exists. An adjustment of the TLV-TWAflour dust is not needed, since an overexposure is already demonstrated.
IRSST OEL-TWA adjustment method
Flour dust is a category III substance due to its long-term ill effects on health. Category III substances require a weekly adjustment to the OEL-TWA based on the average exposure duration in hours per week based on a repetitive work cycleFootnote 17.
In this case, the work schedule for the sampled employee is 12h/day for 5 days per week. This gives 60h/week and an adjustment factor of 40/60 or 0.67.
The OEL-TWAflour dust of 3.0 mg/m3 multiplied by the adjustment factor of 0.67 gives and adjusted 12-hour OEL-TWAflour dust of 2.0 mg/m3
Brief and Scala TLV-TWA adjustment method3 (alternate method)
OEL-TWAh = OEL-TWA8 x (8/h) x (24-h)/16
Where h = length of unusual shift in hours
OEL-TWA12 = 3 mg/m3 x (8/12) x [(24-12)/16]
OEL-TWA12 = 3 mg/m3 x 0.67 x 0.75
OEL-TWA12 = 1.5 mg/m3
The measured OEL-TWA12 of 2.77 mg/m3 is greater than the IRSST 12-hour adjusted OEL-TWAflour dust of 2.0 mg/m3 and the Brief and Scala 12-hour adjusted OEL-TWAflour dust of 1.5 mg/m3. Therefore, the sampling results indicate a worker overexposure and non-compliance in this case.
7.7 Sampling and analysis quality control measures
The IRSST or any other lab accredited by the AIHA Laboratory Accreditation Programs (LAP), LLC should be used to analyze the collected sample media. The lab should be accredited for the chemical that they will analyze. The most recent version of the NIOSH method or other sampling and analysis method for the chemical of interest should be used.
The sampling strategy used and conditions in the workplace should be consistent with the sampling strategy used and conditions in the past and with sampling strategies used in the future. This consistency is needed so that the air sampling data collected at a certain workplace can be legitimately compared to past and future air sampling data.
Required compliance sampling strategy:
- Sample the breathing zone of the most highly exposed worker(s)
Work place conditions that shall be considered during compliance sampling:
- Day of week
- Month of year (due to the effect of different seasons on work conditions)
- Temperature and pressure
- Workload
- Type of shift (day or night)