
2017 Occupational Injuries amongst Federal Jurisdiction Employers
On this page
Alternate formats

2017 Occupational Injuries amongst Federal Jurisdiction Employers [PDF - 685.31 KB]
Large print, braille, MP3 (audio), e-text and DAISY formats are available on demand by ordering online or calling 1 800 O-Canada (1-800-622-6232). If you use a teletypewriter (TTY), call 1-800-926-9105.
The following data is derived from Employer Annual Hazardous Occurrence Reports (EAHOR) submitted to the Labour Program by federally-regulated employers. Occupational Health and Safety Regulations under the Canada Labour Code stipulate this reporting requirement.
This publication presents information and analysis on the Disabling Injury Frequency Rate and the Fatal Injury Frequency Rate by federal jurisdiction industry sector and by province/territory. Definitions of these rates and other terms found in this publication are located in the Glossary. Information on all injury rates can be found on the Government of Canada’s Open Data Portal.
National injury highlights
- The national Disabling Injury Frequency Rate (DIFR: Number of disabling and fatal injuries per one million hours worked) is 9.17. This is an increase of 0.5% from the 2016 DIFR of 9.13. It is the third lowest DIFR value since 1982.
- The national Fatal Injury Frequency Rate (FIFR: Number of fatal injuries per one billion hours worked) is 28.08. This is a decrease of 7.4% from the 2016 FIFR of 30.33. It is the second highest DIFR in the past 10 years since 2008. The highest was in 2016 (30.33).
- There were 47,800 total injuries (disabling, fatal and minor) reported to the Labour Program in 2017, an 11.9% decrease from 2016 (54,277). Of this number, 19,855 (41.5%) were disabling injuries, 61 (0.13%) were fatal injuries and 27,884 (58.3%) were minor injuries. Only the proportion of minor injuries decreased from 2016.
- Of the 7 industry sectors with the highest 2017 DIFR values, the postal contractors sector underwent the most noted increase over the last 5 years. The DIFR for this sector increased by 64.4% going from 25.17 in 2013 to 41.39 in 2017. This increase is the outcome of an improved approach to injury reporting by an employer. It resulted in a redistribution of injuries from minor injuries to disabling injuries. The sector with the most marked decrease was water transport. The DIFR for this sector decreased by 37.1% from 15.40 in 2013 to 9.68 in 2017. See Chart 1.4 for DIFR values for all sectors.
- The 3 sectors with the highest FIFR values were feed, flour, seed (101.62), road transport (91.00) and aboriginal (79.17). Since 2013, the road transport and aboriginal sectors have almost consistently reported FIFR values above the national rates. The exception was in 2013 where the aboriginal sector reported no fatalities. The feed, flour, and seed sector, however, has fluctuated, reporting no fatalities in 2013, 2015, and 2016. Besides road transport, the only other 3 sectors which reported fatalities in every year from 2013 and 2017 were the air and rail transport, and public service departments. Of the postal contractors, road transport, air transport, and rail transport sectors, only the postal contractors sector reported a 2017 FIFR below the national rate. See Chart 1.5 for FIFR values for all sectors.
Important note: More detailed injury data is available through the Government of Canada's Open Data Portal.
Occupational injuries for federal jurisdiction by industry sector, 2017
Disabling injuries: Combined, the road transportation and postal contractors industry sectors make up approximately half of all reported disabling injuries in the federal jurisdiction in 2017. However, these two sectors only represent a little more than a fifth of total employment in the federal jurisdiction. This distribution is roughly identical to the 2016 figures.
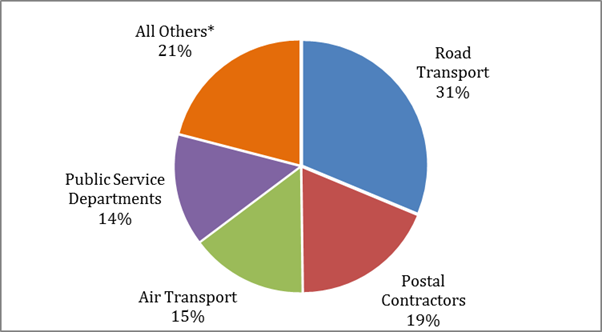
Text description of Chart 1.1
| Industry sector | Percentage of disabling injuries |
|---|---|
| Road transport | 31 |
| Postal contractors | 19 |
| Air transport | 15 |
| Public service departments | 14 |
| All others* | 21 |
*All Others: COMM: 6%; BANK: 4%; RAIL: 3%; WATR: 2%; CRWN, LONG, BCAST, FEED, ABORIG, GRAIN: 1% each; PIPE: 0.07%; ENER, BRID: 0.02% each
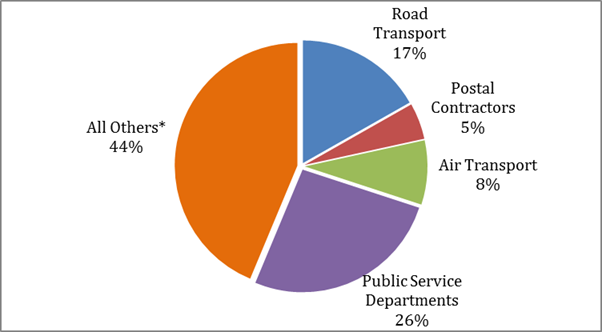
Text description of Chart 1.2
| Industry sector | Percentage of employees |
|---|---|
| Road transport | 17 |
| Postal contractors | 5 |
| Air transport | 8 |
| Public service departments | 26 |
| *All others | 44 |
*All others: BANK: 20%; COMM: 8%; CRWN, BCAST, RAIL: 3% each; WATR, ABORIG: 2% each; FEED, PIPE, GRAIN, LONG: 1% each; ENER: 0.2%; BRID: 0.02%
Fatal injuries: The total number of reported fatalities in 2016 has decreased by 9% from 67 in 2016 to 61 in 2017. The decrease is partly attributable to the fact that the road transport and public service departments sectors reported a combined 13 fewer fatalities in 2017 (37) than in 2016 (50).
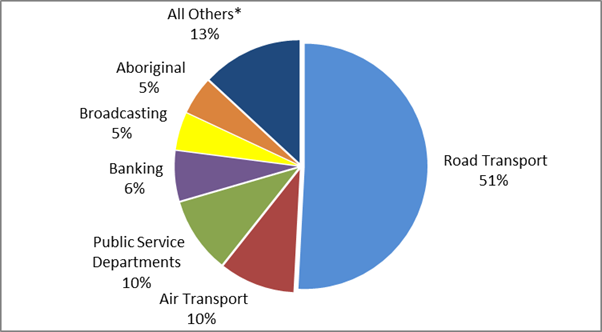
Text description of Chart 1.3
| Industry sector | Percentage of fatal work injuries |
|---|---|
| Road transport | 51 |
| Air transport | 10 |
| Public services departments | 10 |
| Banking | 6 |
| Broadcasting | 5 |
| Aboriginal | 5 |
| All Others* | 13 |
*All others include two fatalities in the Rail Transport and Feed, Flour, and Seed sectors respectively and one fatality in each of the following sectors: postal contractors, communications, crown corporations, and grain elevators
DIFR: Five of the 17 industry sectors under federal jurisdiction reported DIFRs higher than the national rate of 9.17. These industries were: postal contractors, road transport, long shoring, air transport, and water transport. Of these, the long shoring and air transport sectors were the sectors to report an increased DIFR from 2016 to 2017. The top 5 sectors in both 2016 and 2017 remained identical.
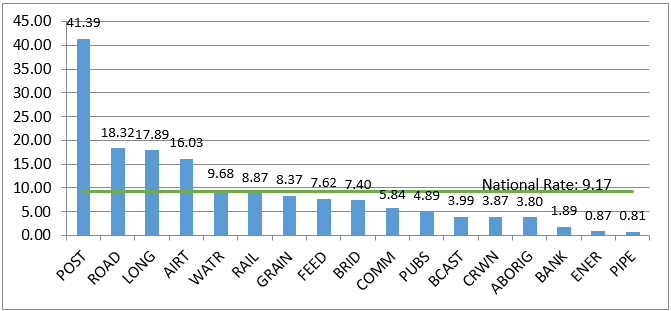
Text description of Chart 1.4
| Industry sector | Disabling injury frecuency rate |
|---|---|
| Postal Contractors | 41.39 |
| Road Transport | 18.32 |
| Longshoring | 17.89 |
| Air Transport | 16.03 |
| Water Transport | 9.68 |
| Rail Transport | 8.87 |
| Grain Elevators | 8.37 |
| Feed, Flour, and Seed | 7.62 |
| Bridges and Tunnels | 7.40 |
| Communications | 5.84 |
| Public Service Departments | 4.89 |
| Broadcasting | 3.99 |
| Crown Corporations | 3.87 |
| Aboriginal | 3.80 |
| Banking | 1.89 |
| Energy and Mining | 0.87 |
| Pipelines | 0.81 |
| National Rate | 9.17 |
FIFR: Twelve of the 17 industry sectors under federal jurisdiction reported fatalities in 2017. Seven industry sectors all reported FIFR values above the national rate (20.08):
- feed, flour, and seed
- road transport
- Aboriginal
- grain elevators
- broadcasting
- air transport
- rail transport
When compared to 2016, the Road Transport and Aboriginal industry sectors were the only 2 sectors above the national rate in both years. Along with these 2 sectors, the following industry sectors reported fatalities in both years:
- air transport
- public service departments
- broadcasting
- rail transport
- crown corporations
- postal contractors
- banking
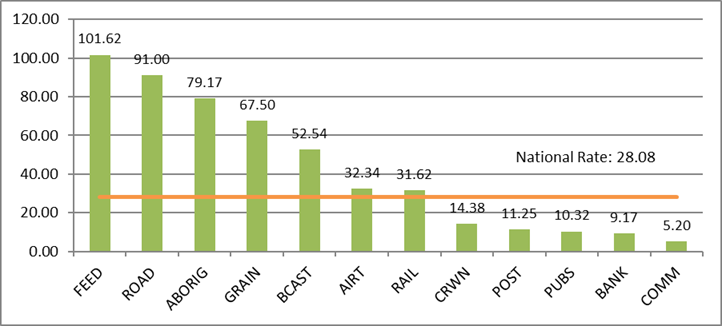
Text description of Chart 1.5
| Industry | Fatal injury frequency rate |
|---|---|
| Feed, flour, and seed | 101.62 |
| Road transport | 91 |
| Aboriginal | 79.17 |
| Grain elevators | 67.5 |
| Broadcasting | 52.54 |
| Air transport | 32.34 |
| Rail transport | 31.62 |
| Federal crown corporations | 14.38 |
| Postal contractors | 11.25 |
| Public service departments | 10.32 |
| Banking | 9.17 |
| Communications | 5.2 |
| National rate | 28.08 |
Occupational injuries for federal employers by province or territory, 2017
Disabling injuries: In 2017, Ontario, Quebec, British Columbia and Alberta accounted for 83% of all reported disabling injuries. This is understandable due to their large combined share (85%) of all reported federal jurisdiction employment. These numbers remain largely unchanged from 2016.
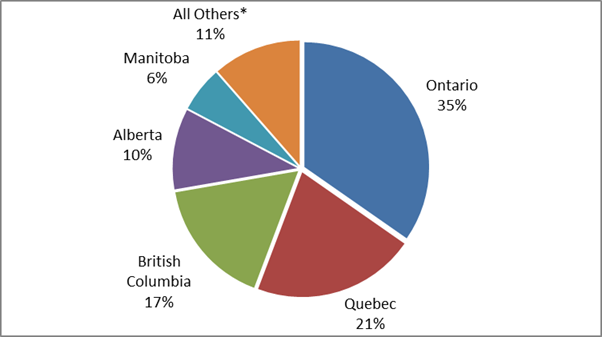
Text description of Chart 2.1
| Province and territory | Percentage of disabling injuries |
|---|---|
| Ontario | 43 |
| Quebec | 19 |
| British Columbia | 13 |
| Alberta | 10 |
| Manitoba | 4 |
| All others* | 11 |
* All Others: NS: 3%; SK: 3%; NB: 2%; NL: 1%; PEI: 0.4%; NU, YK, Foreign: 0.2% each; NWT: 0.1%
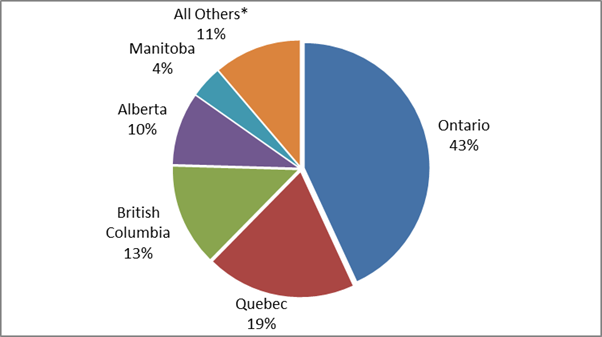
Text description of Chart 2.2
| Province and territory | Percentage of employees |
|---|---|
| Ontario | 43 |
| Quebec | 19 |
| British Columbia | 13 |
| Alberta | 10 |
| Manitoba | 4 |
| All others* | 11 |
* NS, SK: 3% each; NB: 2%; NL, Foreign, PEI: 1% each; NWT and YK: 0.2% each; NU: 0.1%
Fatal injuries: Ontario, Quebec, British Columbia and Alberta accounted for just under 80% of all reported fatal injuries in 2017. Of these provinces, only Ontario saw its share of fatal injuries increase from 2016 to 2017, from 33% to 34%. Even though Quebec and Ontario combined to account for 54% of all fatalities, they both reported relatively low FIFR values. This is due to their large number of reported hours worked (see Charts 2.4 and 2.5).
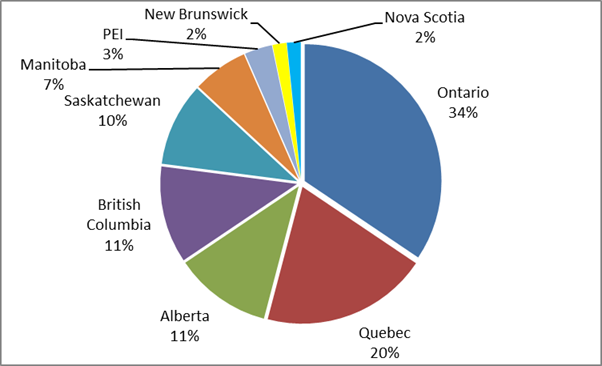
Text description of Chart 2.3
| Province and territory | Percentage of fatal work injuries |
|---|---|
| Ontario | 34 |
| Quebec | 20 |
| Alberta | 11 |
| British Columbia | 11 |
| Saskatchewan | 10 |
| Manitoba | 7 |
| Prince Edward Island | 3 |
| New Brunswick | 2 |
| Nova Scotia | 2 |
DIFR: Seven provinces or territories reported DIFR values above the national rate of 9.17. Of these 7 provinces or territories, Nunavut, British Columbia, and Quebec reported a higher DIFR value in 2017 than in 2016. Nunavut, Manitoba, and British Columbia remain the top 3 provinces or territories with the highest DIFR values when compared to 2016.
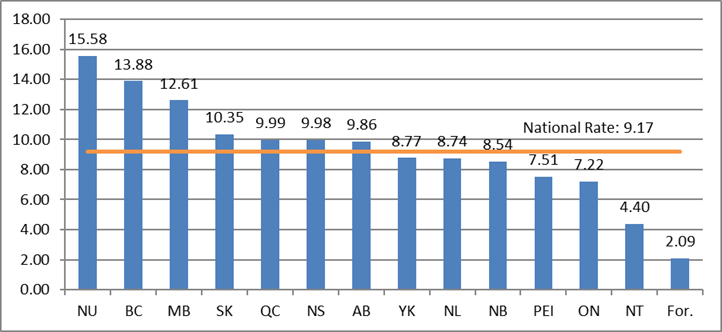
Text description of Chart 2.4
| Province and territory | Disabling injury frequency rate |
|---|---|
| Nunavut | 15.58 |
| British Columbia | 13.88 |
| Manitoba | 12.61 |
| Saskatchewan | 10.35 |
| Quebec | 9.99 |
| Nova Scotia | 9.98 |
| Alberta | 9.86 |
| Yukon | 8.77 |
| Newfoundland and Labrador | 8.74 |
| New Brunswick | 8.54 |
| Prince Edward Island | 7.51 |
| Ontario | 7.22 |
| Northwest Territories | 4.40 |
| Foreign | 2.09 |
| National rate | 9.17 |
FIFR: Of the 9 provinces to report fatalities in 2017, only Ontario, New Brunswick, and Nova Scotia were below the national FIFR. Compared to 2016, Manitoba, Alberta, British Columbia, and Quebec remain above the national FIFR. These 4 provinces all reported lower FIFR values in 2017 than in 2016. Of note, the FIFR for PEI is so much higher than the other provinces/territories since it reported two fatalities for approximately 11.5 million hours worked. This resulted in an FIFR of 174.58 fatalities per one billion hours worked.
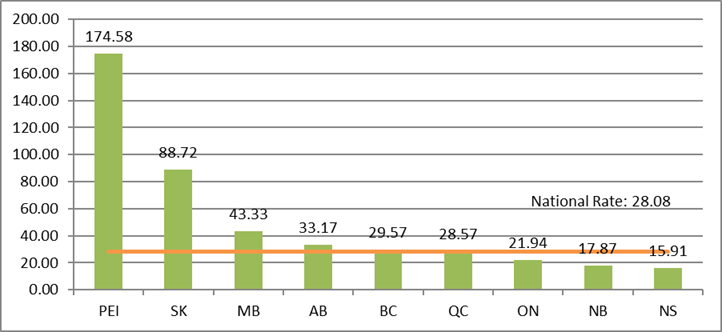
Text description of Chart 2.5
| Province and territory | Fatal Injury Frequency Rate |
|---|---|
| Prince Edward Island | 174.58 |
| Saskatchewan | 88.72 |
| Manitoba | 43.33 |
| Alberta | 33.17 |
| British Columbia | 29.57 |
| Quebec | 28.57 |
| Ontario | 21.94 |
| New Brunswick | 17.87 |
| Nova Scotia | 15.91 |
| National Rate | 28.08 |
Glossary
The following definitions are provided for the purposes of this publication only.
Disabling injury
Any occupation injury or disease that:
- prevents an employee from reporting for work, or from effectively performing all the duties connected with the employee’s regular work, on any day subsequent to the day on which the occupational injury occurred, whether or not that subsequent day is a working day for that employee
- results in the loss by an employee of a body member or a part thereof, or in a complete loss of the usefulness of a body member or part thereof
- results in the permanent impairment of a bodily function of an employee
Disabling Injury Frequency Rate (DIFR)
Defined as the total number of disabling and fatal occupational injuries per one million hours worked. It is calculated by taking the sum of the total number of disabling and fatal injuries on the job, dividing that by the total number of hours worked and multiplying by one million.
Employee
Any person who has entered into or is employed under a contract of service or apprenticeship, written or oral, expressed or implied, whether by way of manual labour or otherwise. An employee is also any other person subject to the provisions of a workers’ compensation board act or any direction or order of a board.
Employment
- All work or activities performed in carrying out assignments or requests made by the employer. It includes related activities not specifically covered by an assignment or request
- Any voluntary work or activities undertaken while on duty for the benefit of the employer
- Any activities undertaken while on duty with the consent or approval of the employer
Fatal injury
An occupational injury or disease resulting in death.
Fatal Injury Frequency Rate (FIFR)
Defined as the total number of fatal occupational injuries per one billion hours worked. It is calculated by taking the total number of fatal injuries on the job, dividing that by the total number of hours worked and multiplying by one billion.
Federal jurisdiction
Federal jurisdiction covers:
- works, undertakings or businesses that are within the legislative authority of Parliament
- work declared to be for the general advantage of 2 or more provinces outside the exclusive authority of the provincial legislatures
Federal jurisdiction defined under the Canada Labour Code covers specific industries and their infrastructures (see the next section of this publication for a list of industry sectors under federal jurisdiction).
Full-time Equivalent (FTE)
Refers to the employment of one person full time. It may also refer to more than one person part time whose total working time is the equivalent of one person working full time. FTEs are measured in person-years. For example:
- 100 people employed full time equals 100 FTEs
- 10 people employed half time equals 5 FTEs
- all 110 people combined represent 105 FTEs
Minor injury
An occupation injury or disease, excluding disabling injuries, for which treatment at a medical facility is provided.
Occupational injury
Any injury, disease or illness incurred by an employee in the performance of, or in connection with, his or her work.
Industry sectors under federal jurisdiction
According to the Canada Labour Code, the federal jurisdiction encompasses any work, undertaking or business that is within the legislative authority of the Parliament of Canada. This includes all work deemed to be for the common good of at least 2 provinces and outside the exclusive authority of provincial legislatures. The industrial sectors included are as follows:
- Aboriginal (ABORIG)
- Air transport (AIRT)
- Banking (BANK)
- Bridges and tunnels (BRID)
- Broadcasting (BROAD)
- Communications (COMM)
- Federal crown corporations (CRWN)
- Public service departments (PUBS)
- Feed, flour and seed mills (FEED)
- Grain elevators (GRAN)
- Long shoring (LONG)
- Energy and mining (ENER)
- Pipelines (PIPE)
- Postal contractors (POST)
- Rail transport (RAIL)
- Inter-provincial road transport (ROAD)
- Water transport (WATR)
Annex: Data charts
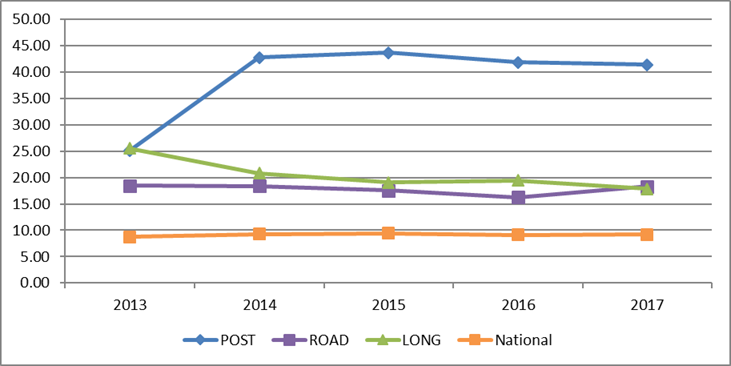
Text description of Chart 3.1 (a)
| Industry | 2013 | 2014 | 2015 | 2016 | 2017 |
|---|---|---|---|---|---|
| Postal contractors | 25.17 | 42.74 | 43.65 | 41.88 | 41.39 |
| Road transport | 18.47 | 18.38 | 17.59 | 16.26 | 18.32 |
| Longshoring | 25.52 | 20.81 | 19.07 | 19.46 | 17.89 |
| National rate | 8.76 | 9.25 | 9.42 | 9.13 | 9.17 |
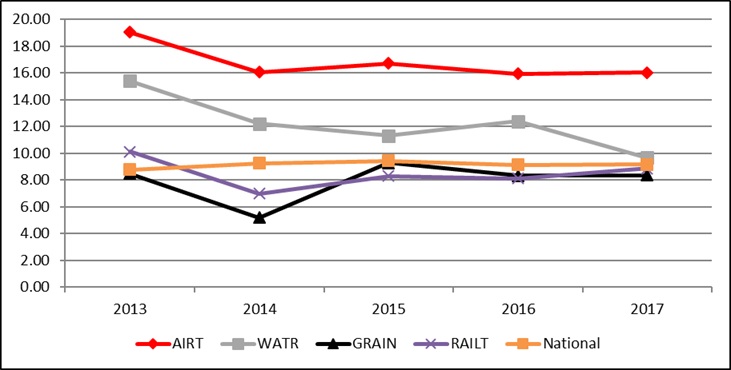
Text description of Chart 3.1 (b)
| Industry | 2013 | 2014 | 2015 | 2016 | 2017 |
|---|---|---|---|---|---|
| Air transport | 19.05 | 16.04 | 16.71 | 15.92 | 16.03 |
| Water transport | 15.40 | 12.22 | 11.32 | 12.39 | 9.68 |
| Rail transport | 10.10 | 6.99 | 8.30 | 8.12 | 8.87 |
| Grain elevators | 8.46 | 5.19 | 9.28 | 8.33 | 8.37 |
| National rate | 8.76 | 9.25 | 9.42 | 9.13 | 9.17 |
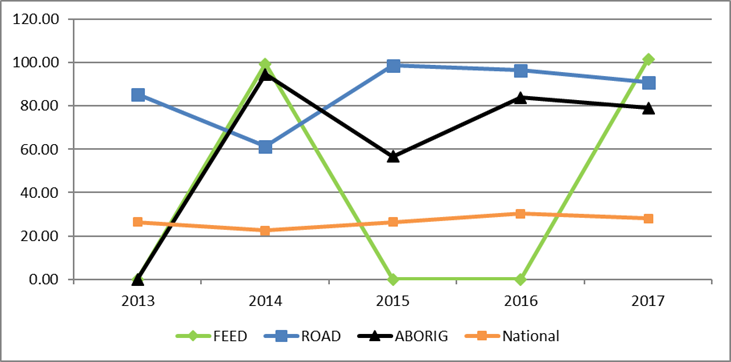
Text description of Chart 3.2
| Industry | 2013 | 2014 | 2015 | 2016 | 2017 |
|---|---|---|---|---|---|
| Feed, flour, and seed | 0.00 | 99.41 | 0.00 | 0.00 | 101.62 |
| Road transport | 85.44 | 61.33 | 98.65 | 96.43 | 91.00 |
| Aboriginal | 0.00 | 94.68 | 56.77 | 83.95 | 79.17 |
| National rate | 26.37 | 22.45 | 26.44 | 30.33 | 28.08 |