
Social Assistance Statistical Report: 2009-2013
Alternate formats

- Large print, braille, MP3 (audio), e-text and DAISY formats are available on demand by ordering online or calling 1 800 O-Canada (1-800-622-6232). If you use a teletypewriter (TTY), call 1-800-926-9105.
- Large print, braille, audio cassette, audio CD, e-text diskette, e-text CD and DAISY are available on demand.
On this page
- Chapter 1: Summary
- Chapter 2: Social assistance in Canada: an overview
- Chapter 3: Newfoundland and Labrador - Income Support
- Chapter 4: Prince Edward Island - Social assistance
- Chapter 5: Nova Scotia - Employment Support and Income Assistance
- Chapter 6: New Brunswick - Social Assistance
- Chapter 7: Quebec - Last-resort financial assistance
- Chapter 8: Ontario
- Chapter 9: Manitoba - Employment and Income Assistance
- Chapter 10: Saskatchewan - Social Assistance Programs
- Chapter 11: Alberta
- Chapter 12: British Columbia - Employment and Assistance
- Chapter 13: Yukon - Social Assistance
- Chapter 14: Northwest Territories - Income Assistance
- Chapter 15: Nunavut - Income Assistance
Chapter 1 - Summary
Social assistance in Canada is also known as income support, income assistance, welfare and a few other program names, depending on the jurisdiction. No matter the name, all provincial and territorial social assistance programs provide financial assistance and in-kind goods and services to cover the cost of basic living requirements for an individual or family when all other financial resources of that individual or family have been exhausted. For the purpose of this report, in Chapter 1 and 2, the term social assistance program has been adopted.
In recognition of the growing public demand for comprehensive information on provincial and territorial social assistance programs and caseloads, the Social Assistance Statistical Report: 2009-13 is the sixth annual joint publication by federal, provincial and territorial governments. The report provides a general overview of social assistance in Canada, as well as a description of income support-related/social assistance programs in each jurisdiction.
This report does not include social assistance rates as this information is currently available to the public on most provincial and territorial government websites.
Methodology
The data in this report was provided by provincial and territorial ministries responsible for administering social assistance programs. It was extracted from jurisdictional data systems developed to meet their administrative and case management needs. As such, there are extensive variations in the types of data collected, the manner in which the data is reported, and in the definitions and terminology used. The data in this report should not be used for the purpose of cross-jurisdictional comparison.
Chapter 2 - Social assistance in Canada: an overview
The formal division of powers between the federal government and the provincial and territorial governments respecting social services is based on The Constitution Act, 1867. The Act itself did not refer to social services; however, the legislative authority for social services has been inferred from the interpretations of sections 91 and 92 of the Act. These sections of the Act set out the division of authority between the federal and provincial governments and the Constitution has been interpreted to mean that the provinces have primary jurisdiction over social services. As such, the legislation governing the provision of social assistance varies by jurisdiction.
Following the approach of their provincial or territorial counterpart, Aboriginal Affairs and Northern Development Canada (AANDC) has adopted similar terms and conditions of social assistance programs. Funding for social assistance activities is provided by AANDC to First Nations communities, who in turn deliver programs and services to community members.Footnote 1
A brief history of federal social assistance
1966 - Canada Assistance Plan (CAP) - The federal government shared the eligible costs that provincial, territorial and municipal governments incurred in providing provincial social assistance and welfare services to persons in need.
1996 - The Canada Health and Social Transfer (CHST) replaced CAP. The CHST was a federal transfer provided to provinces and territories in support of provincial health care, post-secondary education, social assistance and social services, including early childhood development and early learning and child care.
2004 - The CHST was replaced by the Canada Health Transfer (CHT) in support of health care and the Canada Social Transfer (CST) in support of post-secondary education, social assistance and social services, including early childhood development and early learning and child care.
Eligibility
In general, assistance may be granted to any individual or family head who has been determined, on the basis of need, to be unable to provide adequately for themselves and any dependants. Employable recipients may be required to participate in one or more employment activities as a condition of eligibility for financial assistance. Most jurisdictions require applicants to attain the age of majority prior to application, and be a resident at the time of their application and while receiving benefits.
The following groups of individuals may be eligible for social assistance:
- Canadian citizens
- persons granted permanent resident status under the Immigration and Refugee Protection Act; and
- persons who have made a claim for refugee status or have been granted asylum in Canada under the Immigration and Refugee Protection Act
Administrative requirements
Depending on the jurisdiction, to establish initial eligibility for social assistance, an applicant may be required to:
- submit a completed application
- provide all documentation or necessary information to verify his/her eligibility, such as proof of age, medical information related to a disability, if applicable, pay cheque stubs, etc.
- meet a representative from the ministry and discuss the financial and social situation of the household;
- provide consent for verification of any statement made in the application and any supporting documents concerning financial resources or any other circumstances of the household
- report any change in circumstances that may affect continuing program eligibility or the amount of assistance to which the household is entitled
Employment requirements
Eligible employable persons are actively encouraged or require pursuing, accepting, and retaining any reasonable offer of employment or re-training as an initial and continuing condition of eligibility for social assistance. Thus, many jurisdictions offer employment services and training opportunities in combination with financial assistance. Should a recipient choose not to pursue employment or re-training, he/she may be subject to penalties ranging from a specified reduction in benefits over a prescribed period of time to the full cancellation of benefits.
To ensure that those who successfully leave social assistance for employment are better off working, the federal government (Working Income Tax Benefit - WITB) and a number of provinces and territories have introduced earned income or working income supplements.
Categories of beneficiaries
Employable persons - A number of measures promote the entry or re-entry of employable persons into the active labour force. These measures may include different exemption levels on assets and income, lower benefit levels to reflect the temporary nature of their reliance on social assistance, and a wide range of employment support services and programs.
Recipients may be required to sign and adhere to an individualized contract that stipulates training and rehabilitation measures to be undertaken in order to regain financial independence.
However, assistance may be granted only when:
- unemployment is due to circumstances beyond the person's control
- the person is willing to accept employment which he/she is capable of handling, or to engage in academic upgrading, re-training or other measures to reach a state of job readiness; and
- the person is making reasonable efforts to secure employment
Single-parent families - A sole support parent may be required to either initiate legal proceedings against an absent spouse (or ex-spouse) including common-law partners, respecting maintenance payments, or to subrogate that right to the government. Generally, single parents are considered as employable and required to actively seek and accept reasonable employment, where the parent and dependent child(ren) are physically and mentally healthy and generally when the dependants have reached a certain age.
Persons with disabilities - An applicant with a disability is generally required to undergo an adjudication process or submit a medical certificate completed by a licensed physician indicating the level of the impairment and the potential for rehabilitation. Evidence of a continuing disability on an annual or other basis may also be required. These requirements may be waived where the disability is obvious.
All programs have design features to assist persons with disabilities, which may include higher exemption levels on assets and income, higher basic assistance levels, special disability-related allowances, and supplementary health and medical benefits.
Persons with multiple barriers to employment - Some recipients face multiple significant barriers that make it difficult to find and maintain employment. Barriers to employment may include substance abuse, child care or transportation issues, histories of long-term unemployment, and/or low basic skills.
These individuals require interventions to address their personal circumstances in order to be able to find and maintain employment. They may have higher benefit levels and exemptions to reflect their longer-term reliance on social assistance.
Aged persons - Seniors may qualify for social assistance notwithstanding their eligibility for benefits from other federal, provincial and territorial programs. Financial hardship might be due to some age-related special needs, the number of dependants in the household, or ineligibility for Old Age Security benefits. Most jurisdictions have established higher basic assistance benefit levels or other special considerations for aged persons.
Students - Post-secondary students are generally not permitted to receive social assistance while attending university, college or trade school. Students requiring financial assistance during their study period are generally expected to contact the appropriate student loan organization to receive financial assistance.
Financial eligibility
Needs or means test - Social assistance is generally granted to eligible persons on the basis of a needs test. It takes into account the basic needs and the financial resources available to an individual or family (assets and income), and the ability of those financial resources to meet their basic needs.
Assets - A household's assets may be considered as exempt or non-exempt for the purpose of calculating the social assistance entitlement. In most jurisdictions, liquid assets are defined as any assets that are readily convertible into cash including cash-on-hand, bank accounts, stocks and bonds, or other securities. Certain exemptions are allowed with respect to actual and potential liquid assets and the property of an individual or family. A portion of the cash value of a life insurance policy may be exempt from the calculation of liquid assets.
Homeowners applying for social assistance are not required to sell their principal residence and household effects (within reason) as a condition of eligibility. Similarly, applicants are not required to sell their primary vehicle, generally as long as the value of the vehicle does not exceed an allowable limit. Provisions regarding the treatment of assets such as Registered Retirement Savings Plans and Registered Education Savings Plans vary between the provinces and territories.
Assistance may be withheld, reduced or terminated where an applicant or recipient has disposed of his/her assets in an unreasonable manner in order to qualify for assistance.
Income - In addition to assets, income from all sources is examined in the calculation of entitlement to social assistance. The following types of income may be fully or partially exempt:
- Canada Child Tax Benefit
- foster home payments
- child welfare payments
- GST/HST rebates
- insurance settlements
- federal compensation payments (such as payments to those under the Hepatitis C Program, to those infected with the human immunodeficiency virus (HIV) through blood transfusions or blood products, and to Canadian merchant mariners who served in the Second World War or the Korean War)
- involuntary deductions from pay
- gifts and inheritances; and
- income from full-time employment held by dependants who are students
Partial exemptions for employment income exist in most provinces and territories. These income exemptions may be granted as an incentive for the individual to gain financial independence. The income exemption provision may take effect only after initial eligibility for social assistance has been established.
Other types of unearned income, such as Workers' Compensation benefits and Old Age Security, are non-exempt and reduce the amount of social assistance payable dollar-for-dollar.
In the determination of financial eligibility, some jurisdictional authorities may include imputed income as part of a household's income even though the household is not actually receiving money from a particular source. Living rent-free in return for janitorial or superintendent services is a common example of imputed income.
Benefits
Basic assistance - Basic assistance is generally intended to help with the cost of food, shelter, clothing, personal and household items, and may cover regularly recurring special needs. There are three basic methods used to calculate the amount of benefits to which an individual or family are entitled:
- Pre-added budget method - It combines all non-shelter requirements into a single support allowance. A separate shelter component is then provided.
- Itemized budget method - It provides a standard allowance for each of the non-shelter and shelter requirements. The sum of the individual items to which the individual or family is entitled then forms the total benefit payable.
- Flat rate of assistance - It provides a lump sum amount for non-shelter and shelter items based on a household's structure and the program in which it is participating.
Variables affecting the amount of shelter allowance payable include the number of beneficiaries in any given household, the type of living arrangement and the cost of fuel and utilities. In some jurisdictions, the shelter amount varies depending on the season, location and relative remoteness of the area in question.
Special needs assistance - Generally, this type of assistance provides items, services, or allowances related to age, disability, employment, education, training, and other special circumstances. It varies widely between jurisdictions but examples include transportation allowances, employment-related allowances, child care subsidies, drug and medical services, as well as furniture replacement, minor home repair allowances, special diet allowances, school supply allowances, and funeral services. The provision of items of special need is generally on a case-by-case basis in accordance with the applicable policies and guidelines.
Transitional assistance - In an effort to increase labour market attachment and reduce reliance on social assistance, attempts have been made to lessen the financial impact of the transition from social assistance to employment. In some jurisdictions, child care and transportation allowances have been increased to facilitate the participation in employment and re-training activities. Extended drug cards and supplementary health benefits, valid after leaving social assistance (subject to renewal) have further lessened the financial impact of accepting employment.
Indexation - Each province and territory is responsible for deciding whether to index its benefits. Most revise their rates on an ad hoc basis. Yukon annually indexes most items of basic maintenance, using the average Consumer Price Index for Whitehorse and Quebec annually indexes its benefits paid within their financial assistance program. In Quebec, benefits paid are adjusted at the same indexation rates used in the personal taxation system.
Administration
Referral to other government programs - An applicant's circumstances are reviewed to determine if social assistance is the most appropriate intervention for them. If it is determined that another governmental program may be more suitable, the applicant is referred to that program.
Method of payment - Social assistance benefits can be paid in one or more ways - such as, cash, payroll or manual cheque issue, direct deposit, voucher or authorization to purchase or direct payment to a third-party vendor or supplier.
Case review - As a condition of continuing eligibility for financial assistance, beneficiaries must report immediately any change in the circumstances of their household that would affect their entitlement to financial assistance. In addition, some jurisdictions require that long-term social assistance recipients be reviewed periodically, while short-term recipients may be reviewed more frequently.
Recoveries and reimbursement - Policies and procedures are in place concerning the recovery of social assistance granted to a person who was not entitled because of a change in household income or other circumstances, such as accidental or wilful representation or fraud. Certain forms of assistance may be conditional upon a formal agreement signed by the recipient to reimburse the government for such assistance.
Appeals - An applicant or recipient is entitled to file a request for reconsideration or appeal where he/she is dissatisfied with a decision affecting his/her entitlement to social assistance. Some provinces and territories have established limits on the type of issues that may be formally appealed, while others allow an individual to question any determination bearing on his/her case. Most jurisdictions have adopted a two-step appeal process. Social assistance personnel first conduct an internal administrative review. The applicant or recipient may then decide whether to withdraw their appeal or go forward to a formal appeals committee or board consisting of appointed members.
Children's benefits
Prior to 1998, there was minimal coordination between the federal system, which delivered child benefits through the income tax system, and provincial/territorial systems, which delivered child benefits through social assistance programs. In July 1998, the National Child Benefit (NCB) was introduced. The NCB is a joint initiative of federal, provincial and territorial governmentsFootnote 2, including a First Nations component to support Canadian children living in low-income families. The goals of the NCB are to help prevent and reduce the depth of child poverty, to promote attachment to the labour market by ensuring that families will always be better off as a result of working; and to reduce overlap and duplication by harmonizing program objectives and benefits, and through simplified administration.
Under this initiative, a new federal child benefit, the NCB Supplement, was introduced as a component of the Canada Child Tax Benefit (CCTB). The CCTB provides a base benefit to all low- and middle-income families with children. The NCB Supplement provides an additional benefit targeted to children in low-income families, whether the parents are receiving social assistance or working.
The NCB Supplement provided provinces and territories the opportunity to adjust children's social assistance by an amount equivalent to the NCB Supplement. Resulting savings are reinvested in new or enhanced programs benefiting low-income families with children.
Approaches to replacing social assistance benefits for children
Since the inception of the NCB initiative, three distinct approaches have evolved by which provinces and territories replace social assistance benefits for children with the NCB Supplement. First Nations follow the approach of the province or territory in which they are located. In two jurisdictions, New Brunswick and ManitobaFootnote 3, social assistance is not adjusted by federal increases to the NCB Supplement.
The social assistance offset approach - Under this approach child benefits remain within the social assistance system, but these benefits have been gradually displaced by federal increases to the NCB Supplement. Provinces and territories either deduct the NCB Supplement as an unearned income charge against social assistance or reduce their social assistance rates for children. In the case of income offset, social assistance recipients have the amount of the NCB Supplement they receive deducted from their social assistance entitlement. This approach is used in Prince Edward IslandFootnote 4, Yukon, Northwest Territories and Nunavut. In the case of rate reduction, social assistance rates are reduced by the maximum NCB Supplement. AlbertaFootnote 5, Footnote 6 uses this approach. Reinvestment funds under the social assistance offset approach are the savings in social assistance.
The integrated child benefit approach with adjustment - Several jurisdictions restructured their social assistance system and children's benefits are now delivered through a separate income-tested child benefit program that is integrated with the CCTB. Under this approach, increases in the NCB Supplement are offset in full or in part against the provincial child benefit. In British Columbia, the savings from this offset become the province's reinvestment funds. In Saskatchewan, the amount of reinvestment funds is set at the amount that was being spent on basic child benefits under the social assistance system at the time the system was restructured, and remains the same for subsequent years.
The integrated child benefit approach without adjustment - Other jurisdictions also restructured their social assistance system as basic benefits for children were removed from the social assistance program and are now provided through a separate income-tested program integrated with the CCTB. In these cases, however, there is no offset of the NCB Supplement against provincial child benefits. The amount of reinvestment funds is set at the funds that were being spent on basic child benefits under the social assistance system at the time the system was restructured and remains the same for subsequent years. Newfoundland and LabradorFootnote 7, Nova ScotiaFootnote 8 and OntarioFootnote 9 have adopted this approach.
Other approach - In Quebec, children needs are covered by the Canada Child Tax Benefit and the improved Quebec Family Allowances and, since January 2005, by a Tax Credit Reimbursement for Child Support. This income support allows Quebec families with children, particularly those receiving last-resort financial benefits or those with low income, to obtain transfer payments benefiting their children. These benefits are adjusted on January 1st of each year at the same indexation rate as the personal taxation system.
In 2013, provinces and territories provided NCB programs and services in six key areas: child/day care initiatives; child benefits and earned income supplements; early childhood and children-at-risk services; supplementary health benefits; youth initiatives; and other NCB programs, benefits and services. First Nations reinvestments covered a broader range of programs in five key areas: child care; child nutrition; support to parents; home-to-work transition; and cultural enrichment.
Additional information on the NCB is available in annual progress reports, which are available on the National Child Benefit website.
Chapter 3 - Newfoundland and Labrador - Income support
In Newfoundland and Labrador, the provincial social assistance program is known as Income Support. The Income and Employment Support Act and the Income and Employment Support Regulations govern Newfoundland and Labrador's social assistance program.
Income Support provides basic benefits to adults only.
Children's basic benefits are provided through the Newfoundland and Labrador Child Benefit.
Service delivery
The Department of Advanced Education and Skills is responsible for the delivery of the Income Support program to adults within the province.
Eligibility
General
In order to be eligible for the Income Support program, applicants must meet the general eligibility requirements outlined in the "Social Assistance Overview" in this report.
Liquid assets
At the time of application, applicants' liquid assets may not exceed the following allowable limits:
| Clients without disabilities | Clients with disabilities a | |
|---|---|---|
| Single | $3,000 | $3,000 |
| Family | $5,500 | $5,500 |
- Table note a. These clients must require supportive services.
- Note: The Liquid asset exemptions for clients without disabilities was increased in 2011 (single - $500 to $3,000, and family - $1,500 to $5,500)
Earnings exemptions
Once an application for assistance has been approved, Income Support program clients are eligible for the following monthly exemptions on earned income:
| Clients without disabilities | Clients with disabilities a | |
|---|---|---|
| Single | $75, plus 20% of income in excess of $75. | $150, plus 20% of income in excess of $150. |
| Family | $150, plus 20% of income in excess of $150. | $250, plus 20% of income in excess of $250. |
- Table note a. These clients must require supportive services.
- Note: The exemptions for clients requiring supportive services increased in July 2008 (from $95 to $150 for singles and $190 to $250 for families). The percentage factor also increased from 10% to 20% for all clients in July 2008.
Benefits
Basic assistance consists of individual/family benefits and a shelter allowance. Individual/family benefits cover the cost of food, clothing, and utilities for adults only. Maximum individual/family benefits rates are based primarily on the number of adults in the household. There is a differential between a single person and a single parent, and couples with and without children - however, the number of children does not impact the rates. Maximum shelter allowance rates are based on family composition - single vs. family, and the type of accommodation.
Newfoundland and Labrador provides clients who leave social assistance for employment with an extended drug card that is valid for six months.
Children's basic benefits are paid through the Newfoundland and Labrador Child Benefit.
Newfoundland and Labrador Child Benefit
The Newfoundland and Labrador Child Benefit (NLCB) is a non-taxable amount paid monthly to help low-income families with the cost of raising children under the age of 18 years. The creation of the Newfoundland and Labrador Child Benefit in July 1999, effectively removed children's benefits from the social assistance system.
The Canada Revenue Agency delivers the NLCB as an integrated payment with the CCTB and the NCB Supplement. The NLCB rates are based on net income and number of children. For instance, maximum NLCB benefits are paid to those families whose income is less than $17,397 per year. In 2013, families whose annual income falls between $17,397 and $24,580 per year (depending on the number of children) may be eligible for partial NLCB benefits.
Effective July 2013, in addition to the National Child Benefit Supplement, families with one child may be entitled to receive $364 per year. Families are eligible to receive $386 per year for their second child, $415 per year for their third child, and $445 per year for each additional child.
| Year | Families | Children |
|---|---|---|
| 2003-2004 | 19,800 | 30,000 |
| 2004-2005 | 18,834 | 29,306 |
| 2005-2006 | 18,246 | 28,393 |
| 2006-2007 | 17,329 | 27,072 |
| 2007-2008 | 16,258 | 25,297 |
| 2008-2009 | 14,956 | 23,640 |
| 2009-2010 | 14,072 | 22,325 |
| 2010-2011 | 13,416 | 21,257 |
| 2011-2012 | 13,036 | 20,694 |
| 2012-2013 | 12,298 | 19,601 |
More information
For more information, please consult the Newfoundland and Labrador Department of Advanced Education and Skills website.
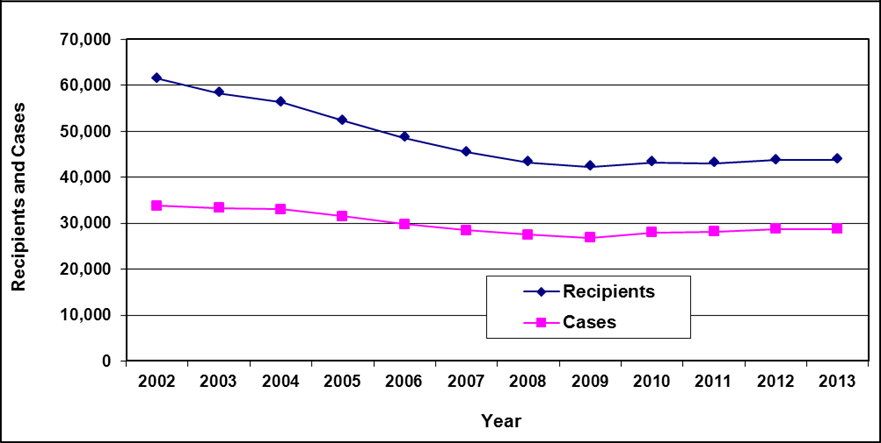
Statistics
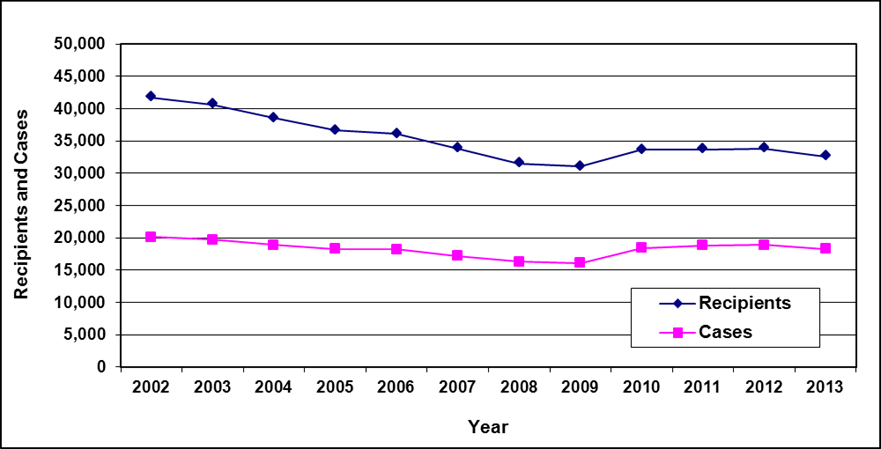
Recipients and cases
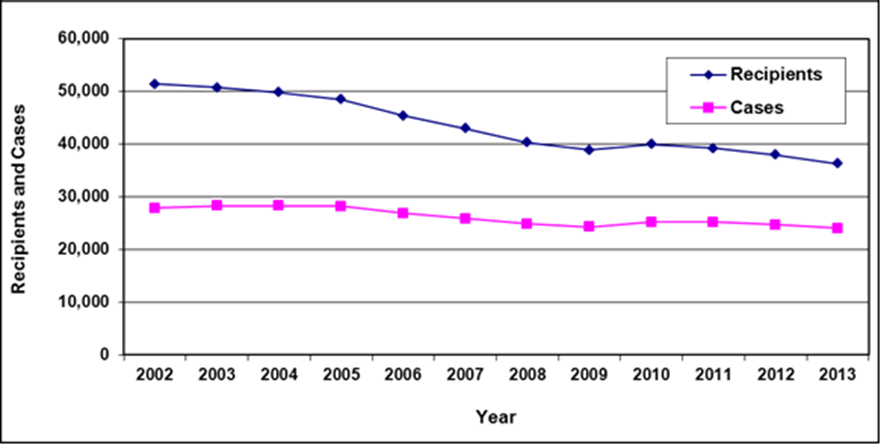
Text description of Table 3-1
| Year | 2002 | 2003 | 2004 a | 2005 a | 2006 | 2007 | 2008 | 2009 | 2010 | 2011 | 2012 | 2013 |
|---|---|---|---|---|---|---|---|---|---|---|---|---|
| Recipients | 51,400 | 50,700 | 49,800 | 48,500 | 45,400 | 43,000 | 40,300 | 38,900 | 40,000 | 39,200 | 38,000 | 36,300 |
| Cases | 27,900 | 28,300 | 28,300 | 28,200 | 26,900 | 25,900 | 24,900 | 24,300 | 25,200 | 25,200 | 24,700 | 24,000 |
- Table note a. "The total caseload for March 2004 and March 2005 includes a small number of cases paid through other means. Additional differences are due to slight variations in the selection criterion used to derive the official count and the criterion used to produce data extracts for subsequent detailed analysis."
Cases by reason for assistance
| Reason for assistance | 2009 | 2010 | 2011 | 2012 | 2013 | |||||
|---|---|---|---|---|---|---|---|---|---|---|
| # | % | # | % | # | % | # | % | # | % | |
| Employed | 1,000 | 4% | 900 | 4% | 800 | 3% | 800 | 3% | 800 | 3% |
| Unemployed | 14,700 | 60% | 15,700 | 62% | 16,000 | 63% | 15,800 | 64% | 15,400 | 64% |
| Disability | 5,500 | 23% | 5,600 | 22% | 5,600 | 22% | 5,500 | 22% | 5,300 | 22% |
| Sole support parent | 1,000 | 4% | 1,000 | 4% | 1,000 | 4% | 900 | 4% | 800 | 3% |
| Age-related | 300 | 1% | 300 | 1% | 300 | 1% | 200 | 1% | 200 | 1% |
| Student | 400 | 2% | 500 | 2% | 500 | 2% | 500 | 2% | 500 | 2% |
| Other a | 1,400 | 6% | 1,200 | 5% | 1,100 | 4% | 1,000 | 4% | 900 | 4% |
| Total | 24,300 | 100% | 25,200 | 100% | 25,200 | 100% | 24,700 | 100% | 24,000 | 100% |
- Table note a. "Other" includes clients paid in the new CAPS pay system. This field did not match upon conversion from the old system. Until cases are reviewed in the new pay system and the reason for assistance field is updated, the number of cases in the "other" category will continue to be higher than previous years. Accuracy in this area will improve over time.
- Note: Totals may not add due to rounding.
Recipients by family type
| Family type | 2009 | 2010 | 2011 | 2012 | 2013 | |||||
|---|---|---|---|---|---|---|---|---|---|---|
| # | % | # | % | # | % | # | % | # | % | |
| Adults - Single | 15,200 | 39% | 16,100 | 40% | 16,600 | 42% | 16,500 | 43% | 16,300 | 45% |
| Adults - Couple, no dependants | 4,900 | 13% | 4,700 | 12% | 4,400 | 11% | 4,200 | 11% | 3,900 | 11% |
| Adults - Single parent | 5,300 | 14% | 5,400 | 14% | 5,200 | 13% | 5,000 | 13% | 4,800 | 13% |
| Adults - Couple with dependants | 2,800 | 7% | 2,800 | 7% | 2,500 | 6% | 2,200 | 6% | 1,900 | 5% |
| Total adults | 28,200 | 72% | 29,000 | 73% | 28,700 | 73% | 27,900 | 73% | 26,900 | 74% |
| Children - Single parent | 8,100 | 21% | 8,400 | 21% | 8,200 | 21% | 7,900 | 21% | 7,600 | 21% |
| Children - Couple with dependants | 2,600 | 7% | 2,600 | 7% | 2,300 | 6% | 2,100 | 6% | 1,900 | 5% |
| Total children | 10,700 | 28% | 11,000 | 28% | 10,500 | 27% | 10,000 | 26% | 9,500 | 26% |
| Total recipients | 38,900 | 100% | 40,000 | 100% | 39,200 | 100% | 38,000 | 100% | 36,300 | 100% |
- Note: Totals may not add due to rounding.
Cases by age of head
| Age of head | 2009 | 2010 | 2011 | 2012 | 2013 |
|---|---|---|---|---|---|
| <20 | 700 | 700 | 600 | 700 | 600 |
| 20-24 | 2,200 | 2,500 | 2,600 | 2,400 | 2,200 |
| 25-29 | 2,300 | 2,500 | 2,500 | 2,500 | 2,400 |
| 30-34 | 2,400 | 2,500 | 2,400 | 2,500 | 2,400 |
| 35-39 | 2,700 | 2,700 | 2,600 | 2,500 | 2,400 |
| 40-44 | 2,800 | 2,800 | 2,700 | 2,600 | 2,500 |
| 45-49 | 3,000 | 3,100 | 3,000 | 3,000 | 2,900 |
| 50-54 | 3,000 | 3,000 | 3,100 | 3,000 | 3,000 |
| 55-59 | 2,800 | 2,900 | 3,000 | 3,000 | 2,900 |
| 60-64 | 2,200 | 2,300 | 2,300 | 2,300 | 2,400 |
| 65+ | 300 | 300 | 300 | 200 | 200 |
| Total | 24,300 | 25,200 | 25,200 | 24,700 | 24,000 |
- Note: Totals may not add due to rounding.
Cases by education of head
| Education of head a | 2009 | 2010 | 2011 | 2012 | 2013 | |||||
|---|---|---|---|---|---|---|---|---|---|---|
| # | % | # | % | # | % | # | % | # | % | |
| Primary b | 6,800 | 28% | 6,600 | 26% | 6,300 | 25% | 6,000 | 24% | 5,600 | 23% |
| Secondary c | 13,200 | 54% | 14,100 | 56% | 14,300 | 57% | 14,100 | 57% | 13,800 | 58% |
| Community/technical college | 2,500 | 10% | 2,800 | 11% | 2,900 | 12% | 2,900 | 12% | 2,900 | 12% |
| University | 700 | 3% | 700 | 3% | 800 | 3% | 700 | 3% | 800 | 3% |
| Other | 1,000 | 4% | 1,000 | 4% | 1,000 | 4% | 1,000 | 4% | 900 | 4% |
| Total | 24,300 | 100% | 25,200 | 100% | 25,200 | 100% | 24,700 | 100% | 24,000 | 100% |
- Table note a. Education is defined as level of education attained by the head of the household as of March 31.
- Table note b. "Primary" includes Kindergarten to Grade 8.
- Table note c. "Secondary" includes Grade 9 to Grade 12.
- Note: Totals may not add due to rounding.
Cases reporting income by source of income
| Source of income | 2009 | 2010 | 2011 | 2012 | 2013 | |||||
|---|---|---|---|---|---|---|---|---|---|---|
| # | % | # | % | # | % | # | % | # | % | |
| Employment | 1,000 | 19% | 900 | 17% | 800 | 15% | 800 | 16% | 800 | 16% |
| Government transfers | 2,600 | 49% | 2,700 | 51% | 2,700 | 52% | 2,700 | 54% | 2,600 | 53% |
| Support payments | 1,300 | 25% | 1,300 | 25% | 1,300 | 25% | 1,200 | 24% | 1,200 | 24% |
| Employment Insurance | 200 | 4% | 200 | 4% | 200 | 4% | 100 | 2% | 100 | 2% |
| Other a | 200 | 4% | 200 | 4% | 200 | 4% | 200 | 4% | 200 | 4% |
| Total b (includes double-counting) |
5,300 | 100% | 5,300 | 100% | 5,200 | 100% | 5,000 | 100% | 4,900 | 100% |
- Table note a. "Other" includes training allowances and other income.
- Table note b. Total cases in these categories may include double-counting, since cases that have more than one source of income are counted for each source reported.
- Note: Totals may not add due to rounding.
| Year | 2009 | 2010 | 2011 | 2012 | 2013 |
|---|---|---|---|---|---|
| Reporting income | 5,000 | 5,100 | 4,900 | 4,800 | 4,600 |
| No income | 19,300 | 20,100 | 20,300 | 19,900 | 19,400 |
| Total | 24,300 | 25,200 | 25,200 | 24,700 | 24,000 |
- Note: Totals may not add due to rounding.
Chapter 4 - Prince Edward Island - Social assistance
In Prince Edward Island, the provincial social assistance program is known as Social Assistance (SA). The Social Assistance Act and the Social Assistance Regulations govern Prince Edward Island's Social Assistance program.
Social Assistance provides basic benefits to both adults and children.
Disability supports are provided through Prince Edward Island's Disability Support Program.
Service delivery
The Department of Community Services and SeniorsFootnote 10 is responsible for the delivery of the Social Assistance program to adults and children within the province.
Eligibility
General
In order to be eligible for the Social Assistance program, applicants must meet the general eligibility requirements outlined in the "Social Assistance Overview" in this report.
Liquid assets
At the time of application, applicants' liquid assets may not exceed the following allowable limits.
Short-term assistance
Single persons who are expected to receive benefits for less than four months (short-term assistance) and/or who are seasonally unemployed are entitled to retain $50.
Long-term assistanceFootnote 11
| Clients without disabilities | Clients with disabilities | |
|---|---|---|
| Single | $200 | $900 |
| Single-parent family | $900 plus $300 per dependant to a maximum of $2,400. | $900 plus $300 per dependant to a maximum of $2,400. |
| Childless couple | $1,200 | $1,800 |
| Two-parent family | $1,200 plus $300 per dependant to a maximum of $2,400. | $1,800 plus $300 per dependant to a maximum of $2,400. |
Earnings exemptions
Social Assistance program clients are eligible for the following monthly exemptions on earned income:
Prince Edward Island - Earnings exemptions, March 2013
- Single: $75 plus 10% of the excess
- Family: $125 plus 10% of the excess
Benefits
Basic assistance consists of a basic allowance and a shelter allowance. The basic allowance covers the cost of food, clothing, utilities, and personal and household items. Maximum basic allowance rates are based on the number of persons in the household and the age of the children. Maximum shelter allowance rates are based on the number of persons in the household (including children) and the type of living arrangements.
Disability Support Program
In October 2001, Prince Edward Island launched the PEI Disability Support Program. Designed to meet the unique needs of persons with disabilities, the Disability Support Program offers both financial and case planning assistance to eligible individuals. It is comprised of three components: Adult Disability Supports, Child Disability Supports, and Employment and Vocational Supports.
The Disability Support Program is available to individuals under 65 years of age who have a physical, neurological, or intellectual disability that limits their ability to perform activities necessary for their independence and well-being.
Individuals and families receiving benefits through the Disability Support Program must assume a portion of the cost associated with the provision of services. The amount of this contribution is based on the individual or family's ability to contributeFootnote 12.
Persons with disabilities continue to receive financial assistance through the Social Assistance program, but now receive targeted disability-related supports through the Disability Support Program. Individuals and families receiving support through the Disability Support Program are ineligible for certain benefits provided by the Social Assistance program.
Prince Edward Island - Disability Support Program number of recipients 2001-2002 to 2012-2013
- 2001-2002: 691
- 2002-2003: 991
- 2003-2004: 1,047
- 2004-2005: 1,117
- 2005-2006: 1,076
- 2006-2007: 1,106
- 2007-2008: 1,065
- 2008-2009: 1,115
- 2009-2010: 1,183
- 2010-2011: 1,215
- 2011-2012: 1,232
- 2012-2013: 1,269
More information
For more information, please consult the Prince Edward Island Department of Community Services and Seniors website.
Statistics
Recipients and cases
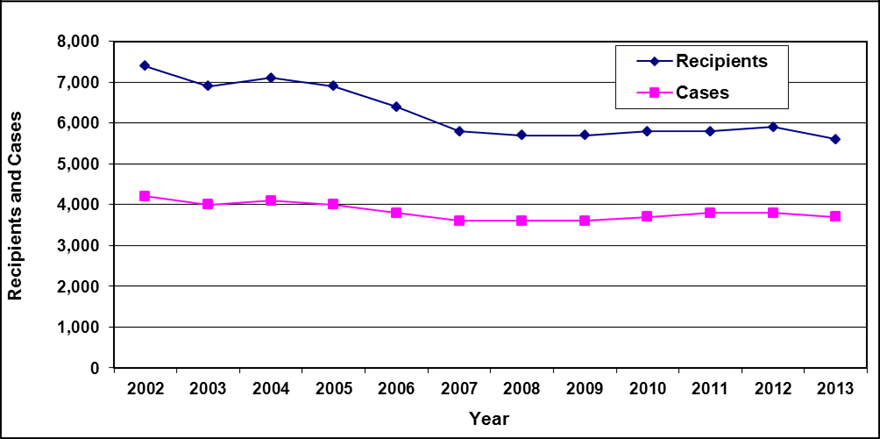
Text description of Table 4-1:
| Year | 2002 | 2003 | 2004a | 2005 | 2006 | 2007 | 2008 | 2009 | 2010 | 2011 | 2012 | 2013 |
|---|---|---|---|---|---|---|---|---|---|---|---|---|
| Recipients | 7,400 | 6,900 | 7,100 | 6,900 | 6,400 | 5,800 | 5,700 | 5,700 | 5,800 | 5,800 | 5,900 | 5,600 |
| Cases | 4,200 | 4,000 | 4,100 | 4,000 | 3,800 | 3,600 | 3,600 | 3,600 | 3,700 | 3,800 | 3,800 | 3,700 |
- Table note a. "For 2004, due to changes in reporting system, February data was used."
Cases by reason for assistance
| Reason for assistance | 2009 | 2010 | 2011 | 2012 | 2013 | |||||
|---|---|---|---|---|---|---|---|---|---|---|
| # | % | # | % | # | % | # | % | # | % | |
| Employed | 400 | 11% | 400 | 11% | 400 | 11% | 400 | 11% | 300 | 8% |
| Unemployed | 800 | 22% | 800 | 22% | 800 | 21% | 800 | 21% | 700 | 19% |
| Short term disability | 200 | 6% | 200 | 5% | 300 | 8% | 300 | 8% | 300 | 8% |
| Long term disability | 2,000 | 56% | 2,100 | 57% | 2,100 | 55% | 2,100 | 55% | 2,100 | 57% |
| High support needs a | 200 | 6% | 200 | 5% | 200 | 5% | 200 | 5% | 200 | 5% |
| Total | 3,600 | 100% | 3,700 | 100% | 3,800 | 100% | 3,800 | 100% | 3,700 | 100% |
- Table note a. "High support needs" includes clients with multiple barriers to employment.
- Note: Totals may not add due to rounding.
Recipients by family type
| Family type | 2009 | 2010 | 2011 | 2012 | 2013 | |||||
|---|---|---|---|---|---|---|---|---|---|---|
| # | % | # | % | # | % | # | % | # | % | |
| Adults - Single | 2,500 | 44% | 2,600 | 45% | 2,800 | 48% | 2,800 | 47% | 2,700 | 48% |
| Adults - Couple, no dependants | 400 | 7% | 300 | 5% | 400 | 7% | 300 | 5% | 300 | 5% |
| Adults - Single parent | 700 | 12% | 700 | 12% | 700 | 12% | 700 | 12% | 600 | 11% |
| Adults - Couple with dependants | 400 | 7% | 400 | 7% | 400 | 7% | 400 | 7% | 300 | 5% |
| Total adults | 4,000 | 70% | 4,100 | 71% | 4,200 | 72% | 4,200 | 71% | 4,000 | 71% |
| Children - Single parent | 1,300 | 23% | 1,300 | 22% | 1,200 | 21% | 1,200 | 20% | 1,200 | 21% |
| Children - Couple with dependants | 500 | 9% | 400 | 7% | 400 | 7% | 400 | 7% | 400 | 7% |
| Total children | 1,700 | 30% | 1,700 | 29% | 1,600 | 28% | 1,700 | 29% | 1,600 | 29% |
| Total recipients | 5,700 | 100% | 5,800 | 100% | 5,800 | 100% | 5,900 | 100% | 5,600 | 100% |
- Note: Totals may not add due to rounding.
Cases by age of head
| Age of head | 2009 | 2010 | 2011 | 2012 | 2013 |
|---|---|---|---|---|---|
| <20 | 100 | 100 | 100 | 100 | 100 |
| 20-24 | 200 | 300 | 300 | 300 | 300 |
| 25-29 | 300 | 300 | 400 | 300 | 300 |
| 30-34 | 300 | 300 | 300 | 300 | 300 |
| 35-39 | 300 | 300 | 300 | 300 | 300 |
| 40-44 | 400 | 400 | 400 | 400 | 300 |
| 45-49 | 400 | 400 | 400 | 400 | 400 |
| 50-54 | 400 | 400 | 400 | 400 | 400 |
| 55-59 | 400 | 400 | 400 | 400 | 400 |
| 60-64 | 400 | 400 | 400 | 400 | 400 |
| 65+ | 400 | 400 | 400 | 400 | 400 |
| Total | 3,600 | 3,700 | 3,800 | 3,800 | 3,700 |
- Note: Totals may not add due to rounding.
Cases by education of head
| Education of head a | 2009 | 2010 | 2011 | 2012 | 2013 | |||||
|---|---|---|---|---|---|---|---|---|---|---|
| # | % | # | % | # | % | # | % | # | % | |
| Primary | 800 | 22% | 800 | 22% | 800 | 21% | 700 | 18% | 700 | 19% |
| Secondary | 1,900 | 53% | 2,000 | 54% | 2,000 | 53% | 2,000 | 53% | 1,900 | 51% |
| Community/technical college | 400 | 11% | 500 | 14% | 500 | 13% | 500 | 13% | 500 | 14% |
| University | 200 | 6% | 100 | 3% | 100 | 3% | 200 | 5% | 200 | 5% |
| Unknown | 400 | 11% | 400 | 11% | 400 | 11% | 400 | 11% | 400 | 11% |
| Total | 3,600 | 100% | 3,700 | 100% | 3,800 | 100% | 3,800 | 100% | 3,700 | 100% |
- Table note a. Education is defined as level of education attained as of date of application.
- Note: Totals may not add due to rounding.
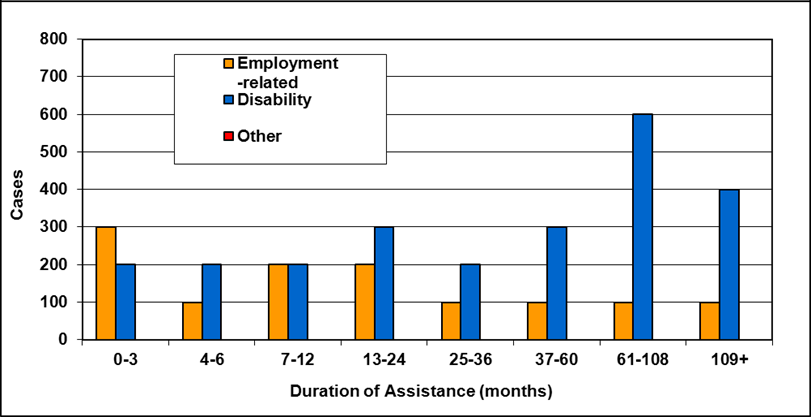
Cases by reason for assistance and duration of assistance
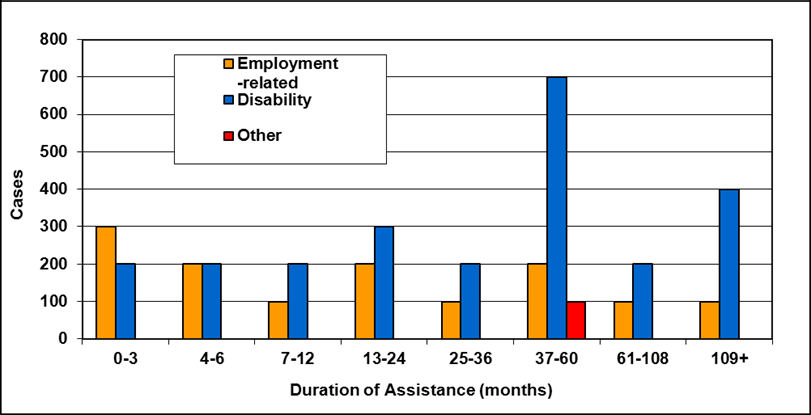
Text description of Table 4-6a
| Duration of assistance a (months) | Reason for assistance | |||
|---|---|---|---|---|
| Employment-related b | Disability c | Other d | Total | |
| 0-3 | 300 | 200 | - | 500 |
| 4-6 | 200 | 200 | - | 300 |
| 7-12 | 100 | 200 | - | 400 |
| 13-24 | 200 | 300 | - | 400 |
| 25-36 | 100 | 200 | - | 300 |
| 37-60 | 200 | 700 | 100 | 900 |
| 61-108 | 100 | 200 | - | 300 |
| 109+ | 100 | 400 | - | 500 |
| Total | 1,200 | 2,200 | 200 | 3,600 |
- Table note a. "Duration of assistance measures length of current spell only."
- Table note b. "Employment-related includes employed and unemployed."
- Table note c. "Disability includes long-term disability and short-term disability."
- Table note d. "Other includes high support needs, age related and unknown."
- Note: Totals may not add due to rounding.
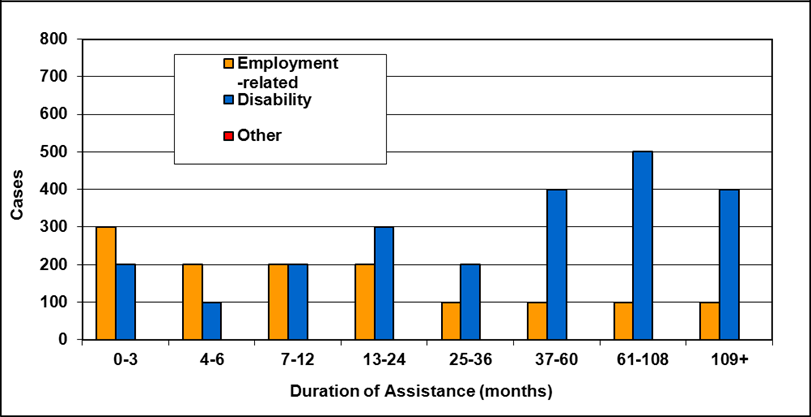
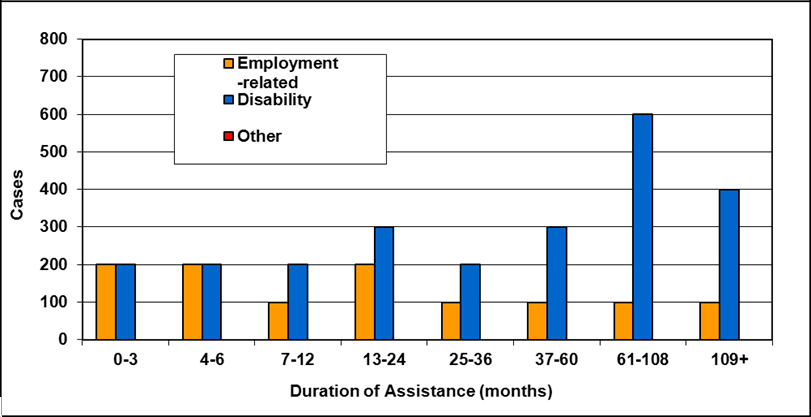
Text description of Table 4-6b
| Duration of assistance a (months) | Reason for assistance | |||
|---|---|---|---|---|
| Employment-related b | Disability c | Other d | Total | |
| 0-3 | 300 | 200 | - | 500 |
| 4-6 | 200 | 100 | - | 300 |
| 7-12 | 200 | 200 | - | 400 |
| 13-24 | 200 | 300 | - | 500 |
| 25-36 | 100 | 200 | - | 300 |
| 37-60 | 100 | 400 | - | 500 |
| 61-108 | 100 | 500 | - | 600 |
| 109+ | 100 | 400 | - | 500 |
| Total | 1,200 | 2,300 | 200 | 3,700 |
- Table note a. "Duration of assistance measures length of current spell only."
- Table note b. "Employment-related includes employed and unemployed."
- Table note c. "Disability includes long-term disability and short-term disability."
- Table note d. "Other includes high support needs, age related and unknown."
- Note: Totals may not add due to rounding.
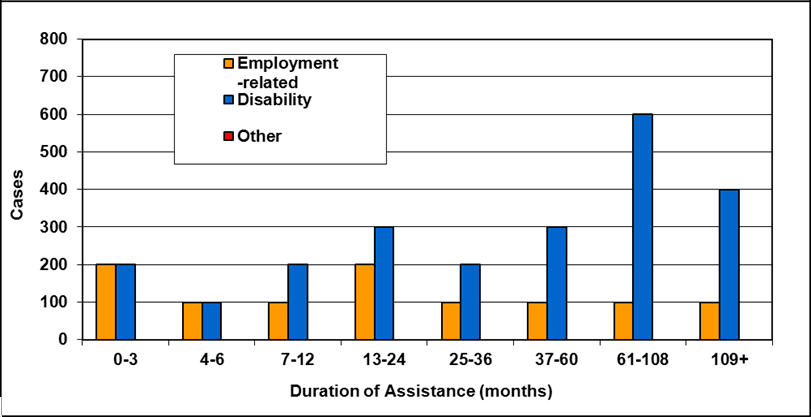
Text description of Table 4-6c
| Duration of assistance a (months) | Reason for assistance | |||
|---|---|---|---|---|
| Employment-related b | Disability c | Other d | Total | |
| 0-3 | 300 | 200 | - | 500 |
| 4-6 | 100 | 200 | - | 300 |
| 7-12 | 200 | 200 | - | 400 |
| 13-24 | 200 | 300 | - | 500 |
| 25-36 | 100 | 200 | - | 300 |
| 37-60 | 100 | 300 | - | 400 |
| 61-108 | 100 | 600 | - | 800 |
| 109+ | 100 | 400 | - | 500 |
| Total | 1,200 | 2,400 | 200 | 3,800 |
- Table note a. "Duration of assistance measures length of current spell only."
- Table note b. "Employment-related includes employed and unemployed."
- Table note c. "Disability includes long-term disability and short-term disability."
- Table note d. "Other includes high support needs, age related and unknown."
- Note: Totals may not add due to rounding.
Text description of Table 4-6d
| Duration of assistance a (months) | Reason for assistance | |||
|---|---|---|---|---|
| Employment-related b | Disability c | Other d | Total | |
| 0-3 | 200 | 200 | - | 500 |
| 4-6 | 200 | 200 | - | 400 |
| 7-12 | 100 | 200 | - | 400 |
| 13-24 | 200 | 300 | - | 500 |
| 25-36 | 100 | 200 | - | 300 |
| 37-60 | 100 | 300 | - | 500 |
| 61-108 | 100 | 600 | - | 800 |
| 109+ | 100 | 400 | - | 500 |
| Total | 1,200 | 2,400 | 200 | 3,800 |
- Table note a. "Duration of assistance measures length of current spell only."
- Table note b. "Employment-related includes employed and unemployed."
- Table note c. "Disability includes long-term disability and short-term disability."
- Table note d. "Other includes high support needs, age related and unknown."
- Note: Totals may not add due to rounding.
Text description of Table 4-6e
| Duration of assistance a (months) | Reason for assistance | |||
|---|---|---|---|---|
| Employment-related b | Disability c | Other d | Total | |
| 0-3 | 200 | 200 | - | 400 |
| 4-6 | 100 | 100 | - | 300 |
| 7-12 | 100 | 200 | - | 400 |
| 13-24 | 200 | 300 | - | 500 |
| 25-36 | 100 | 200 | - | 400 |
| 37-60 | 100 | 300 | - | 500 |
| 61-108 | 100 | 600 | - | 800 |
| 109+ | 100 | 400 | - | 500 |
| Total | 1,100 | 2,400 | 200 | 3,700 |
- Table note a. "Duration of assistance measures length of current spell only."
- Table note b. "Employment-related includes employed and unemployed."
- Table note c. "Disability includes long-term disability and short-term disability."
- Table note d. "Other includes high support needs, age related and unknown."
- Note: Totals may not add due to rounding.
Cases reporting income by source of income
| Source of income | 2009 | 2010 | 2011 | 2012 | 2013 | |||||
|---|---|---|---|---|---|---|---|---|---|---|
| # | % | # | % | # | % | # | % | # | % | |
| Employment | 400 | 13% | 400 | 13% | 400 | 13% | 400 | 17% | 300 | 14% |
| Government transfers | 2,000 | 67% | 2,100 | 68% | 2,200 | 71% | 1,400 | 61% | 1,400 | 67% |
| Support payments | 200 | 7% | 200 | 6% | 100 | 3% | 100 | 4% | 100 | 5% |
| Employment Insurance | 100 | 3% | 100 | 3% | 100 | 3% | 100 | 4% | 100 | 5% |
| Other a | 200 | 7% | 200 | 6% | 300 | 10% | 300 | 13% | 300 | 14% |
| Total b (includes double-counting) |
3,000 | 100% | 3,100 | 100% | 3,100 | 100% | 2,300 | 100% | 2,100 | 100% |
- Table note a. "Other" includes training allowances and other income.
- Table note b. Total cases in these categories may include double-counting, since cases that have more than one source of income are counted for each source reported.
- Note: Totals may not add due to rounding.
| Year | 2009 | 2010 | 2011 | 2012 | 2013 |
|---|---|---|---|---|---|
| Reporting income | 2,000 | 2,000 | 2,100 | 1,600 | 1,600 |
| No income | 1,600 | 1,700 | 1,800 | 2,200 | 2,100 |
| Total | 3,600 | 3,700 | 3,800 | 3,800 | 3,700 |
- Note: Totals may not add due to rounding.
Chapter 5 - Nova Scotia - Employment Support and Income Assistance
In Nova Scotia, the provincial social assistance program is known as Employment Support and Income Assistance (ESIA). The Employment Support and Income Assistance Act and the Employment Support and Income Assistance Regulations govern Nova Scotia's Employment Support and Income Assistance program.
The Employment Support and Income Assistance program provides financial assistance and supports to help people maximize their self-sufficiency by increasing their employability and their independence.
Children's basic benefits are provided through the Nova Scotia Child Benefit as part of the Canada Child Tax Benefit.
Service delivery
The Department of Community Services is responsible for the delivery of the Employment Support and Income Assistance program to individuals and families within the province.
Eligibility
General
In order to be eligible for the Employment Support and Income Assistance program, applicants must meet the general eligibility requirements outlined in the "Social Assistance Overview" in this report.
Liquid assets
At the time of application, applicants' liquid assets may not exceed the following allowable limits:
| Clients without disabilities | Clients with disabilities | |
|---|---|---|
| Single | $1,000 | $1,000 |
| Family | $2,000 | $2,000 |
- Note: Effective January 1, 2011, liquid asset exemption levels increased from $500 to $1,000 for single individuals with and without disabilities and from $1,000 to $2,000 for families with and without disabilities.
Earnings exemptions
When determining initial eligibility for Employment Support and Income Assistance, earned income is considered in determination of eligibility. To determine ongoing eligibility, clients are eligible for the following monthly exemptions on earned income:
| Clients without disabilities | Clients with disabilities a | |
|---|---|---|
| Single | $150 per individual plus 30% of remaining net wages. | $300 per individual (if applicable) plus 30% of remaining net wages. |
| Family | $150 per individual plus 30% of remaining net wages. | $300 per individual (if applicable) plus 30% of remaining net wages. |
- Table note a. These clients are in supported employment.
- Note: Effective July 1, 2011, recipients who have earned wages from employment will retain the first $150 of their earnings, plus 30% of the remaining net wages. ESIA recipients participating in supported employment will retain an additional $150 for a total of $300 per month as exempt in calculating net wages, plus retain 30% of the remaining net wages.
Benefits
Basic assistance consists of a personal allowance and a shelter allowance. The personal allowance covers the cost of food, clothing, and miscellaneous essentials for adults in the family. The shelter allowance includes the actual amount for rent/mortgage, fuel and utilities, up to the allowed maximum. Maximum shelter allowance rates are based on the number of persons in the household (including children) and the type of accommodation.
Nova Scotia provides transitional drug coverage for twelve months to clients who leave social assistance for employment.
Children's basic benefits are paid through the Nova Scotia Child Benefit, as part of the Canada Child Tax Benefit, which is exempt as chargeable income.
Nova Scotia Child Benefit
The Nova Scotia Child Benefit (NSCB) is a non-taxable amount paid monthly to help low-income families with the cost of raising children under the age of 18 years. The implementation of the Employment Support and Income Assistance Act and Employment Support and Income Assistance Regulations in August 2001 removed children's benefits from the social assistance system.
The Canada Revenue Agency delivers the NSCB as an integrated payment with the CCTB and the NCB Supplement. The NSCB rates are based on net income and number of children. For instance, maximum NSCB benefits are paid to those families whose income is less than $15,999, while families whose annual income falls between $16,000 and $20,921 per year (depending on the number of children) are eligible for partial NSCB benefits.
Effective July 2001, in addition to the National Child Benefit Supplement, families with one child may be entitled to receive a NSCB benefit. Currently, families may be entitled to receive benefits for one child up to $625 per year. Families may be entitled to receive $825 per year for their second child, and $900 per year for their third and each additional child.
The income threshold of the NSCB increased in July 2012 providing additional families to receive benefits. Prior to this, there has been a decline in the number of families receiving the Nova Scotia Child Benefit. The changing demographics and improved economy in the Province of Nova Scotia contribute to this decline.
There continues to be a decline in the number of families receiving the Nova Scotia Child Benefit. The changing demographics and improved economy in the Province of Nova Scotia contribute to this decline.
The Nova Scotia government funds the Low Income Pharmacare Program that provides prescription drug coverage for children of low-income families. The program is available for families who receive the Nova Scotia Child Benefit.
| Year | Families | Children |
|---|---|---|
| 2001-2002 | 33,224 | 55,986 |
| 2002-2003 | 31,905 | 53,961 |
| 2003-2004 | 30,743 | 52,054 |
| 2004-2005 | 29,247 | 49,690 |
| 2005-2006 | 28,215 | 48,033 |
| 2006-2007 | 26,762 | 45,511 |
| 2007-2008 | 24,836 | 42,468 |
| 2008-2009 | 23,006 | 39,572 |
| 2009-2010 | 22,940 | 39,388 |
| 2010-2011 | 23,830 | 40,684 |
| 2011-2012 | 22,433 | 38,042 |
| 2012-2013 | 22,713 | 38,423 |
More information
For more information, please consult the Nova Scotia Department of Community Services website.
Statistics
Recipients and cases
Text description of Table 5-1
| Year | 2002 | 2003 | 2004 | 2005 a | 2006 a | 2007 a, b | 2008 a | 2009 a | 2010 a | 2011 a | 2012 a | 2013 a |
|---|---|---|---|---|---|---|---|---|---|---|---|---|
| Recipients | 61,500 | 58,300 | 56,300 | 52,300 | 48,600 | 45,400 | 43,200 | 42,300 | 43,200 | 43,100 | 43,700 | 43,800 |
| Cases | 33,800 | 33,300 | 33,000 | 31,500 | 29,800 | 28,500 | 27,500 | 26,800 | 28,000 | 28,200 | 28,700 | 28,700 |
- Table note a. "Starting in March 2005, recipients and cases do not include Transitional Pharmacare."
- Table note b. "Caseload data represents January 2007. Concurrent data for the month ending March 31, 2007 is not available."
Cases by reason for assistance
| Reason for assistance | 2009 | 2010 | 2011 | 2012 | 2013 | |||||
|---|---|---|---|---|---|---|---|---|---|---|
| # | % | # | % | # | % | # | % | # | % | |
| Employed | 500 | 2% | 600 | 2% | 500 | 2% | 600 | 2% | 600 | 2% |
| Unemployed | 5,000 | 19% | 5,800 | 21% | 6,000 | 21% | 6,500 | 23% | 6,500 | 23% |
| Short term disabled | 3,200 | 12% | 3,600 | 13% | 4,000 | 14% | 4,200 | 15% | 4,200 | 15% |
| Long term disabled | 12,400 | 46% | 12,400 | 44% | 12,400 | 44% | 12,300 | 43% | 12,200 | 43% |
| Sole support parent | 2,800 | 10% | 2,700 | 10% | 2,600 | 9% | 2,500 | 9% | 2,400 | 8% |
| Age-related b | 900 | 3% | 1,100 | 4% | 1,200 | 4% | 1,200 | 4% | 1,300 | 5% |
| Student | 300 | 1% | 400 | 1% | 400 | 1% | 300 | 1% | 300 | 1% |
| Other c | 1,700 | 6% | 1,500 | 5% | 1,300 | 5% | 1,200 | 4% | 1,200 | 4% |
| Total | 26,800 | 100% | 28,000 | 100% | 28,200 | 100% | 28,700 | 100% | 28,700 | 100% |
- Table note a. Cases do not include Transitional Pharmacare.
- Table note b. "Age-related" includes persons 55 years and over.
- Table note c. "Other" includes clients receiving a one-time payment and clients receiving extended pharmacare (prescription drug benefits).
- Note: Totals may not add due to rounding.
Recipients by family type
| Family type | 2009 | 2010 | 2011 | 2012 | 2013 | |||||
|---|---|---|---|---|---|---|---|---|---|---|
| # | % | # | % | # | % | # | % | # | % | |
| Adults - Single | 18,500 | 43% | 19,300 | 44% | 19,800 | 45% | 20,200 | 45% | 20,300 | 45% |
| Adults - Couple, no dependants | 1,700 | 4% | 1,700 | 4% | 1,700 | 4% | 1,600 | 4% | 1,500 | 3% |
| - Spouse | 1,700 | 4% | 1,700 | 4% | 1,700 | 4% | 1,600 | 4% | 1,500 | 3% |
| Adults - Single parent | 6,000 | 14% | 6,100 | 14% | 6,000 | 14% | 6,000 | 13% | 6,000 | 13% |
| Adults - Couple with dependants | 1,300 | 3% | 1,300 | 3% | 1,300 | 3% | 1,300 | 3% | 1,300 | 3% |
| - Spouse | 1,300 | 3% | 1,300 | 3% | 1,300 | 3% | 1,300 | 3% | 1,300 | 3% |
| Total adults | 30,400 | 71% | 31,400 | 71% | 31,700 | 72% | 32,000 | 72% | 32,000 | 72% |
| Children - Single parent | 9,900 | 23% | 10,200 | 23% | 9,800 | 22% | 9,900 | 22% | 9,900 | 22% |
| Children - Couple with dependants | 2,500 | 6% | 2,500 | 6% | 2,600 | 6% | 2,600 | 6% | 2,700 | 6% |
| Total children | 12,500 | 29% | 12,700 | 29% | 12,400 | 28% | 12,500 | 28% | 12,600 | 28% |
| Total recipients | 42,800 | 100% | 44,100 | 100% | 44,100 | 100% | 44,500 | 100% | 44,700 | 100% |
- Table note a. The above table includes recipients receiving Transitional Pharmacare, which are not to be considered part of the total social assistance recipients that appears in Table 5-1.
- Note: Totals may not add due to rounding.
Cases by age of head
| Age of head | 2009 | 2010 | 2011 | 2012 | 2013 |
|---|---|---|---|---|---|
| <20 | 400 | 600 | 600 | 600 | 500 |
| 20-24 | 2,600 | 3,000 | 3,100 | 3,400 | 3,300 |
| 25-29 | 2,700 | 2,900 | 2,900 | 3,000 | 2,900 |
| 30-34 | 2,400 | 2,600 | 2,700 | 2,700 | 2,700 |
| 35-39 | 2,600 | 2,700 | 2,600 | 2,700 | 2,600 |
| 40-44 | 3,000 | 2,900 | 2,900 | 2,800 | 2,900 |
| 45-49 | 3,600 | 3,700 | 3,600 | 3,600 | 3,400 |
| 50-54 | 3,500 | 3,500 | 3,600 | 3,700 | 3,900 |
| 55-59 | 3,100 | 3,200 | 3,200 | 3,400 | 3,500 |
| 60-64 | 2,700 | 2,700 | 2,800 | 2,700 | 2,700 |
| 65+ | 100 | 100 | 100 | 200 | 100 |
| Total | 26,800 | 28,000 | 28,200 | 28,700 | 28,700 |
- Table note a. Cases do not include Transitional Pharmacare.
- Note: Totals may not add due to rounding.
Cases reporting income by source of income
| Source of income | 2009 | 2010 | 2011 | 2012 | 2013 | |||||
|---|---|---|---|---|---|---|---|---|---|---|
| # | % | # | % | # | % | # | % | # | % | |
| Employment | 2,700 | 13% | 2,700 | 12% | 2,600 | 12% | 2,900 | 13% | 3,100 | 14% |
| Government transfers | 13,900 | 66% | 14,700 | 67% | 15,000 | 69% | 15,400 | 68% | 15,600 | 68% |
| Support payments | 2,800 | 13% | 2,700 | 12% | 2,600 | 12% | 2,600 | 12% | 2,600 | 11% |
| Employment Insurance | 200 | 1% | 300 | 1% | 200 | 1% | 200 | 1% | 200 | 1% |
| Other b | 1,500 | 7% | 1,400 | 6% | 1,400 | 6% | 1,400 | 6% | 1,400 | 6% |
| Total c (includes double-counting) |
21,100 | 100% | 21,800 | 100% | 21,800 | 100% | 22,500 | 100% | 22,800 | 100% |
- Table note a. Cases include Transitional Pharmacare, but for the "Employment" category only.
- Table note b. "Other" includes clients receiving workers' compensation, training income, income tax refund, or income from rental or from room and board and roomers.
- Table note c. Total cases in these categories may include double-counting, since cases that have more than one source of income are counted for each source reported.
- Note: Totals may not add due to rounding.
| 2009 | 2010 | 2011 | 2012 | 2013 | |
|---|---|---|---|---|---|
| Reporting income | 13,600 | 14,400 | 14,600 | 14,900 | 15,000 |
| Not reporting income | 13,300 | 13,600 | 13,600 | 13,800 | 13,700 |
| Total | 26,800 | 28,000 | 28,200 | 28,700 | 28,700 |
- Table note a. Cases do not include Transitional Pharmacare. Cases do not include double counting. Cases do not differentiate between chargeable and non-chargeable income.
- Note: Totals may not add due to rounding.
Chapter 6 - New Brunswick - Social Assistance
In New Brunswick, the provincial social assistance program is known as Social Assistance (SA). The Family Income Security Act and the Family Income Security Regulations govern New Brunswick's Social Assistance program.
Social Assistance provides basic benefits to both adults and children.
Service delivery
The Department of Social Development is responsible for the delivery of the Social Assistance program to adults and children within the province.
Eligibility
General
In order to be eligible for the Social Assistance program, applicants must meet the general eligibility requirements outlined in the "Social Assistance Overview" in this report.
Liquid assets
At the time of application, applicants' liquid assets may not exceed the following allowable limits:
| Clients without disabilities | Clients with disabilities | |
|---|---|---|
| Single | $1,000 | $3,000 |
| Single-parent family | $2,000 | $3,000 for each person with a certified disability plus $1,000 for each non-disabled person up to a maximum of $4,000 per household. |
| Childless couple | $2,000 | $3,000 for each person with a certified disability plus $1,000 for each non-disabled person up to a maximum of $4,000 per household. |
| Two-parent family | $2,000 | $3,000 for each person with a certified disability plus $1,000 for each non-disabled person up to a maximum of $4,000 per household. |
Earnings exemptions
Different levels of earning exemptions are in effect for each of the two programs in place: Transitional Assistance Program and Extended Benefits Program. For more information on these social assistance programs, please refer to the paragraphs below. Once an application for assistance has been approved, program clients are eligible for the following monthly exemptions on earned income:
| Transitional Assistance Program |
Extended Benefits Program |
|
|---|---|---|
| Single | $150 | $250 |
| Family | $200 | $300 |
There is also the Extended Wage Exemption (EWE) available. The EWE is a benefit structure separate from the usual earnings exemption (provided above). The amount of the EWE is changed according to three different time frames within the two-year duration of the benefit. The first two time frames are six months in duration each, and allow clients the option of having a percentage of their salary exempted; which results in a higher exemption than the usual earnings exemption. In months 13 through 24, the earnings exemption amount will revert back to the appropriate maximum flat rate amount; that is, the usual earnings exemption.
Benefits
Basic assistance, also known as the basic unit rate, covers the cost of food, clothing, shelter, routine transportation, fuel and utilities, as well as personal and household items. Maximum basic assistance rates are based on the three rate programs involved (see below) and the number of persons in the household.
The Social Assistance program has two rate programs: Transitional Assistance Program (TAP) and Extended Benefits Program (EBP). On January 1, 2010, the Interim Assistance Program (INT) was eliminated. All clients receiving social assistance under this program will convert to the Transitional Assistance Program.
The Transitional Assistance Program provides financial assistance to individuals and families who have a variety of intermittent foreseeable needs. This is a category of financial assistance for individuals and families who have the potential to achieve self-sufficiency once barriers to their employment are addressed.
The Extended Benefits Program provides financial assistance to individuals and families who are certified by the Medical Advisory Board as blind, deaf, or disabled. This is a category of financial assistance for those clients who, because of their disability, have long-term predictable needs.
Effective September 2005, New Brunswick provides extended drug coverage for twelve months to clients who leave social assistance for employment.
More information
For more information, please consult the New Brunswick Department of Social Development website.
Statistics: A - Transitional Assistance Program
Recipients and cases
Text description of Table 6a-1
| Year | 2002 | 2003 | 2004 | 2005 | 2006 | 2007 | 2008 | 2009 | 2010 | 2011 | 2012 | 2013 |
|---|---|---|---|---|---|---|---|---|---|---|---|---|
| Recipients | 41,700 | 40,600 | 38,500 | 36,600 | 36,100 | 33,800 | 31,500 | 31,000 | 33,600 | 33,700 | 33,800 | 32,600 |
| Cases | 20,100 | 19,700 | 18,900 | 18,300 | 18,200 | 17,200 | 16,300 | 16,100 | 18,400 | 18,800 | 18,900 | 18,300 |
- Table note a. "Data are as of March 31, unless otherwise specified. In those cases, data are as of the end of month."
Recipients by family type
| Family type | 2009 | 2010 | 2011 | 2012 | 2013 | |||||
|---|---|---|---|---|---|---|---|---|---|---|
| # | % | # | % | # | % | # | % | # | % | |
| Adults - Single | 7,700 | 25% | 9,700 | 29% | 10,300 | 31% | 10,500 | 31% | 10,300 | 32% |
| Adults - Couple, no dependants | 2,800 | 9% | 2,900 | 9% | 2,700 | 8% | 2,600 | 8% | 2,600 | 8% |
| Adults - Single parent | 5,700 | 18% | 5,900 | 18% | 5,900 | 18% | 5,900 | 17% | 5,500 | 17% |
| Adults - Couple with dependants | 3,000 | 10% | 3,000 | 9% | 2,900 | 9% | 2,800 | 8% | 2,700 | 8% |
| Total adults | 19,200 | 62% | 21,500 | 64% | 21,700 | 64% | 21,800 | 64% | 21,100 | 65% |
| Children - Single parent | 8,800 | 28% | 9,200 | 27% | 9,200 | 27% | 9,200 | 27% | 8,800 | 27% |
| Children - Couple with dependants | 3,000 | 10% | 2,900 | 9% | 2,800 | 8% | 2,800 | 8% | 2,700 | 8% |
| Total children | 11,900 | 38% | 12,100 | 36% | 12,000 | 36% | 12,000 | 36% | 11,500 | 35% |
| Total recipients | 31,000 | 100% | 33,600 | 100% | 33,700 | 100% | 33,800 | 100% | 32,600 | 100% |
- Note: Totals may not add due to rounding.
Cases by age of head
| Age of head | 2009 | 2010 | 2011 | 2012 | 2013 |
|---|---|---|---|---|---|
| <20 | 500 | 600 | 500 | 500 | 400 |
| 20-24 | 1,400 | 1,900 | 2,000 | 2,000 | 2,000 |
| 25-29 | 1,700 | 2,000 | 2,100 | 2,100 | 2,000 |
| 30-34 | 1,700 | 2,000 | 2,000 | 2,100 | 2,000 |
| 35-39 | 1,700 | 1,900 | 2,000 | 2,000 | 1,900 |
| 40-44 | 1,700 | 1,900 | 1,900 | 1,900 | 1,900 |
| 45-49 | 1,900 | 2,300 | 2,200 | 2,200 | 2,100 |
| 50-54 | 1,900 | 2,200 | 2,300 | 2,300 | 2,300 |
| 55-59 | 2,100 | 2,100 | 2,100 | 2,200 | 2,200 |
| 60-64 | 1,400 | 1,500 | 1,600 | 1,700 | 1,700 |
| 65+ | - | - | - | 100 | - |
| Total | 16,100 | 18,400 | 18,800 | 18,900 | 18,300 |
- Note: Totals may not add due to rounding.
Cases reporting income by source of income
| Source of income | 2009 | 2010 | 2011 | 2012 | 2013 | |||||
|---|---|---|---|---|---|---|---|---|---|---|
| # | % | # | % | # | % | # | % | # | % | |
| Employment | 1,800 | 6% | 2,000 | 7% | 1,800 | 7% | 1,800 | 6% | 1,800 | 6% |
| Government transfers | 22,500 | 74% | 26,300 | 90% | 24,900 | 91% | 28,100 | 92% | 27,300 | 92% |
| Support payments | 5,600 | 18% | - | 0% | - | 0% | - | 0% | - | 0% |
| Employment Insurance | 200 | 1% | 200 | 1% | 100 | 0% | 100 | 0% | 100 | 0% |
| Other a | 600 | 2% | 700 | 2% | 700 | 3% | 700 | 2% | 700 | 2% |
| Total b (includes double-counting) |
30,600 | 100% | 29,100 | 100% | 27,400 | 100% | 30,700 | 100% | 29,800 | 100% |
- Table note a. "Other" includes training allowances and other income.
- Table note b. Total cases in these categories may include double-counting, since cases that have more than one source of income are counted for each source reported.
- Note: Totals may not add due to rounding.
Statistics: B - Extended Benefits Program
Recipients and cases
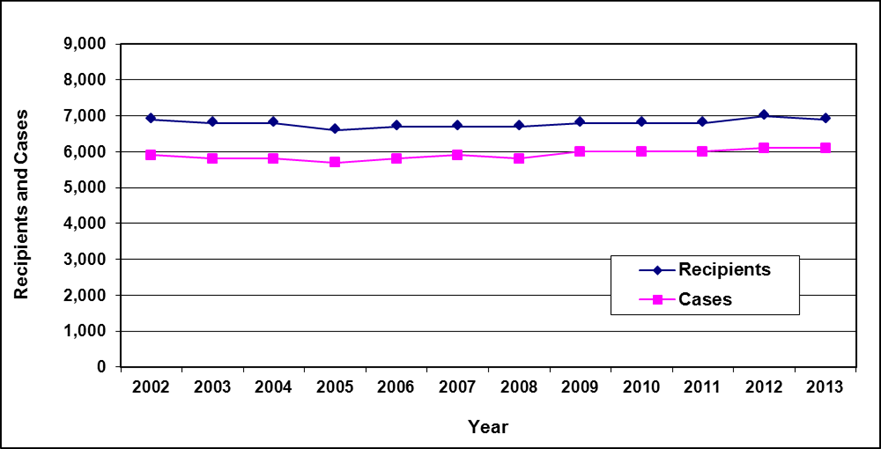
Text description of Table 6b-1
| Year | 2002 | 2003 | 2004 | 2005 | 2006 | 2007 | 2008 | 2009 | 2010 | 2011 | 2012 | 2013 |
|---|---|---|---|---|---|---|---|---|---|---|---|---|
| Recipients | 6,900 | 6,800 | 6,800 | 6,600 | 6,700 | 6,700 | 6,700 | 6,800 | 6,800 | 6,800 | 7,000 | 6,900 |
| Cases | 5,900 | 5,800 | 5,800 | 5,700 | 5,800 | 5,900 | 5,800 | 6,000 | 6,000 | 6,000 | 6,100 | 6,100 |
- Table note a. "Data are as of March 31, unless otherwise specified. In those cases, data are as of the end of month."
Recipients by family type
| Family type | 2009 | 2010 | 2011 | 2012 | 2013 | |||||
|---|---|---|---|---|---|---|---|---|---|---|
| # | % | # | % | # | % | # | % | # | % | |
| Adults - Single | 5,300 | 78% | 5,300 | 78% | 5,400 | 79% | 5,500 | 79% | 5,500 | 80% |
| Adults - Couple, no dependants | 800 | 12% | 800 | 12% | 700 | 10% | 700 | 10% | 700 | 10% |
| Adults - Single parent | 200 | 3% | 100 | 1% | 200 | 3% | 200 | 3% | 200 | 3% |
| Adults - Couple with dependants | 200 | 3% | 200 | 3% | 200 | 3% | 200 | 3% | 200 | 3% |
| Total adults | 6,500 | 96% | 6,500 | 96% | 6,500 | 96% | 6,600 | 94% | 6,600 | 96% |
| Children - Single parent | 100 | 1% | 100 | 1% | 200 | 3% | 200 | 3% | 200 | 3% |
| Children - Couple with dependants | 200 | 3% | 200 | 3% | 200 | 3% | 200 | 3% | 200 | 3% |
| Total children | 300 | 4% | 300 | 4% | 300 | 4% | 400 | 6% | 400 | 6% |
| Total recipients | 6,800 | 100% | 6,800 | 100% | 6,800 | 100% | 7,000 | 100% | 6,900 | 100% |
- Note: Totals may not add due to rounding.
Cases by age of head
| Age of head | 2009 | 2010 | 2011 | 2012 | 2013 |
|---|---|---|---|---|---|
| <20 | 100 | 100 | 100 | 100 | 100 |
| 20-24 | 400 | 400 | 400 | 500 | 500 |
| 25-29 | 500 | 500 | 500 | 500 | 500 |
| 30-34 | 500 | 500 | 500 | 500 | 500 |
| 35-39 | 600 | 600 | 600 | 600 | 600 |
| 40-44 | 700 | 600 | 600 | 600 | 600 |
| 45-49 | 800 | 900 | 900 | 800 | 800 |
| 50-54 | 900 | 900 | 900 | 900 | 900 |
| 55-59 | 700 | 700 | 700 | 800 | 800 |
| 60-64 | 800 | 800 | 700 | 700 | 700 |
| 65+ | - | - | - | - | - |
| Total | 6,000 | 6,000 | 6,000 | 6,100 | 6,100 |
- Note: Totals may not add due to rounding.
Cases reporting income by source of income
| Source of income | 2009 | 2010 | 2011 | 2012 | 2013 | |||||
|---|---|---|---|---|---|---|---|---|---|---|
| # | % | # | % | # | % | # | % | # | % | |
| Employment | 400 | 4% | 500 | 5% | 300 | 3% | 300 | 3% | 300 | 3% |
| Government transfers | 6,400 | 67% | 6,600 | 67% | 6,400 | 67% | 6,800 | 67% | 6,800 | 67% |
| Other a | 2,800 | 29% | 2,700 | 27% | 2,900 | 30% | 3,000 | 30% | 3,000 | 30% |
| Total b(includes double-counting) | 9,500 | 100% | 9,900 | 100% | 9,600 | 100% | 10,100 | 100% | 10,100 | 100% |
- Table note a. "Other" includes training allowances and other income.
- Table note b. Total cases in these categories may include double-counting, since cases that have more than one source of income are counted for each source reported.
- Note: Totals may not add due to rounding.
Chapter 7 - Quebec - Last-resort financial assistance
In Quebec, the provincial social assistance programs are known as Last-Resort Financial Assistance which includes the Social Assistance Program and the Social Solidarity Program. The Individual and Family Assistance ActFootnote 13 and the Individual and Family Assistance Regulation govern Quebec's Last-Resort Financial Assistance programs.
The Last-Resort Financial Assistance provides basic benefits to adults only. Between September 1997 and January 2005, children's basic benefits were provided through the Quebec Family Allowance. Since January 2005, children's basic benefits have been provided through the Child Assistance Measure.
Service delivery
The Department of Employment and Social Solidarity is responsible for the Last-Resort Financial Assistance program to adults within the province.
Eligibility
General
In order to be eligible for the Last-Resort Financial Assistance programs, applicants must meet the general eligibility requirements outlined in the "Social Assistance Overview" in this report.
Liquid assets
At the time of application, applicants' liquid assets may not exceed the following allowable limits:
| Number of adults | Number of children | Liquid assets |
|---|---|---|
| 1 | 0 | $887 |
| 1 | $1,268 | |
| 2 | $1,502 | |
| 2 | 0 | $1,319 |
| 1 | $1,573 | |
| 2 | $1,807 |
- Table note a. Individual and Family Assistance Regulation, Article 52.
- Note: Exemptions increased in 2009 and again 2010 to the 2013 levels above.
- 2009 Increases - For one adult ($862 to $883), for one adult and one child ($1,232 to $1,262), for one adult and 2 children ($1,460 to $1,495) for two adults ($1,282 to $1,313), for two adults and one child ($1,529 to $1,566), and for two adults and two children ($1,757 to $1,799).
| Number of adults | Number of children | Liquid assets |
|---|---|---|
| 1 | 0 | $2,500 |
| 1 | $2,906 | |
| 2 | $3,155 | |
| 2 | 0 | $5,000 |
| 1 | $5,271 | |
| 2 | $5,520 |
- Table note a. Individual and Family Assistance Regulation, Article 155.
- Note: There have been yearly increases to exemption levels for both one and two parent families with children since 2009:
- For one adult and one child (2009: $2,879, 2010: $2,881, 2011: $2,886, 2012: $2,896).
- For one adult and two children (2009: $3,112, 2010: $3,115, 2011: $3,123, 2012: $3,140).
- For two adults and one child (2009: $5,253, 2010: $5,254, 2011: $5,257, 2012: $5,264).
- For two adults and two children (2009: $5,486, 2010: $5,488, 2011: $5,494, 2012: $5,507).
Once an application for assistance has been approved, clients' liquid assets may not exceed the following allowable limits:
| Social Assistance Program a | Social Solidarity Program b | |
|---|---|---|
| Independent adult, family of an ineligible student's spouse, or an adult who is a minor sheltered with her dependent child. |
$1,500 | $2,500 |
| Other families | $2,500 | $5,000 |
| Additional amounts for minor dependent children: | ||
| 1 adult and 1 child | $406 | $406 |
| 1 adult and 2 children | $655 | $655 |
| 2 adults and 1 child | $271 | $271 |
| 2 adults and 2 children | $520 | $520 |
- Table note a. Individual and Family Assistance Regulation, Articles 131, 132.
- Table note b. Individual and Family Assistance Regulation, Articles 163
- Note: There have been yearly increases to the additional amounts for minor dependant children since 2009 for both the Social Assistance Program and the Social Solidarity Program.
- For one adult and one child (2009: $379, 2010: $381, 2011: $386, 2012: $396)
- For one adult and two children (2009: $612, 2010: $615, 2011: $623, 2012: $640)
- For two adults and one child (2009: $253, 2010: $254, 2011: $257, 2012: $264)
- For two adults and two children (2009: $486, 2010: $488, 2011: $494, 2012: $507)
Earnings exemptions
Once an application for assistance has been approved, the beneficiaries of the Last-Resort Financial Assistance are eligible for the following monthly exemptions on earned income:
| Clients with no limitations to employment a |
Clients with temporary limitations to employment a |
Clients with severe limitations to employment b |
|
|---|---|---|---|
| Single | $200 | $200 | $100 |
| Single-parent family | $200 | $200 | $100 |
| Two-parent family | $300 | $300 | $100 |
- Table note a. Exemption under the Social Assistance Program.
- Table note b. Exemption under the Social Solidarity Program.
Benefits
Financial assistance consists of a basic benefit, paid monthly, which may be supplemented by an allowance for individuals who are facing temporary or severe employment limitations. The basic benefit covers the cost of food and clothing, shelter, as well as personal and household items for adults only. Maximum basic benefit rates are based on family composition.
In order to receive a benefit for temporary limitations to employment, an applicant must be 58 years of age or older, unable to participate in the labour market for health reasons for a period of no more than 12 months, caring for a child who does not yet attend school (5 years of age or under) or is disabled, or pregnant. In order to receive the solidarity allowance (allowance awarded to people with severe employment limitations in the Social Solidarity Program), the person's physical or mental state must be significantly altered or deficient for what will most likely be a permanent or indeterminate period of time.
Quebec family allowance
The Quebec Family Allowance was a non-taxable amount paid monthly to help low-income families with the cost of raising children under 18 years of age. The creation of the Quebec Family Allowance in September 1997 effectively had removed children's benefits from the social assistance system.
The Régie des rentes du Québec was responsible for administering the Quebec Family Allowance.
In August 2004, families were entitled to receive a Family Allowance in the amount of $625 per year per child. Single-parent families could also receive an additional family supplement of $1,300 per year. An additional amount of $1,431 was provided for each child with disabilities.
Single-parent families with one child and whose income was less than $20,603 per year were paid maximum Family Allowance benefits. Single-parent families with one child and whose annual income fell between $20,603 and $51,600 per year were eligible for partial Family Allowance benefits.
Maximum Family Allowance benefits were paid to two-parent families with one child and whose income was less than $24,005 per year. Two-parent families with one child and whose annual income fell between $24,005 and $51,600 per year were eligible for partial Family Allowance benefits.
| Year | Families | Children |
|---|---|---|
| 2003 | 516,230 | 918,470 |
| 2004 b | 503,520 | 893,280 |
| 2005 | 873,108 | 1,494,566 |
| 2006 | 874,996 | 1,494,661 |
| 2007 | 886,336 | 1,486,998 |
| 2008 | 887,085 | 1,487,599 |
| 2009 | 884,169 | 1,475,338 |
| 2010 | 882,423 | 1,473,675 |
| 2011 c | 882,540 | 1,479,843 |
| 2012 c | 879,840 | 1,477,691 |
- Table note a. The Child Assistance Measure replaced the Quebec Family Allowance on January 1, 2005.
- Table note b. These figures are from April 1, 2004 to December 31, 2004.
- Table note c. Projected data.
Child assistance measure
In 2004-2005 Budget Speech, the Quebec government announced a new Child Assistance Measure to increase support for families. The Child Assistance Measure came into force on January 1, 2005, to cover the basic needs of dependent children under 18 years old. Child Assistance replaces and improves upon three measures: the Family Allowance, the non-refundable tax credit for dependent children and tax reduction for families. This measure provides more generous assistance than the Family Allowance, particularly to low-income families.
The amount of the Child Assistance Measure varies. Its amount is based on the following factors: net family income, the number of dependent children under the age of 18, and the type of family (single-parent or two-parent).
The maximum amounts paid for 2013, are as follows: for a family with one child: $2,319 per year; for a family with two children: $3,478; for a family with three children: $4,637; and for a family with four children: $6,376.
For each additional child, an amount of $1,739 is added to the maximum of $6,376. Single-parent families are entitled to a supplement of $813, which is added to the basic Child Assistance Measure amount.
More information
For more information, please consult the Quebec Department of Employment and Social Solidarity website.
StatisticsFootnote 14
Recipients and cases
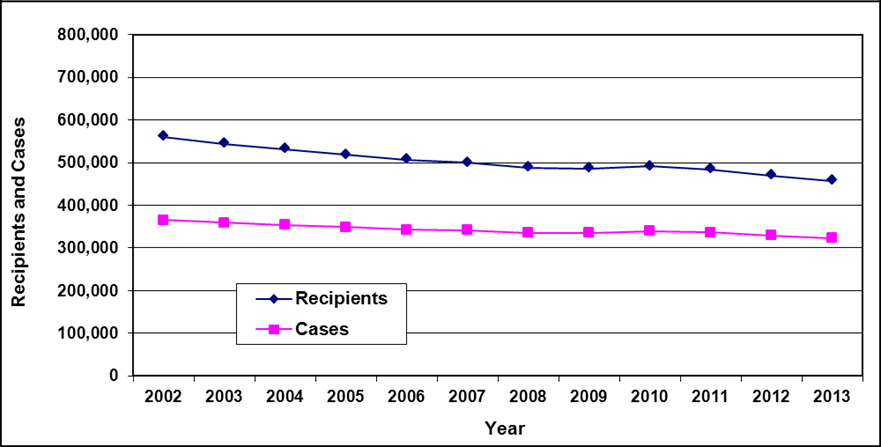
Text description of Table 7-1
| Year | 2002 | 2003 | 2004 | 2005 | 2006 | 2007 | 2008 | 2009 | 2010 | 2011 | 2012 | 2013 |
|---|---|---|---|---|---|---|---|---|---|---|---|---|
| Recipients | 560,800 | 544,200 | 532,200 | 518,200 | 506,500 | 499,600 | 488,100 | 486,300 | 491,600 | 483,800 | 469,700 | 457,800 |
| Cases | 365,600 | 359,300 | 354,600 | 348,700 | 343,300 | 341,500 | 335,100 | 335,300 | 339,500 | 336,400 | 329,600 | 323,100 |
- Table note a. "For the number of cases and recipients by type of program, see Table 7-9."
Cases by type of benefit
| Type of benefits | 2009 | 2010 | 2011 | 2012 | 2013 | |||||
|---|---|---|---|---|---|---|---|---|---|---|
| # | % | # | % | # | % | # | % | # | % | |
| Social Assistance - Basic benefit (housed beneficiaries) a | 124,400 | 37% | 126,300 | 37% | 122,300 | 36% | 116,400 | 35% | 111,200 | 34% |
| Social Assistance - Allowance - temporary constraints b | 77,600 | 23% | 80,100 | 24% | 80,900 | 24% | 80,600 | 24% | 79,700 | 25% |
| Social Assistance - Combined allowance c | 3,500 | 1% | 3,500 | 1% | 3,400 | 1% | 3,300 | 1% | 3,600 | 1% |
| Total Social Assistance | 205,500 | 61% | 209,900 | 62% | 206,600 | 61% | 200,400 | 61% | 194,500 | 60% |
| Social Solidarity - Allowance d | 126,700 | 38% | 126,600 | 37% | 126,900 | 38% | 126,400 | 38% | 125,900 | 39% |
| Social Solidarity - Basic benefit (housed beneficiaries) a | 3,100 | 1% | 3,000 | 1% | 2,900 | 1% | 2,800 | 1% | 2,700 | 1% |
| Total Social Solidarity | 129,800 | 39% | 129,600 | 38% | 129,800 | 39% | 129,200 | 39% | 128,600 | 40% |
| Total | 335,300 | 100% | 339,500 | 100% | 336,400 | 100% | 329,600 | 100% | 323,100 | 100% |
- Table note a. "Basic benefit (housed beneficiaries)": Basic amount applicable to a housed adult admitted to a home-care centre, reception centre, general hospital, rehabilitation centre, as well as to a former inmate housed in a recognized institution for the purpose of his/her social rehabilitation.
- Table note b. "Allowance - temporary constraints": Where a single adult/adult member of the family is subject to temporary employment constraints.
- Table note c. "Combined allowance": Where the two adults in the household are subject to temporary employment constraint.
- Table note d. "Allowance": Amount applicable to single adult or couple recipients of the Social Solidarity Program.
- Note: Totals may not add due to rounding.
Recipients by family type
| Family type | 2009 | 2010 | 2011 | 2012 | 2013 | |||||
|---|---|---|---|---|---|---|---|---|---|---|
| # | % | # | % | # | % | # | % | # | % | |
| Adults - Single | 254,400 | 52% | 258,500 | 53% | 257,700 | 53% | 254,800 | 54% | 251,300 | 55% |
| Adults - Couple, no dependants | 31,200 | 6% | 30,600 | 6% | 29,000 | 6% | 27,100 | 6% | 25,800 | 6% |
| Adults - Single parent | 43,500 | 9% | 43,400 | 9% | 42,700 | 9% | 41,000 | 9% | 39,700 | 9% |
| Adults - Couple with dependants | 41,900 | 9% | 42,900 | 9% | 40,900 | 8% | 38,200 | 8% | 36,300 | 8% |
| Adults - Spouse of students a | 800 | 0.16% | 900 | 0.18% | 1,100 | 0.23% | 1,100 | 0.23% | 1,100 | 0.24% |
| Total adults | 371,800 | 76% | 376,300 | 77% | 371,400 | 77% | 362,700 | 77% | 354,200 | 77% |
| Children - Single parent | 70,000 | 14% | 69,700 | 14% | 68,600 | 14% | 66,300 | 14% | 64,000 | 14% |
| Children - Couple with dependants | 44,400 | 9% | 45,700 | 9% | 43,800 | 9% | 41,200 | 9% | 39,600 | 9% |
| Total children | 114,400 | 24% | 115,300 | 23% | 112,400 | 23% | 107,500 | 23% | 103,600 | 23% |
| Total | 486,300 | 100% | 491,600 | 100% | 483,800 | 100% | 469,700 | 100% | 457,800 | 100% |
- Table note a. "Spouse of students": An adult whose spouse is studying full-time at the post-secondary level and is receiving benefits from the financial assistance program of the Ministry of Education. This category includes adults only, since the needs of the children of either spouse are met by the student spouse.
- Note: Totals may not add due to rounding.
Cases by age of head
| Age of head | 2009 | 2010 | 2011 | 2012 | 2013 |
|---|---|---|---|---|---|
| <21 | 11,600 | 12,200 | 12,200 | 11,700 | 11,100 |
| 21-24 | 19,600 | 19,600 | 19,600 | 19,600 | 19,000 |
| 25-29 | 30,600 | 30,300 | 29,000 | 27,500 | 26,300 |
| 30-34 | 30,500 | 32,000 | 31,800 | 30,800 | 30,000 |
| 35-39 | 31,300 | 31,700 | 30,700 | 30,200 | 29,900 |
| 40-44 | 37,900 | 36,700 | 35,000 | 33,100 | 31,500 |
| 45-49 | 44,700 | 45,000 | 44,100 | 41,900 | 39,500 |
| 50-54 | 44,600 | 45,700 | 46,300 | 46,200 | 46,100 |
| 55-59 | 43,200 | 44,300 | 45,100 | 45,700 | 46,500 |
| 60-64 | 38,200 | 39,000 | 39,700 | 39,700 | 40,000 |
| 65+ | 3,000 | 3,100 | 3,200 | 3,200 | 3,200 |
| Total | 335,300 | 339,500 | 336,400 | 329,600 | 323,100 |
- Note: Totals may not add due to rounding.
Cases by education of head
| Education of head a | 2009 | 2010 | 2011 | 2012 | 2013 | |||||
|---|---|---|---|---|---|---|---|---|---|---|
| # | % | # | % | # | % | # | % | # | % | |
| Primary | 27,500 | 8% | 27,200 | 8% | 26,300 | 8% | 25,200 | 8% | 24,400 | 8% |
| Secondary | 169,200 | 50% | 176,900 | 52% | 179,300 | 53% | 179,300 | 54% | 179,600 | 56% |
| College | 17,300 | 5% | 18,400 | 5% | 18,900 | 6% | 19,000 | 6% | 19,300 | 6% |
| University | 15,300 | 5% | 17,300 | 5% | 17,500 | 5% | 17,200 | 5% | 17,300 | 5% |
| Unknown | 106,000 | 32% | 99,700 | 29% | 94,500 | 28% | 88,900 | 27% | 82,500 | 26% |
| Total | 335,300 | 100% | 339,500 | 100% | 336,400 | 100% | 329,600 | 100% | 323,100 | 100% |
- Table note a. Education is defined as the level of education attained as of the date of application.
- Note: Totals may not add due to rounding.
Cases by family type and consecutive duration of assistance

Text description of Table 7-6a
| Duration of assistance (months) | Family type | |||||
|---|---|---|---|---|---|---|
| Single | Couple no dependants | Single parent | Couple with dependants | Spouse of student a | Total | |
| 0-3 | 16,900 | 700 | 3,000 | 1,600 | 100 | 22,300 |
| 4-6 | 12,800 | 600 | 2,500 | 1,400 | 100 | 17,400 |
| 7-12 | 17,100 | 800 | 4,000 | 2,100 | 100 | 24,300 |
| 13-24 | 24,200 | 1,300 | 6,000 | 3,100 | 200 | 34,800 |
| 25-36 | 20,100 | 1,100 | 4,500 | 2,400 | 100 | 28,300 |
| 37-60 | 28,300 | 1,700 | 6,600 | 3,000 | 100 | 39,700 |
| 61-108 | 37,600 | 2,400 | 7,300 | 3,200 | 100 | 50,600 |
| 109+ | 97,400 | 6,900 | 9,500 | 4,100 | - | 117,900 |
| Total | 254,400 | 15,600 | 43,500 | 21,000 | 800 | 335,300 |
- Table note a. "Spouse of students: An adult whose spouse is studying full-time at the post-secondary level and is receiving benefits from the financial assistance program of the Ministry of Education. This category includes adults only, since the needs of the children of either spouse are met by the student spouse."
- Note: Totals may not add due to rounding.
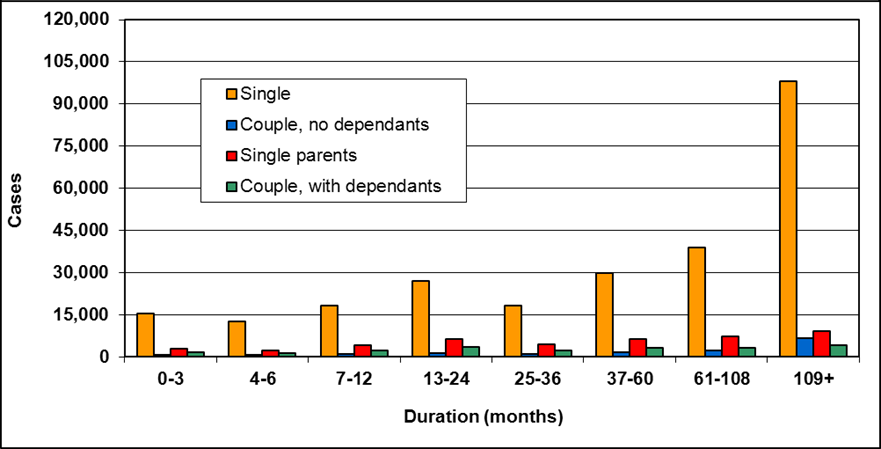
Text description of Table 7-6b
| Duration of assistance (months) | Family type | |||||
|---|---|---|---|---|---|---|
| Single | Couple no dependants | Single parent | Couple with dependants | Spouse of student a | Total | |
| 0-3 | 15,600 | 700 | 2,800 | 1,600 | 100 | 20,800 |
| 4-6 | 12,700 | 600 | 2,400 | 1,500 | 100 | 17,300 |
| 7-12 | 18,200 | 900 | 4,200 | 2,300 | 100 | 25,700 |
| 13-24 | 26,900 | 1,300 | 6,300 | 3,500 | 200 | 38,200 |
| 25-36 | 18,300 | 1,000 | 4,500 | 2,200 | 100 | 26,100 |
| 37-60 | 30,000 | 1,700 | 6,400 | 3,200 | 100 | 41,400 |
| 61-108 | 38,800 | 2,400 | 7,400 | 3,300 | 100 | 51,800 |
| 109+ | 98,000 | 6,700 | 9,300 | 4,100 | - | 118,100 |
| Total | 258,500 | 15,300 | 43,400 | 21,500 | 900 | 339,500 |
- Table note a. "Spouse of students: An adult whose spouse is studying full-time at the post-secondary level and is receiving benefits from the financial assistance program of the Ministry of Education. This category includes adults only, since the needs of the children of either spouse are met by the student spouse."
- Note: Totals may not add due to rounding.
Text description of Table 7-6c
| Duration of assistance (months) | Family type | |||||
|---|---|---|---|---|---|---|
| Single | Couple no dependants | Single parent | Couple with dependants | Spouse of student a | Total | |
| 0-3 | 15,000 | 600 | 2,600 | 1,300 | 100 | 19,600 |
| 4-6 | 12,300 | 500 | 2,400 | 1,300 | 100 | 16,600 |
| 7-12 | 16,800 | 800 | 4,000 | 1,900 | 200 | 23,600 |
| 13-24 | 26,600 | 1,300 | 6,300 | 3,400 | 300 | 37,900 |
| 25-36 | 19,600 | 900 | 4,700 | 2,400 | 100 | 27,800 |
| 37-60 | 28,800 | 1,600 | 6,200 | 2,900 | 100 | 39,700 |
| 61-108 | 39,700 | 2,400 | 7,400 | 3,300 | 100 | 52,700 |
| 109+ | 98,900 | 6,400 | 9,100 | 4,000 | - | 118,500 |
| Total | 257,700 | 14,500 | 42,700 | 20,400 | 1,100 | 336,400 |
- Table note a. "Spouse of students: An adult whose spouse is studying full-time at the post-secondary level and is receiving benefits from the financial assistance program of the Ministry of Education. This category includes adults only, since the needs of the children of either spouse are met by the student spouse."
- Note: Totals may not add due to rounding.

Text descriptions of table 7-6d
| Duration of assistance (months) | Family type | |||||
|---|---|---|---|---|---|---|
| Single | Couple no dependants | Single parent | Couple with dependants | Spouse of student a | Total | |
| 0-3 | 14,400 | 600 | 2,500 | 1,300 | 100 | 18,900 |
| 4-6 | 11,500 | 500 | 2,300 | 1,200 | 100 | 15,500 |
| 7-12 | 16,100 | 700 | 3,700 | 1,700 | 200 | 22,300 |
| 13-24 | 25,200 | 1,100 | 5,800 | 2,800 | 300 | 35,300 |
| 25-36 | 19,500 | 900 | 4,500 | 2,200 | 200 | 27,400 |
| 37-60 | 28,100 | 1,400 | 6,200 | 2,800 | 100 | 38,600 |
| 61-108 | 40,300 | 2,300 | 7,100 | 3,200 | 100 | 53,000 |
| 109+ | 99,800 | 6,000 | 8,900 | 3,900 | - | 118,600 |
| Total | 254,800 | 13,600 | 41,000 | 19,100 | 1,100 | 329,600 |
- Table note a. "Spouse of students: An adult whose spouse is studying full-time at the post-secondary level and is receiving benefits from the financial assistance program of the Ministry of Education. This category includes adults only, since the needs of the children of either spouse are met by the student spouse."
- Note: Totals may not add due to rounding.
Text description of Table 7-6e
| Duration of assistance (months) | Family type | |||||
|---|---|---|---|---|---|---|
| Single | Couple no dependants | Single parent | Couple with dependants | Spouse of student a | Total | |
| 0-3 | 14,000 | 600 | 2,600 | 1,200 | 100 | 18,500 |
| 4-6 | 11,500 | 400 | 2,200 | 1,200 | 100 | 15,400 |
| 7-12 | 15,700 | 700 | 3,600 | 1,700 | 200 | 21,800 |
| 13-24 | 23,500 | 1,100 | 5,500 | 2,600 | 300 | 32,900 |
| 25-36 | 18,400 | 800 | 4,100 | 1,900 | 200 | 25,400 |
| 37-60 | 28,300 | 1,400 | 6,200 | 2,800 | 200 | 38,800 |
| 61-108 | 39,600 | 2,200 | 6,900 | 3,000 | 100 | 51,800 |
| 109+ | 100,100 | 5,800 | 8,700 | 3,800 | - | 118,500 |
| Total | 251,300 | 12,900 | 39,700 | 18,100 | 1,100 | 323,100 |
- Table note a. "Spouse of students: An adult whose spouse is studying full-time at the post-secondary level and is receiving benefits from the financial assistance program of the Ministry of Education. This category includes adults only, since the needs of the children of either spouse are met by the student spouse."
- Note: Totals may not add due to rounding.
Type of declared income by source of income
| Source of income | 2009 | 2010 | 2011 | 2012 | 2013 | |||||
|---|---|---|---|---|---|---|---|---|---|---|
| # | % | # | % | # | % | # | % | # | % | |
| Employment | 24,900 | 26% | 23,600 | 25% | 22,700 | 24% | 21,200 | 23% | 20,300 | 22% |
| Employment-Assistance allowance | 7,000 | 7% | 7,600 | 8% | 7,300 | 8% | 6,900 | 7% | 7,000 | 8% |
| Support allowance | 4,700 | 5% | 4,600 | 5% | 3,700 | 4% | 3,800 | 4% | 4,100 | 4% |
| Employment Insurance | 1,300 | 1% | 1,200 | 1% | 1,200 | 1% | 1,000 | 1% | 1,100 | 1% |
| Parental contribution | 800 | 1% | 900 | 1% | 1,000 | 1% | 900 | 1% | 900 | 1% |
| Other a | 64,300 | 67% | 65,400 | 68% | 65,500 | 69% | 65,900 | 71% | 66,000 | 71% |
| Total b (includes double-counting) |
95,800 | 100% | 96,200 | 100% | 94,600 | 100% | 93,200 | 100% | 92,800 | 100% |
- Table note a. "Other" includes salary grants and other sources of income.
- Table note b. Total cases in these categories may include double-counting, since cases that have more than one source of income are counted for each source reported.
- Note: Totals may not add due to rounding.
| Year | 2009 | 2010 | 2011 | 2012 | 2013 |
|---|---|---|---|---|---|
| Reporting income | 95,800 | 96,200 | 94,600 | 93,200 | 92,800 |
| No income | 239,500 | 243,300 | 241,800 | 236,400 | 230,300 |
| Total | 335,300 | 339,500 | 336,400 | 329,600 | 323,100 |
- Note: Totals may not add due to rounding.
Cases and recipients by type of program
| Year | Social Assistance Program |
Social Solidarity Program |
||
|---|---|---|---|---|
| Cases | Recipients | Cases | Recipients | |
| 2009 | 205,500 | 335,800 | 129,800 | 150,500 |
| 2010 | 209,900 | 342,100 | 129,600 | 149,400 |
| 2011 | 206,600 | 334,700 | 129,800 | 149,100 |
| 2012 | 200,400 | 322,400 | 129,200 | 147,300 |
| 2013 | 194,500 | 311,900 | 128,600 | 145,900 |
Chapter 8 - Ontario
A - Ontario Works
Ontario's social assistance system is composed of two programs that provide income and employment assistance to people in financial need:
- Ontario Works provides people with basic financial assistance while helping them prepare for, find and maintain employment. The Ontario Works Act, 1997, and its Regulations govern the Ontario Works program.
- The Ontario Disability Support Program helps people with disabilities with financial as well as employment support. The Ontario Disability Support Program Act, 1997, and its Regulations govern the program.
Service delivery
Under Ontario Works legislation, delivery agents are designated to administer the program for a geographical area. Ontario Works delivery agents include 47 Consolidated Municipal Service Managers (CMSMs)/District Social Services Administration Boards (DSSABs) and 101 First Nations who deliver the program across the province.
Eligibility
General
Eligibility for Ontario Works is based on an applicant's personal and financial circumstances such as place of residence, status in Canada, age, income, assets, and participation in employment assistance activities.
Asset limits
When determining eligibility, applicants' and recipients' assets may not exceed the following allowable limits:
Ontario - Ontario Works - Liquid asset exemptions, March 2013
- Single: $606
- Single-Parent Family: $1,657 plus $500 for each additional dependant
- Childless Couple: $1,043
- Two-Parent Family: $1,735 plus $500 for each additional dependant
- Child in temporary care or a dependant of a dependant: $500
- Source: Ontario Works Policy Directives, 4.2
- Note: Maximum Asset Exemptions increased in 2010 to $585 for singles, $1,619 for single-parent families, $1,010 for childless couples and $1,694 for two-parent families. They were increased again in 2011 to $599 for singles, $1,645 for single-parent families, $1,032 for childless couples and $1,722 for two-parent families. The March 2013 amounts above were introduced in 2012.
Earnings exemptions
Ontario Works clients are eligible for the following monthly exemptions on earned income.
Ontario - Ontario Works - Earning Exemptions, March 2013
50% of earned income:
- Single
- Single-Parent Family
- Childless Couple
- Two-Parent Family
As of May 1, 2009, the employment earnings (including self-employment and farm income) and amounts paid under a training program of persons attending full-time post-secondary school will be exempt as income and assets.
Benefits
Basic financial assistance consists of three components: income assistance for basic needs and shelter, mandatory and discretionary benefits, and emergency assistance.
The basic needs allowance assists with the cost of food, clothing, and personal needs. Maximum basic needs allowance rates are based on family type and the number of adult members in the benefit unit. A supplement for sole-support parents is also provided through the basic needs allowance. The shelter allowance pays an amount equal to a recipient's actual shelter costs, up to a maximum that is based on the number of persons (including children) in the benefit unit.
In addition, each member of a benefit unit may be eligible to receive an additional amount depending on circumstances such as: the Advanced Age Allowance for those over 65, the Pregnancy and Breastfeeding Nutritional Allowance and the Special Diet Allowance, in addition to the standard amount for social assistance.
A number of mandatory benefits are provided within Ontario Works, such as:
- dental and vision care for children
- drug coverage
- guide dog allowance
- benefits to assist individuals in maintaining full-time employment
- benefits to assist individuals with expenses related to starting a new job or employment assistance activity; and
- advance (up front) child care
Recipients, spouses and any dependants may also be eligible to receive a range of discretionary benefits on a case-by-case basis at the discretion of the local Ontario Works Administrator. Discretionary benefits include:
- dental care for adults
- vision care for adults
- prosthetic appliances
- vocational training and re-training
- travel and transportation that is not for health-related purposes; and
- moving expenses
In addition, Ontario Works provides extended drug coverage for up to six months to clients who leave social assistance for employment. Under extenuating circumstances, drug coverage can be extended for an additional six months after the first six month period.
Emergency assistance may be provided if the applicant is not currently in receipt of social assistance, is not serving a period of ineligibility, and if the applicant has not received emergency assistance in the past six months. The provision of financial assistance in an emergency may include an amount for basic needs, shelter and benefits.
More information
For more information, please consult the Ontario Ministry of Community and Social Services website.
Statistics
Recipients and cases
Text description of Table 8a-1
| Year | 2002 | 2003 | 2004 | 2005 | 2006 | 2007 | 2008 | 2009 | 2010 | 2011 | 2012 | 2013 |
|---|---|---|---|---|---|---|---|---|---|---|---|---|
| Recipients | 418,400 | 398,200 | 391,300 | 388,700 | 391,800 | 382,000 | 372,000 | 406,400 | 456,900 | 465,900 | 474,400 | 460,100 |
| Cases | 201,700 | 195,900 | 196,900 | 199,000 | 204,200 | 201,600 | 196,900 | 221,100 | 251,800 | 258,400 | 264,300 | 257,000 |
Recipients by family type
| Family type | 2009 | 2010 | 2011 | 2012 | 2013 | ||||||
|---|---|---|---|---|---|---|---|---|---|---|---|
| # | % | # | % | # | % | # | % | # | % | ||
| Adults | |||||||||||
| Single | Cases | 127,400 | 31% | 148,600 | 33% | 154,200 | 33% | 158,700 | 33% | 155,300 | 34% |
| Couple, no dependants | Cases | 6,500 | 3% | 7,500 | 3% | 7,300 | 3% | 7,400 | 3% | 6,800 | 3% |
| Spouses | 6,500 | 7,500 | 7,300 | 7,400 | 6,800 | ||||||
| Single parent | Cases | 69,500 | 19% | 75,000 | 18% | 76,300 | 18% | 77,400 | 18% | 75,200 | 18% |
| Dependants 18+ a | 6,200 | 7,800 | 8,500 | 9,300 | 9,500 | ||||||
| Couple with dependants | Cases | 17,600 | 9% | 20,700 | 10% | 20,600 | 9% | 20,700 | 9% | 19,700 | 9% |
| Spouses | 17,600 | 20,700 | 20,600 | 20,700 | 19,700 | ||||||
| Dependants 18+ a | 2,200 | 2,600 | 2,900 | 3,000 | 3,000 | ||||||
| Total adults | 253,600 | 62% | 290,300 | 64% | 297,700 | 64% | 304,800 | 64% | 296,000 | 64% | |
| Children | |||||||||||
| Single parent | Children under 18 | 116,200 | 29% | 123,700 | 27% | 125,400 | 27% | 126,300 | 27% | 122,700 | 27% |
| Couple with dependants | Children under 18 | 36,600 | 9% | 42,900 | 9% | 42,800 | 9% | 43,400 | 9% | 41,400 | 9% |
| Total children | 152,800 | 38% | 166,500 | 36% | 168,200 | 36% | 169,600 | 36% | 164,000 | 36% | |
| Total recipients | 406,400 | 100% | 456,900 | 100% | 465,900 | 100% | 474,400 | 100% | 460,100 | 100% | |
- Table note a. "Dependants 18 and over" are categorized as dependent adults, other than spouses.
- Note: Totals may not add due to rounding.
Cases by age of head
| Age of head | 2009 | 2010 | 2011 | 2012 | 2013 |
|---|---|---|---|---|---|
| <20 | 13,100 | 14,800 | 14,400 | 13,800 | 12,600 |
| 20-24 | 35,900 | 42,200 | 43,000 | 43,400 | 40,700 |
| 25-29 | 33,400 | 39,100 | 40,500 | 41,700 | 40,300 |
| 30-34 | 28,200 | 32,200 | 32,800 | 34,000 | 33,600 |
| 35-39 | 26,500 | 29,000 | 28,900 | 29,000 | 28,100 |
| 40-44 | 26,600 | 28,600 | 28,300 | 28,300 | 27,000 |
| 45-49 | 23,500 | 26,600 | 27,200 | 27,600 | 26,400 |
| 50-54 | 16,700 | 19,200 | 20,700 | 22,000 | 22,400 |
| 55-59 | 10,400 | 12,200 | 13,700 | 15,000 | 15,900 |
| 60-64 | 6,100 | 7,000 | 7,900 | 8,500 | 9,100 |
| 65+ | 800 | 900 | 1,000 | 1,000 | 1,000 |
| Total | 221,100 | 251,800 | 258,400 | 264,300 | 257,000 |
- Note: Totals may not add due to rounding.
Cases by education of head
| Education of head | 2009 | 2010 | 2011 | 2012 | 2013 | |||||
|---|---|---|---|---|---|---|---|---|---|---|
| # | % | # | % | # | % | # | % | # | % | |
| Primary | 17,100 | 8% | 18,300 | 7% | 18,500 | 7% | 18,700 | 7% | 17,500 | 7% |
| Secondary | 154,600 | 70% | 176,000 | 70% | 179,300 | 69% | 182,300 | 69% | 176,900 | 69% |
| Post secondary | 47,800 | 22% | 55,800 | 22% | 58,800 | 23% | 61,400 | 23% | 60,800 | 24% |
| Unknown | 1,600 | 1% | 1,700 | 1% | 1,800 | 1% | 1,900 | 1% | 1,900 | 1% |
| Total | 221,100 | 100% | 251,800 | 100% | 258,400 | 100% | 264,300 | 100% | 257,000 | 100% |
- Note: Totals may not add due to rounding.
Cases by family type and duration of assistance
Text description of Table 8a-5a
| Duration of assistance (months) | Family type | ||||
|---|---|---|---|---|---|
| Single | Couple no dependants | Single parent | Couple with dependants | Total | |
| 0-3 | 40,400 | 2,000 | 11,100 | 3,900 | 57,400 |
| 4-6 | 25,700 | 1,300 | 8,300 | 2,800 | 38,100 |
| 7-12 | 23,900 | 1,200 | 12,600 | 3,400 | 41,200 |
| 13-24 | 19,000 | 1,000 | 13,700 | 3,400 | 37,100 |
| 25-36 | 7,500 | 400 | 7,500 | 1,500 | 17,000 |
| 37-60 | 6,200 | 400 | 8,100 | 1,500 | 16,200 |
| 61-108 | 3,200 | 200 | 5,400 | 900 | 9,600 |
| 109+ | 1,500 | 100 | 2,800 | 300 | 4,600 |
| Total | 127,400 | 6,500 | 69,500 | 17,600 | 221,100 |
- Table note a. "Data for number of cases by reason for assistance not available"
- Note: Totals may not add due to rounding.
Text description of Table 8a-5b
| Duration of assistance (months) | Family type | ||||
|---|---|---|---|---|---|
| Single | Couple no dependants | Single parent | Couple with dependants | Total | |
| 0-3 | 39,400 | 1,900 | 10,400 | 3,400 | 55,100 |
| 4-6 | 27,300 | 1,300 | 8,400 | 2,900 | 39,900 |
| 7-12 | 31,000 | 1,600 | 13,600 | 4,300 | 50,400 |
| 13-24 | 29,400 | 1,600 | 16,800 | 5,200 | 52,900 |
| 25-36 | 9,600 | 500 | 8,700 | 2,100 | 20,900 |
| 37-60 | 6,800 | 400 | 8,500 | 1,700 | 17,300 |
| 61-108 | 3,700 | 200 | 6,000 | 900 | 10,800 |
| 109+ | 1,400 | 100 | 2,700 | 300 | 4,400 |
| Total | 148,600 | 7,500 | 75,000 | 20,700 | 251,800 |
- Table note a. "Data for number of cases by reason for assistance not available"
- Note: Totals may not add due to rounding.
Text description of Table 8a-5c
| Duration of assistance (months) | Family type | ||||
|---|---|---|---|---|---|
| Single | Couple no dependants | Single parent | Couple with dependants | Total | |
| 0-3 | 38,000 | 1,700 | 9,900 | 3,100 | 52,700 |
| 4-6 | 26,900 | 1,200 | 7,800 | 2,600 | 38,400 |
| 7-12 | 30,200 | 1,400 | 13,000 | 3,700 | 48,300 |
| 13-24 | 30,400 | 1,600 | 16,700 | 5,000 | 53,700 |
| 25-36 | 14,500 | 800 | 10,400 | 2,900 | 28,500 |
| 37-60 | 8,500 | 500 | 9,500 | 2,100 | 20,500 |
| 61-108 | 4,300 | 200 | 6,400 | 1,000 | 11,900 |
| 109+ | 1,400 | 100 | 2,700 | 300 | 4,500 |
| Total | 154,200 | 7,300 | 76,300 | 20,600 | 258,400 |
- Table note a. "Data for number of cases by reason for assistance not available"
- Note: Totals may not add due to rounding.
Text description of Table 8a-5d
| Duration of assistance (months) | Family type | ||||
|---|---|---|---|---|---|
| Single | Couple no dependants | Single parent | Couple with dependants | Total | |
| 0-3 | 37,200 | 1,500 | 9,700 | 3,100 | 51,600 |
| 4-6 | 26,300 | 1,200 | 7,800 | 2,600 | 38,000 |
| 7-12 | 30,100 | 1,400 | 13,000 | 3,600 | 48,200 |
| 13-24 | 31,600 | 1,600 | 15,900 | 4,600 | 53,600 |
| 25-36 | 14,900 | 800 | 10,200 | 2,800 | 28,700 |
| 37-60 | 12,100 | 600 | 11,100 | 2,600 | 26,300 |
| 61-108 | 4,900 | 200 | 6,900 | 1,100 | 13,200 |
| 109+ | 1,600 | 100 | 2,800 | 300 | 4,800 |
| Total | 158,700 | 7,400 | 77,400 | 20,700 | 264,300 |
- Table note a. "Data for number of cases by reason for assistance not available"
- Note: Totals may not add due to rounding.
Text description of Table 8a-5e
| Duration of assistance (months) | Family type | ||||
|---|---|---|---|---|---|
| Single | Couple no dependants | Single parent | Couple with dependants | Total | |
| 0-3 | 33,400 | 1,300 | 8,600 | 2,700 | 46,100 |
| 4-6 | 25,500 | 1,000 | 7,300 | 2,300 | 36,200 |
| 7-12 | 28,200 | 1,300 | 11,500 | 3,300 | 44,300 |
| 13-24 | 30,800 | 1,400 | 15,600 | 4,500 | 52,400 |
| 25-36 | 15,400 | 800 | 9,700 | 2,600 | 28,500 |
| 37-60 | 14,300 | 700 | 11,700 | 2,700 | 29,400 |
| 61-108 | 5,800 | 300 | 7,500 | 1,300 | 14,900 |
| 109+ | 1,900 | 100 | 3,100 | 300 | 5,400 |
| Total | 155,300 | 6,800 | 75,200 | 19,700 | 257,000 |
- Table note a. "Data for number of cases by reason for assistance not available"
- Note: Totals may not add due to rounding.
B - Ontario Disability Support Program
In Ontario, the provincial social assistance program for persons with disabilities is known as the Ontario Disability Support Program (ODSP). The Ontario Disability Support Program Act, 1997, and its Regulations govern the program.
ODSP provides income support and benefits, including health-related benefits, to eligible people with disabilities and their families who are in financial need. It also provides employment supports to people with disabilities on a voluntary basis.
Service delivery
The Ministry of Community and Social Services is responsible for the delivery of ODSP through a network of 45 local offices located throughout the province with employment support services provided through a network of approximately 150 community-based service providers.
Eligibility
General
To be eligible for ODSP, an applicant must live in Ontario, be 18 years of age or older, be in financial need, and have assets no greater than the limits set out in the program. The ministry takes into account a variety of factors related to an applicant's circumstances, including assets and income from all sources, family size and make up, and type of accommodation.
An applicant who qualifies financially for ODSP also needs to go through a disability determination process to determine if he or she is a person with a disability, as defined under the ODSP Act, unless he or she is a member of a prescribed class, such as someone receiving Canada Pension Plan Disability benefits, a person who is aged 65 or over and not eligible for Old Age Security or a resident of certain group homes or facilities.
Asset limits
Applicants' and recipients' assets may not exceed the following allowable limits:
Ontario - Ontario Disability Support Program - Liquid asset exemptions, March 2013
- Single: $5,000 plus $500 for each dependant other than spouse
- Couple: $7,500 plus $500 for each additional dependant
Earnings exemptions
Ontario - Ontario Disability Support Program - Earnings exemptions, March 2013
- Under the Ontario Disability Support Program, 50% of earnings (i.e., income from employment, interest in or operation of a business, or a training program) is exempt. The non-exempt portion of earnings deducted from ODSP income support may be further reduced if the person with earnings has eligible child care expenses or disability-related employment expenses. The earnings of dependent adults who attend secondary school full-time are also exempt (this provision has been in effect since June 1998).
- As of April 1, 2009, the earnings of adult members who are in full-time attendance at post-secondary school became fully exempt (i.e., 100%) as income and assets (full-time attendance is 60% of a full course load or 40% for persons with a disability under ODSP).
The ODSP earnings exemptions are applied to net employment earnings for the purpose of reducing chargeable income in order to encourage recipients to pursue employment.
Benefits
Support provided through the ODSP can be categorized as either income support or employment supports.
Income support consists of a basic needs amount and a shelter allowance. The basic needs amount helps with the cost of food, clothing, transportation and necessary personal items for the recipient, a spouse and any dependent children or dependent adults, if applicable. Maximum basic needs rates are based on the number of members in the benefit unit, and the ages of the children in the unit. Recipients who live north of the 50th parallel and are without a year-round road access may be eligible for a Northern Allowance. Maximum shelter allowance rates are based on actual costs of rent or mortgage, heat, utilities, property taxes, home insurance premiums and condominium fees, up to the maximum amount set according to family size, which includes dependent children, or the type of accommodation arrangement such as board and lodge.
In addition, each member of a benefit unit may be eligible to receive an amount to assist with the cost of a special diet for a medical condition or to cover the costs of the nutritional needs associated with pregnancy and breast-feeding.
ODSP also provides supplemental health care benefits such as drug and dental coverage, and assistance with the costs of vision care, medical transportation, diabetic supplies, assistive devices and mobility device repairs and batteries.
Employment Supports provide employment-related goods and services, such as job placement assistance and job retention supports, to help people with disabilities find and keep jobs. Services are provided through a network of community-based services providers. Participation in Employment Supports is voluntary. A person does not need to be receiving income support to qualify for the Employment Supports program.
As a condition of eligibility, all adults members of an ODSP benefit unit who do not have a disability, and who do not meet the criteria for non-referral, are referred to Ontario Works to receive employment assistance to help them become and stay employed. ODSP recipients with disabilities may also voluntarily participate in Ontario Works employment assistance.
More information
For more information, please consult the Ontario Ministry of Community and Social Services website.
Statistics
Recipients and cases
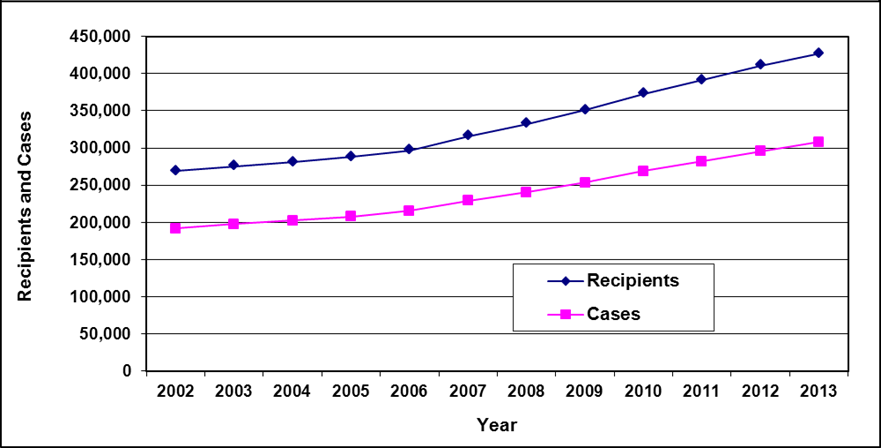
Text description of Table 8b-1
| Year | 2002 | 2003 | 2004 | 2005 | 2006 | 2007 | 2008 | 2009 | 2010 | 2011 | 2012 | 2013 |
|---|---|---|---|---|---|---|---|---|---|---|---|---|
| Recipients | 269,200 | 275,700 | 280,700 | 287,800 | 296,600 | 315,700 | 332,600 | 350,600 | 373,100 | 391,400 | 411,100 | 427,100 |
| Cases | 191,700 | 197,500 | 202,200 | 208,100 | 215,300 | 228,900 | 240,700 | 253,400 | 268,900 | 281,900 | 295,900 | 307,900 |
Cases by reason of assistance
| Reason for assistance | 2009 | 2010 | 2011 | 2012 | 2013 | |||||
|---|---|---|---|---|---|---|---|---|---|---|
| # | % | # | % | # | % | # | % | # | % | |
| Disability a | 246,500 | 97% | 262,000 | 97% | 275,000 | 98% | 288,900 | 98% | 301,000 | 98% |
| Age 65 and over | 5,200 | 2% | 5,200 | 2% | 5,300 | 2% | 5,300 | 2% | 5,300 | 2% |
| Other | 1,700 | 1% | 1,700 | 1% | 1,700 | 1% | 1,700 | 1% | 1,600 | 1% |
| Total | 253,400 | 100% | 268,900 | 100% | 281,900 | 100% | 295,900 | 100% | 307,900 | 100% |
- Table note a. "Disability" is defined as a substantial physical or mental impairment that is continuous or recurrent and expected to last one year or more. The impairment must substantially restrict the person in one or more activities of daily living.
- Note: Totals may not add due to rounding.
Recipients by family type
| Family type | 2009 | 2010 | 2011 | 2012 | 2013 | ||||||
|---|---|---|---|---|---|---|---|---|---|---|---|
| # | % | # | % | # | % | # | % | # | % | ||
| Adults | |||||||||||
| Single | Cases | 196,100 | 56% | 207,700 | 56% | 218,000 | 56% | 229,000 | 56% | 238,900 | 56% |
| Couple, no dependants | Cases | 21,200 | 12% | 22,100 | 12% | 22,800 | 12% | 23,500 | 11% | 24,000 | 11% |
| Spouses | 21,200 | 22,100 | 22,800 | 23,500 | 24,000 | ||||||
| Single parent | Cases | 21,600 | 8% | 23,300 | 8% | 24,700 | 8% | 26,000 | 9% | 27,000 | 9% |
| Dependants 18+ a | 6,100 | 7,300 | 8,400 | 9,400 | 10,100 | ||||||
| Couple with dependants | Cases | 14,500 | 9% | 15,700 | 10% | 16,500 | 10% | 17,400 | 10% | 18,100 | 10% |
| Spouses | 14,500 | 15,700 | 16,500 | 17,400 | 18,100 | ||||||
| Dependants 18+ a | 3,900 | 4,700 | 5,400 | 6,000 | 6,300 | ||||||
| Total adults | 299,000 | 85% | 318,700 | 85% | 335,000 | 86% | 352,200 | 86% | 366,400 | 86% | |
| Children | |||||||||||
| Single parent | Children under 18 | 26,400 | 8% | 27,800 | 7% | 28,800 | 7% | 30,000 | 7% | 30,800 | 7% |
| Couple with dependants | Children under 18 | 25,200 | 7% | 26,700 | 7% | 27,700 | 7% | 28,900 | 7% | 29,900 | 7% |
| Total children | 51,600 | 15% | 54,500 | 15% | 56,500 | 14% | 58,900 | 14% | 60,700 | 14% | |
| Total recipients | 350,600 | 100% | 373,100 | 100% | 391,400 | 100% | 411,100 | 100% | 427,100 | 100% | |
- Table note a. "Dependants 18 and over" are categorized as dependent adults, other than spouses.
- Note: Totals may not add due to rounding.
Cases by age of head
| Age of head | 2009 | 2010 | 2011 | 2012 | 2013 |
|---|---|---|---|---|---|
| <20 | 4,800 | 5,400 | 5,600 | 5,900 | 5,900 |
| 20-24 | 15,800 | 17,300 | 18,700 | 20,100 | 21,700 |
| 25-29 | 16,800 | 18,300 | 19,800 | 21,500 | 22,900 |
| 30-34 | 18,000 | 19,500 | 20,400 | 21,600 | 22,900 |
| 35-39 | 21,800 | 22,500 | 23,100 | 24,000 | 24,900 |
| 40-44 | 29,100 | 29,200 | 29,300 | 29,900 | 30,300 |
| 45-49 | 38,400 | 40,400 | 41,200 | 41,400 | 40,900 |
| 50-54 | 37,800 | 40,500 | 43,000 | 45,700 | 48,100 |
| 55-59 | 33,800 | 36,600 | 39,400 | 42,200 | 44,700 |
| 60-64 | 28,500 | 30,600 | 32,500 | 33,900 | 35,700 |
| 65+ | 8,600 | 8,700 | 9,000 | 9,600 | 9,800 |
| Total | 253,400 | 268,900 | 281,900 | 295,900 | 307,900 |
- Note: totals may not add due to rounding.
Cases by education of head
| Education of head a | 2009 | 2010 | 2011 | 2012 | 2013 | |||||
|---|---|---|---|---|---|---|---|---|---|---|
| # | % | # | % | # | % | # | % | # | % | |
| Primary | 36,400 | 14% | 36,400 | 14% | 36,200 | 13% | 36,000 | 12% | 35,600 | 12% |
| Secondary | 153,100 | 60% | 164,800 | 61% | 175,100 | 62% | 186,000 | 63% | 195,500 | 63% |
| Post secondary | 44,500 | 18% | 48,600 | 18% | 52,100 | 18% | 55,800 | 19% | 59,000 | 19% |
| Unknown | 19,400 | 8% | 17,500 | 7% | 18,600 | 7% | 18,200 | 6% | 17,800 | 6% |
| Total | 253,400 | 100% | 268,900 | 100% | 281,900 | 100% | 295,900 | 100% | 307,900 | 100% |
- Table note a. Education is defined as level of education attained as of date of application.
- Note: Totals may not add due to rounding.
Cases by reason for assistance and duration of assistance

Text description of Table 8b-6a
| Duration of assistance a (months) | Reason for assistance | ||
|---|---|---|---|
| Disability | Other b | Total | |
| 0-3 | 3,200 | 200 | 3,400 |
| 4-6 | 5,300 | 300 | 5,600 |
| 7-12 | 11,200 | 500 | 11,800 |
| 13-24 | 23,600 | 1,000 | 24,600 |
| 25-36 | 21,800 | 800 | 22,500 |
| 37-60 | 36,400 | 1,400 | 37,800 |
| 61-108 | 46,200 | 2,000 | 48,200 |
| 109+ | 98,800 | 600 | 99,400 |
| Total | 246,500 | 6,900 | 253,400 |
- Table note a. "Data of assistance" measures length of current spell only.
- Table note b. "Other" includes rehabilitated, age 65 and over and other.
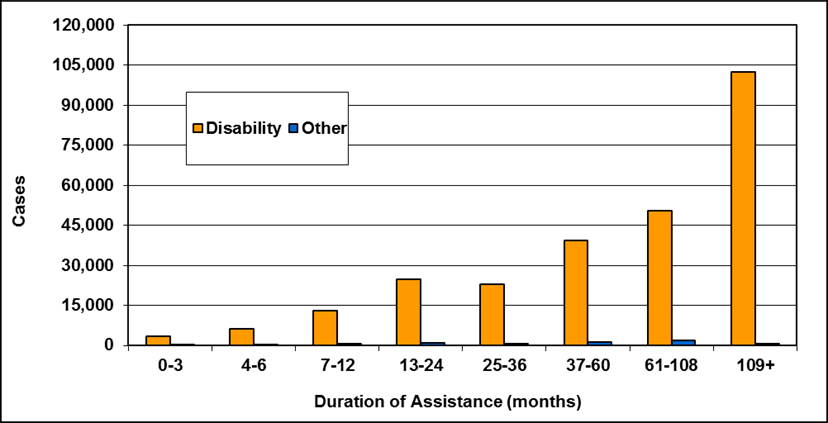
Text description of Table 8b-6b
| Duration of assistance a (months) | Reason for assistance | ||
|---|---|---|---|
| Disability | Other b | Total | |
| 0-3 | 3,500 | 200 | 3,700 |
| 4-6 | 6,100 | 300 | 6,400 |
| 7-12 | 13,000 | 500 | 13,600 |
| 13-24 | 24,700 | 1,000 | 25,700 |
| 25-36 | 22,800 | 800 | 23,700 |
| 37-60 | 39,200 | 1,300 | 40,500 |
| 61-108 | 50,300 | 2,000 | 52,200 |
| 109+ | 102,300 | 600 | 103,000 |
| Total | 262,000 | 6,900 | 268,900 |
- Table note a. "Data of assistance" measures length of current spell only.
- Table note b. "Other" includes rehabilitated, age 65 and over and other.
- Note: Totals may not add due to rounding.
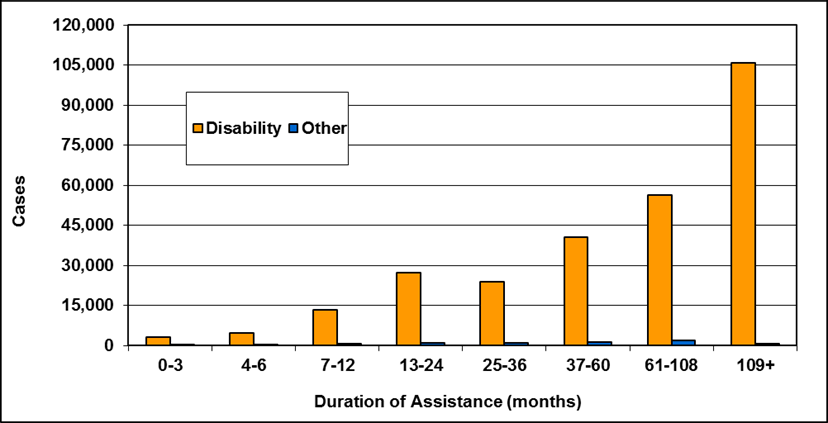
Text description of Table 8b-6c
| Duration of assistance a (months) | Reason for assistance | ||
|---|---|---|---|
| Disability | Other b | Total | |
| 0-3 | 3,100 | 200 | 3,300 |
| 4-6 | 4,700 | 300 | 5,000 |
| 7-12 | 13,300 | 600 | 13,900 |
| 13-24 | 27,400 | 1,000 | 28,400 |
| 25-36 | 23,800 | 900 | 24,600 |
| 37-60 | 40,700 | 1,300 | 42,000 |
| 61-108 | 56,400 | 1,900 | 58,300 |
| 109+ | 105,700 | 700 | 106,400 |
| Total | 275,000 | 7,000 | 281,900 |
- Table note a. "Data of assistance" measures length of current spell only.
- Table note b. "Other" includes rehabilitated, age 65 and over and other.
- Note: Totals may not add due to rounding.
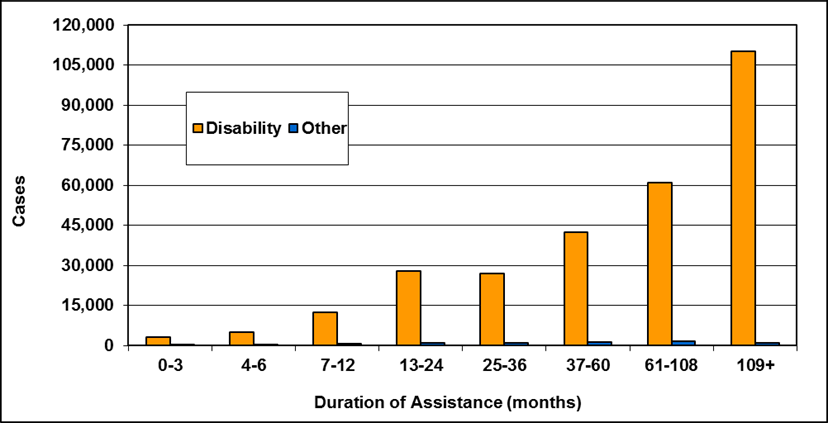
Text description of Table 8b-6d
| Duration of assistance a (months) | Reason for assistance | ||
|---|---|---|---|
| Disability | Other b | Total | |
| 0-3 | 3,100 | 300 | 3,300 |
| 4-6 | 4,900 | 300 | 5,300 |
| 7-12 | 12,500 | 600 | 13,100 |
| 13-24 | 28,000 | 1,000 | 29,000 |
| 25-36 | 26,800 | 900 | 27,600 |
| 37-60 | 42,500 | 1,300 | 43,800 |
| 61-108 | 60,900 | 1,700 | 62,600 |
| 109+ | 110,300 | 900 | 111,200 |
| Total | 288,900 | 7,000 | 295,900 |
- Table note a. "Data of assistance" measures length of current spell only.
- Table note b. "Other" includes rehabilitated, age 65 and over and other.
- Note: Totals may not add due to rounding.
Text description of Table 8b-6e
| Duration of assistance a (months) | Reason for assistance | ||
|---|---|---|---|
| Disability | Other b | Total | |
| 0-3 | 3,100 | 200 | 3,300 |
| 4-6 | 5,000 | 300 | 5,300 |
| 7-12 | 12,400 | 600 | 13,000 |
| 13-24 | 26,800 | 1,100 | 27,900 |
| 25-36 | 27,600 | 900 | 28,500 |
| 37-60 | 45,900 | 1,400 | 47,300 |
| 61-108 | 64,700 | 1,600 | 66,300 |
| 109+ | 115,400 | 900 | 116,300 |
| Total | 301,000 | 6,900 | 307,900 |
- Table note a. "Data of assistance" measures length of current spell only.
- Table note b. "Other" includes rehabilitated, age 65 and over and other.
- Note: Totals may not add due to rounding.
Chapter 9 - Manitoba - Employment and Income Assistance
In Manitoba, the provincial social assistance program is known as Employment and Income Assistance (EIA). The Employment and Income Assistance Act and its Regulation govern Manitoba's Employment and Income Assistance program.
Employment and Income Assistance provides basic benefits to both adults and children.
Service delivery
The Department of Jobs and the EconomyFootnote 15 is responsible for the policy and oversight of the Employment and Income Assistance program, and the Department of Family Services delivers the program to adults and children within the province, on behalf of Jobs and the Economy.
Eligibility
General
In order to be eligible for the Employment and Income Assistance program, applicants must meet the general eligibility requirements outlined in the "Social Assistance Overview" in this report.
Liquid assets
The last increase to EIA liquid asset exemption levels came into effect January 2009. Clients are allowed the following liquid assets at the time of application and after enrolment:
| Disabilities | Employable | Other a | |
|---|---|---|---|
| Single | $4,000 | $4,000 | $4,000 |
| Childless couple | $8,000 | $8,000 | $8,000 |
| Two-parent family | $8,000 plus $4,000 for each dependent child up to a maximum of $16,000. | $8,000 plus $4,000 for each dependent child up to a maximum of $16,000. | $8,000 plus $4,000 for each dependent child up to a maximum of $16,000. |
- Table note a. Includes single parents and aged persons.
Earnings exemptions
Employment and Income Assistance program clients are eligible for the following monthly exemptions on earned incomeFootnote 16:
Manitoba - Earnings exemptions a, March 2013
- Clients without disabilities b: $200 plus 30% of the net remainder
- Clients with disabilities c: $200 plus 30% of the net remainder
- Single Parents without Disabilities: $200 plus 30% of the net remainder
- Single Parents with Disabilities: $200 plus 30% of the net remainder
- Table note a. Earnings exemptions apply to each employed person in the household. The earnings of children who are in full-time attendance at an approved educational institution are totally exempt.
- Table note b. Able-bodied employable persons (general assistance)
- Table note c. Persons with disabilities and aged persons who are not single parents.
Benefits
Basic assistance consists of a basic allowance and a shelter allowance. The basic allowance covers the cost of food and clothing, as well as personal and household needs. Maximum basic allowance rates are based on the provision of a shelter payment, the household's composition, as well as the number of children in the household and their ages. Maximum shelter allowance rates are based on the number of persons in the household (including children).
More information
For more information, please consult the Manitoba Department of Jobs and the Economy website.
Statistics
Recipients and cases
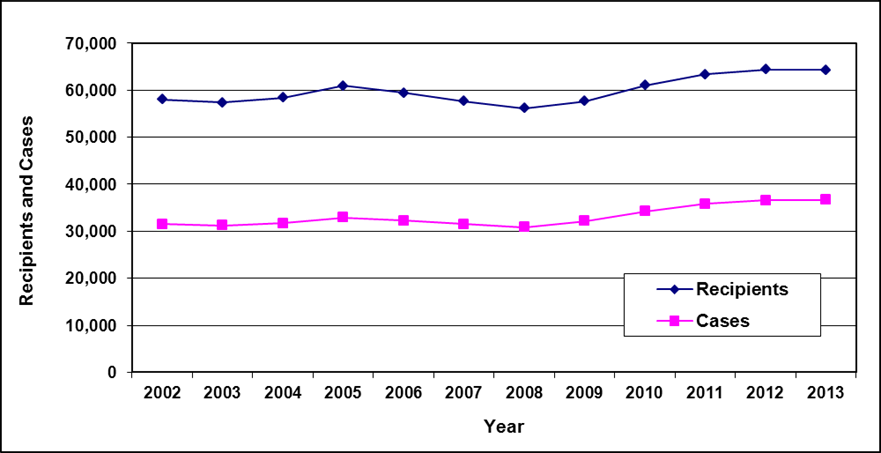
Text description of Table 9-1
| Year | 2002 | 2003 | 2004 | 2005 b | 2006 | 2007 | 2008 | 2009 c | 2010 c | 2011 c | 2012 c | 2013 c |
|---|---|---|---|---|---|---|---|---|---|---|---|---|
| Recipients | 58,000 | 57,400 | 58,400 | 60,900 | 59,400 | 57,700 | 56,200 | 57,700 | 61,000 | 63,400 | 64,400 | 64,300 |
| Cases | 31,500 | 31,200 | 31,700 | 32,900 | 32,300 | 31,500 | 30,900 | 32,200 | 34,200 | 35,800 | 36,600 | 36,700 |
- Table note a. Municipal program caseloads are not included in the above table.
- Table note b. Effective June 1, 2004, the Province assumed responsibility for the delivery and administration of municipal assistance in rural and northern Manitoba.
- Table note c. The total number of recipients and cases includes those that have left EIA for employment or training but remain eligible for non-insured health benefits through the Rewarding Work Health Plan. In 2013 this included approximately 1,200 cases and 2,500 participants. In 2012 this included approximately 1,000 cases and 2,000 participants. In 2011 this included approximately 800 cases and 1,800 participants. In 2010 this included approximately 600 cases and 1,300 participants. In 2009 this included approximately 200 cases and 300 participants.
Cases by reason for assistance
| Reason for assistance | 2009 | 2010 | 2011 | 2012 | 2013 | |||||
|---|---|---|---|---|---|---|---|---|---|---|
| # | % | # | % | # | % | # | % | # | % | |
| Unemployed | 5,700 | 18% | 6,600 | 19% | 6,500 | 18% | 7,000 | 19% | 7,300 | 20% |
| Disability | 18,300 | 57% | 19,100 | 56% | 20,500 | 57% | 20,700 | 57% | 20,500 | 56% |
| Sole support parent | 7,900 | 25% | 8,300 | 24% | 8,600 | 24% | 8,700 | 24% | 8,700 | 24% |
| Other a | 200 | 1% | 200 | 1% | 200 | 1% | 200 | 1% | 200 | 1% |
| Total | 32,200 | 100% | 34,200 | 100% | 35,800 | 100% | 36,600 | 100% | 36,700 | 100% |
- Table note a. "Other" includes aged, children under age 18 who head their own household, children whose parents are unable to support them and who live in a household not in receipt of income assistance, persons requiring the protection of a crisis facility, and persons granted eligibility as a special case under the discretion of the Minister.
- Note: Totals may not add due to rounding.
Recipients by family type
| Family type | 2009 | 2010 | 2011 | 2012 | 2013 | |||||
|---|---|---|---|---|---|---|---|---|---|---|
| # | % | # | % | # | % | # | % | # | % | |
| Adults - Single | 20,400 | 35% | 21,800 | 36% | 23,000 | 36% | 23,700 | 37% | 23,900 | 37% |
| Adults - Couple, no dependants | 1,900 | 3% | 2,100 | 3% | 2,100 | 3% | 2,200 | 3% | 2,300 | 4% |
| Adults - Single parent | 9,200 | 16% | 9,600 | 16% | 9,800 | 15% | 10,100 | 16% | 9,900 | 15% |
| Adults - Couple with dependants | 3,100 | 5% | 3,400 | 6% | 3,500 | 6% | 3,400 | 5% | 3,400 | 5% |
| Total adults | 34,500 | 60% | 36,900 | 60% | 38,400 | 61% | 39,400 | 61% | 39,500 | 61% |
| Children - Single parent | 18,800 | 33% | 19,600 | 32% | 20,200 | 32% | 20,300 | 32% | 20,100 | 31% |
| Children - Couple with dependants | 4,200 | 7% | 4,500 | 7% | 4,700 | 7% | 4,600 | 7% | 4,600 | 7% |
| Children - Head of household a | 100 | 0% | 100 | 0% | 100 | 0% | 100 | 0% | 0 | 0% |
| Total children | 23,200 | 40% | 24,200 | 40% | 25,000 | 39% | 25,000 | 39% | 24,700 | 38% |
| Total recipients | 57,700 | 100% | 61,000 | 100% | 63,400 | 100% | 64,400 | 100% | 64,300 | 100% |
- Table note a. "Children - Head of household" includes children under age 18 who head their own household, as well as children whose parents are unable to support them and who live in a household not in receipt of income assistance.
- Note: Totals may not add due to rounding.
Cases by age of head
| Age of head | 2009 | 2010 | 2011 | 2012 | 2013 |
|---|---|---|---|---|---|
| <20 | 1,300 | 1,500 | 1,500 | 1,600 | 1,600 |
| 20-24 | 4,100 | 4,400 | 4,800 | 5,000 | 5,000 |
| 25-29 | 4,000 | 4,300 | 4,500 | 4,500 | 4,500 |
| 30-34 | 3,500 | 3,800 | 4,000 | 4,200 | 4,200 |
| 35-39 | 3,600 | 3,700 | 3,800 | 3,700 | 3,800 |
| 40-44 | 3,500 | 3,600 | 3,700 | 3,700 | 3,700 |
| 45-49 | 3,700 | 3,900 | 4,000 | 4,000 | 3,800 |
| 50-54 | 3,300 | 3,500 | 3,700 | 3,800 | 3,800 |
| 55-59 | 2,800 | 3,000 | 3,200 | 3,400 | 3,400 |
| 60-64 | 2,200 | 2,300 | 2,400 | 2,500 | 2,600 |
| 65+ | 200 | 200 | 300 | 300 | 300 |
| Total | 32,200 | 34,200 | 35,800 | 36,600 | 36,700 |
- Note: Totals may not add due to rounding.
Cases by reason for assistance and duration of assistance
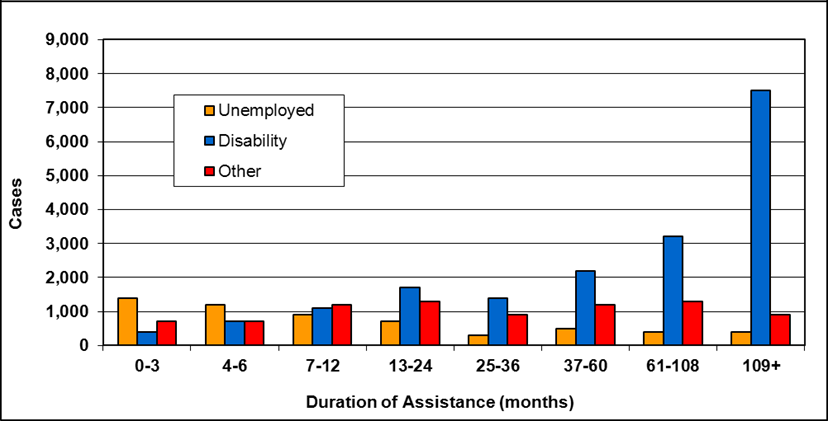
Text description of Table 9-5a
| Duration of assistance a (months) | Reason for assistance | |||
|---|---|---|---|---|
| Unemployed | Disability | Other b | Total | |
| 0-3 | 1,400 | 400 | 700 | 2,600 |
| 4-6 | 1,200 | 700 | 700 | 2,500 |
| 7-12 | 900 | 1,100 | 1,200 | 3,200 |
| 13-24 | 700 | 1,700 | 1,300 | 3,700 |
| 25-36 | 300 | 1,400 | 900 | 2,600 |
| 37-60 | 500 | 2,200 | 1,200 | 3,900 |
| 61-108 | 400 | 3,200 | 1,300 | 4,900 |
| 109+ | 400 | 7,500 | 900 | 8,800 |
| Total | 5,700 | 18,300 | 8,100 | 32,200 |
- Table note a. "Duration of assistance" is based on the length of time since case last became active.
- Table note b. "Other" includes single parent, aged, children under age 18 who head their own household, children whose parents are unable to support them and who live in a household not in receipt of income assistance, persons requiring the protection of a crisis facility, and persons granted eligibility as a special case under the discretion of the Minister.
- Note: Totals may not add due to rounding.

Text description of Table 9-5b
| Duration of assistance a (months) | Reason for assistance | |||
|---|---|---|---|---|
| Unemployed | Disability | Other b | Total | |
| 0-3 | 1,500 | 500 | 700 | 2,700 |
| 4-6 | 1,200 | 700 | 800 | 2,700 |
| 7-12 | 1,200 | 1,300 | 1,300 | 3,800 |
| 13-24 | 1,000 | 1,900 | 1,600 | 4,500 |
| 25-36 | 400 | 1,400 | 1,000 | 2,800 |
| 37-60 | 400 | 2,200 | 1,100 | 3,800 |
| 61-108 | 400 | 3,300 | 1,200 | 5,000 |
| 109+ | 400 | 7,700 | 800 | 9,000 |
| Total | 6,600 | 19,100 | 8,500 | 34,200 |
- Table note a. "Duration of assistance" is based on the length of time since case last became active.
- Table note b. "Other" includes single parent, aged, children under age 18 who head their own household, children whose parents are unable to support them and who live in a household not in receipt of income assistance, persons requiring the protection of a crisis facility, and persons granted eligibility as a special case under the discretion of the Minister.
- Note: Totals may not add due to rounding.
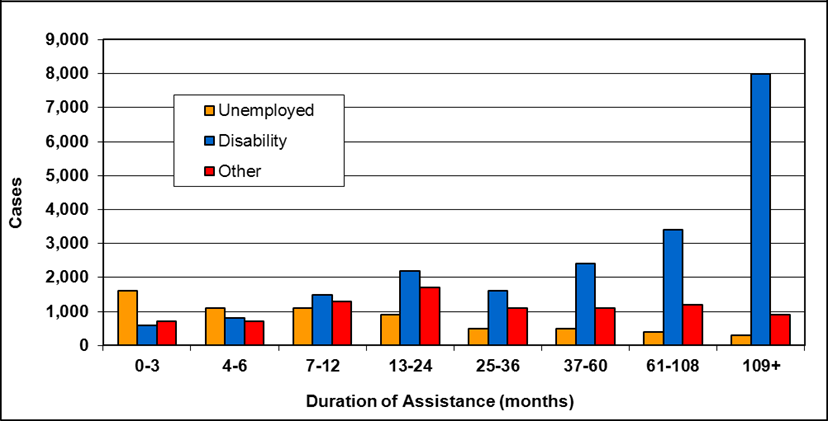
Text description of Table 9-5c
| Duration of assistance a (months) | Reason for assistance | |||
|---|---|---|---|---|
| Unemployed | Disability | Other b | Total | |
| 0-3 | 1,600 | 600 | 700 | 3,000 |
| 4-6 | 1,100 | 800 | 700 | 2,700 |
| 7-12 | 1,100 | 1,500 | 1,300 | 3,800 |
| 13-24 | 900 | 2,200 | 1,700 | 4,900 |
| 25-36 | 500 | 1,600 | 1,100 | 3,200 |
| 37-60 | 500 | 2,400 | 1,100 | 4,000 |
| 61-108 | 400 | 3,400 | 1,200 | 5,000 |
| 109+ | 300 | 8,000 | 900 | 9,200 |
| Total | 6,500 | 20,500 | 8,800 | 35,800 |
- Table note a. "Duration of assistance" is based on the length of time since case last became active.
- Table note b. "Other" includes single parent, aged, children under age 18 who head their own household, children whose parents are unable to support them and who live in a household not in receipt of income assistance, persons requiring the protection of a crisis facility, and persons granted eligibility as a special case under the discretion of the Minister.
- Note: Totals may not add due to rounding.
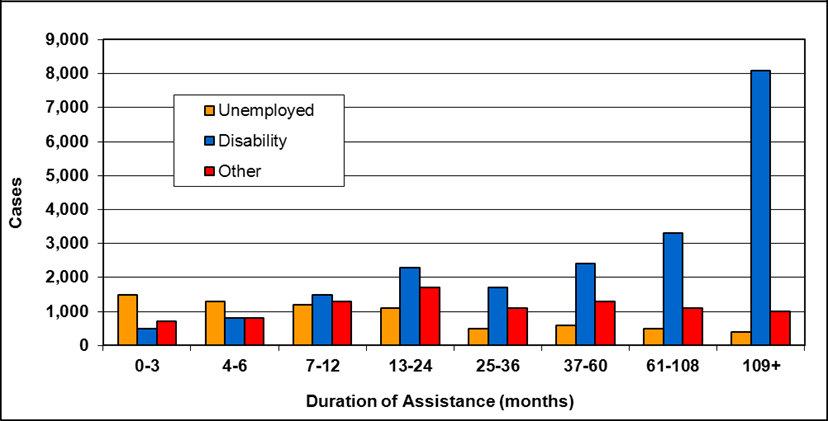
Text description of Table 9-5d
| Duration of assistance a (months) | Reason for assistance | |||
|---|---|---|---|---|
| Unemployed | Disability | Other b | Total | |
| 0-3 | 1,500 | 500 | 700 | 2,800 |
| 4-6 | 1,300 | 800 | 800 | 2,800 |
| 7-12 | 1,200 | 1,500 | 1,300 | 4,000 |
| 13-24 | 1,100 | 2,300 | 1,700 | 5,100 |
| 25-36 | 500 | 1,700 | 1,100 | 3,300 |
| 37-60 | 600 | 2,400 | 1,300 | 4,300 |
| 61-108 | 500 | 3,300 | 1,100 | 4,900 |
| 109+ | 400 | 8,100 | 1,000 | 9,400 |
| Total | 7,000 | 20,700 | 9,000 | 36,600 |
- Table note a. "Duration of assistance" is based on the length of time since case last became active.
- Table note b. "Other" includes single parent, aged, children under age 18 who head their own household, children whose parents are unable to support them and who live in a household not in receipt of income assistance, persons requiring the protection of a crisis facility, and persons granted eligibility as a special case under the discretion of the Minister.
- Note: Totals may not add due to rounding.
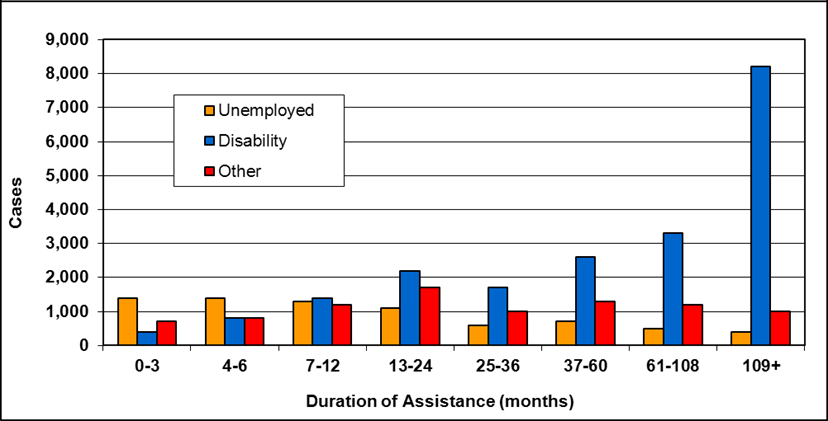
Text description of Table 9-5e
| Duration of assistance a (months) | Reason for assistance | |||
|---|---|---|---|---|
| Unemployed | Disability | Other b | Total | |
| 0-3 | 1,400 | 400 | 700 | 2,500 |
| 4-6 | 1,400 | 800 | 800 | 2,900 |
| 7-12 | 1,300 | 1,400 | 1,200 | 3,800 |
| 13-24 | 1,100 | 2,200 | 1,700 | 5,100 |
| 25-36 | 600 | 1,700 | 1,000 | 3,200 |
| 37-60 | 700 | 2,600 | 1,300 | 4,600 |
| 61-108 | 500 | 3,300 | 1,200 | 5,000 |
| 109+ | 400 | 8,200 | 1,000 | 9,500 |
| Total | 7,300 | 20,500 | 8,900 | 36,700 |
- Table note a. "Duration of assistance" is based on the length of time since case last became active.
- Table note b. "Other" includes single parent, aged, children under age 18 who head their own household, children whose parents are unable to support them and who live in a household not in receipt of income assistance, persons requiring the protection of a crisis facility, and persons granted eligibility as a special case under the discretion of the Minister.
- Note: Totals may not add due to rounding.
Cases reporting income by source of income
| Source of income | 2009 | 2010 | 2011 | 2012 | 2013 | |||||
|---|---|---|---|---|---|---|---|---|---|---|
| # | % | # | % | # | % | # | % | # | % | |
| Employment | 3,400 | 40% | 3,500 | 40% | 3,400 | 39% | 3,300 | 39% | 3,200 | 38% |
| Government transfers | 2,900 | 35% | 3,100 | 36% | 3,100 | 36% | 3,100 | 36% | 3,200 | 38% |
| Support payments a | 1,400 | 17% | 1,400 | 16% | 1,500 | 17% | 1,500 | 18% | 1,500 | 18% |
| Employment Insurance | 200 | 2% | 200 | 2% | 200 | 2% | 100 | 1% | 100 | 1% |
| Other b | 500 | 6% | 500 | 6% | 500 | 6% | 500 | 6% | 500 | 6% |
| Total c (includes double-counting) |
8,400 | 100% | 8,700 | 100% | 8,700 | 100% | 8,500 | 100% | 8,500 | 100% |
- Table note a. "Support payments" do not include maintenance payments assigned directly to Employment and Income Assistance. There were an estimated 2,900 additional Employment and Income Assistance cases with maintenance payments in 2012/13 that are not reflected in the data.
- Table note b. "Other" includes training allowances and other income.
- Table note c. Total cases in these categories may include double-counting, since cases that have more than one source of income are counted for each source reported.
- Note: Totals may not add due to rounding.
| Year | 2009 | 2010 | 2011 | 2012 | 2013 |
|---|---|---|---|---|---|
| Reporting income | 7,900 | 8,100 | 8,200 | 8,100 | 8,000 |
| No income | 24,300 | 26,000 | 27,600 | 28,600 | 28,600 |
| Total | 32,200 | 34,200 | 35,800 | 36,600 | 36,700 |
- Note: Totals may not add due to rounding.
Chapter 10 - Saskatchewan - Social Assistance Programs
In Saskatchewan, the provincial social assistance programs include the Saskatchewan Assistance Program (SAP), the Saskatchewan Assured Income for Disability (SAID), and the Transitional Employment Allowance (TEA). The Saskatchewan Assistance Act, and The Saskatchewan Assistance Regulations govern the Saskatchewan Assistance Program. The Saskatchewan Assistance Act and The Transitional Employment Allowance Regulations govern the Transitional Employment Allowance. The Saskatchewan Assistance Act and The Saskatchewan Assured Income for Disability Regulations, 2012 govern the Saskatchewan Assured Income for Disability program.
The Saskatchewan Assistance Program, the Saskatchewan Assured Income for Disability, and the Transitional Employment Allowance provide basic benefits to adults only. Children's basic benefits are provided through the Canada Child Tax Benefit and the National Child Benefit Supplement.
In addition to the provincial social assistance programs listed above, there is a suite of supplement programs available to provide additional financial assistance for families and individuals. These supplement programs include the Saskatchewan Rental Housing Supplement, the Saskatchewan Employment Supplement, the Child Care Subsidy, the Seniors Income Plan, and the Personal Care Home Benefit.
Service delivery
The Ministry of Social Services is responsible for the delivery of the Saskatchewan Assistance Program to adults within the province.
Eligibility
General
In order to be eligible for the Saskatchewan Assistance Program, applicants must meet the general eligibility requirements outlined in the "Social Assistance Overview" in this report.
Liquid assets
At the time of application, applicants' liquid assets may not exceed the following allowable limits.
Saskatchewan - Liquid asset exemptions, March 2013
- Single: $1,500
- Family: $3,000 for a recipient and one dependant plus $500 for each additional dependant
Earnings exemptionsFootnote 17
Once an application for assistance has been approved, Saskatchewan Assistance Program clients are eligible for the following monthly exemptions on earned income:
| Clients without disabilities | Clients with disabilities | |
|---|---|---|
| Single | $50 plus 25% of the remaining income, to a maximum of $200. | $200 plus 25% of the remaining income, to a maximum of $325. |
| Childless couple | $75 plus 25% of the remaining income, to a maximum of $275. | $250 plus 25% of the remaining income, to a maximum of $425. |
| Single parent pamily | $125 | $200 |
| Two-parent family | $125 | $200 |
- Note: The Earnings exemptions for clients with disabilities were increased in February 2011 for singles and childless couples.
- For singles with disabilities (base amount doubled from $100 to $200 with the maximum increasing from $225 to $325)
- For childless couples with disabilities (base amount doubled from $125 to $250 with the maximum increasing from $300 to $425)
Fully employable clients are not eligible for an earnings exemption for the first three months. Partially employable or unemployable clients are eligible for an earnings exemption from the date of eligibility.
Benefits
Basic assistance under the Saskatchewan Assistance Program consists of an adult basic allowance, a shelter allowance, and utility allowances. The adult basic allowance covers the cost of food, clothing, and personal and household items. Maximum shelter allowance rates are based on household size (including children) and geographic locationFootnote 18. Utility allowances (electricity, home heating and water) are based on actual costs.
Saskatchewan assured income for disability
The Saskatchewan Assured Income for Disability (SAID) program was established effective October 1, 2009.
Individuals who meet the SAP financial eligibility are assessed using a disability impact assessment process to determine eligibility for the SAID program. The SAID assessment, developed jointly by the Ministry and the disability community, is used to assess the impact of disability on individuals by assessing functional abilities, limitations and the supports used to perform activities of daily living and to participate in the community.
SAID benefits provide:
- A Living Income Benefit, which is a flat-rate benefit that provides for accommodation, food, clothing, and other basic items
- Disability needs including transportation, special clothing, and special dietary needs as required; and
- Supplementary Health Benefits
Transitional employment allowance
The Transitional Employment Allowance, introduced in 2003, provides short-term assistance for job-ready people while they seek work or participate in employment services. A flat-rate allowance is provided for basic needs, covering food, clothing, personal and household items, and shelter. Flat-rate allowances are also provided for utilities. Rates are based on household size and geographic location. A centralized, provincial contact centre administers the Transitional Employment Allowance.
More information
For more information, please consult the Saskatchewan Ministry of Social Services website.
StatisticsFootnote 19
Recipients and cases
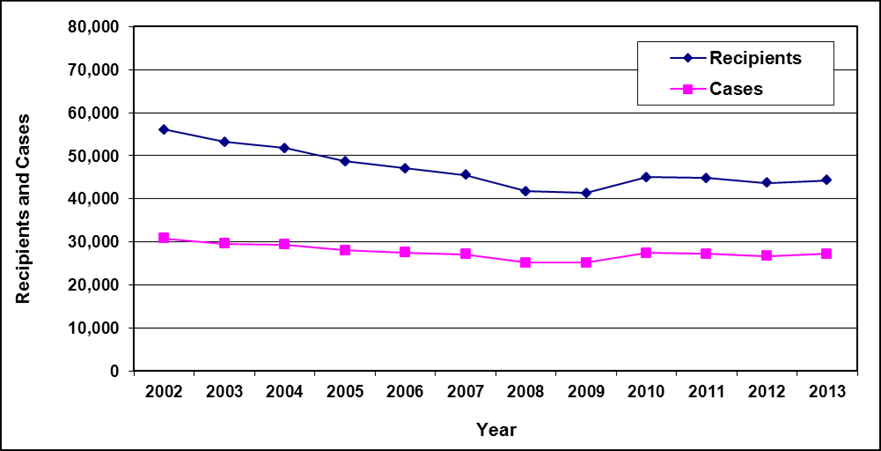
Text description of Table 10-1
| Year | 2002 | 2003 | 2004 | 2005 | 2006 | 2007 | 2008 | 2009 | 2010 | 2011 | 2012 | 2013 |
|---|---|---|---|---|---|---|---|---|---|---|---|---|
| Recipients | 56,100 | 53,200 | 51,800 | 48,700 | 47,100 | 45,500 | 41,700 | 41,300 | 45,000 | 44,800 | 43,700 | 44,300 |
| Cases | 30,800 | 29,500 | 29,300 | 28,000 | 27,500 | 27,100 | 25,100 | 25,100 | 27,400 | 27,200 | 26,700 | 27,200 |
- Table note a. Northern Bands receiving manual payments from 1994 to 1997 are included in the above table.
Cases by reason for assistance
| Reason for assistance | 2009 | 2010 | 2011 | 2012 | 2013 | |||||
|---|---|---|---|---|---|---|---|---|---|---|
| # | % | # | % | # | % | # | % | # | % | |
| Employed a | 700 | 3% | 700 | 3% | 600 | 2% | 500 | 2% | 500 | 2% |
| Unemployed b | 3,300 | 13% | 4,100 | 15% | 3,800 | 14% | 3,900 | 15% | 3,800 | 14% |
| Health c | 18,100 | 72% | 19,500 | 71% | 20,200 | 74% | 19,900 | 75% | 20,700 | 76% |
| Sole support parent d | 200 | 1% | 200 | 1% | 200 | 1% | 200 | 1% | 200 | 1% |
| Student e | 600 | 2% | 700 | 3% | 500 | 2% | 400 | 1% | 400 | 1% |
| Other f | 2,200 | 9% | 2,300 | 8% | 2,000 | 7% | 1,700 | 6% | 1,700 | 6% |
| Total | 25,100 | 100% | 27,400 | 100% | 27,200 | 100% | 26,700 | 100% | 27,200 | 100% |
- Table note a. "Employed" includes clients expecting income and those receiving an income supplement.
- Table note b. "Unemployed" includes clients who quit working, or were fired, laid off, etc.
- Table note c. "Health" includes mental and physical health restrictions.
- Table note d. "Sole support parent" includes single parents receiving assistance for child care needs and loss of spousal support.
- Table note e. "Student" includes clients attending school and post-secondary students with no jobs.
- Table note f. "Other" includes all reasons for assistance not named in the above categories, including: pending appeal and refugee claimant, as well as miscellaneous codes no longer in use.
- Note: Totals may not add due to rounding.
Recipients by family type
| Family type | 2009 | 2010 | 2011 | 2012 | 2013 | |||||
|---|---|---|---|---|---|---|---|---|---|---|
| # | % | # | % | # | % | # | % | # | % | |
| Adults - Single | 17,300 | 42% | 19,100 | 42% | 18,800 | 42% | 18,600 | 43% | 19,100 | 43% |
| Adults - Couple, no dependants | 1,600 | 4% | 1,800 | 4% | 1,800 | 4% | 1,800 | 4% | 1,900 | 4% |
| Adults - Single parent | 6,000 | 15% | 6,400 | 14% | 6,500 | 15% | 6,300 | 14% | 6,300 | 14% |
| Adults - Couple with dependants | 1,800 | 4% | 2,100 | 5% | 2,000 | 4% | 1,800 | 4% | 1,900 | 4% |
| Total adults | 26,800 | 65% | 29,400 | 65% | 29,100 | 65% | 28,500 | 65% | 29,100 | 66% |
| Children - Single parent | 12,300 | 30% | 13,100 | 29% | 13,200 | 29% | 13,000 | 30% | 12,800 | 29% |
| Children - Couple with dependants | 2,200 | 5% | 2,500 | 6% | 2,500 | 6% | 2,200 | 5% | 2,300 | 5% |
| Total children | 14,500 | 35% | 15,600 | 35% | 15,700 | 35% | 15,200 | 35% | 15,100 | 34% |
| Total recipients | 41,300 | 100% | 45,000 | 100% | 44,800 | 100% | 43,700 | 100% | 44,300 | 100% |
- Note: Totals may not add due to rounding.
Cases by age of head
| Age of head | 2009 | 2010 | 2011 | 2012 | 2013 |
|---|---|---|---|---|---|
| <20 | 1,200 | 1,300 | 1,200 | 1,100 | 1,200 |
| 20-24 | 3,300 | 3,800 | 3,600 | 3,500 | 3,500 |
| 25-29 | 3,000 | 3,300 | 3,300 | 3,200 | 3,200 |
| 30-34 | 2,600 | 2,800 | 2,900 | 2,800 | 2,800 |
| 35-39 | 2,500 | 2,700 | 2,600 | 2,600 | 2,500 |
| 40-44 | 2,700 | 2,900 | 2,800 | 2,700 | 2,600 |
| 45-49 | 2,900 | 3,100 | 3,100 | 3,000 | 3,000 |
| 50-54 | 2,600 | 2,800 | 2,800 | 2,900 | 3,100 |
| 55-59 | 2,200 | 2,400 | 2,500 | 2,600 | 2,700 |
| 60-64 | 1,800 | 2,000 | 1,900 | 2,000 | 2,100 |
| 65+ | 300 | 400 | 400 | 400 | 500 |
| Total | 25,100 | 27,400 | 27,200 | 26,700 | 27,200 |
- Note: Totals may not add due to rounding.
Cases by education of head
| Education of head a | 2009 | 2010 | 2011 | 2012 | 2013 | |||||
|---|---|---|---|---|---|---|---|---|---|---|
| # | % | # | % | # | % | # | % | # | % | |
| Primary | 5,200 | 21% | 5,000 | 18% | 4,800 | 18% | 4,500 | 17% | 4,400 | 16% |
| Secondary | 13,600 | 54% | 14,600 | 53% | 14,200 | 52% | 13,700 | 51% | 13,900 | 51% |
| Post secondary b | 700 | 3% | 700 | 3% | 700 | 3% | 600 | 2% | 600 | 2% |
| Unknown | 5,600 | 22% | 7,100 | 26% | 7,500 | 28% | 7,800 | 29% | 8,300 | 31% |
| Total | 25,100 | 100% | 27,400 | 100% | 27,200 | 100% | 26,700 | 100% | 27,200 | 100% |
- Table note a. Education is defined as level of education attained as of date of application.
- Table note b. "Post secondary" includes community/technical college, university and other post secondary.
- Note: Totals may not add due to rounding.
Cases by reason for assistance and duration of assistance
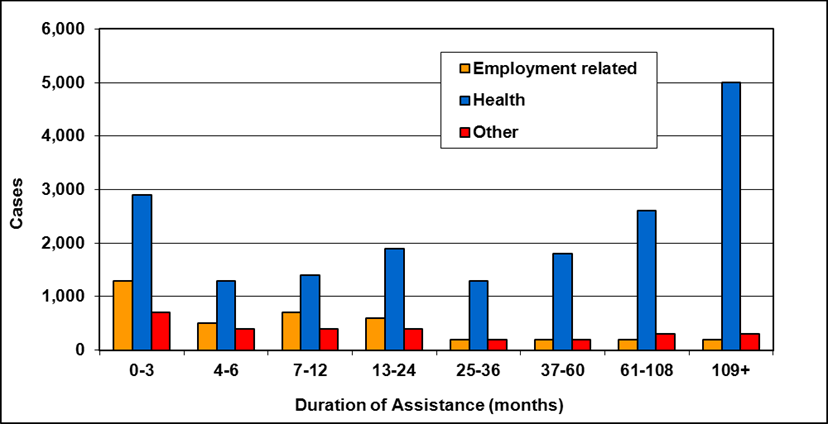
Text description of Table 10-6a
| Duration of assistance a (months) | Reason for assistance | |||
|---|---|---|---|---|
| Employment-related b | Health | Other c | Total | |
| 0-3 | 1,300 | 2,900 | 700 | 5,000 |
| 4-6 | 500 | 1,300 | 400 | 2,200 |
| 7-12 | 700 | 1,400 | 400 | 2,500 |
| 13-24 | 600 | 1,900 | 400 | 3,000 |
| 25-36 | 200 | 1,300 | 200 | 1,700 |
| 37-60 | 200 | 1,800 | 200 | 2,200 |
| 61-108 | 200 | 2,600 | 300 | 3,100 |
| 109+ | 200 | 5,000 | 300 | 5,500 |
| Total | 4,000 | 18,100 | 3,000 | 25,100 |
- Table note a. "Duration of assistance" measures length of current spell only.
- Table note b. "Employment-related" includes employed and unemployed.
- Table note c. "Other" includes sole support parent, student and other.
- Note: Totals may not add due to rounding.
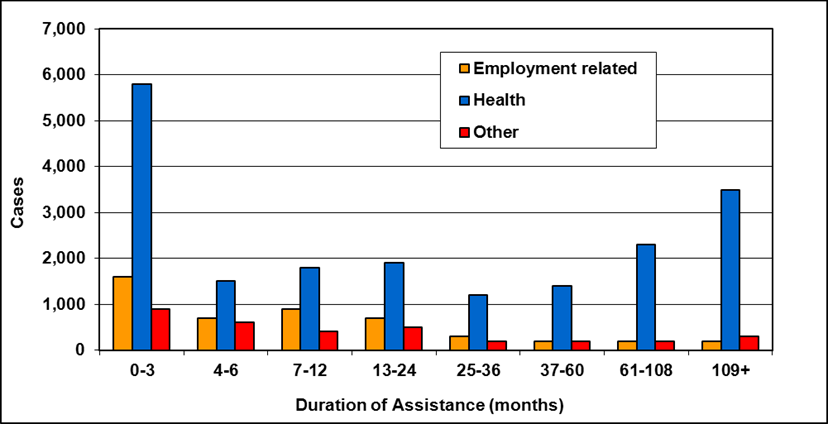
Text description of Table 10-6b
| Duration of assistance a (months) | Reason for assistance | |||
|---|---|---|---|---|
| Employment-related b | Health | Other c | Total | |
| 0-3 | 1,600 | 5,800 | 900 | 8,200 |
| 4-6 | 700 | 1,500 | 600 | 2,800 |
| 7-12 | 900 | 1,800 | 400 | 3,100 |
| 13-24 | 700 | 1,900 | 500 | 3,100 |
| 25-36 | 300 | 1,200 | 200 | 1,800 |
| 37-60 | 200 | 1,400 | 200 | 1,700 |
| 61-108 | 200 | 2,300 | 200 | 2,800 |
| 109+ | 200 | 3,500 | 300 | 4,000 |
| Total | 4,700 | 19,500 | 3,200 | 27,400 |
- Table note a. "Duration of assistance" measures length of current spell only.
- Table note b. "Employment-related" includes employed and unemployed.
- Table note c. "Other" includes sole support parent, student and other.
- Note: Totals may not add due to rounding.
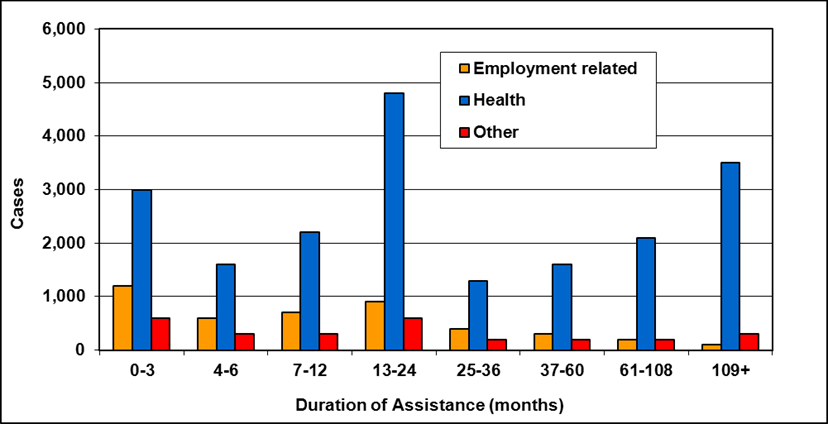
Text description of Table 10-6c
| Duration of assistance a (months) | Reason for assistance | |||
|---|---|---|---|---|
| Employment-related b | Health | Other c | Total | |
| 0-3 | 1,200 | 3,000 | 600 | 4,800 |
| 4-6 | 600 | 1,600 | 300 | 2,500 |
| 7-12 | 700 | 2,200 | 300 | 3,200 |
| 13-24 | 900 | 4,800 | 600 | 6,300 |
| 25-36 | 400 | 1,300 | 200 | 1,900 |
| 37-60 | 300 | 1,600 | 200 | 2,100 |
| 61-108 | 200 | 2,100 | 200 | 2,500 |
| 109+ | 100 | 3,500 | 300 | 3,900 |
| Total | 4,300 | 20,200 | 2,600 | 27,200 |
- Table note a. "Duration of assistance" measures length of current spell only.
- Table note b. "Employment-related" includes employed and unemployed.
- Table note c. "Other" includes sole support parent, student and other.
- Note: Totals may not add due to rounding.
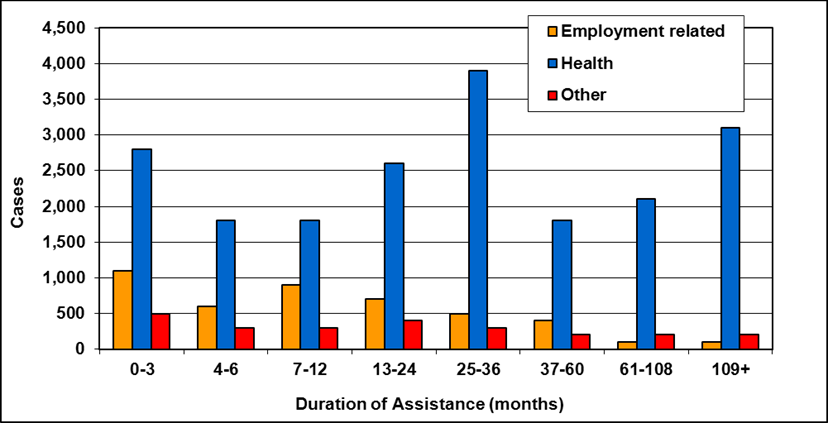
Text description of Table 10-6d
| Duration of assistance a (months) | Reason for assistance | |||
|---|---|---|---|---|
| Employment-related b | Health | Other c | Total | |
| 0-3 | 1,100 | 2,800 | 500 | 4,500 |
| 4-6 | 600 | 1,800 | 300 | 2,700 |
| 7-12 | 900 | 1,800 | 300 | 3,000 |
| 13-24 | 700 | 2,600 | 400 | 3,600 |
| 25-36 | 500 | 3,900 | 300 | 4,600 |
| 37-60 | 400 | 1,800 | 200 | 2,400 |
| 61-108 | 100 | 2,100 | 200 | 2,400 |
| 109+ | 100 | 3,100 | 200 | 3,500 |
| Total | 4,400 | 19,900 | 2,300 | 26,700 |
- Table note a. "Duration of assistance" measures length of current spell only.
- Table note b. "Employment-related" includes employed and unemployed.
- Table note c. "Other" includes sole support parent, student and other.
- Note: Totals may not add due to rounding.
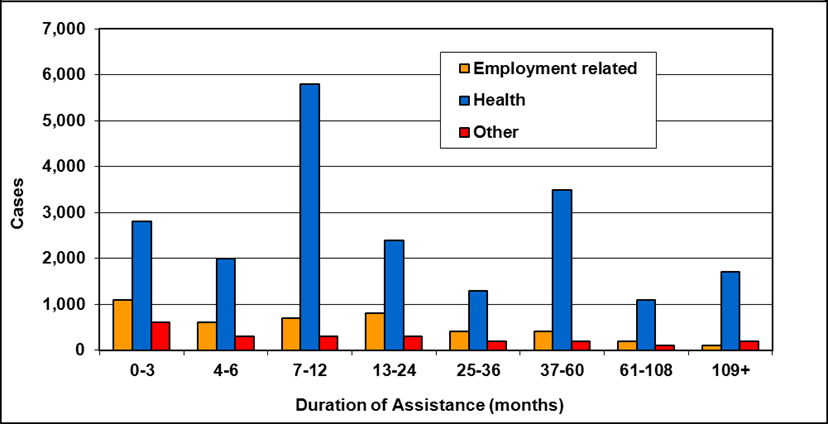
Text description of Table 10-6e
| Duration of assistance a (months) | Reason for assistance | |||
|---|---|---|---|---|
| Employment-related b | Health | Other c | Total | |
| 0-3 | 1,100 | 2,800 | 600 | 4,500 |
| 4-6 | 600 | 2,000 | 300 | 2,900 |
| 7-12 | 700 | 5,800 | 300 | 6,800 |
| 13-24 | 800 | 2,400 | 300 | 3,500 |
| 25-36 | 400 | 1,300 | 200 | 1,800 |
| 37-60 | 400 | 3,500 | 200 | 4,200 |
| 61-108 | 200 | 1,100 | 100 | 1,500 |
| 109+ | 100 | 1,700 | 200 | 2,100 |
| Total | 4,300 | 20,700 | 2,300 | 27,200 |
- Table note a. "Duration of assistance" measures length of current spell only.
- Table note b. "Employment-related" includes employed and unemployed.
- Table note c. "Other" includes sole support parent, student and other.
- Note: Totals may not add due to rounding.
Cases reporting income by source of income
| Source of income | 2009 | 2010 | 2011 | 2012 | 2013 | |||||
|---|---|---|---|---|---|---|---|---|---|---|
| # | % | # | % | # | % | # | % | # | % | |
| Employment | 1,400 | 32% | 1,400 | 30% | 1,300 | 30% | 1,200 | 27% | 1,300 | 27% |
| Government transfers | 1,700 | 39% | 1,900 | 41% | 1,800 | 41% | 1,900 | 42% | 2,200 | 46% |
| Support payments | 600 | 14% | 600 | 13% | 600 | 14% | 600 | 13% | 700 | 15% |
| Employment Insurance | 100 | 2% | 100 | 2% | 100 | 2% | 100 | 2% | 100 | 2% |
| Other | 600 | 14% | 600 | 13% | 600 | 14% | 700 | 16% | 700 | 15% |
| Total a (does not include double-counting) |
4,400 | 100% | 4,600 | 100% | 4,400 | 100% | 4,500 | 100% | 4,800 | 100% |
- Table note a. Cases receiving income from more than one source are counted only once; therefore, not all sources of income are counted in all categories. However, the total number of cases reporting income sources does not include double-counting.
- Note: Totals may not add due to rounding.
| Year | 2009 | 2010 | 2011 | 2012 | 2013 |
|---|---|---|---|---|---|
| Reporting income | 4,400 | 4,600 | 4,500 | 4,500 | 4,800 |
| No income | 20,700 | 22,800 | 22,700 | 22,200 | 22,400 |
| Total | 25,100 | 27,400 | 27,200 | 26,700 | 27,200 |
- Note: Totals may not add due to rounding.
Chapter 11 - Alberta
A - Alberta Works - Income Support
In Alberta, the provincial social assistance program is known as Alberta Works - Income Support. The Income and Employment Supports Act and the Income Supports, Training and Health Benefits Regulations govern the Alberta Works - Income Support program.
Alberta Works - Income Support provides basic benefits to both adults and children. It includes four components: Employment and Training Services, Income Support, Child Support Services, and Health Benefits.
Social assistance for persons with severe disabilities is provided through Alberta's Assured Income for the Severely Handicapped (AISH) program.
Service delivery
Alberta Human ServicesFootnote 20 is responsible for the delivery of the Alberta Works - Income Support program to adults and children within the province.
Eligibility
General
In order to be eligible for Alberta Works - Income Support, applicants must meet the general eligibility requirements outlined in the "Social Assistance Overview" in this report.
Liquid assetsFootnote 21
At the time of application for Alberta Works - Income Support, applicants' liquid assets may not exceed the following allowable limits:
Alberta - Alberta Works - Income Support - Cash and Liquid asset exemptions, March 2013
- Expected to Work a: Cash and liquid assets of the same value of one month of core benefits plus any additions as determined by the Director. Current additions added to Core benefits are: NCBS, High School Incentive Benefit, the Handicap Benefit, Personal Needs Supplement and Earnings Replacement Allowance
- Barriers to Full Employment a: Cash and liquid assets of up to twice the value of one month of core benefits plus any additions as determined by the Director. Current additions added to Core benefits are: NCBS, High School Incentive Benefit, the Handicap Benefit, Personal Needs Supplement and Earnings Replacement Allowance
- Table note a. See below for description.
Earnings exemptionsFootnote 22
Once an application for assistance has been approved, Alberta Works - Income Support clients are eligible for the following monthly exemptions on earned income:
Alberta - Alberta Works - Income Support - Earnings exemptions, March 2013
- Singles: $230 per month plus 25% of additional earnings of any amount over $230
- Single-Parent Family: $230 per month plus 25% of additional earnings of any amount over $230
- Couples (with or without children): $115 per month plus 25% of additional earnings of any amount over $115 for each working adult
- Dependent Children Not in School: $350 per month plus 25% of any amount over $350
- Dependent Children while attending school or in summer months between school terms: 100% exemption
Benefits
Core benefits consist of a core essential benefit and a core shelter benefit. The core essential benefit covers the cost of food, clothing (including diapers), household and personal needs, the use of a telephone, as well as laundry and basic transportation. The core shelter benefit is for rent, mortgage, utilities (except for electricity in social housing and telephone in private housing), heating fuel, municipal taxes, insurance, condominium fees, lot rental, homeowner's maintenance and damage deposit.
The amount of the monthly core benefit depends on family size, the number of adults in the family unit, the ages of the children in the family unit, the family unit's level of employability, and available financial resources.
Alberta Works - Income Support clients are placed in one of three client groups: Expected to Work, Barriers to Full Employment, or Learners.
The "Expected to Work" category includes those individuals and families that:
- Are working full-time or part-time, but whose income is less than the financial benefits provided under Alberta Works - Income Support
- Are able to work, but unable to find employment; or
- Are temporarily not available for work for a short time due to illness, or the presence of a child under twelve months of age, fleeing an abusive relationship, etc.
The "Barriers to Full Employment" category includes those individuals and families that:
- Have a permanent disability as defined by the AISH program, but require benefits that are not provided under the AISH program; or
- Have multiple barriers or suffer from a chronic medical condition that inhibits their ability to seek and accept employment, but are not considered as having a permanent disability as defined by the AISH program
The "Learners" category includes those individuals and families that are participating in an approved full-time training program or attending classes or courses to improve their employability. Tuition, books, supplies, and a living allowance may be provided.
More information
For more information, please consult the Alberta Human Services website.
StatisticsFootnote 23
Recipients and cases
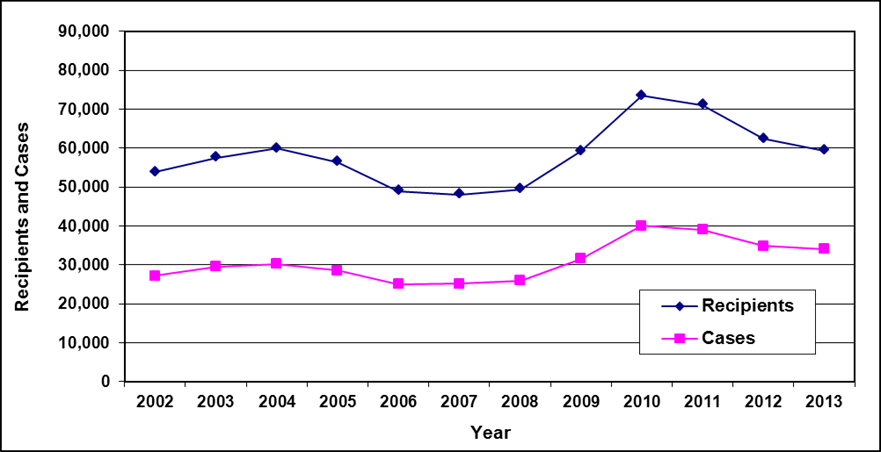
Text description of Table 11a-1
| Year | 2002 | 2003 | 2004 | 2005 | 2006 | 2007 | 2008 | 2009 | 2010 | 2011 | 2012 | 2013 |
|---|---|---|---|---|---|---|---|---|---|---|---|---|
| Recipients | 53,800 | 57,500 | 59,900 | 56,400 | 49,000 | 48,100 | 49,400 | 59,200 | 73,400 | 71,100 | 62,400 | 59,400 |
| Cases | 27,200 | 29,600 | 30,300 | 28,500 | 25,100 | 25,200 | 26,000 | 31,600 | 40,100 | 39,000 | 34,900 | 34,100 |
- Table note a. Children in Need (CIN) are not included.
Cases by reason for assistance
| Reason for assistance | 2009 | 2010 | 2011 | 2012 | 2013 | |||||
|---|---|---|---|---|---|---|---|---|---|---|
| # | % | # | % | # | % | # | % | # | % | |
| Employed | 3,000 | 9% | 3,400 | 8% | 3,400 | 9% | 2,800 | 8% | 2,500 | 7% |
| Unemployed | 10,100 | 32% | 15,300 | 38% | 13,100 | 34% | 10,000 | 29% | 8,700 | 26% |
| Short term disability a | 5,800 | 18% | 6,700 | 17% | 6,500 | 17% | 6,000 | 17% | 5,800 | 17% |
| Long term disability b | 12,700 | 40% | 14,800 | 37% | 16,000 | 41% | 16,100 | 46% | 17,000 | 50% |
| Total | 31,600 | 100% | 40,100 | 100% | 39,000 | 100% | 34,900 | 100% | 34,100 | 100% |
- Table note a. "Short-term disability" includes clients whose circumstances make them unavailable for work or training at present, but who will likely be able to return to work in the future. This category includes those with short-term medical problems or family responsibilities, and single persons age 50 years or older, who are unlikely to obtain continuous employment.
- Table note b. "Long-term disability" includes clients who may never be able to return to full-time work in the labour force. Often these clients suffer from multiple barriers, such as a combination of medical impairment, lack of education, and poor work history. This category may include AISH clients who have been transferred to the Alberta Works - Income Support program to access supplemental benefits which are not available through AISH.
- Note: Totals may not add due to rounding.
Recipients by family type
| Family type | 2009 | 2010 | 2011 | 2012 | 2013 | |||||
|---|---|---|---|---|---|---|---|---|---|---|
| # | % | # | % | # | % | # | % | # | % | |
| Adults - Single | 18,300 | 31% | 23,900 | 33% | 23,500 | 33% | 21,600 | 35% | 21,900 | 37% |
| Adults - Couple, no dependants | 2,200 | 4% | 2,500 | 3% | 2,300 | 3% | 1,900 | 3% | 1,700 | 3% |
| Adults - Single parent | 10,400 | 18% | 12,700 | 17% | 12,300 | 17% | 10,800 | 17% | 10,000 | 17% |
| Adults - Couple with dependants | 3,700 | 6% | 4,500 | 6% | 4,100 | 6% | 3,000 | 5% | 2,600 | 4% |
| Total adults | 34,600 | 58% | 43,700 | 60% | 42,200 | 59% | 37,300 | 60% | 36,200 | 61% |
| Children - Single parent | 20,000 | 34% | 24,300 | 33% | 23,800 | 33% | 21,200 | 34% | 19,700 | 33% |
| Children - Couple with dependants | 4,600 | 8% | 5,400 | 7% | 5,200 | 7% | 3,900 | 6% | 3,400 | 6% |
| Total children | 24,600 | 42% | 29,700 | 40% | 29,000 | 41% | 25,100 | 40% | 23,100 | 39% |
| Total recipients | 59,200 | 100% | 73,400 | 100% | 71,100 | 100% | 62,400 | 100% | 59,400 | 100% |
- Note: Totals may not add due to rounding.
Cases by age of head
| Age of head | 2009 | 2010 | 2011 | 2012 | 2013 |
|---|---|---|---|---|---|
| <20 | 300 | 400 | 300 | 300 | 200 |
| 20-24 | 3,200 | 4,500 | 3,900 | 3,200 | 2,900 |
| 25-29 | 4,200 | 5,300 | 4,800 | 4,100 | 3,700 |
| 30-34 | 3,800 | 5,000 | 4,700 | 4,200 | 4,200 |
| 35-39 | 3,700 | 4,500 | 4,400 | 3,700 | 3,800 |
| 40-44 | 3,900 | 4,800 | 4,600 | 4,000 | 3,800 |
| 45-49 | 4,100 | 5,100 | 4,800 | 4,300 | 4,000 |
| 50-54 | 3,400 | 4,400 | 4,500 | 4,300 | 4,400 |
| 55-59 | 2,400 | 3,300 | 3,500 | 3,500 | 3,600 |
| 60-64 | 1,800 | 2,100 | 2,400 | 2,300 | 2,500 |
| 65+ | 700 | 800 | 900 | 900 | 900 |
| Total | 31,600 | 40,100 | 39,000 | 34,900 | 34,100 |
- Note: Totals may not add due to rounding.
Cases by Education of Head
| Education of head a | 2009 | 2010 | 2011 | 2012 | 2013 | |||||
|---|---|---|---|---|---|---|---|---|---|---|
| # | % | # | % | # | % | # | % | # | % | |
| Primary | 6,900 | 22% | 8,300 | 21% | 8,300 | 21% | 7,400 | 21% | 7,300 | 21% |
| Secondary | 19,900 | 63% | 26,000 | 65% | 24,900 | 64% | 22,400 | 64% | 22,000 | 65% |
| Community/technical college | 1,700 | 5% | 2,200 | 5% | 2,100 | 5% | 1,800 | 5% | 1,700 | 5% |
| University | 2,200 | 7% | 2,700 | 7% | 2,700 | 7% | 2,300 | 7% | 2,200 | 6% |
| Other post-secondary | 600 | 2% | 700 | 2% | 700 | 2% | 600 | 2% | 600 | 2% |
| Unknown | 300 | 1% | 300 | 1% | 300 | 1% | 300 | 1% | 400 | 1% |
| Total | 31,600 | 100% | 40,100 | 100% | 39,000 | 100% | 34,900 | 100% | 34,100 | 100% |
- Table note a. Education is defined as level of education attained as of date of application.
- Note: Totals may not add due to rounding.
Cases by reason for assistance and duration of assistance
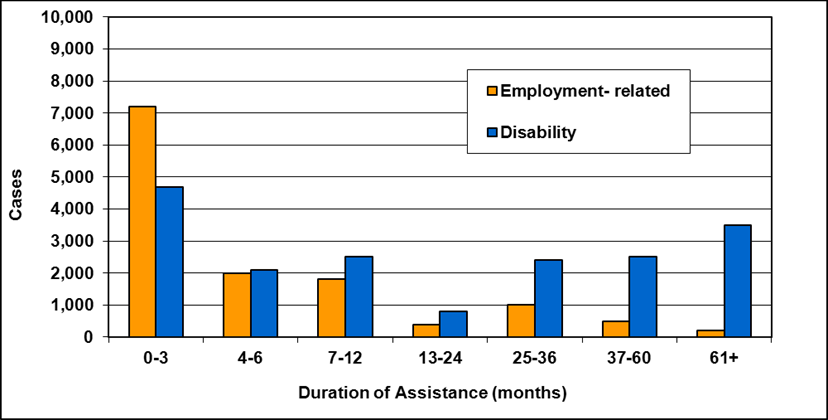
Text description of Table 11a-6a
| Duration of assistance a (months) | Reason for assistance | ||
|---|---|---|---|
| Employment-related b | Disability c | Total | |
| 0-3 | 7,200 | 4,700 | 11,900 |
| 4-6 | 2,000 | 2,100 | 4,100 |
| 7-12 | 1,800 | 2,500 | 4,400 |
| 13-24 | 400 | 800 | 1,200 |
| 25-36 | 1,000 | 2,400 | 3,500 |
| 37-60 | 500 | 2,500 | 3,000 |
| 61+ | 200 | 3,500 | 3,700 |
| Total | 13,100 | 18,500 | 31,600 |
- Table note a. "Duration of assistance" is based upon the length of time since case last become active.
- Table note b. "Employment-related" includes employed and unemployed.
- Table note c. "Disability" includes long-term and short-term disability.
- Note: Totals may not add due to rounding.
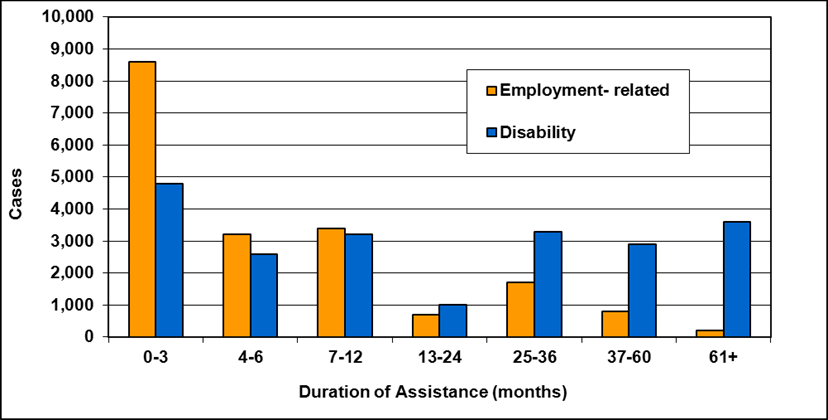
Text description of Table 11a-6b
| Duration of assistance a (months) | Reason for assistance | ||
|---|---|---|---|
| Employment-related b | Disability c | Total | |
| 0-3 | 8,600 | 4,800 | 13,400 |
| 4-6 | 3,200 | 2,600 | 5,800 |
| 7-12 | 3,400 | 3,200 | 6,600 |
| 13-24 | 700 | 1,000 | 1,700 |
| 25-36 | 1,700 | 3,300 | 5,100 |
| 37-60 | 800 | 2,900 | 3,700 |
| 61+ | 200 | 3,600 | 3,900 |
| Total | 18,600 | 21,500 | 40,100 |
- Table note a. "Duration of assistance" is based upon the length of time since case last become active.
- Table note b. "Employment-related" includes employed and unemployed.
- Table note c. "Disability" includes long-term and short-term disability.
- Note: Totals may not add due to rounding.
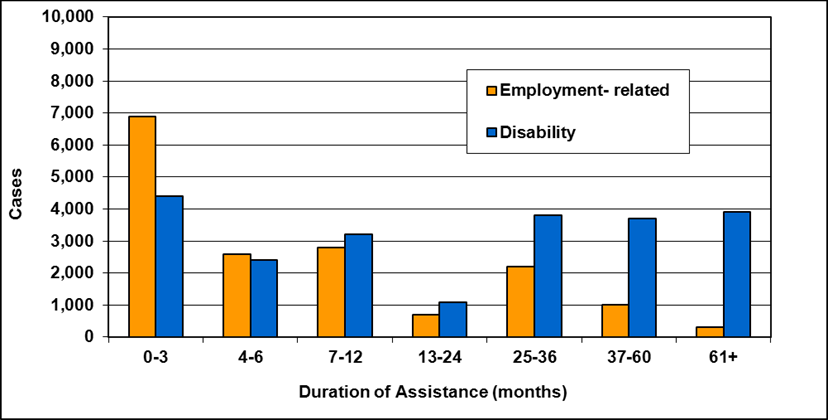
Text description of Table 11a-6c
| Duration of assistance a (months) | Reason for assistance | ||
|---|---|---|---|
| Employment-related b | Disability c | Total | |
| 0-3 | 6,900 | 4,400 | 11,200 |
| 4-6 | 2,600 | 2,400 | 5,000 |
| 7-12 | 2,800 | 3,200 | 6,000 |
| 13-24 | 700 | 1,100 | 1,800 |
| 25-36 | 2,200 | 3,800 | 6,000 |
| 37-60 | 1,000 | 3,700 | 4,700 |
| 61+ | 300 | 3,900 | 4,300 |
| Total | 16,500 | 22,400 | 39,000 |
- Table note a. "Duration of assistance" is based upon the length of time since case last become active.
- Table note b. "Employment-related" includes employed and unemployed.
- Table note c. "Disability" includes long-term and short-term disability.
- Note: Totals may not add due to rounding.
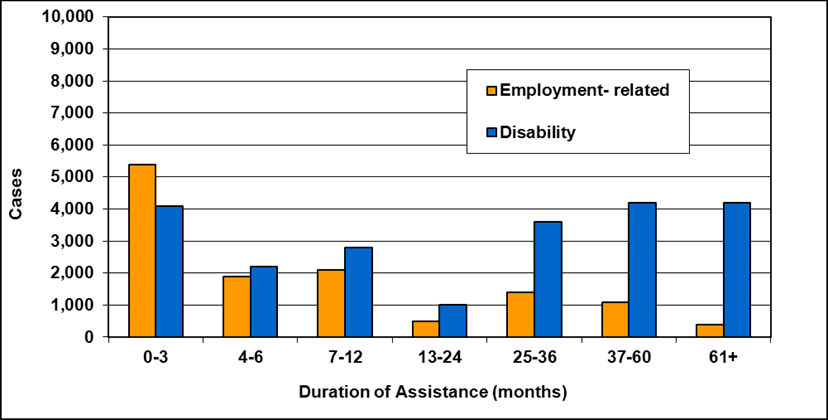
Text description of Table 11a-6d
| Duration of assistance a (months) | Reason for assistance | ||
|---|---|---|---|
| Employment-related b | Disability c | Total | |
| 0-3 | 5,400 | 4,100 | 9,500 |
| 4-6 | 1,900 | 2,200 | 4,000 |
| 7-12 | 2,100 | 2,800 | 4,900 |
| 13-24 | 500 | 1,000 | 1,500 |
| 25-36 | 1,400 | 3,600 | 5,100 |
| 37-60 | 1,100 | 4,200 | 5,300 |
| 61+ | 400 | 4,200 | 4,600 |
| Total | 12,800 | 22,100 | 34,900 |
- Table note a. "Duration of assistance" is based upon the length of time since case last become active.
- Table note b. "Employment-related" includes employed and unemployed.
- Table note c. "Disability" includes long-term and short-term disability.
- Note: Totals may not add due to rounding.

Text description of Table 11a-6e
| Duration of assistance a (months) | Reason for assistance | ||
|---|---|---|---|
| Employment-related b | Disability c | Total | |
| 0-3 | 4,800 | 4,200 | 9,000 |
| 4-6 | 1,700 | 2,200 | 3,900 |
| 7-12 | 1,900 | 2,900 | 4,900 |
| 13-24 | 500 | 1,000 | 1,400 |
| 25-36 | 1,200 | 3,600 | 4,600 |
| 37-60 | 800 | 4,300 | 5,100 |
| 61+ | 400 | 4,700 | 5,100 |
| Total | 11,300 | 22,800 | 34,100 |
- Table note a. "Duration of assistance" is based upon the length of time since case last become active.
- Table note b. "Employment-related" includes employed and unemployed.
- Table note c. "Disability" includes long-term and short-term disability.
- Note: Totals may not add due to rounding.
Cases reporting income by source of income
| Source of income | 2009 | 2010 | 2011 | 2012 | 2013 | |||||
|---|---|---|---|---|---|---|---|---|---|---|
| # | % | # | % | # | % | # | % | # | % | |
| Employment | 2,600 | 43% | 2,800 | 40% | 2,900 | 41% | 2,200 | 37% | 2,200 | 36% |
| Government transfers | 1,600 | 27% | 2,000 | 29% | 2,200 | 31% | 2,200 | 37% | 2,400 | 39% |
| Support payments | 1,300 | 22% | 1,600 | 23% | 1,500 | 21% | 1,300 | 22% | 1,200 | 20% |
| Employment Insurance | 200 | 3% | 300 | 4% | 200 | 3% | 100 | 2% | 100 | 2% |
| Other a | 200 | 3% | 300 | 4% | 300 | 4% | 200 | 3% | 200 | 3% |
| Total b (includes double-counting) |
6,000 | 100% | 7,000 | 100% | 7,100 | 100% | 6,000 | 100% | 6,100 | 100% |
- Table note a. "Other" includes training allowances and other income.
- Table note b. Total cases in these categories may include double-counting, since cases that have more than one source of income are counted for each source reported.
- Note: Totals may not add due to rounding.
| Year | 2009 | 2010 | 2011 | 2012 | 2013 |
|---|---|---|---|---|---|
| Reporting income | 5,500 | 6,400 | 6,500 | 5,500 | 5,600 |
| No income | 26,100 | 33,800 | 32,400 | 29,300 | 28,400 |
| Total | 31,600 | 40,100 | 39,000 | 34,900 | 34,100 |
- Note: Totals may not add due to rounding.
B - Assured Income for the Severely Handicapped
In Alberta, the provincial income assistance program for adults with a severe and permanent disability that substantially limits their ability to earn a livelihood is known as Assured Income for the Severely Handicapped (AISH). The Assured Income for the Severely Handicapped Act, the Assured Income for the Severely Handicapped General Regulation and the Applications and Appeals (Ministerial) Regulation govern Alberta's AISH program.
AISH provides program recipients with a monthly living allowance, health benefits, a child benefit and personal benefits.
Service delivery
Alberta Human Services is responsible for the delivery of AISH throughout the provinceFootnote 24.
Eligibility
General
In order to be eligible for AISH, recipients must meet the eligibility criteria for severe handicap, age, residency, assets, and income.
Assets
The non-exempt assets of AISH recipients and their cohabiting partners must not exceed $100,000. Assets considered part of the $100,000 limit include cash or cash equivalent assets, investments, and business/farm or other property. Key assets not included in the $100,000 limit are a client's principal residence, a vehicle, an adapted vehicle and a Registered Disability Savings Plan (RDSP). Other exempt assets include insurance payments for damages or stolen goods, special compensation payments and locked-in retirement accounts.
Alberta - Assured Income for the Severely Handicapped - Cash and liquid asset exemptions, March 2013
- Non-exempt assets: The total value of all non-exempt assets owned by an applicant or client, and their cohabitating partner must not exceed $100,000.
- Non-exempt assets: The non-exempt asset limit for Personal Benefits and the child Benefit is $3,000, except in situations of financial hardship.
Income exemptions
The level of benefits that a recipient receives from AISH depends on the type and amount of income of the recipient and his/her cohabiting partner. Under AISH, income is classified into three categories: fully exempt (e.g. income tax refunds, an education or training grant, a goods and service tax credit), partially exempt (e.g. interest/investment, rental income, employment income), and non-exempt (e.g. Canada Pension Plan Disability Benefits and Employment Insurance received by the recipient).
The level of exemption on partially exempt income and employment income varies depending on the composition of the household. AISH provides the following income exemptions:
Alberta - Assured Income for the Severely Handicapped - Employment income exemptions, March 2013
- Single person, childless couple (both AISH) a: $800 of net employment income is fully exempt. Any amount above $800, up to $1,500, is 50% exempt, for a maximum exemption of $1,150 a month.
- Single parent, childless couple (one AISH), couple with children (both AISH) b: $1,950 of net employment income is fully exempt. Any amount above $1,950, up to $2,500, is 50% exempt, for a maximum exemption of $2,225 a month.
- Table note a. Both cohabiting partners are eligible for AISH benefits. Each cohabiting partner receives the income exemption.
- Table note b. Both cohabiting partners are eligible for AISH benefits. One cohabiting partner receives this exemption while the other cohabiting partner receives the income exemption for a single person.
- Note: The Employment Income Exemptions were increased in April 2012:
- For a single person or childless couple (both on AISH) the exemption increased from $400 + 50% to a maximum of $900, to the current amount above.
- For a single parent, childless couples (one on AISH), and couples with children (both on AISH) the exemption increased from $975 + 50% to a maximum of $1,738, to the current amount above.
Alberta - Assured Income for the Severely Handicapped - Other partial income exemptions a, March 2013
- Single person, childless couple (both AISH) b: $200 of partially exempt income, plus 25% of any additional amount.
- Single parent, childless couple (one AISH), couple with children (both AISH) c: $775 of partially exempt income, plus 25% of any additional amount.
- Table note a. Examples of other partially exempt income includes investment, partnership and rental income.
- Table note b. Both cohabiting partners are eligible for AISH benefits. Each cohabiting partner receives the income exemption.
- Table note c. Both cohabiting partners are eligible for AISH benefits. One cohabiting partner receives this exemption while the other cohabiting partner receives the income exemption for a single person.
Benefits
The AISH program is intended to supplement other sources of the client's income to ensure their total income does not fall below a certain level, currently $1,588 per month. AISH provides a monthly living allowance, health benefits, a child benefit, and personal benefits.
The health benefits are available to the recipient, his/her cohabiting partner, and dependent children under the age of 18 years, or under the age of 20 years if attending high school, who reside with the recipient. The health benefits include prescription drugs, dental, optical, emergency ambulance, and essential diabetic supplies. AISH recipients also receive an exemption from the Alberta Aids to Daily Living (AADL) cost-share portion.
The child benefit and personal benefits are provided to recipients with $3,000 or less in assets or who are in a situation of financial hardship. The child benefit is intended to help cover the cost of raising dependent children. Personal benefits help AISH recipients to meet their extra needs, such as special diets, specialized clothing related to their disability, caring for a service animal, and assistance with health-related travel. Recipients who live in facilities, as defined by the Assured Income for the Severely Handicapped General Regulation, receive a modified living allowance (Modified AISH). Modified AISH includes the facility daily accommodation rate plus a personal allowance.
Recipients who become financially or medically ineligible for AISH may be eligible for the Alberta Adult Health Benefit, which provides similar health benefits as the AISH program. Rapid reinstatement of AISH benefits may also be available for those eligible former AISH recipients who did not leave AISH because of a change in their medical condition and have been off the program for less than 24 months.
More information
For more information, please consult the Assured Income for the Severely Handicapped website.
Statistics
Recipients
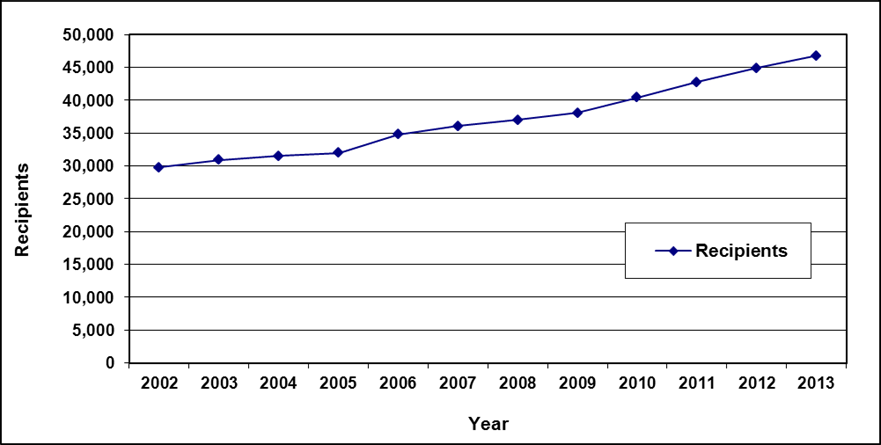
Text description of Table 11b-1
| Year | Recipients a |
|---|---|
| 2002 | 29,800 |
| 2003 | 30,900 |
| 2004 b | 31,500 |
| 2005 | 32,000 |
| 2006 | 34,800 |
| 2007 | 36,100 |
| 2008 | 37,000 |
| 2009 | 38,100 |
| 2010 | 40,400 |
| 2011 | 42,800 |
| 2012 | 44,900 |
| 2013 | 46,800 |
- Table note a. AISH provides financial assistance only to the individual with the disability, and not the recipient's family. Therefore, the number of cases and recipients is the same.
- Table note b. In the above table, 2004 data does not include 829 AISH recipients who left the program for the Alberta Adult Health Benefit (AAHB).
Recipients by medical condition
| Medical condition | 2009 | 2010 | 2011 | 2012 | 2013 | |||||
|---|---|---|---|---|---|---|---|---|---|---|
| # | % | # | % | # | % | # | % | # | % | |
| Physical disabilities | 17,500 | 46% | 18,700 | 46% | 19,700 | 46% | 20,600 | 46% | 21,400 | 46% |
| Mental illness disorders | 12,200 | 32% | 12,900 | 32% | 13,700 | 32% | 14,300 | 32% | 14,800 | 32% |
| Cognitive disorders | 8,300 | 22% | 8,800 | 22% | 9,400 | 22% | 9,900 | 22% | 10,600 | 23% |
| Total | 38,100 | 100% | 40,400 | 100% | 42,800 | 100% | 44,900 | 100% | 46,800 | 100% |
- Note: Totals may not add due to rounding.
Recipients by family type
| Family type | 2009 | 2010 | 2011 | 2012 | 2013 | |||||
|---|---|---|---|---|---|---|---|---|---|---|
| # | % | # | % | # | % | # | % | # | % | |
| Single | 34,000 | 89% | 36,000 | 89% | 38,000 | 89% | 39,800 | 89% | 41,200 | 88% |
| Couple with no children | 1,500 | 4% | 1,600 | 4% | 1,700 | 4% | 1,800 | 4% | 2,100 | 4% |
| Single parent | 1,900 | 5% | 2,000 | 5% | 2,200 | 5% | 2,400 | 5% | 2,500 | 5% |
| Couple with children | 700 | 2% | 800 | 2% | 900 | 2% | 900 | 2% | 1,000 | 2% |
| Total | 38,100 | 100% | 40,400 | 100% | 42,800 | 100% | 44,900 | 100% | 46,800 | 100% |
- Note: Totals may not add due to rounding.
Recipients by age
| Age | 2009 | 2010 | 2011 | 2012 | 2013 |
|---|---|---|---|---|---|
| 18-19 | 800 | 1,000 | 1,100 | 1,100 | 1,000 |
| 20-24 | 3,000 | 3,200 | 3,400 | 3,800 | 4,000 |
| 25-29 | 3,200 | 3,500 | 3,800 | 3,900 | 4,000 |
| 30-34 | 3,000 | 3,200 | 3,500 | 3,700 | 4,000 |
| 35-39 | 3,200 | 3,300 | 3,400 | 3,500 | 3,700 |
| 40-44 | 4,000 | 4,000 | 4,100 | 4,200 | 4,200 |
| 45-49 | 5,300 | 5,500 | 5,700 | 5,700 | 5,500 |
| 50-54 | 5,400 | 5,800 | 6,100 | 6,500 | 7,000 |
| 55-59 | 5,100 | 5,500 | 6,000 | 6,600 | 7,000 |
| 60-64 | 4,700 | 5,100 | 5,600 | 5,800 | 6,100 |
| 65+ | 200 | 200 | 300 | 300 | 300 |
| Total | 38,100 | 40,400 | 42,800 | 44,900 | 46,800 |
- Note: Totals may not add due to rounding.
Recipients by education
| Education | 2009 | 2010 | 2011 | 2012 | 2013 | |||||
|---|---|---|---|---|---|---|---|---|---|---|
| # | % | # | % | # | % | # | % | # | % | |
| Grade school | 30,000 | 79% | 32,600 | 81% | 34,900 | 86% | 30,800 | 69% | 32,300 | 69% |
| Post secondary b | 2,200 | 6% | 2,500 | 6% | 2,700 | 7% | 2,800 | 6% | 2,900 | 6% |
| Trades | 300 | 1% | 400 | 1% | 400 | 1% | 500 | 1% | 500 | 1% |
| University | 1,500 | 4% | 1,600 | 4% | 1,700 | 4% | 1,800 | 4% | 1,800 | 4% |
| Unknown | 4,000 | 10% | 3,400 | 8% | 3,100 | 8% | 9,100 | 20% | 9,300 | 20% |
| Total | 38,100 | 100% | 40,400 | 100% | 40,400 | 100% | 44,900 | 100% | 46,800 | 100% |
- Table note a. Education is defined as level of education attained as of date of application. Responses are not confirmed or updated if a client's level of education changes and the "unknown" is high.
- Table note b. "Post-secondary" includes community/technical college and other post secondary.
- Note: Totals may not add due to rounding.
Recipients reporting income by source of income
| Source of income | 2009 | 2010 | 2011 | 2012 | 2013 | |||||
|---|---|---|---|---|---|---|---|---|---|---|
| # | % | # | % | # | % | # | % | # | % | |
| Employment a | 7,200 | 37% | 7,000 | 26% | 7,200 | 25% | 7,400 | 25% | 7,400 | 24% |
| Canada Pension Plan Disability | 6,400 | 33% | 7,000 | 26% | 7,800 | 27% | 8,400 | 28% | 8,400 | 27% |
| Other income b | 5,900 | 30% | 13,200 | 49% | 13,900 | 48% | 14,200 | 47% | 15,000 | 49% |
| Total c (includes double-counting) |
19,500 | 100% | 27,200 | 100% | 28,900 | 100% | 30,000 | 100% | 30,800 | 100% |
- Table note a. Category "employment" includes employment and self-employment income.
- Table note b. "Other income includes all clients who have reported any income including CPP-D, but excludes employment income.
- Table note c. Total clients in these categories may include double-counting, since recipients that have more than one source of income are counted for each source reported.
- Note: Totals may not add due to rounding.
| Year | 2009 | 2010 | 2011 | 2012 | 2013 |
|---|---|---|---|---|---|
| Reporting income | 19,500 | 18,100 | 18,700 | 19,300 | 20,500 |
| No income | 18,600 | 22,300 | 24,100 | 25,600 | 26,300 |
| Total | 38,100 | 40,400 | 42,800 | 44,900 | 46,800 |
- Note: Totals may not add due to rounding.
Chapter 12 - British Columbia - Employment and Assistance
In British Columbia, the provincial social assistance program is known as Employment and Assistance (BCEA). The British Columbia Employment and Assistance Act, the British Columbia Employment and Assistance for Persons with Disabilities Act, the British Columbia Employment and Assistance Regulations, and the British Columbia Employment and Assistance for Persons with Disabilities Regulations govern British Columbia's Employment and Assistance program.
Employment and Assistance provides basic support and shelter benefits to family units. Children's basic support benefits are provided separately through federal child benefits.
Service delivery
The Ministry of Social Development and Social InnovationFootnote 25 is responsible for the delivery of Employment and Assistance to adults within the province.
Eligibility
General
In order to be eligible for Employment and Assistance, applicants must meet the general eligibility requirements outlined in the "Social Assistance Overview" in this report.
Prior to applying for Employment and Assistance, all adults in the family unit must complete an applicant orientation program and, prior to their application interview, complete a reasonable work search within the five-week period. Returning clients are subject to a shorter, three-week work search, and there are a number of exemptions to the work search requirement. Applicants are also assessed to determine whether or not they have an immediate need that requires urgent attention. At least one person in the family unit must demonstrate that they have received remuneration for at least 840 hours of paid employment, or earned at least $7,000 in gross employment income in each of any two consecutive years prior to applying for assistance. There are exemptions to this requirement in order to avoid hardship.
Liquid assets
At the time of application for Employment and Assistance, applicants' liquid assets may not exceed the following allowable limits.
| Clients without disabilities | Clients with disabilities | |
|---|---|---|
| Single | $2,000 | $5,000 |
| Single-parent family | $4,000 | $10,000 |
| Childless couple | $4,000 | $10,000 |
| Two-parent family | $4,000 | $10,000 |
- Note: Asset Exemptions were increased in October 2012.
- Income Assistance clients:
- No limit on cash assets at time of application (now included as part of the general asset limit)
- Singles - increased from $1,500 to $2,000
- Couples and family units - increased from $2,500 to $4,000
- Disability Assistance clients and Income Assistance clients in a special care facility:
- Singles - increased from $3,000 to $5,000
- Couples and family units - increased from $5,000 to $10,000
- Income Assistance clients:
Earnings exemptions
Employment and Assistance clients are eligible for the following monthly exemptions on earned income following three months on assistance:
British Columbia - Earnings exemptions, March 2013
- All expected to work families and individuals: $200
- A single individual with Persons with Disabilities (PWD): $800
- A single individual with Persons with Persistent Multiple Barriers (PPMB): $500
- A couple where both individuals have PWD designation: $1,600
- A couple where only one individual has PWD designation: $1,000
- A single parent who cares for a child with a severe disability where the disability of the child precludes the caregiver from working outside the home for more than 30 hours a week: $300
- Note: Earnings exemptions were changed in October 2012.
- Expected to work families and individuals became eligible for an exemption of $200 per month.
- Single PWD clients and family units where one person is PWD increased from $500 to $800 per month.
- Couples where both persons are PWD increased from $750 to $1,600 per month.
Annualized Earnings exemptions (AEE) for individuals on disability assistance began in January 2013. The AEE allows individuals on disability assistance to use their earnings exemptions on an annual instead of monthly basis. These AEE amounts are equivalent to 12 times the monthly exemption limit for the calendar year.
Benefits
Basic assistance consists of a support allowance and a shelter allowance. The support allowance covers the cost of food, clothing, personal and household items. Maximum support allowance rates are based on the composition of the family unit and the age or marital/common law status of the applicant. The shelter allowance pays actual shelter costs to a maximum amount. Maximum shelter allowance rates are based on the number of persons in the family unit.
Employment and Assistance has three rates schedules: Income Assistance, Disability Assistance, and Hardship Assistance. Income Assistance rates apply to two separate groups of clients across a range of family types. One group is classed as employable and these clients receive an assistance rate that is based on a temporary need for assistance. The other group consists of clients with persistent multiple barriers to employment (PPMB) and their rate is higher than employable clients since they typically require income assistance over a longer time period. Disability Assistance rates apply to all households that include at least one person aged 18 years or older who has a severe and confirmed mental or physical impairment that restricts their ability to perform daily living activities and that is expected to continue for at least two years. Hardship Assistance rates apply to those persons requiring temporary financial assistance on a month-to-month basis who are not eligible for income or disability assistance for a number of specific reasons, but present circumstances of undue hardship if no assistance is provided.
More information
For more information, please consult the British Columbia Ministry of Social Development and Social Innovation website.
Statistics
Recipients and cases
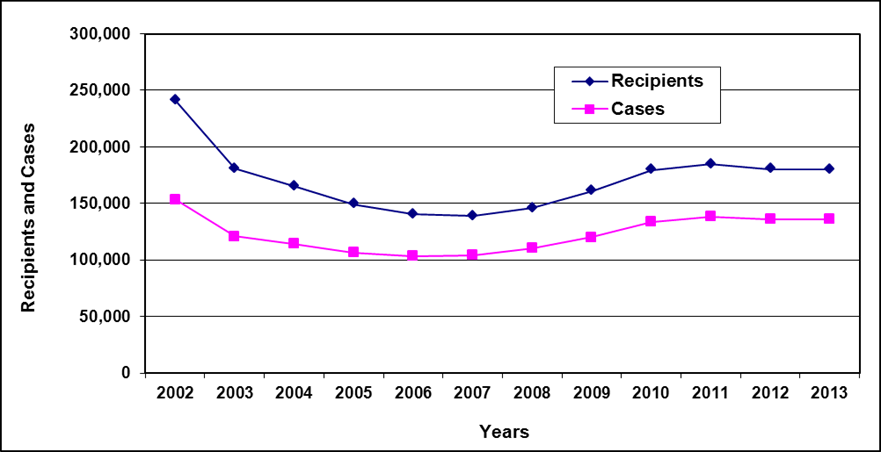
Text description of Table 12-1
| Year | Recipients | Cases |
|---|---|---|
| 2002 d | 241,200 | 153,700 |
| 2003 | 180,700 | 121,100 |
| 2004 | 165,000 | 114,300 |
| 2005 | 149,300 | 106,800 |
| 2006 | 140,500 | 103,400 |
| 2007 | 138,700 | 104,300 |
| 2008 | 145,700 | 110,500 |
| 2009 e | 160,800 | 120,300 |
| 2010 e | 179,400 | 133,800 |
| 2011 e | 184,700 | 138,300 |
| 2012 e | 180,500 | 136,100 |
| 2013 e | 180,100 | 136,200 |
- Table note a. Cases and recipients include: basic or temporary assistance, hardship assistance, age 60-64, persons with disability (Handicapped or Disability Benefits II), persons with persistent multiple barriers (Unemployable or Disability Benefits I), and seniors in receipt of basic assistance.
- Table note b. No transients are included in data.
- Table note c. Data represents all actual cases active during the month of March.
- Table note d. Employment and Assistance (EA) replaced BC Benefits (Income Assistance) in 2002.
- Table note e. Children in home of relative (CIHR) was transferred to the Ministry of Children and Family Development in August 2008. Therefore BCEA stats from August 2008 and onwards will no longer include CIHR.
Cases by reason for assistance
| Reason for assistance | 2009 | 2010 | 2011 | 2012 | 2013 | |||||
|---|---|---|---|---|---|---|---|---|---|---|
| # | % | # | % | # | % | # | % | # | % | |
| Expected to work a | 32,000 | 27% | 39,000 | 29% | 39,600 | 29% | 33,500 | 25% | 33,300 | 24% |
| Temporarily excused from working b | 11,800 | 10% | 14,200 | 11% | 12,700 | 9% | 12,200 | 9% | 9,900 | 7% |
| Persons with disabilities c | 69,700 | 58% | 73,100 | 55% | 77,900 | 56% | 82,300 | 60% | 85,800 | 63% |
| Persistent multiple barriers d | 6,700 | 6% | 7,600 | 6% | 8,100 | 6% | 8,100 | 6% | 7,200 | 5% |
| Total | 120,300 | 100% | 133,800 | 100% | 138,300 | 100% | 136,100 | 100% | 136,200 | 100% |
- Table note a. Includes EA recipients who are expected to search for and accept employment.
- Table note b. Includes single parents with children under age 3 years or who are caring for a child with a physical or mental condition, seniors over age 64 years, persons in a special care facility or hospital, participating in drug or alcohol treatment, recently separated from an abusive spouse/relative, caring for a spouse with a physical or mental condition, or who do not meet landed immigrant requirements. It also includes persons who are expected to work with a temporary medical condition.
- Table note c. Refers to cases which include a person 18 years of age or over with a severe mental or physical impairment, which restricts the person's ability to perform daily living activities. The person must require an assistive device, the help or supervision of another person, or the services of an assistance animal to perform daily living activities.
- Table note d. Includes EA recipients who have barriers that seriously impede their ability to work. Their medical condition must have existed for at least one year and be expected to continue for at least two more years. They are excused from working.
- Note: Totals may not add due to rounding.
Recipients by family type
| Family type | 2009 | 2010 | 2011 | 2012 | 2013 | |||||
|---|---|---|---|---|---|---|---|---|---|---|
| # | % | # | % | # | % | # | % | # | % | |
| Adults - Single | 96,400 | 60% | 107,100 | 60% | 111,100 | 60% | 110,000 | 61% | 110,500 | 61% |
| Adults - Couple, no dependants | 8,800 | 5% | 9,200 | 5% | 9,100 | 5% | 8,700 | 5% | 8,700 | 5% |
| Adults - Single parent | 16,200 | 10% | 18,400 | 10% | 19,000 | 10% | 18,300 | 10% | 17,900 | 10% |
| Adults - Couple with dependants | 6,500 | 4% | 7,500 | 4% | 7,500 | 4% | 7,000 | 4% | 6,900 | 4% |
| Total adults | 127,900 | 80% | 142,200 | 79% | 146,600 | 79% | 143,900 | 80% | 144,000 | 80% |
| Children - Single parent | 26,300 | 16% | 29,600 | 16% | 30,600 | 17% | 29,500 | 16% | 29,000 | 16% |
| Children - Couple with dependants | 6,600 | 4% | 7,600 | 4% | 7,600 | 4% | 7,100 | 4% | 7,100 | 4% |
| Total children | 32,900 | 20% | 37,200 | 21% | 38,100 | 21% | 36,600 | 20% | 36,100 | 20% |
| Total recipients | 160,800 | 100% | 179,400 | 100% | 184,700 | 100% | 180,500 | 100% | 180,100 | 100% |
- Note: Totals may not add due to rounding.
Cases by age of head
| Age of head | 2009 | 2010 | 2011 | 2012 | 2013 |
|---|---|---|---|---|---|
| <20 | 2,400 | 2,900 | 2,700 | 2,500 | 2,500 |
| 20-24 | 10,800 | 13,000 | 13,200 | 12,500 | 12,200 |
| 25-29 | 11,700 | 13,500 | 14,000 | 13,300 | 13,000 |
| 30-34 | 11,400 | 12,800 | 13,200 | 13,100 | 13,100 |
| 35-39 | 12,900 | 13,800 | 13,500 | 12,800 | 12,700 |
| 40-44 | 15,000 | 16,100 | 16,400 | 15,700 | 15,100 |
| 45-49 | 17,500 | 19,100 | 19,300 | 18,300 | 17,600 |
| 50-54 | 15,900 | 17,600 | 18,800 | 19,200 | 19,700 |
| 55-59 | 12,700 | 13,900 | 15,100 | 16,000 | 17,100 |
| 60-64 | 9,100 | 10,300 | 11,200 | 11,600 | 12,200 |
| 65+ | 900 | 900 | 900 | 1,000 | 1,000 |
| Total | 120,300 | 133,800 | 138,300 | 136,100 | 136,200 |
- Note: Totals may not added due to rounding.
Cases by reason for assistance and duration of assistance
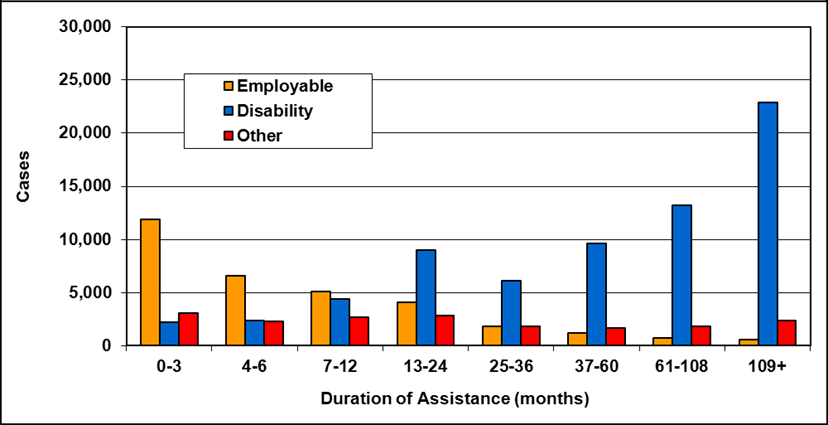
Text description of Table 12-5a
| Duration of assistance a (months) | Employable b | Disability c | Other d | Total |
|---|---|---|---|---|
| 0-3 | 11,900 | 2,200 | 3,100 | 17,200 |
| 4-6 | 6,600 | 2,400 | 2,300 | 11,200 |
| 7-12 | 5,100 | 4,400 | 2,700 | 12,200 |
| 13-24 | 4,100 | 9,000 | 2,800 | 15,900 |
| 25-36 | 1,800 | 6,100 | 1,800 | 9,600 |
| 37-60 | 1,200 | 9,600 | 1,700 | 12,600 |
| 61-108 | 700 | 13,200 | 1,800 | 15,700 |
| 109+ | 600 | 22,900 | 2,400 | 25,900 |
| Total | 32,000 | 69,700 | 18,500 | 120,300 |
- Table note a. "Duration of assistance" measures length of current spell only.
- Table note b. "Employable" includes cases that are expected to work.
- Table note c. "Disability" includes cases with persons with disabilities.
- Table note d. "Other" includes cases with persistent multiple barriers, cases temporarily excused from working and persons who are expected to work with a temporary medical condition.
- Note: Totals may not add due to rounding.
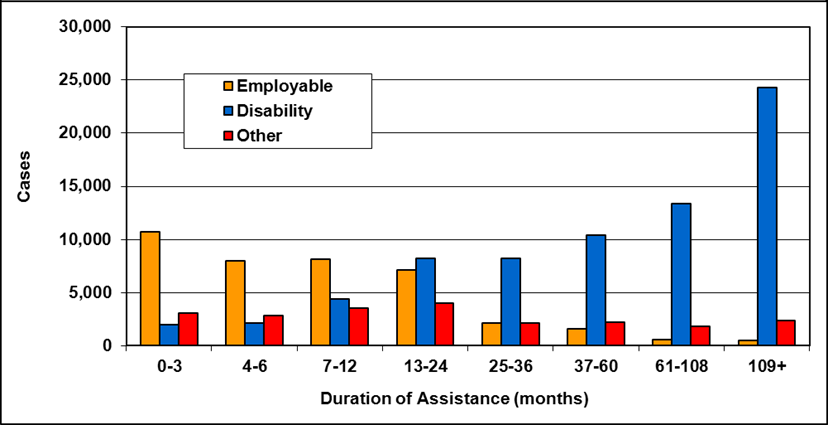
Text description of Table 12-5b
| Duration of assistance a (months) | Employable b | Disability c | Other d | Total |
|---|---|---|---|---|
| 0-3 | 10,700 | 2,000 | 3,100 | 15,800 |
| 4-6 | 8,000 | 2,100 | 2,800 | 12,900 |
| 7-12 | 8,100 | 4,400 | 3,500 | 16,000 |
| 13-24 | 7,100 | 8,200 | 4,000 | 19,300 |
| 25-36 | 2,100 | 8,200 | 2,100 | 12,400 |
| 37-60 | 1,600 | 10,400 | 2,200 | 14,300 |
| 61-108 | 600 | 13,400 | 1,800 | 15,800 |
| 109+ | 500 | 24,300 | 2,400 | 27,200 |
| Total | 39,000 | 73,100 | 21,800 | 133,800 |
- Table note a. "Duration of assistance" measures length of current spell only.
- Table note b. "Employable" includes cases that are expected to work.
- Table note c. "Disability" includes cases with persons with disabilities.
- Table note d. "Other" includes cases with persistent multiple barriers, cases temporarily excused from working and persons who are expected to work with a temporary medical condition.
- Note: Totals may not add due to rounding.
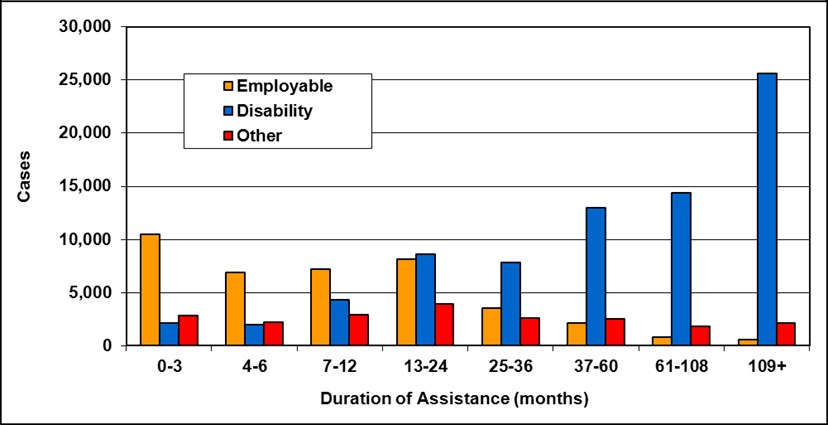
Text description of Table 12-5c
| Duration of assistance a (months) | Employable b | Disability c | Other d | Total |
|---|---|---|---|---|
| 0-3 | 10,500 | 2,100 | 2,800 | 15,400 |
| 4-6 | 6,900 | 2,000 | 2,200 | 11,100 |
| 7-12 | 7,200 | 4,300 | 2,900 | 14,500 |
| 13-24 | 8,100 | 8,600 | 3,900 | 20,700 |
| 25-36 | 3,500 | 7,800 | 2,600 | 13,900 |
| 37-60 | 2,100 | 13,000 | 2,500 | 17,600 |
| 61-108 | 800 | 14,400 | 1,800 | 17,000 |
| 109+ | 600 | 25,600 | 2,100 | 28,300 |
| Total | 39,600 | 77,900 | 20,800 | 138,300 |
- Table note a. "Duration of assistance" measures length of current spell only.
- Table note b. "Employable" includes cases that are expected to work.
- Table note c. "Disability" includes cases with persons with disabilities.
- Table note d. "Other" includes cases with persistent multiple barriers, cases temporarily excused from working and persons who are expected to work with a temporary medical condition.
- Note: Totals may not add due to rounding.
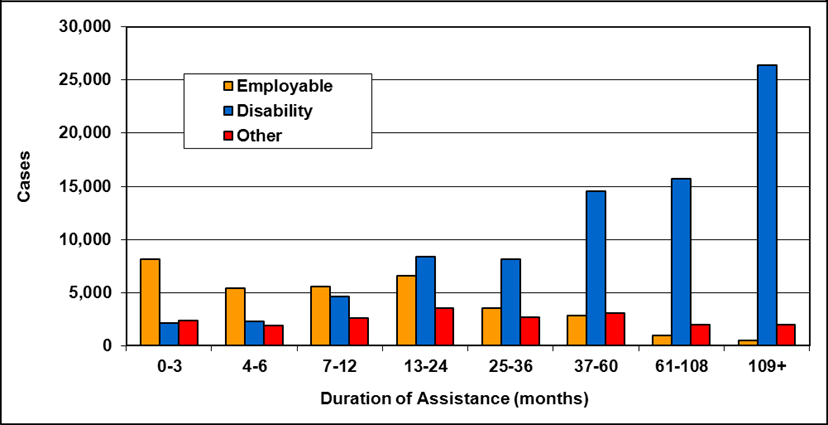
Text description of Table 12-5d
| Duration of assistance a (months) | Employable b | Disability c | Other d | Total |
|---|---|---|---|---|
| 0-3 | 8,100 | 2,100 | 2,400 | 12,700 |
| 4-6 | 5,400 | 2,300 | 1,900 | 9,600 |
| 7-12 | 5,600 | 4,600 | 2,600 | 12,800 |
| 13-24 | 6,600 | 8,400 | 3,500 | 18,600 |
| 25-36 | 3,500 | 8,100 | 2,700 | 14,300 |
| 37-60 | 2,800 | 14,500 | 3,100 | 20,400 |
| 61-108 | 1,000 | 15,700 | 2,000 | 18,800 |
| 109+ | 500 | 26,400 | 2,000 | 28,900 |
| Total | 33,500 | 82,300 | 20,200 | 136,100 |
- Table note a. "Duration of assistance" measures length of current spell only.
- Table note b. "Employable" includes cases that are expected to work.
- Table note c. "Disability" includes cases with persons with disabilities.
- Table note d. "Other" includes cases with persistent multiple barriers, cases temporarily excused from working and persons who are expected to work with a temporary medical condition.
- Note: Totals may not add due to rounding.
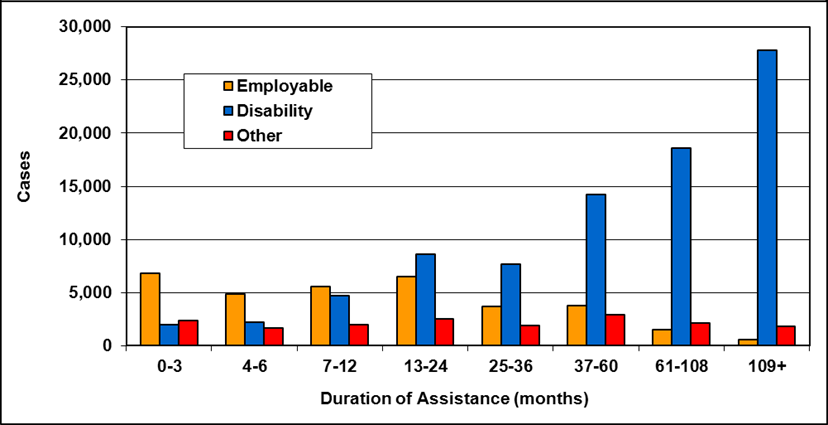
Text description of Table 12-5e
| Duration of assistance a (months) | Employable b | Disability c | Other d | Total |
|---|---|---|---|---|
| 0-3 | 6,800 | 2,000 | 2,400 | 11,200 |
| 4-6 | 4,900 | 2,200 | 1,700 | 8,800 |
| 7-12 | 5,600 | 4,700 | 2,000 | 12,200 |
| 13-24 | 6,500 | 8,600 | 2,500 | 17,500 |
| 25-36 | 3,700 | 7,700 | 1,900 | 13,300 |
| 37-60 | 3,800 | 14,200 | 2,900 | 20,900 |
| 61-108 | 1,500 | 18,600 | 2,100 | 22,100 |
| 109+ | 600 | 27,800 | 1,800 | 30,100 |
| Total | 33,300 | 85,800 | 17,100 | 136,200 |
- Table note a. "Duration of assistance" measures length of current spell only.
- Table note b. "Employable" includes cases that are expected to work.
- Table note c. "Disability" includes cases with persons with disabilities.
- Table note d. "Other" includes cases with persistent multiple barriers, cases temporarily excused from working and persons who are expected to work with a temporary medical condition.
- Note: Totals may not add due to rounding.
Chapter 13 - Yukon - Social Assistance
In Yukon, the territorial social assistance program is known as Social Assistance (SA). The Social Assistance Act and the Social Assistance Regulation governs Yukon's Social Assistance program.
The Social Assistance program provides basic benefits and supplementary benefits to both eligible adults and children.
Service delivery
The Department of Health and Social Services is responsible for the delivery of the Social Assistance program to adults and children within the territory.
Eligibility
General
In order to be eligible for the Social Assistance program, applicants must meet the general eligibility requirements outlined in the "Social Assistance Overview" in this report.
Liquid assets
At the time of application, applicants' liquid assets may not exceed the following allowable limits:
| Clients without disabilities | Clients with disabilities | |
|---|---|---|
| Single | $500 | $1,500 |
| Family | $1,000 (for a family unit of 2) plus $300 for each additional dependant. | $2,500 (2 or more persons) |
Earnings exemptions
Once an application for assistance has been approved, Social Assistance clients are eligible for the following monthly exemptions on earned income:
| Clients without disabilities | Clients with disabilities | |
|---|---|---|
| Single | 50% of the monthly income from employment or self-employment earned by members of the household, up to a maximum of 36 months, when the percentage drops to 25%. | 50% of the montly income from employment or self-employment earned by members of the household, up to a maximum of 36 months, when the percentage drops to 25%; and up to $3,900 per year for a household of one of more persons. |
| Family | 50% of the monthly income from employment or self-employment earned by members of the household, up to a maximum of 36 months, when the percentage drops to 25%. | 50% of the montly income from employment or self-employment earned by members of the household, up to a maximum of 36 months, when the percentage drops to 25%; and up to $3,900 per year for a household of one of more persons. |
Benefits
Basic assistance consists of a standard benefit allowance and a shelter allowance. The standard benefit allowance covers the cost of food, clothing, and personal and household items. The maximum standard benefit rates are based on the household's size, its composition, and its geographical location.Footnote 26 Maximum shelter allowance rates are based on the number of persons in the household (including children).
More information
For more information, please consult Yukon's Department of Health and Social Services website.
Statistics
Recipients and cases
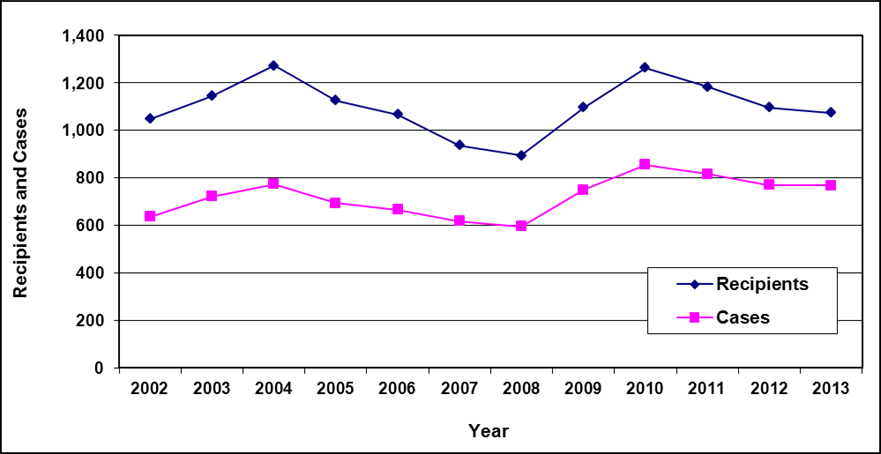
Text description of Table 13-1
| Year | Recipients | Cases |
|---|---|---|
| 2002 | 1,048 | 637 |
| 2003 | 1,144 | 722 |
| 2004 | 1,272 | 773 |
| 2005 | 1,126 | 694 |
| 2006 | 1,067 | 667 |
| 2007 | 936 | 618 |
| 2008 | 895 | 595 |
| 2009 | 1,096 | 750 |
| 2010 | 1,264 | 855 |
| 2011 | 1,184 | 816 |
| 2012 | 1,097 | 770 |
| 2013 | 1,074 | 768 |
Cases by reason for assistance
| Reason for assistance | 2009 | 2010 | 2011 | 2012 | 2013 | |||||
|---|---|---|---|---|---|---|---|---|---|---|
| # | % | # | % | # | % | # | % | # | % | |
| Employable | 411 | 55% | 458 | 54% | 394 | 48% | 389 | 51% | 396 | 52% |
| Physical illness/disability | 116 | 15% | 127 | 15% | 123 | 15% | 111 | 14% | 102 | 13% |
| Mental illness | 39 | 5% | 49 | 6% | 46 | 6% | 45 | 6% | 43 | 6% |
| Developmental disability | 29 | 4% | 34 | 4% | 42 | 5% | 41 | 5% | 33 | 4% |
| Over 60 | 92 | 12% | 107 | 13% | 95 | 12% | 97 | 13% | 100 | 13% |
| Children a | 32 | 4% | 38 | 4% | 61 | 7% | 44 | 6% | 39 | 5% |
| Unsuitable for employment | 31 | 4% | 42 | 5% | 55 | 7% | 43 | 6% | 55 | 7% |
| Total | 750 | 100% | 855 | 100% | 816 | 100% | 770 | 100% | 768 | 100% |
- Table note a. Children: applicants receiving SA (exempt from seeking employment) for reasons of taking care of one or more of his or her own children under the age of 6 years, or children of any age with a severe disability.
Recipients by family type
| Family type | 2009 | 2010 | 2011 | 2012 | 2013 | |||||
|---|---|---|---|---|---|---|---|---|---|---|
| # | % | # | % | # | % | # | % | # | % | |
| Adults - Single | 567 | 52% | 636 | 50% | 611 | 52% | 601 | 55% | 606 | 56% |
| Adults - Couple, no dependants | 50 | 5% | 78 | 6% | 60 | 5% | 54 | 5% | 48 | 4% |
| Adults - Single parent | 126 | 11% | 137 | 11% | 142 | 12% | 115 | 10% | 111 | 10% |
| Adults - Couple with dependants | 66 | 6% | 86 | 7% | 66 | 6% | 54 | 5% | 54 | 5% |
| Total adults | 809 | 74% | 937 | 74% | 879 | 74% | 824 | 75% | 819 | 76% |
| Children - Single parent | 226 | 21% | 236 | 19% | 239 | 20% | 202 | 18% | 196 | 18% |
| Children - Couple with dependants | 61 | 6% | 91 | 7% | 66 | 6% | 71 | 6% | 59 | 5% |
| Total children | 287 | 26% | 327 | 26% | 305 | 26% | 273 | 25% | 255 | 24% |
| Total recipients | 1,096 | 100% | 1,264 | 100% | 1,184 | 100% | 1,097 | 100% | 1,074 | 100% |
Cases by age of head
| Age of head | 2009 | 2010 | 2011 | 2012 | 2013 |
|---|---|---|---|---|---|
| 15-19 | 25 | 25 | 26 | 25 | 14 |
| 20-29 | 154 | 177 | 161 | 165 | 137 |
| 30-39 | 125 | 138 | 152 | 124 | 143 |
| 40-49 | 160 | 193 | 177 | 153 | 149 |
| 50-59 | 194 | 215 | 205 | 208 | 225 |
| 60-64 | 76 | 86 | 79 | 75 | 82 |
| 65+ | 16 | 21 | 16 | 20 | 18 |
| Total | 750 | 855 | 816 | 770 | 768 |
Cases by education of head
| Education of head | 2009 | 2010 | 2011 | 2012 | 2013 | |||||
|---|---|---|---|---|---|---|---|---|---|---|
| # | % | # | % | # | % | # | % | # | % | |
| < Grade 6 | 24 | 3% | 23 | 3% | 23 | 3% | 24 | 3% | 24 | 3% |
| Grade 7-9 | 108 | 14% | 118 | 14% | 107 | 13% | 106 | 14% | 97 | 13% |
| Grade 10-11 | 261 | 35% | 291 | 34% | 288 | 35% | 267 | 35% | 239 | 31% |
| Grade 12 | 218 | 29% | 249 | 29% | 248 | 30% | 237 | 31% | 265 | 35% |
| Other a | 122 | 16% | 147 | 17% | 131 | 16% | 119 | 15% | 129 | 17% |
| Unknown | 17 | 2% | 27 | 3% | 19 | 2% | 17 | 2% | 14 | 2% |
| Total | 750 | 100% | 855 | 100% | 816 | 100% | 770 | 100% | 768 | 100% |
- Table note a. Other: Includes Special Education, Partial Apprentice, Journeyman Certificate, Partial Tech Certificate/Partial College Diploma, Tech Certificate/College Diploma, Partial University, University/Professional Graduate.
Cases reporting income by source of income
| Source of income | 2009 | 2010 | 2011 | 2012 | 2013 | |||||
|---|---|---|---|---|---|---|---|---|---|---|
| # | % | # | % | # | % | # | % | # | % | |
| Employment | 104 | 39% | 133 | 41% | 128 | 43% | 99 | 37% | 96 | 39% |
| Government transfers | 116 | 44% | 144 | 44% | 139 | 46% | 132 | 50% | 125 | 50% |
| Support payments | 28 | 11% | 29 | 9% | 25 | 8% | 23 | 9% | 14 | 6% |
| Employment Insurance | 9 | 3% | 9 | 3% | 4 | 1% | 4 | 2% | 8 | 3% |
| Other a | 8 | 3% | 12 | 4% | 4 | 1% | 7 | 3% | 5 | 2% |
| Total b (includes double-counting) |
265 | 100% | 327 | 100% | 300 | 100% | 265 | 100% | 248 | 100% |
- Table note a. Other includes: training allowances (non-government), pensions (other than universal government pensions), rental income, and other sources of income not mentioned above.
- Table note b. Total cases in these categories may include double-counting, since cases that have more than one source of income are counted for each source reported. Percentages were calculated based on totals for sources of income.
| Year | 2009 | 2010 | 2011 | 2012 | 2013 |
|---|---|---|---|---|---|
| Reporting income | 265 | 327 | 300 | 265 | 248 |
| No income | 485 | 528 | 516 | 505 | 520 |
| Total | 750 | 855 | 816 | 770 | 768 |
Chapter 14 - Northwest Territories - Income Assistance
In the Northwest Territories (NWT), the territorial social assistance program is known as Income Assistance (IA). The Social Assistance Act and the Income Assistance RegulationsFootnote 27 govern the Northwest Territories' IA program.
The IA program provides basic and enhanced benefits to single adults, families, persons with disabilities and seniors.
Service delivery
The Department of Education, Culture, and Employment (ECE) is responsible for the delivery of the IA program in the NWT.
Eligibility
General
In order to be eligible for the IA program, applicants must meet the general eligibility requirements outlined in the "Social Assistance Overview" in this report.
Liquid assets
At the time of application, applicants' current assets may not exceed the following allowable limits:
| Clients with or without disabilities | |
|---|---|
| Single | $300 |
| Families | $300 plus a further $100 for each dependent adult and a further $80 for each dependent child, if the applicant has dependants. |
| Disabled and Seniors | The value of assets up to a maximum of $50,000. |
Earnings exemptions
IA applicants are eligible for the following monthly exemptions on earned income:
| Clients with or without disabilities | |
|---|---|
| Single | $200 plus 15% of any earned income in excess. |
| Family | $400 plus 15% of any earned income in excess. |
Unearned income exemptions
Unearned income in a recipient's household is exempt, up to a maximum amount of $1,200 in a 12-month period. The exemption can be taken as a lump sum amount, or be split into smaller amounts that do not exceed $1,200 for the 12, continuous month period.
Benefits
Basic assistance consists of allowances for food, room and board or accommodations, utilities and fuel. The basic allowance rates are based on the family's size and its geographical location. Room and board or accommodation allowance rates are based on an applicant's eligibility, family size and what is available in the community. The actual amount of fuel and utilities is included in the financial calculation.
Enhanced benefits are available for persons with disabilities, seniors and applicants who participate in a Productive Choice, such as employment or volunteering. Enhanced benefits include allowances for disabilities, seniors, incidentals, expenses for primary, secondary, and post-secondary education and other training, clothing, furnishings, security deposits, emergencies and day care.
More information
For more information, please consult the Northwest Territories Department of Education, Culture, and Employment website.
StatisticsFootnote 28
Recipients and cases
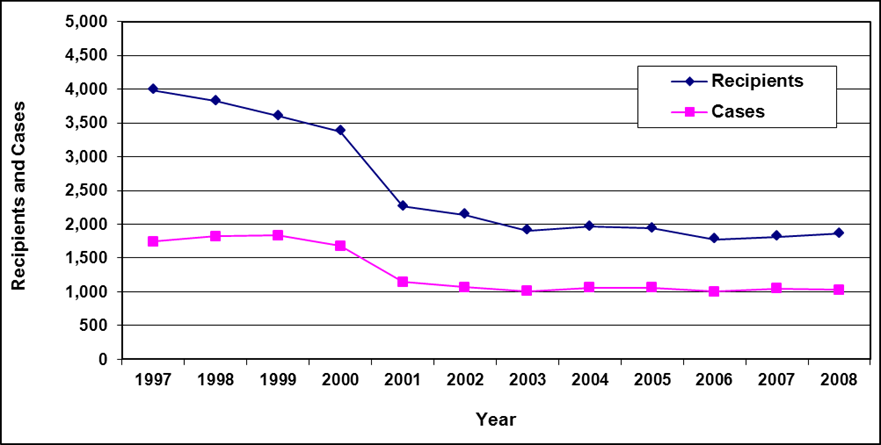
Text description of Table 14-1
| Year | Recipients | Cases |
|---|---|---|
| 1997 | 3,985 | 1,743 |
| 1998 | 3,820 | 1,820 |
| 1999 | 3,604 | 1,837 |
| 2000 | 3,376 | 1,675 |
| 2001 | 2,266 | 1,148 |
| 2002 | 2,140 | 1,064 |
| 2003 | 1,904 | 1,008 |
| 2004 | 1,965 | 1,062 |
| 2005 | 1,937 | 1,058 |
| 2006 | 1,773 | 1,001 |
| 2007 | 1,817 | 1,046 |
| 2008 | 1,859 | 1,027 |
Cases by reason for assistance
| Reason for assistance | # | % |
|---|---|---|
| Employment | 178 | 17% |
| Disability | 359 | 35% |
| Other | 490 | 48% |
| Total | 1,027 | 100% |
Recipients by family type
| Family type | # | % |
|---|---|---|
| Adults - Single | 658 | 35% |
| Adults - Couple, no dependants | 106 | 6% |
| Adults - Single parent | 241 | 13% |
| Adults - Couple with dependants | 186 | 10% |
| Total adults | 1,191 | 64% |
| Children - Single parent | 464 | 25% |
| Children - Couple with dependants | 204 | 11% |
| Total children | 668 | 36% |
| Total recipients | 1,859 | 100% |
Cases by age of head
| Age of head | # |
|---|---|
| <20 | 33 |
| 20-24 | 182 |
| 25-29 | 128 |
| 30-34 | 94 |
| 35-39 | 112 |
| 40-44 | 105 |
| 45-49 | 86 |
| 50-54 | 89 |
| 55-59 | 93 |
| 60-64 | 91 |
| 65+ | 14 |
| Total | 1,027 |
Cases by reason for assistance and duration of assistance
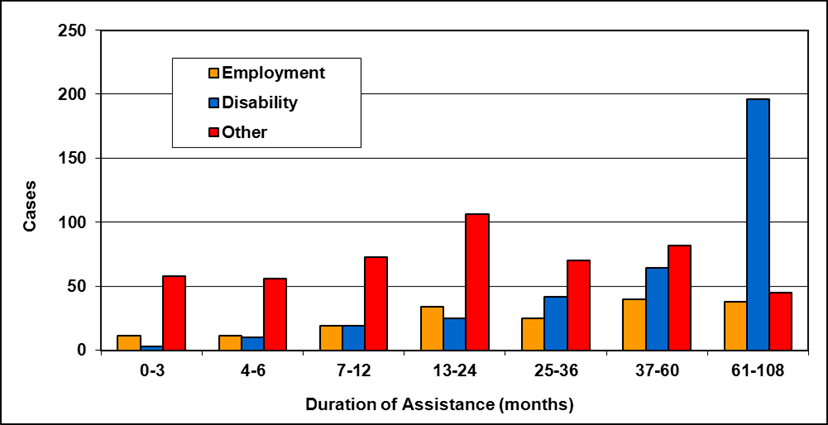
Text description of Table 14-5
| Duration of assistance a (months) | Employment | Disability | Other | Total |
|---|---|---|---|---|
| 0-3 | 11 | 3 | 58 | 72 |
| 4-6 | 11 | 10 | 56 | 77 |
| 7-12 | 19 | 19 | 73 | 111 |
| 13-24 | 34 | 25 | 106 | 165 |
| 25-36 | 25 | 42 | 70 | 137 |
| 37-60 | 40 | 64 | 82 | 186 |
| 61-108 | 38 | 196 | 45 | 279 |
| Total | 178 | 359 | 490 | 1,027 |
- Table note a. "Duration of assistance" measures length as of March 2008.
Cases reporting income by source of income
| Source of income | # | % |
|---|---|---|
| Employment | 182 | 25% |
| Government transfers | 440 | 61% |
| Support payments | 18 | 3% |
| Employment Insurance | 8 | 1% |
| Other a | 71 | 10% |
| Total b (includes double-counting) |
719 | 100% |
- Table note a. Other includes: training allowances.
- Table note b. Total cases in these categories may include double-counting, since cases that have more than one source of income are counted for each source reported. Percentage were calculated based on 719 observations.
Northwest Territories - Income Assistance, Table 14-7: Number of cases reporting income as of March 31, 2008
- Reporting Income: 532
- No Income: 495
- Total: 1,027
Chapter 15 - Nunavut - Income Assistance
In Nunavut, the territorial social assistance program is part of the Income Assistance Division of the Department of Family Services, Government of Nunavut. The Social Assistance Act and Regulations govern Nunavut's Social Assistance program.
The Social Assistance program provides basic and extended benefits to eligible heads of households and their dependants.
Service delivery
The Department of Family Services is responsible for the delivery of the Income Assistance programs within the territory. Programs included in the Income Assistance Division include Social Assistance, Day Care Subsidy Program, the Senior Fuel Subsidy Program, and the Senior Citizen Supplementary Benefit Program.
Eligibility
General
In order to be eligible for the Social Assistance program, applicants must meet the general eligibility requirements outlined in the "Social Assistance Overview" in this report.
Liquid assets
At the time of application, applicants' assets may not exceed the following allowable limits:
Nunavut - Liquid asset exemptions, March 2013
- Under 60: nil
- 60 and over: $5,000
- Client with a disability: $5,000
Earnings exemptions
Once an application for assistance has been approved, Social Assistance clients are eligible for the following monthly exemptions on earned income:
| Clients without disabilities | Clients with disabilities | |
|---|---|---|
| Single | $200 | $200 |
| Family | $400 | $400 |
Benefits
Social Assistance consists of basic benefits and extended benefits. The basic benefits cover the cost of food, shelter, and utilities. The food allowance component of basic benefits may be used to purchase personal and/or household items. The food allowance rates are based on family size and geographic location. Maximum shelter allowance rates are based on an applicant's eligibility, family size and what is available in the community. Established approval levels are required for rents that are in excess of $2,500. The actual cost of fuel and utilities is paid.
An extended benefit is also available for persons with long term disabilities, seniors and applicants who participate in a program, such as employment, education/training or volunteering. The extended benefit provides allowances for clothing, furnishings, security deposits, emergencies and day care.
More information
For more information, please consult Nunavut's Department of Family Services website.
Statistics
Recipients and cases
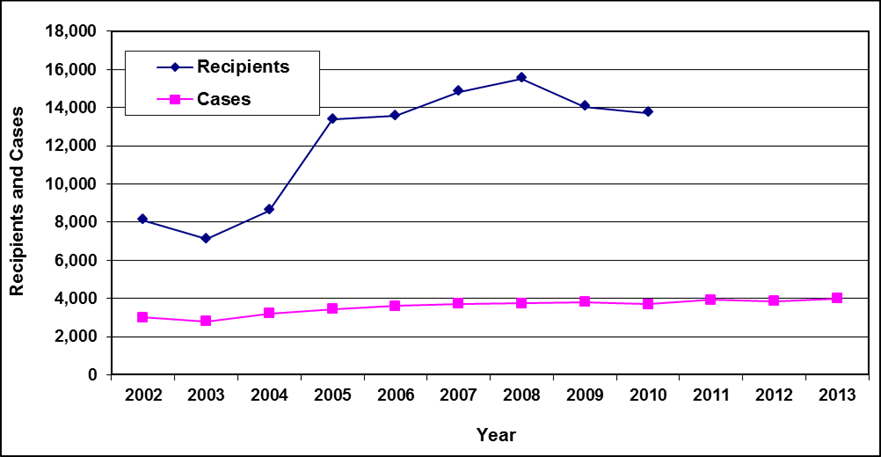
Text description of Table 15-1
| Year | Recipients | Cases |
|---|---|---|
| 2002 | 8,100 | 3,000 |
| 2003 | 7,100 | 2,800 |
| 2004 | 8,600 | 3,200 |
| 2005 | 13,380 | 3,440 |
| 2006 | 13,562 | 3,594 |
| 2007 | 14,820 | 3,725 |
| 2008 | 15,523 | 3,740 |
| 2009 | 14,037 | 3,806 |
| 2010 | 13,716 | 3,684 |
| 2011 | - | 3,930 |
| 2012 | - | 3,847 |
| 2013 | - | 3,998 |
- Table note a. Nunavut is still operating without an electronic case management information system, and therefore unable to provide detailed profile data.
- Table note b. Number of recipients from 2001 to 2004, represents the number of recipients as of March 31.
- Table note c. Number of recipients from 2005, represents the total number of recipients estimated during the year.