
Archived: Air Pollutant Emission Inventory report: chapter 2.10
2.10 Dioxins and furans (D/F)
In 2016, emissions of dioxins and furans (D/F) in Canada were approximately 57 grams of toxicity equivalent (gTEQ) (Table 2–12). Incineration and waste sources accounted for the largest share of these emissions (41% or 23 gTEQ), with the waste incineration sector accounting for 36% (20 gTEQ). Transportation and mobile equipment contributed 19% (11 gTEQ) of 2016 D/F emissions, most of which are attributed to marine transportation, with 17% (9.4 gTEQ). Commercial/residential/institutional sources were also significant contributors (14% and 8.0 gTEQ). Ore and mineral industries collectively accounted for 10% (5.7 gTEQ) of 2016 D/F emissions.
Between 1990 and 2016, D/F emissions decreased by 88% (399 gTEQ) (Figure 2–10). This decrease is due to large reductions in emissions from waste incineration.
The most significant changes in D/F emissions from 1990 to 2016 include:
- incineration and waste source emissions: decrease of 93% (323 gTEQ)
- waste Incineration: decrease of 94% (325 gTEQ)
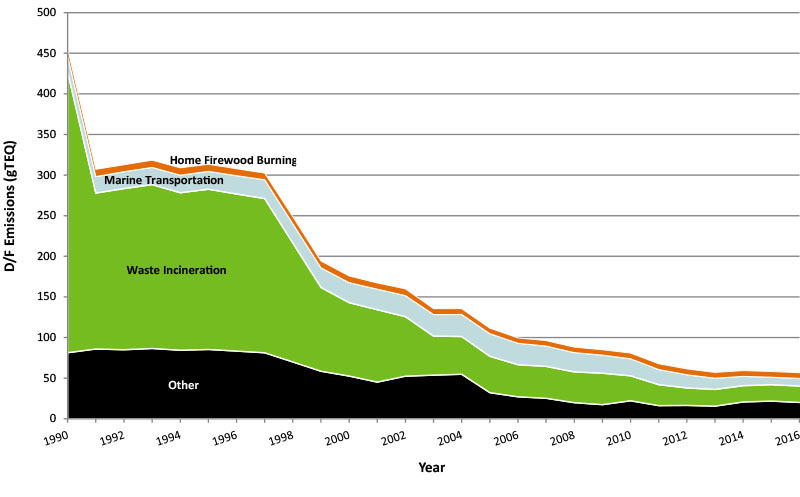
Long description for figure 2-10
Figure 2-10 displays the four major sections that contribute to national D/F trends. The following table displays the contributions (gTEQ) for the years 1990 to 2016.
| Sector | 1990 | 1991 | 1992 | 1993 | 1994 | 1995 | 1996 | 1997 | 1998 | 1999 | 2000 | 2001 | 2002 | 2003 | 2004 | 2005 | 2006 | 2007 | 2008 | 2009 | 2010 | 2011 | 2012 | 2013 | 2014 | 2015 | 2016 |
|---|---|---|---|---|---|---|---|---|---|---|---|---|---|---|---|---|---|---|---|---|---|---|---|---|---|---|---|
| Sector 1 - Marine Transportation | 19.92893 | 20.34965 | 20.77037 | 21.19109 | 21.61181 | 22.03253 | 22.56225 | 23.09197 | 23.62168 | 24.1514 | 24.68112 | 25.31053 | 25.93994 | 26.56936 | 27.19877 | 27.82818 | 26.4027 | 25.05006 | 23.69742 | 22.34477 | 21.01568 | 18.62756 | 16.23944 | 13.85132 | 11.46321 | 9.243749 | 9.404804 |
| Sector 2 - Home Firewood Burning | 9.023886 | 8.897163 | 8.509245 | 8.905838 | 9.070221 | 8.658124 | 8.556794 | 8.209101 | 8.76221 | 8.390228 | 8.159913 | 7.599864 | 8.304593 | 7.207874 | 7.076408 | 6.740066 | 6.587908 | 6.627402 | 6.741962 | 6.535402 | 6.986226 | 7.073917 | 7.157995 | 7.113062 | 7.064833 | 7.018293 | 7.043379 |
| Sector 3 - Waste Incineration | 345.35 | 192.0361 | 198.452 | 201.7721 | 193.9136 | 197.2938 | 193.4091 | 189.95 | 146.52 | 103.2 | 90.3553 | 89.1573 | 73.2919 | 48.072 | 46.445 | 44.80765 | 39.52857 | 39.27022 | 37.9308 | 38.70948 | 30.72349 | 25.80146 | 21.56053 | 20.58001 | 20.06229 | 20.19209 | 20.22014 |
| Sector 4 - Other | 81.34626 | 85.87344 | 84.99151 | 86.53348 | 84.39396 | 85.32431 | 83.33097 | 81.23049 | 69.95602 | 58.51878 | 52.59426 | 45.1376 | 52.42316 | 53.71992 | 54.8078 | 32.16305 | 27.03066 | 25.23676 | 19.82163 | 17.37205 | 22.16497 | 16.19557 | 16.42544 | 15.55273 | 20.69143 | 21.75784 | 19.99668 |
| Source | Sector | 1990 | 2000 | 2005 | 2011 | 2012 | 2013 | 2014 | 2015 | 2016 |
|---|---|---|---|---|---|---|---|---|---|---|
| Ore and Mineral Industries | nil | 45 | 27 | 8.4 | 3.6 | 4.1 | 3.8 | 6.7 | 7.3 | 5.7 |
| Ore and Mineral Industries | Aluminium Industry | 2.8 | 4.1 | no emissions (-) | 0.4 | - | - | - | - | - |
| Ore and Mineral Industries | Asphalt Paving Industry | 0.019 | 0.021 | 0.013 | 0.0062 | 0.0048 | 0.0047 | 0.0048 | 0.0051 | 0.0051 |
| Ore and Mineral Industries | Cement and Concrete Industry | 3 | 1.8 | 2.7 | 0.4 | 0.65 | 0.54 | 1.9 | 1.6 | 0.61 |
| Ore and Mineral Industries | Foundries | - | - | - | 0.01 | 0.01 | 0.0001 | 0.043 | 0.034 | 0.036 |
| Ore and Mineral Industries | Iron and Steel Industries | 35 | 16 | 3 | 2.3 | 2.9 | 2.9 | 4.4 | 5.2 | 4.7 |
| Ore and Mineral Industries | Iron Ore Industry | - | - | - | - | - | - | 0.0007 | 0.0007 | 0.0003 |
| Ore and Mineral Industries | Mineral Products Industry | 0.81 | 1.2 | 0.81 | - | - | - | - | - | - |
| Ore and Mineral Industries | Mining and Rock Quarrying | - | 0.14 | 0.58 | 0.056 | 0.044 | 0.032 | 0.046 | 0.058 | 0.026 |
| Ore and Mineral Industries | Non-Ferrous Mining and Smelting Industry | 3.4 | 3.5 | 1.3 | 0.47 | 0.48 | 0.37 | 0.28 | 0.41 | 0.41 |
| Oil and Gas Industry | nil | - | - | - | - | - | - | - | - | - |
| Oil and Gas Industry | Downstream Oil and Gas Industry | - | - | - | - | - | - | - | - | - |
| Oil and Gas Industry | Upstream Oil and Gas Industry | - | - | - | - | - | - | - | - | - |
| Electric Power Generation (Utilities) | nil | 3 | 5.2 | 3.4 | 1.7 | 1.6 | 1.7 | 2.1 | 1.9 | 2.9 |
| Electric Power Generation (Utilities) | Coal | 2.3 | 4 | 2 | 1.4 | 1.5 | 1.5 | 1.8 | 1.6 | 1.9 |
| Electric Power Generation (Utilities) | Diesel | - | - | - | - | - | - | - | - | - |
| Electric Power Generation (Utilities) | Natural Gas | 0.46 | 0.8 | 1 | 0.0054 | 0.015 | 0.02 | 0.043 | 0.01 | 0.011 |
| Electric Power Generation (Utilities) | Waste Materials | 0.0021 | 0.0023 | <0.0001 | 0.016 | 0.01 | 0.0035 | 0.0099 | 0.018 | 0.16 |
| Electric Power Generation (Utilities) | Other Electric Power Generation | 0.23 | 0.42 | 0.43 | 0.24 | 0.13 | 0.17 | 0.19 | 0.19 | 0.75 |
| Manufacturing | nil | 20 | 13 | 10 | 4 | 3.3 | 3.7 | 3.1 | 3 | 4.1 |
| Manufacturing | Abrasives Manufacture | - | - | - | - | - | - | - | - | - |
| Manufacturing | Bakeries | - | - | - | - | - | - | - | - | - |
| Manufacturing | Biofuel Production | - | - | - | - | - | - | - | - | - |
| Manufacturing | Chemicals Industry | 2.2 | 0.097 | 0.058 | 0.35 | 0.27 | 0.13 | 0.27 | 0.26 | 0.31 |
| Manufacturing | Electronics | - | - | - | - | - | - | - | - | - |
| Manufacturing | Food Preparation | - | - | - | - | - | - | - | - | - |
| Manufacturing | Glass Manufacture | - | - | - | - | - | - | - | - | - |
| Manufacturing | Grain Industries | - | - | - | - | - | - | - | - | - |
| Manufacturing | Metal Fabrication | 4.1 | 4.3 | 4 | 1.3 | 1.4 | 1.1 | 0.91 | 0.87 | 0.93 |
| Manufacturing | Plastics Manufacture | - | - | - | - | - | - | - | - | - |
| Manufacturing | Pulp and Paper Industry | 11 | 5.2 | 4.9 | 1.2 | 1 | 1.8 | 1.2 | 1.2 | 2.2 |
| Manufacturing | Textiles | - | - | - | - | - | - | - | - | - |
| Manufacturing | Vehicle Manufacture (Engines, Parts, Assembly, Painting) | 0.3 | 1.3 | - | 0.082 | - | - | - | - | - |
| Manufacturing | Wood Products | 1.8 | 1.8 | 1.3 | 1.1 | 0.6 | 0.62 | 0.65 | 0.65 | 0.65 |
| Manufacturing | Other Manufacturing Industries | - | - | 0.12 | - | - | - | - | - | - |
| Transportation and Mobile Equipment | nil | 21 | 26 | 29 | 20 | 18 | 15 | 13 | 11 | 11 |
| Transportation and Mobile Equipment | Air Transportation | - | - | - | - | - | - | - | - | - |
| Transportation and Mobile Equipment | Heavy-duty Diesel Vehicles | <0.0001 | <0.0001 | <0.0001 | <0.0001 | <0.0001 | <0.0001 | <0.0001 | <0.0001 | <0.0001 |
| Transportation and Mobile Equipment | Heavy-duty Gasoline Vehicles | <0.0001 | <0.0001 | <0.0001 | <0.0001 | <0.0001 | <0.0001 | <0.0001 | <0.0001 | <0.0001 |
| Transportation and Mobile Equipment | Heavy-duty LPG/NG Vehicles | <0.0001 | <0.0001 | <0.0001 | <0.0001 | <0.0001 | <0.0001 | <0.0001 | <0.0001 | <0.0001 |
| Transportation and Mobile Equipment | Light-duty Diesel Trucks | <0.0001 | <0.0001 | <0.0001 | <0.0001 | <0.0001 | <0.0001 | <0.0001 | <0.0001 | <0.0001 |
| Transportation and Mobile Equipment | Light-duty Diesel Vehicles | <0.0001 | <0.0001 | <0.0001 | <0.0001 | <0.0001 | <0.0001 | <0.0001 | <0.0001 | <0.0001 |
| Transportation and Mobile Equipment | Light-duty Gasoline Trucks | <0.0001 | <0.0001 | <0.0001 | <0.0001 | <0.0001 | <0.0001 | <0.0001 | <0.0001 | <0.0001 |
| Transportation and Mobile Equipment | Light-duty Gasoline Vehicles | <0.0001 | <0.0001 | <0.0001 | <0.0001 | <0.0001 | <0.0001 | <0.0001 | <0.0001 | <0.0001 |
| Transportation and Mobile Equipment | Light-duty LPG/NG Trucks | <0.0001 | <0.0001 | <0.0001 | <0.0001 | <0.0001 | <0.0001 | <0.0001 | <0.0001 | <0.0001 |
| Transportation and Mobile Equipment | Light-duty LPG/NG Vehicles | <0.0001 | <0.0001 | <0.0001 | <0.0001 | <0.0001 | <0.0001 | <0.0001 | <0.0001 | <0.0001 |
| Transportation and Mobile Equipment | Marine Transportation | 20 | 25 | 28 | 19 | 16 | 14 | 11 | 9.2 | 9.4 |
| Transportation and Mobile Equipment | Motorcycles | <0.0001 | <0.0001 | <0.0001 | <0.0001 | <0.0001 | <0.0001 | <0.0001 | <0.0001 | <0.0001 |
| Transportation and Mobile Equipment | Off-road Diesel Vehicles and Equipment | - | - | - | - | - | - | - | - | - |
| Transportation and Mobile Equipment | Off-road Gasoline/LPG/CNG Vehicles and Equipment | - | - | - | - | - | - | - | - | - |
| Transportation and Mobile Equipment | Rail Transportation | 1.2 | 1.2 | 1.2 | 1.4 | 1.4 | 1.3 | 1.4 | 1.3 | 1.2 |
| Transportation and Mobile Equipment | Tire Wear and Brake Lining | - | - | - | - | - | - | - | - | - |
| Agriculture | nil | 0.058 | 0.054 | 0.044 | 0.075 | 0.07 | 0.068 | 0.074 | 0.064 | 0.066 |
| Agriculture | Animal Production | - | - | - | - | - | - | - | - | - |
| Agriculture | Crop Production | - | - | - | - | - | - | - | - | - |
| Agriculture | Fuel Use | 0.058 | 0.054 | 0.044 | 0.075 | 0.07 | 0.068 | 0.074 | 0.064 | 0.066 |
| Commercial / Residential / Institutional | nil | 13 | 12 | 10 | 8.5 | 8.7 | 8.6 | 8.7 | 8.8 | 8 |
| Commercial / Residential / Institutional | Cigarette Smoking | 0.019 | 0.016 | 0.012 | 0.011 | 0.011 | 0.0095 | 0.0096 | 0.0085 | 0.0086 |
| Commercial / Residential / Institutional | Commercial and Institutional Fuel Combustion | 0.37 | 0.37 | 0.33 | 0.48 | 0.76 | 0.74 | 1 | 1.3 | 0.5 |
| Commercial / Residential / Institutional | Commercial Cooking | - | - | - | - | - | - | - | - | - |
| Commercial / Residential / Institutional | Construction Fuel Combustion | 0.068 | 0.029 | 0.046 | 0.052 | 0.055 | 0.044 | 0.043 | 0.044 | 0.04 |
| Commercial / Residential / Institutional | Home Firewood Burning | 9 | 8.2 | 6.7 | 7.1 | 7.2 | 7.1 | 7.1 | 7 | 7 |
| Commercial / Residential / Institutional | Human | - | - | - | - | - | - | - | - | - |
| Commercial / Residential / Institutional | Marine Cargo Handling | - | - | - | - | - | - | - | - | - |
| Commercial / Residential / Institutional | Residential Fuel Combustion | 1.5 | 1.2 | 1.1 | 0.84 | 0.72 | 0.64 | 0.58 | 0.44 | 0.38 |
| Commercial / Residential / Institutional | Service Stations | - | - | - | - | - | - | - | - | - |
| Commercial / Residential / Institutional | Other Miscellaneous Sources | 2 | 2 | 2 | - | - | - | - | - | - |
| Incineration and Waste | nil | 350 | 92 | 49 | 28 | 24 | 23 | 23 | 24 | 23 |
| Incineration and Waste | Crematoriums | 1.1 | 1.6 | 2 | 2.6 | 2.7 | 2.8 | 2.9 | 3.1 | 3.1 |
| Incineration and Waste | Waste Incineration | 350 | 90 | 45 | 26 | 22 | 21 | 20 | 20 | 20 |
| Incineration and Waste | Waste Treatment and Disposal | 0.013 | 0.014 | 2.2 | 0.021 | 0.12 | 0.013 | 0.023 | 1 | 0.16 |
| Paints and Solvents | nil | - | - | - | - | - | - | - | - | - |
| Paints and Solvents | Dry Cleaning | - | - | - | - | - | - | - | - | - |
| Paints and Solvents | General Solvent Use | - | - | - | - | - | - | - | - | - |
| Paints and Solvents | Printing | - | - | - | - | - | - | - | - | - |
| Paints and Solvents | Surface Coatings | - | - | - | - | - | - | - | - | - |
| Dust | nil | - | - | - | - | - | - | - | - | - |
| Dust | Coal Transportation | - | - | - | - | - | - | - | - | - |
| Dust | Construction Operations | - | - | - | - | - | - | - | - | - |
| Dust | Mine Tailings | - | - | - | - | - | - | - | - | - |
| Dust | Paved Roads | - | - | - | - | - | - | - | - | - |
| Dust | Unpaved Roads | - | - | - | - | - | - | - | - | - |
| Fires | nil | 7.6 | 1.5 | 0.92 | 1.4 | 1.6 | 0.68 | 2.8 | 2.2 | 1.8 |
| Fires | Prescribed Forest Burning | - | - | - | - | - | - | - | - | - |
| Fires | Structural Fires | 7.6 | 1.5 | 0.92 | 1.4 | 1.6 | 0.68 | 2.8 | 2.2 | 1.8 |
| Grand Total | nil | 460 | 180 | 110 | 68 | 61 | 57 | 59 | 58 | 57 |
Notes:
totals may not add up due to rounding
- denotes no emissions