
Archived: Air Pollutant Emission Inventory report: chapter 2.9
2.9 Mercury (Hg)
Approximately 4.3 t of Hg were emitted in Canada in 2016 (Table 2–11). Ore and mineral industries accounted for 33% (1.4 t) of Hg in 2016, with iron and steel industries contributing 17% (0.71 t) of the annual total. Incineration and waste sources also accounted for 31% (1.3 t) of Hg in 2016, with the waste sector being the largest contributor at 13% (0.57 t). Electric power generation (utilities) sources accounted for 17% (0.71 t) of 2016 emissions, most of which were emitted from coal-powered electric generation (16% of annual total, 0.68 t).
Between 1990 and 2016, Hg emissions decreased by 88% (31 t) (Figure 2–9). This decrease in emissions is mainly due to a large drop in emissions from the non-ferrous smelting and mining industry. Reductions in this sector coincide with facilities changing from pyrometallurgical to hydrometallurgical zinc production. As with lead and cadmium emissions, reductions in mercury emissions from this sector coincide with the closure of outdated smelters and the publication of a Notice requiring the preparation and implementation of pollution prevention plans and, to a smaller extent, to increased emission control measures, such as separation or changing of production materials, improved particulate matter emission controls and fuel switching (ECCC 2017). Reductions from electric power generation (utilities) are largely due to the closure of coal-fired electricity generation facilities and from the addition of mercury controls to plants. The Canadian Council of Ministers of the Environment (CCME) also developed several Canada-wide standards aimed at reducing the amount of Hg released into waste streams and to the environment , including standards for mercury-containing lamps, dental amalgam waste, as well as mercury emissions from coal-fired electric power generation plants.
The most significant changes in Hg emissions from 1990 to 2016 include:
- ore and mineral industry source emissions: decrease of 95% (25 kt)
- non-ferrous smelting and mining industry: decrease of 99% (25 kt)
- incineration and waste source emissions: decrease of 64% (2.3 t)
- waste treatment and disposal: decrease of 76% (1.5 t)
- electric power generation source emissions: decrease of 69% (1.6 t)
- coal (electric power generation): decrease of 65% (1.3 t)
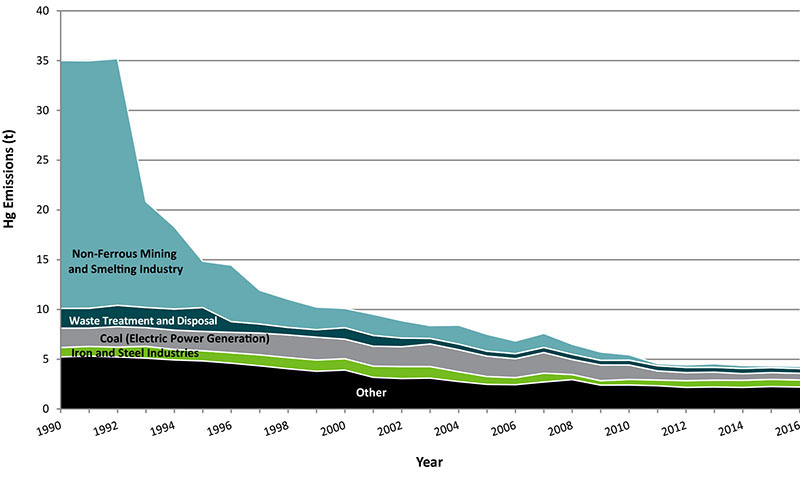
Long description for figure 2-9
Figure 2-9 displays the five major sections that contribute to National Hg trends. The following table displays the contributions (t) for the years 1990 to 2016.
| Sector | 1990 | 1991 | 1992 | 1993 | 1994 | 1995 | 1996 | 1997 | 1998 | 1999 | 2000 | 2001 | 2002 | 2003 | 2004 | 2005 | 2006 | 2007 | 2008 | 2009 | 2010 | 2011 | 2012 | 2013 | 2014 | 2015 | 2016 |
|---|---|---|---|---|---|---|---|---|---|---|---|---|---|---|---|---|---|---|---|---|---|---|---|---|---|---|---|
| Sector 1 - Non-Ferrous Mining and Smelting Industry | 24.90383 | 24.86516 | 24.77849 | 10.63323 | 8.259225 | 4.647225 | 5.675582 | 3.391398 | 2.835761717 | 2.27621 | 1.939635 | 2.12455 | 1.75016 | 1.288234 | 1.900836 | 1.701515 | 1.278611 | 1.416764 | 1.008495 | 0.839795 | 0.540576 | 0.210208 | 0.252115 | 0.358514 | 0.285666 | 0.175462 | 0.223825 |
| Sector 2 - Iron and Steel Industries | 0.952516 | 0.974495 | 0.99197 | 1.192215 | 1.057658 | 1.029177 | 1.051612 | 1.106883 | 1.124402953 | 1.137147 | 1.144629 | 1.128299 | 1.211393 | 1.16735 | 0.987886 | 0.793229 | 0.713993 | 0.889639 | 0.515859 | 0.453877 | 0.563821 | 0.578976 | 0.679739 | 0.696461 | 0.724815 | 0.721324 | 0.712892 |
| Sector 3 - Coal (Electric Power Generation) | 1.945885 | 1.837908 | 2.06204 | 1.878636 | 1.940682 | 1.943702 | 2.052417 | 2.191296 | 2.28234493 | 2.296325 | 1.963452 | 2.005671 | 1.98936 | 2.270469 | 2.217719 | 2.049217 | 1.899754 | 2.072875 | 1.50709 | 1.579718 | 1.45155 | 0.913433 | 0.809776 | 0.799617 | 0.665641 | 0.684096 | 0.675422 |
| Sector 4 - Waste Treatment and Disposal | 1.981233 | 1.99201 | 2.141136 | 2.02776 | 2.117954 | 2.395279 | 1.074425 | 0.908837 | 0.74609715 | 0.746375 | 1.1508 | 1.080843 | 0.869627 | 0.556285 | 0.56001 | 0.495597 | 0.504424 | 0.510927 | 0.52425 | 0.463412 | 0.480655 | 0.517867 | 0.520375 | 0.483283 | 0.523388 | 0.496387 | 0.469691 |
| Sector 5 - Other | 5.224099 | 5.314241 | 5.224542 | 5.104068 | 4.924968 | 4.824282 | 4.601002 | 4.336204 | 4.042439414 | 3.787309 | 3.908654 | 3.177063 | 3.057145 | 3.098337 | 2.755234 | 2.471061 | 2.438784 | 2.71105 | 2.94595 | 2.392063 | 2.40909 | 2.335166 | 2.166686 | 2.207541 | 2.164739 | 2.253681 | 2.198942 |
| Source | Sector | 1990 | 2000 | 2005 | 2011 | 2012 | 2013 | 2014 | 2015 | 2016 |
|---|---|---|---|---|---|---|---|---|---|---|
| Ore and Mineral Industries | nil | 27 000 | 3 700 | 2 900 | 1 200 | 1 400 | 1 500 | 1 400 | 1 400 | 1 400 |
| Ore and Mineral Industries | Aluminium Industry | 18 | 31 | 43 | 19 | 15 | 21 | 19 | 21 | 21 |
| Ore and Mineral Industries | Asphalt Paving Industry | 24 | 22 | 22 | 27 | 21 | 20 | 22 | 23 | 23 |
| Ore and Mineral Industries | Cement and Concrete Industry | 460 | 390 | 210 | 300 | 300 | 310 | 300 | 380 | 340 |
| Ore and Mineral Industries | Foundries | 210 | 120 | 4.2 | no emissions (-) | - | - | - | - | - |
| Ore and Mineral Industries | Iron and Steel Industries | 950 | 1 100 | 790 | 580 | 680 | 700 | 720 | 720 | 710 |
| Ore and Mineral Industries | Iron Ore Industry | 60 | 60 | 50 | 100 | 98 | 100 | 74 | 72 | 72 |
| Ore and Mineral Industries | Mineral Products Industry | - | - | - | - | - | - | - | - | - |
| Ore and Mineral Industries | Mining and Rock Quarrying | 12 | 12 | 28 | 3.9 | 5.0 | 8.5 | 20 | 20 | 16 |
| Ore and Mineral Industries | Non-Ferrous Mining and Smelting Industry | 25 000 | 1 900 | 1 700 | 210 | 250 | 360 | 290 | 180 | 220 |
| Oil and Gas Industry | nil | 120 | 61 | 83 | 100 | 100 | 120 | 89 | 74 | 81 |
| Oil and Gas Industry | Downstream Oil and Gas Industry | 110 | 26 | 46 | 46 | 45 | 48 | 46 | 49 | 53 |
| Oil and Gas Industry | Upstream Oil and Gas Industry | 3.0 | 36 | 38 | 59 | 59 | 68 | 44 | 25 | 28 |
| Electric Power Generation (Utilities) | nil | 2 300 | 2 100 | 2 200 | 1 000 | 860 | 850 | 710 | 740 | 720 |
| Electric Power Generation (Utilities) | Coal | 1 900 | 2 000 | 2 000 | 910 | 810 | 800 | 670 | 680 | 680 |
| Electric Power Generation (Utilities) | Diesel | - | - | - | - | - | - | - | - | - |
| Electric Power Generation (Utilities) | Natural Gas | 12 | 22 | 27 | 56 | 23 | 23 | 19 | 26 | 11 |
| Electric Power Generation (Utilities) | Waste Materials | 50 | 96 | 7.1 | 1.7 | 1.5 | 0.64 | 0.80 | 6.0 | 2.2 |
| Electric Power Generation (Utilities) | Other Electric Power Generation | 290 | 62 | 91 | 46 | 23 | 23 | 28 | 26 | 30 |
| Manufacturing | nil | 1 100 | 1 400 | 300 | 110 | 140 | 130 | 120 | 130 | 140 |
| Manufacturing | Abrasives Manufacture | - | - | - | - | - | - | - | - | - |
| Manufacturing | Bakeries | - | - | - | - | - | - | - | - | - |
| Manufacturing | Biofuel Production | - | - | - | - | - | - | - | - | - |
| Manufacturing | Chemicals Industry | 170 | 82 | 58 | 16 | 23 | 17 | 18 | 15 | 17 |
| Manufacturing | Electronics | 380 | 750 | 56 | 17 | 17 | 17 | 17 | 18 | 29 |
| Manufacturing | Food Preparation | 0.14 | 0.14 | 0.3 | - | - | - | - | - | - |
| Manufacturing | Glass Manufacture | 28 | 28 | 21 | - | - | - | - | - | - |
| Manufacturing | Grain Industries | - | - | - | - | - | - | - | - | - |
| Manufacturing | Metal Fabrication | 16 | 17 | 17 | 11 | 11 | 7.5 | <0.01 | <0.01 | 0.0080 |
| Manufacturing | Plastics Manufacture | 0.0050 | 0.0050 | - | - | - | - | - | - | - |
| Manufacturing | Pulp and Paper Industry | 98 | 130 | 59 | 42 | 53 | 50 | 60 | 70 | 71 |
| Manufacturing | Textiles | - | - | - | - | - | - | - | - | - |
| Manufacturing | Vehicle Manufacture (Engines, Parts, Assembly, Painting) | 0.012 | 0.012 | 0.023 | - | - | - | - | - | - |
| Manufacturing | Wood Products | 260 | 190 | 90 | 21 | 31 | 31 | 18 | 18 | 18 |
| Manufacturing | Other Manufacturing Industries | 150 | 180 | 4.0 | 3.8 | 3.4 | 3.4 | 3.4 | 3.4 | 3.4 |
| Transportation and Mobile Equipment | nil | 110 | 100 | 100 | 89 | 89 | 85 | 86 | 81 | 75 |
| Transportation and Mobile Equipment | Air Transportation | - | - | - | - | - | - | - | - | - |
| Transportation and Mobile Equipment | Heavy-duty Diesel Vehicles | <0.01 | <0.01 | <0.01 | <0.01 | <0.01 | <0.01 | <0.01 | <0.01 | <0.01 |
| Transportation and Mobile Equipment | Heavy-duty Gasoline Vehicles | <0.01 | <0.01 | <0.01 | <0.01 | <0.01 | <0.01 | <0.01 | <0.01 | <0.01 |
| Transportation and Mobile Equipment | Heavy-duty LPG/NG Vehicles | <0.01 | <0.01 | <0.01 | <0.01 | <0.01 | <0.01 | <0.01 | <0.01 | <0.01 |
| Transportation and Mobile Equipment | Light-duty Diesel Trucks | <0.01 | <0.01 | <0.01 | <0.01 | <0.01 | <0.01 | <0.01 | <0.01 | <0.01 |
| Transportation and Mobile Equipment | Light-duty Diesel Vehicles | <0.01 | <0.01 | <0.01 | <0.01 | <0.01 | <0.01 | <0.01 | <0.01 | <0.01 |
| Transportation and Mobile Equipment | Light-duty Gasoline Trucks | <0.01 | <0.01 | <0.01 | 0.011 | 0.011 | 0.012 | 0.012 | 0.013 | 0.014 |
| Transportation and Mobile Equipment | Light-duty Gasoline Vehicles | 0.011 | 0.012 | 0.013 | 0.013 | 0.013 | 0.013 | 0.013 | 0.013 | 0.013 |
| Transportation and Mobile Equipment | Light-duty LPG/NG Trucks | <0.01 | <0.01 | <0.01 | <0.01 | <0.01 | <0.01 | <0.01 | <0.01 | <0.01 |
| Transportation and Mobile Equipment | Light-duty LPG/NG Vehicles | <0.01 | <0.01 | <0.01 | <0.01 | <0.01 | <0.01 | <0.01 | <0.01 | <0.01 |
| Transportation and Mobile Equipment | Marine Transportation | 4.3 | 6.2 | 7.2 | 5.7 | 4.8 | 3.9 | 3 | 2.1 | 2.2 |
| Transportation and Mobile Equipment | Motorcycles | <0.01 | <0.01 | <0.01 | <0.01 | <0.01 | <0.01 | <0.01 | <0.01 | <0.01 |
| Transportation and Mobile Equipment | Off-road Diesel Vehicles and Equipment | - | - | - | - | - | - | - | - | - |
| Transportation and Mobile Equipment | Off-road Gasoline/LPG/CNG Vehicles and Equipment | - | - | - | - | - | - | - | - | - |
| Transportation and Mobile Equipment | Rail Transportation | 100 | 98 | 95 | 83 | 84 | 81 | 83 | 79 | 73 |
| Transportation and Mobile Equipment | Tire Wear and Brake Lining | - | - | - | - | - | - | - | - | - |
| Agriculture | nil | 2.8 | 3.4 | 3.2 | 7.4 | 7.5 | 7.8 | 8.3 | 7.3 | 7.0 |
| Agriculture | Animal Production | - | - | - | - | - | - | - | - | - |
| Agriculture | Crop Production | - | - | - | - | - | - | - | - | - |
| Agriculture | Fuel Use | 2.8 | 3.4 | 3.2 | 7.4 | 7.5 | 7.8 | 8.3 | 7.3 | 7.0 |
| Commercial / Residential / Institutional | nil | 1 100 | 600 | 560 | 550 | 540 | 550 | 560 | 550 | 540 |
| Commercial / Residential / Institutional | Cigarette Smoking | 0.21 | 0.18 | 0.14 | 0.13 | 0.13 | 0.11 | 0.11 | 0.097 | 0.098 |
| Commercial / Residential / Institutional | Commercial and Institutional Fuel Combustion | 47 | 62 | 63 | 58 | 57 | 58 | 62 | 57 | 57 |
| Commercial / Residential / Institutional | Commercial Cooking | - | - | - | - | - | - | - | - | - |
| Commercial / Residential / Institutional | Construction Fuel Combustion | 2.6 | 1.7 | 2.6 | 2.2 | 2.2 | 2.2 | 2.1 | 2.2 | 2.2 |
| Commercial / Residential / Institutional | Home Firewood Burning | 54 | 48 | 40 | 41 | 41 | 41 | 40 | 40 | 40 |
| Commercial / Residential / Institutional | Human | 110 | 20 | 15 | 15 | 15 | 15 | 15 | 15 | 15 |
| Commercial / Residential / Institutional | Marine Cargo Handling | - | - | 2.8 | - | - | - | - | - | - |
| Commercial / Residential / Institutional | Residential Fuel Combustion | 64 | 76 | 75 | 77 | 71 | 76 | 80 | 75 | 67 |
| Commercial / Residential / Institutional | Service Stations | - | - | - | - | - | - | - | - | - |
| Commercial / Residential / Institutional | Other Miscellaneous Sources | 870 | 390 | 360 | 360 | 360 | 360 | 360 | 360 | 360 |
| Incineration and Waste | nil | 3 600 | 2 100 | 1 400 | 1 400 | 1 300 | 1 300 | 1 300 | 1 300 | 1 300 |
| Incineration and Waste | Crematoriums | 100 | 140 | 180 | 230 | 230 | 250 | 260 | 280 | 270 |
| Incineration and Waste | Waste Incineration | 1 500 | 810 | 750 | 680 | 570 | 570 | 570 | 570 | 570 |
| Incineration and Waste | Waste Treatment and Disposal | 2 000 | 1 200 | 500 | 520 | 520 | 480 | 520 | 500 | 470 |
| Paints and Solvents | nil | - | - | - | - | - | - | - | - | - |
| Paints and Solvents | Dry Cleaning | - | - | - | - | - | - | - | - | - |
| Paints and Solvents | General Solvent Use | - | - | - | - | - | - | - | - | - |
| Paints and Solvents | Printing | - | - | - | - | - | - | - | - | - |
| Paints and Solvents | Surface Coatings | - | - | - | - | - | - | - | - | - |
| Dust | nil | - | - | - | - | - | - | - | - | - |
| Dust | Coal Transportation | - | - | - | - | - | - | - | - | - |
| Dust | Construction Operations | - | - | - | - | - | - | - | - | - |
| Dust | Mine Tailings | - | - | - | - | - | - | - | - | - |
| Dust | Paved Roads | - | - | - | - | - | - | - | - | - |
| Dust | Unpaved Roads | - | - | - | - | - | - | - | - | - |
| Fires | nil | - | - | - | - | - | - | - | - | - |
| Fires | Prescribed Forest Burning | - | - | - | - | - | - | - | - | - |
| Fires | Structural Fires | - | - | - | - | - | - | - | - | - |
| Grand Total | nil | 35 000 | 10 000 | 7 500 | 4 600 | 4 400 | 4 500 | 4 400 | 4 300 | 4 300 |
Notes:
totals may not add up due to rounding
- denotes no emissions