
Archived: Air Pollutant Emission Inventory report: chapter 2.5
2.5 Carbon Monoxide (CO)
In 2016, approximately 5.8 Mt of CO were released in Canada (Table 2–7). Transportation and mobile equipment accounted for 54% (3.1 Mt) of total emissions, including light-duty gasoline vehicles and trucks at 21% (1.2 Mt) and off-road gasoline/LPG/CNG vehicles and equipment at 21% (1.2 Mt) of total CO emissions. The next-largest contributors are commercial/residential/institutional sources, which in 2016 also accounted for 21% (1.2 Mt) of emissions, mostly due to contributions from home firewood burning. The upstream oil and gas industry and aluminium industry were the largest-emitting industrial sectors, accounting for 9% (533 kt) and 7% (425 kt) of CO, respectively.
Between 1990 and 2016, CO emissions decreased by 54% (6.7 Mt) (Figure 2–5). Of the many sectors that contributed to the overall decrease in emissions, two sectors in particular—light-duty gasoline trucks and vehicles, and off-road gasoline/LPG/CNG vehicles and equipment (spark ignition engines)—had the largest impact on emission reductions. The decreasing emission trend in these sectors is due to increasingly stringent engine and vehicle regulations. Emissions from home firewood burning gradually decreased across the time series, due to improved combustion efficiency in modern fireplace inserts, stoves and fireplaces and to a decrease in the use of wood as heating fuel.
The most significant changes in CO emissions from 1990 to 2016 include:
- transportation and mobile equipment emissions: decrease of 62% (5.1 Mt)
- light-duty gasoline trucks and vehicles: decrease of 71% (3.1 Mt)
- off-road gasoline/LPG/CNG vehicles and equipment: decrease of 53% (1.4 Mt)
- commercial/residential/institutional emissions: decrease of 27% (465 kt)
- home firewood burning: decrease of 28% (465 kt)
- oil and gas industry: increase of 63% (213 kt)
- upstream oil and gas industry: increase of 74% (226 kt)
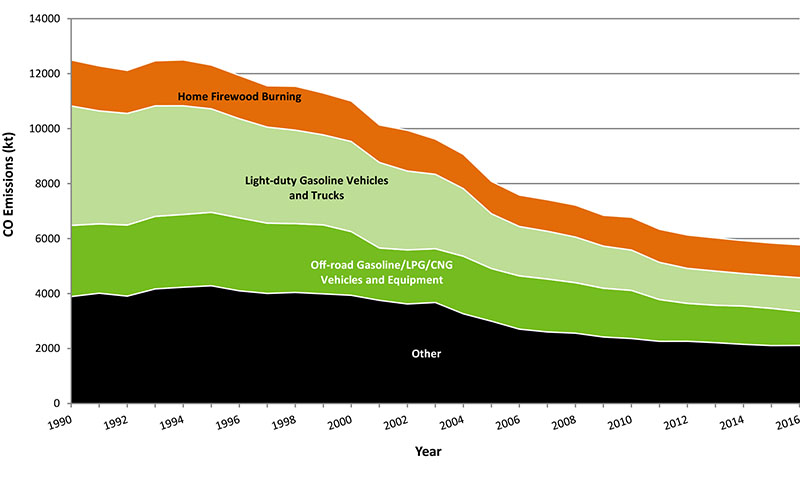
Long description for figure 2-5
Figure 2-5 displays the four major sections that contribute to national CO trends. The following table displays the contributions (kt) for the years 1990 to 2016.
| Sector | 1990 | 1991 | 1992 | 1993 | 1994 | 1995 | 1996 | 1997 | 1998 | 1999 | 2000 | 2001 | 2002 | 2003 | 2004 | 2005 | 2006 | 2007 | 2008 | 2009 | 2010 | 2011 | 2012 | 2013 | 2014 | 2015 | 2016 |
|---|---|---|---|---|---|---|---|---|---|---|---|---|---|---|---|---|---|---|---|---|---|---|---|---|---|---|---|
| Sector 1 - Home Firewood Burning | 1660.391 | 1636.418 | 1564.791 | 1637.871 | 1668.531 | 1593.116 | 1573.783 | 1502.707 | 1596.983 | 1521.836 | 1472.693 | 1364.116 | 1482.731 | 1278.907 | 1247.87 | 1180.001 | 1144.825 | 1146.785 | 1161.166 | 1121.095 | 1193.904 | 1204.24 | 1213.941 | 1206.342 | 1198.201 | 1190.336 | 1195.136 |
| Sector 2 - Light-duty Gasoline Vehicles and Trucks | 4357.824 | 4110.101 | 4061.632 | 4022.685 | 3954.571 | 3765.762 | 3608.165 | 3494.752 | 3400.026 | 3275.542 | 3278.436 | 3112.733 | 2869.44 | 2708.897 | 2460.614 | 1994.193 | 1796.439 | 1738.027 | 1661.633 | 1532.481 | 1467.598 | 1355.072 | 1274.047 | 1245.439 | 1182.249 | 1187.06 | 1229.636 |
| Sector 3 - Off-road Gasoline/LPG/CNG Vehicles and Equipment | 2596.521 | 2524.218 | 2586.723 | 2639.464 | 2647.456 | 2673.153 | 2654.987 | 2557.786 | 2505.675 | 2510.352 | 2317.967 | 1905.467 | 1968.208 | 1957.648 | 2094.891 | 1915.407 | 1938.862 | 1927.111 | 1837.992 | 1775.915 | 1752.116 | 1520.039 | 1379.78 | 1362.257 | 1393.202 | 1355.517 | 1233.253 |
| Sector 4 - Other | 3882.674 | 4011.654 | 3905.721 | 4168.716 | 4230.294 | 4282.63 | 4099.101 | 4003.7 | 4039.898 | 3988.836 | 3935.511 | 3752.912 | 3620.766 | 3674.197 | 3263.054 | 2995.211 | 2704.607 | 2602.509 | 2557.889 | 2419.05 | 2363.658 | 2261.25 | 2262.966 | 2212.799 | 2151.96 | 2106.484 | 2112.032 |
| Source | Sector | 1990 | 2000 | 2005 | 2011 | 2012 | 2013 | 2014 | 2015 | 2016 |
|---|---|---|---|---|---|---|---|---|---|---|
| Ore and Mineral Industries | nil | 390 000 | 400 000 | 500 000 | 540 000 | 550 000 | 550 000 | 510 000 | 510 000 | 560 000 |
| Ore and Mineral Industries | Aluminium Industry | 240 000 | 250 000 | 310 000 | 400 000 | 400 000 | 410 000 | 380 000 | 380 000 | 420 000 |
| Ore and Mineral Industries | Asphalt Paving Industry | 4 200 | 4 200 | 4 500 | 4 600 | 3 800 | 3 700 | 4 000 | 4 000 | 4 000 |
| Ore and Mineral Industries | Cement and Concrete Industry | 16 000 | 23 000 | 27 000 | 16 000 | 18 000 | 15 000 | 12 000 | 11 000 | 14 000 |
| Ore and Mineral Industries | Foundries | 55 000 | 48 000 | 49 000 | 49 000 | 49 000 | 49 000 | 49 000 | 49 000 | 49 000 |
| Ore and Mineral Industries | Iron and Steel Industries | 43 000 | 48 000 | 64 000 | 21 000 | 28 000 | 23 000 | 24 000 | 21 000 | 21 000 |
| Ore and Mineral Industries | Iron Ore Industry | 18 000 | 9 600 | 23 000 | 22 000 | 20 000 | 20 000 | 20 000 | 20 000 | 18 000 |
| Ore and Mineral Industries | Mineral Products Industry | 3 900 | 3 400 | 2 800 | 390 | 380 | 500 | 430 | 450 | 460 |
| Ore and Mineral Industries | Mining and Rock Quarrying | 14 000 | 14 000 | 10 000 | 17 000 | 20 000 | 14 000 | 15 000 | 13 000 | 14 000 |
| Ore and Mineral Industries | Non-Ferrous Mining and Smelting Industry | 280 | 360 | 13 000 | 11 000 | 13 000 | 11 000 | 13 000 | 13 000 | 17 000 |
| Oil and Gas Industry | nil | 340 000 | 440 000 | 490 000 | 530 000 | 540 000 | 570 000 | 560 000 | 570 000 | 550 000 |
| Oil and Gas Industry | Downstream Oil and Gas Industry | 29 000 | 23 000 | 21 000 | 19 000 | 16 000 | 42 000 | 18 000 | 24 000 | 16 000 |
| Oil and Gas Industry | Upstream Oil and Gas Industry | 310 000 | 420 000 | 470 000 | 510 000 | 520 000 | 530 000 | 540 000 | 550 000 | 530 000 |
| Electric Power Generation (Utilities) | nil | 50 000 | 43 000 | 49 000 | 41 000 | 33 000 | 34 000 | 39 000 | 39 000 | 36 000 |
| Electric Power Generation (Utilities) | Coal | 41 000 | 18 000 | 25 000 | 13 000 | 9 500 | 13 000 | 15 000 | 16 000 | 16 000 |
| Electric Power Generation (Utilities) | Diesel | 360 | 1 200 | 740 | 1 200 | 1 100 | 1 100 | 1 300 | 1 500 | 1 300 |
| Electric Power Generation (Utilities) | Natural Gas | 4 400 | 17 000 | 15 000 | 19 000 | 17 000 | 15 000 | 14 000 | 14 000 | 11 000 |
| Electric Power Generation (Utilities) | Waste Materials | 82 | 400 | 210 | 380 | 320 | 180 | 340 | 230 | 280 |
| Electric Power Generation (Utilities) | Other Electric Power Generation | 4 400 | 7 200 | 7 800 | 7 900 | 5 400 | 4 600 | 7 800 | 7 200 | 7 800 |
| Manufacturing | nil | 1 300 000 | 1 100 000 | 530 000 | 170 000 | 180 000 | 180 000 | 160 000 | 140 000 | 130 000 |
| Manufacturing | Abrasives Manufacture | 610 | 240 | 240 | no emissions (-) | - | - | - | - | - |
| Manufacturing | Bakeries | 5.9 | 5.8 | 1.2 | 0.20 | 0.17 | 0.35 | 0.34 | 0.3 | 0.3 |
| Manufacturing | Biofuel Production | - | - | - | - | - | - | - | - | - |
| Manufacturing | Chemicals Industry | 27 000 | 30 000 | 18 000 | 14 000 | 13 000 | 14 000 | 14 000 | 15 000 | 16 000 |
| Manufacturing | Electronics | 27 | 40 | 18 | - | - | - | - | - | - |
| Manufacturing | Food Preparation | 1 200 | 1 400 | 1 500 | 990 | 1 000 | 1 000 | 980 | 1 200 | 1 200 |
| Manufacturing | Glass Manufacture | 490 | 570 | 690 | 240 | 260 | 260 | 280 | 300 | 280 |
| Manufacturing | Grain Industries | 1 900 | 2 700 | 610 | 390 | 390 | 370 | 390 | 370 | 390 |
| Manufacturing | Metal Fabrication | 8 800 | 8 700 | 7 700 | 2 800 | 3 200 | 2 500 | 1 900 | 1 200 | 1 100 |
| Manufacturing | Plastics Manufacture | 220 | 350 | 250 | 8.5 | 12 | 0.42 | 10 | 9.3 | 10 |
| Manufacturing | Pulp and Paper Industry | 180 000 | 150 000 | 93 000 | 77 000 | 48 000 | 57 000 | 64 000 | 68 000 | 72 000 |
| Manufacturing | Textiles | 45 | 78 | 53 | 0.027 | 0.023 | 0.057 | 0.063 | 0.069 | 0.071 |
| Manufacturing | Vehicle Manufacture (Engines, Parts, Assembly, Painting) | 3 800 | 4 000 | 3 000 | 2 300 | 1 400 | 910 | 930 | 770 | 940 |
| Manufacturing | Wood Products | 1 100 000 | 800 000 | 390 000 | 73 000 | 110 000 | 100 000 | 73 000 | 48 000 | 40 000 |
| Manufacturing | Other Manufacturing Industries | 31 000 | 61 000 | 11 000 | 710 | 620 | 610 | 580 | 580 | 630 |
| Transportation and Mobile Equipment | nil | 8 200 000 | 7 400 000 | 5 200 000 | 3 700 000 | 3 500 000 | 3 400 000 | 3 300 000 | 3 200 000 | 3 100 000 |
| Transportation and Mobile Equipment | Air Transportation | 60 000 | 47 000 | 43 000 | 41 000 | 51 000 | 49 000 | 46 000 | 49 000 | 50 000 |
| Transportation and Mobile Equipment | Heavy-duty Diesel Vehicles | 34 000 | 63 000 | 92 000 | 83 000 | 78 000 | 76 000 | 71 000 | 65 000 | 63 000 |
| Transportation and Mobile Equipment | Heavy-duty Gasoline Vehicles | 570 000 | 1 100 000 | 830 000 | 510 000 | 500 000 | 490 000 | 400 000 | 370 000 | 400 000 |
| Transportation and Mobile Equipment | Heavy-duty LPG/NG Vehicles | 130 000 | 310 000 | 67 000 | 4 600 | 2 500 | 1 300 | 630 | 640 | 860 |
| Transportation and Mobile Equipment | Light-duty Diesel Trucks | 13 000 | 14 000 | 18 000 | 13 000 | 11 000 | 11 000 | 13 000 | 15 000 | 17 000 |
| Transportation and Mobile Equipment | Light-duty Diesel Vehicles | 29 000 | 18 000 | 9 300 | 9 000 | 8 600 | 8 800 | 8 800 | 9 300 | 8 600 |
| Transportation and Mobile Equipment | Light-duty Gasoline Trucks | 1 500 000 | 1 600 000 | 1 000 000 | 740 000 | 700 000 | 690 000 | 670 000 | 680 000 | 720 000 |
| Transportation and Mobile Equipment | Light-duty Gasoline Vehicles | 2 800 000 | 1 700 000 | 940 000 | 610 000 | 570 000 | 550 000 | 520 000 | 510 000 | 510 000 |
| Transportation and Mobile Equipment | Light-duty LPG/NG Trucks | 14 000 | 6 000 | 2 300 | 49 | 24 | 10 | 7.8 | 7.4 | 9.3 |
| Transportation and Mobile Equipment | Light-duty LPG/NG Vehicles | 140 000 | 54 000 | 24 000 | 1 100 | 700 | 370 | 270 | 250 | 270 |
| Transportation and Mobile Equipment | Marine Transportation | 13 000 | 17 000 | 19 000 | 20 000 | 20 000 | 21 000 | 22 000 | 21 000 | 21 000 |
| Transportation and Mobile Equipment | Motorcycles | 12 000 | 14 000 | 15 000 | 14 000 | 13 000 | 13 000 | 12 000 | 13 000 | 13 000 |
| Transportation and Mobile Equipment | Off-road Diesel Vehicles and Equipment | 220 000 | 240 000 | 170 000 | 130 000 | 110 000 | 100 000 | 93 000 | 88 000 | 67 000 |
| Transportation and Mobile Equipment | Off-road Gasoline/LPG/CNG Vehicles and Equipment | 2 600 000 | 2 300 000 | 1 900 000 | 1 500 000 | 1 400 000 | 1 400 000 | 1 400 000 | 1 400 000 | 1 200 000 |
| Transportation and Mobile Equipment | Rail Transportation | 16 000 | 15 000 | 15 000 | 18 000 | 18 000 | 17 000 | 18 000 | 17 000 | 16 000 |
| Transportation and Mobile Equipment | Tire Wear and Brake Lining | - | - | - | - | - | - | - | - | - |
| Agriculture | nil | 630 | 690 | 520 | 880 | 920 | 930 | 950 | 910 | 910 |
| Agriculture | Animal Production | - | - | - | - | - | - | - | - | - |
| Agriculture | Crop Production | - | - | - | - | - | - | - | - | - |
| Agriculture | Fuel Use | 630 | 690 | 520 | 880 | 920 | 930 | 950 | 910 | 910 |
| Commercial / Residential / Institutional | nil | 1 700 000 | 1 500 000 | 1 200 000 | 1 200 000 | 1 300 000 | 1 200 000 | 1 200 000 | 1 200 000 | 1 200 000 |
| Commercial / Residential / Institutional | Cigarette Smoking | 3 800 | 3 300 | 2 500 | 2 300 | 2 300 | 1 900 | 2 000 | 1 700 | 1 800 |
| Commercial / Residential / Institutional | Commercial and Institutional Fuel Combustion | 15 000 | 19 000 | 19 000 | 19 000 | 17 000 | 18 000 | 20 000 | 19 000 | 19 000 |
| Commercial / Residential / Institutional | Commercial Cooking | 5 700 | 6 400 | 7 100 | 6 900 | 7 000 | 6 900 | 6 700 | 6 300 | 6 300 |
| Commercial / Residential / Institutional | Construction Fuel Combustion | 670 | 360 | 520 | 560 | 600 | 540 | 520 | 520 | 540 |
| Commercial / Residential / Institutional | Home Firewood Burning | 1 700 000 | 1 500 000 | 1 200 000 | 1 200 000 | 1 200 000 | 1 200 000 | 1 200 000 | 1 200 000 | 1 200 000 |
| Commercial / Residential / Institutional | Human | - | - | - | - | - | - | - | - | - |
| Commercial / Residential / Institutional | Marine Cargo Handling | 0.16 | 0.05 | - | - | - | - | - | - | - |
| Commercial / Residential / Institutional | Residential Fuel Combustion | 13 000 | 13 000 | 13 000 | 13 000 | 12 000 | 13 000 | 13 000 | 13 000 | 11 000 |
| Commercial / Residential / Institutional | Service Stations | - | - | - | - | - | - | - | - | - |
| Commercial / Residential / Institutional | Other Miscellaneous Sources | - | - | - | - | - | - | - | - | - |
| Incineration and Waste | nil | 46 000 | 27 000 | 25 000 | 19 000 | 18 000 | 19 000 | 19 000 | 19 000 | 19 000 |
| Incineration and Waste | Crematoriums | 7.4 | 11 | 13 | 15 | 16 | 17 | 18 | 18 | 18 |
| Incineration and Waste | Waste Incineration | 42 000 | 24 000 | 22 000 | 16 000 | 15 000 | 15 000 | 15 000 | 16 000 | 16 000 |
| Incineration and Waste | Waste Treatment and Disposal | 3 500 | 3 100 | 2 900 | 2 900 | 3 000 | 3 400 | 3 300 | 3 300 | 3 000 |
| Paints and Solvents | nil | 23 | 73 | 21 | 0.48 | - | 0.47 | 0.46 | 0.37 | 0.33 |
| Paints and Solvents | Dry Cleaning | 0.95 | 0.81 | - | - | - | - | - | - | - |
| Paints and Solvents | General Solvent Use | - | - | - | - | - | - | - | - | - |
| Paints and Solvents | Printing | 22 | 72 | 21 | 0.48 | - | 0.47 | 0.46 | 0.37 | 0.33 |
| Paints and Solvents | Surface Coatings | 0.10 | 0.10 | - | - | - | - | - | - | - |
| Dust | nil | - | - | - | - | - | - | - | - | - |
| Dust | Coal Transportation | - | - | - | - | - | - | - | - | - |
| Dust | Construction Operations | - | - | - | - | - | - | - | - | - |
| Dust | Mine Tailings | - | - | - | - | - | - | - | - | - |
| Dust | Paved Roads | - | - | - | - | - | - | - | - | - |
| Dust | Unpaved Roads | - | - | - | - | - | - | - | - | - |
| Fires | nil | 440 000 | 78 000 | 52 000 | 73 000 | 92 000 | 35 000 | 140 000 | 130 000 | 120 000 |
| Fires | Prescribed Forest Burning | 440 000 | 76 000 | 51 000 | 71 000 | 90 000 | 33 000 | 140 000 | 130 000 | 120 000 |
| Fires | Structural Fires | 2 100 | 1 700 | 1 500 | 1 700 | 1 700 | 1 700 | 1 200 | 1 100 | 1 100 |
| Grand Total | nil | 12 000 000 | 11 000 000 | 8 100 000 | 6 300 000 | 6 100 000 | 6 000 000 | 5 900 000 | 5 800 000 | 5 800 000 |
Notes:
totals may not add up due to rounding
- denotes no emissions